Diagnostic accuracy of dermoscopy - Dermatology
Diagnostic accuracy of dermoscopy - Dermatology
Diagnostic accuracy of dermoscopy - Dermatology

You also want an ePaper? Increase the reach of your titles
YUMPU automatically turns print PDFs into web optimized ePapers that Google loves.
<strong>dermoscopy</strong> was significantly higher than that achieved<br />
without <strong>dermoscopy</strong> (4.0 [95% CI 3.0 to 5.1] versus 2.7 [1.9<br />
to 3.4]), resulting in a mean difference <strong>of</strong> 1.3 (0.7 to 2.0), or<br />
an improvement <strong>of</strong> 49% (p = 0.001).<br />
The second model included the results <strong>of</strong> all 27 eligible<br />
studies and yielded similar results. The mean log odds ratio<br />
achieved with <strong>dermoscopy</strong> was again significantly higher<br />
than that achieved without <strong>dermoscopy</strong> (3.4 [2.9 to 3.9]<br />
versus 2.5 [1.9 to 3.1], p = 0.03). Inclusion <strong>of</strong> information<br />
on the experience <strong>of</strong> the examiners showed that the<br />
diagnostic performance <strong>of</strong> <strong>dermoscopy</strong> was significantly<br />
better for experts than for non-experts (mean log odds ratio<br />
3.8 [3.3 to 4.3] versus 2.0 [1.4 to 2.6]; mean difference 1.8<br />
[0.8 to 2.7], p = 0.001). To account for this finding, we<br />
generated a model that compared the performance <strong>of</strong> the<br />
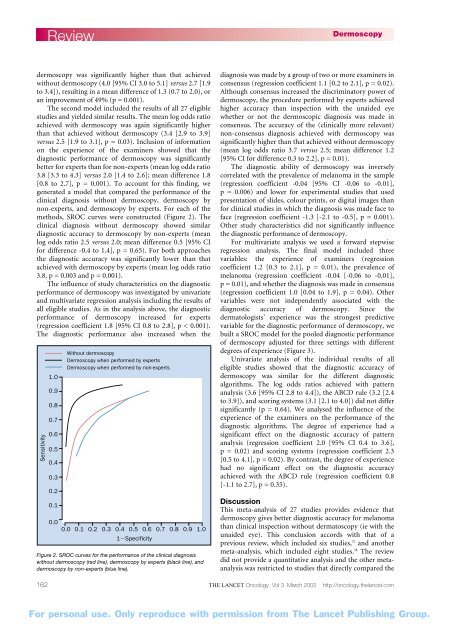
clinical diagnosis without <strong>dermoscopy</strong>, <strong>dermoscopy</strong> by<br />
non-experts, and <strong>dermoscopy</strong> by experts. For each <strong>of</strong> the<br />
methods, SROC curves were constructed (Figure 2). The<br />
clinical diagnosis without <strong>dermoscopy</strong> showed similar<br />
diagnostic <strong>accuracy</strong> to <strong>dermoscopy</strong> by non-experts (mean<br />
log odds ratio 2.5 versus 2.0; mean difference 0.5 [95% CI<br />
for difference -0.4 to 1.4], p = 0.65). For both approaches<br />
the diagnostic <strong>accuracy</strong> was significantly lower than that<br />
achieved with <strong>dermoscopy</strong> by experts (mean log odds ratio<br />
3.8, p = 0.003 and p = 0.001).<br />
The influence <strong>of</strong> study characteristics on the diagnostic<br />
performance <strong>of</strong> <strong>dermoscopy</strong> was investigated by univariate<br />
and multivariate regression analysis including the results <strong>of</strong><br />
all eligible studies. As in the analysis above, the diagnostic<br />
performance <strong>of</strong> <strong>dermoscopy</strong> increased for experts<br />
(regression coefficient 1.8 [95% CI 0.8 to 2.8], p < 0.001).<br />
The diagnostic performance also increased when the<br />
Sensitivity<br />
162<br />
Review<br />
1.0<br />
0.9<br />
0.8<br />
0.7<br />
0.6<br />
0.5<br />
0.4<br />
0.3<br />
0.2<br />
0.1<br />
0.0<br />
Without <strong>dermoscopy</strong><br />
Dermoscopy when performed by experts<br />
Dermoscopy when performed by non-experts<br />
0.0 0.1 0.2 0.3 0.4 0.5 0.6 0.7 0.8 0.9 1.0<br />
1Specificity<br />
Figure 2. SROC curves for the performance <strong>of</strong> the clinical diagnosis<br />
without <strong>dermoscopy</strong> (red line), <strong>dermoscopy</strong> by experts (black line), and<br />
<strong>dermoscopy</strong> by non-experts (blue line).<br />
Dermoscopy<br />
diagnosis was made by a group <strong>of</strong> two or more examiners in<br />
consensus (regression coefficient 1.1 [0.2 to 2.1], p = 0.02).<br />
Although consensus increased the discriminatory power <strong>of</strong><br />
<strong>dermoscopy</strong>, the procedure performed by experts achieved<br />
higher <strong>accuracy</strong> than inspection with the unaided eye<br />
whether or not the dermoscopic diagnosis was made in<br />
consensus. The <strong>accuracy</strong> <strong>of</strong> the (clinically more relevant)<br />
non-consensus diagnosis achieved with <strong>dermoscopy</strong> was<br />
significantly higher than that achieved without <strong>dermoscopy</strong><br />
(mean log odds ratio 3.7 versus 2.5; mean difference 1.2<br />
[95% CI for difference 0.3 to 2.2], p = 0.01).<br />
The diagnostic ability <strong>of</strong> <strong>dermoscopy</strong> was inversely<br />
correlated with the prevalence <strong>of</strong> melanoma in the sample<br />
(regression coefficient -0.04 [95% CI -0.06 to -0.01],<br />
p = 0.006) and lower for experimental studies that used<br />
presentation <strong>of</strong> slides, colour prints, or digital images than<br />
for clinical studies in which the diagnosis was made face to<br />
face (regression coefficient -1.3 [-2.1 to -0.5], p = 0.001).<br />
Other study characteristics did not significantly influence<br />
the diagnostic performance <strong>of</strong> <strong>dermoscopy</strong>.<br />
For multivariate analysis we used a forward stepwise<br />
regression analysis. The final model included three<br />
variables: the experience <strong>of</strong> examiners (regression<br />
coefficient 1.2 [0.3 to 2.1], p = 0.01), the prevalence <strong>of</strong><br />
melanoma (regression coefficient -0.04 [-0.06 to -0.01],<br />
p = 0.01), and whether the diagnosis was made in consensus<br />
(regression coefficient 1.0 [0.04 to 1.9], p = 0.04). Other<br />
variables were not independently associated with the<br />
diagnostic <strong>accuracy</strong> <strong>of</strong> <strong>dermoscopy</strong>. Since the<br />
dermatologists’ experience was the strongest predictive<br />
variable for the diagnostic performance <strong>of</strong> <strong>dermoscopy</strong>, we<br />
built a SROC model for the pooled diagnostic performance<br />
<strong>of</strong> <strong>dermoscopy</strong> adjusted for three settings with different<br />
degrees <strong>of</strong> experience (Figure 3).<br />
Univariate analysis <strong>of</strong> the individual results <strong>of</strong> all<br />
eligible studies showed that the diagnostic <strong>accuracy</strong> <strong>of</strong><br />
<strong>dermoscopy</strong> was similar for the different diagnostic<br />
algorithms. The log odds ratios achieved with pattern<br />
analysis (3.6 [95% CI 2.8 to 4.4]), the ABCD rule (3.2 [2.4<br />
to 3.9]), and scoring systems (3.1 [2.1 to 4.0]) did not differ<br />
significantly (p = 0.64). We analysed the influence <strong>of</strong> the<br />
experience <strong>of</strong> the examiners on the performance <strong>of</strong> the<br />
diagnostic algorithms. The degree <strong>of</strong> experience had a<br />
significant effect on the diagnostic <strong>accuracy</strong> <strong>of</strong> pattern<br />
analysis (regression coefficient 2.0 [95% CI 0.4 to 3.6],<br />
p = 0.02) and scoring systems (regression coefficient 2.3<br />
[0.5 to 4.1], p = 0.02). By contrast, the degree <strong>of</strong> experience<br />
had no significant effect on the diagnostic <strong>accuracy</strong><br />
achieved with the ABCD rule (regression coefficient 0.8<br />
[-1.1 to 2.7], p = 0.35).<br />
Discussion<br />
This meta-analysis <strong>of</strong> 27 studies provides evidence that<br />
<strong>dermoscopy</strong> gives better diagnostic <strong>accuracy</strong> for melanoma<br />
than clinical inspection without dermatoscopy (ie with the<br />
unaided eye). This conclusion accords with that <strong>of</strong> a<br />
previous review, which included six studies, 37 and another<br />
meta-analysis, which included eight studies. 38 The review<br />
did not provide a quantitative analysis and the other metaanalysis<br />
was restricted to studies that directly compared the<br />
THE LANCET Oncology Vol 3 March 2002 http://oncology.thelancet.com<br />
For personal use. Only reproduce with permission from The Lancet Publishing Group.