internationalisation in science in the prism of bibliometric indicators
internationalisation in science in the prism of bibliometric indicators
internationalisation in science in the prism of bibliometric indicators

You also want an ePaper? Increase the reach of your titles
YUMPU automatically turns print PDFs into web optimized ePapers that Google loves.
DNK<br />
NZL FIN<br />
Phys20<br />
Eng10<br />
Life70<br />
ISL<br />
Phys40<br />
ARG SLQ<br />
ARG<br />
IRL<br />
ISR<br />
BEL T UR<br />
CAN<br />
NOR NOR<br />
ISL NLD ZAF USA<br />
ZAF BEL AUT ISR<br />
DNK SWE AUT<br />
GBR<br />
NLD AUS CAN<br />
GBR USA<br />
AUS FIN T UR<br />
NZL<br />
SWE<br />
IRL<br />
Eng20<br />
Life60<br />
JPN<br />
JPN<br />
MEX BRA DEU<br />
DEU<br />
ESP<br />
FRA<br />
ESP<br />
CHE FRA<br />
CHEBRA<br />
IT A<br />
IT A<br />
Phys30<br />
MEX<br />
HUN<br />
HUN<br />
GRC<br />
Eng30<br />
Life50<br />
o<strong>the</strong>rs-1991-93 <br />
oecd-1991-93 <br />
eu15-1991-93 <br />
o<strong>the</strong>rs-1998-00 <br />
oecd-1998-00 <br />
eu15-1998-00 <br />
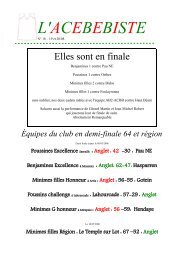
Fig.5. Discipl<strong>in</strong>ary balance (1998-2000) vs. (1991-1993) – percentages<br />
ISI data, process<strong>in</strong>g OST and INRA<br />
This triangular diagram shows <strong>the</strong> shares <strong>of</strong> <strong>the</strong> three discipl<strong>in</strong>ary groups (by<br />
country) summ<strong>in</strong>g at 100% as a result <strong>of</strong> fractional count<strong>in</strong>g. Each country is<br />
represented at two periods. OECD countries and a few selected o<strong>the</strong>rs are<br />
shown. For legibility, only <strong>the</strong> bottom <strong>of</strong> <strong>the</strong> diagram is represented. With<strong>in</strong><br />
<strong>the</strong> diagram two clusters appear: ma<strong>in</strong>stream <strong>in</strong> <strong>the</strong> lower triangle, with Nordic<br />
and Anglo-American countries, biology-oriented; and large European and Lat<strong>in</strong><br />
America countries <strong>in</strong> <strong>the</strong> upper triangle: Life 55%, Physics 35%, Eng<strong>in</strong>eer<strong>in</strong>g<br />
10%. Some movements are noted but <strong>the</strong> clusters rema<strong>in</strong> stable. Outsiders (not<br />
shown): on <strong>the</strong> upper right <strong>of</strong> <strong>the</strong> diagram (much less than 50% <strong>in</strong> Life<br />
<strong>science</strong>s) , some countries <strong>of</strong> Eastern tradition keep <strong>the</strong> strong traditional<br />
<strong>in</strong>volvement <strong>in</strong> physical <strong>science</strong>s, between 50 and 70% and <strong>of</strong>ten less than 20%<br />
<strong>in</strong> Life Sciences (Poland, Russia, Ukra<strong>in</strong>e, Ch<strong>in</strong>a); Korea and Taiwan, remote<br />
outsiders, have exceptionally high <strong>in</strong>volvement <strong>in</strong> Eng<strong>in</strong>eer<strong>in</strong>g, between 20-30%<br />
and less than 35% <strong>in</strong> Life Sciences.<br />
This relative stability is confirmed by quantitative measures. Two<br />
<strong>in</strong>dicators both based on discrepancies <strong>of</strong> country pr<strong>of</strong>iles to <strong>the</strong> world<br />
pr<strong>of</strong>ile were calculated: standard deviation on normalised activity<br />
<strong>in</strong>dexes (revealed advantage <strong>in</strong>dexes); quadratic distance to <strong>the</strong> average<br />
pr<strong>of</strong>ile. Both were considered with and without country weights. Two<br />
discipl<strong>in</strong>ary breakdown were used, <strong>the</strong> above-mentioned three groups<br />
(D3), and <strong>the</strong> 8 academic discipl<strong>in</strong>es (D8). The eight measures were<br />
calculated for each year.<br />
At <strong>the</strong> world level, no trend for homogeneity appears on <strong>the</strong> eight<br />
criteria, except moderately for variance <strong>in</strong> D8. All weighted <strong>in</strong>dexes<br />
(activity <strong>in</strong>dexes and <strong>in</strong>ertia) revealed a slight divergence. On <strong>the</strong><br />
perimeters <strong>in</strong>clud<strong>in</strong>g major countries (OECD, OECD+), convergence is<br />
noted on non-weighted <strong>in</strong>dexes and divergence on weighted <strong>in</strong>dexes, which<br />
suggests that important actors do not get closer. In contrast, <strong>the</strong> EU15<br />
perimeter records a convergence on all measures, except weighted