Strategic Satisfaction - George Mason University
Strategic Satisfaction - George Mason University
Strategic Satisfaction - George Mason University

You also want an ePaper? Increase the reach of your titles
YUMPU automatically turns print PDFs into web optimized ePapers that Google loves.
Meeting the Needs of Virginia’s<br />
Motorists:<br />
Recommendations for Improving Customer<br />
<strong>Satisfaction</strong> with VDOT<br />
Prepared for:<br />
Virginia Department of Transportation<br />
Quality Assurance & <strong>Strategic</strong> Management Division<br />
Prepared by:<br />
<strong>George</strong> <strong>Mason</strong> <strong>University</strong>’s Transportation Policy, Operations and Logistics Program<br />
Spring 2002 Practicum Team
May 2002<br />
2
Acknowledgements<br />
The authors would like to acknowledge the following individuals for their valuable input into the<br />
development of this report.<br />
Red Team Reviewers:<br />
Ms. Julie Brown, Virginia Department of Transportation, Central Office<br />
Mr. Mark Maggio, <strong>George</strong> <strong>Mason</strong> <strong>University</strong><br />
Mr. Alan E. Pisarski, Consultant<br />
Dr. Laurie Schintler, <strong>George</strong> <strong>Mason</strong> <strong>University</strong><br />
Mr. Craig Williams, American Association of Airport Executives<br />
Private Sector:<br />
Mr. Bob Benke, Community Resource Partnership, Inc.<br />
Mr. Dan Doran, AECOM Consulting Transportation Group<br />
Ms. Claire Felbinger, Department of Public Administration, American <strong>University</strong><br />
Mr. Burkhard E. Horn, Visiting Professor for Global Logistics International <strong>University</strong> of Japan<br />
Mr. William Seymour, Gresham, Smith and Partners<br />
Ms. Cinde Weatherby-Gilliland, USR Corporation<br />
Other State and Federal Agencies:<br />
Ms. Angela Andrews, Virginia Transportation Research Council<br />
Ms. Shannon Beaudin-Klein, Minnesota Department of Transportation<br />
Mr. Marc S. Clark, Kentucky Transportation Cabinet<br />
Mr. Dave Erken, Minnesota Department of Transportation<br />
Mr. Tucker Ferguson, Pennsylvania Department of Transportation<br />
Mr. Dave Huft, South Dakota Department of Transportation<br />
Mr. Paul Imhoff, Missouri Department of Transportation<br />
Ms. Kathy Neil, Florida Department of Transportation<br />
Ms. Karla Rains, Minnesota Department of Transportation<br />
Mr. Joseph Robinson, Pennsylvania Department of Transportation<br />
Ms. Connie Yew, Federal Highway Administration<br />
Virginia Department of Transportation:<br />
Ms. Donna Anderson, Central Office<br />
Mr. Perry Cogburn, Central Office<br />
Ms. Tammy Thomas, Central Office<br />
Mr. Larry Trachy, Central Office<br />
Ms. Cynthia Ward, Central Office<br />
Mr. Michael Boling, Bristol District<br />
Ms. Donna Morrison, Bristol District<br />
Mr. Steve Mullins, Bristol District<br />
Mr. Chuck Ring, Bristol District<br />
Mr. Dave Rush, Central Office<br />
Ms. Brenda Waters, Bristol District<br />
Mr. Jamie Glass, Culpeper District<br />
Mr. Jim Jennings, Culpeper District<br />
Mr. Bob Moore, Culpeper District<br />
Ms. Susan Rackley, NOVA District<br />
Ms. Donna Voit, Richmond District<br />
i
Table of Contents<br />
DISCLAIMER.............................................................................................................................. V<br />
PREFACE....................................................................................................................................VI<br />
EXECUTIVE SUMMARY ...................................................................................................... VII<br />
INTRODUCTION......................................................................................................................... 1<br />
VDOT BACKGROUND ................................................................................................................. 1<br />
CUSTOMER SATISFACTION MOVEMENT ....................................................................................... 2<br />
BEST PRACTICES.......................................................................................................................... 2<br />
LITERATURE REVIEW................................................................................................................... 3<br />
METHODOLOGY ........................................................................................................................... 4<br />
SWOT FILTER PROCESS ......................................................................................................... 5<br />
STRONG CUSTOMER SATISFACTION AREAS ................................................................................. 6<br />
Safety....................................................................................................................................... 6<br />
Work Zone Safety .................................................................................................................. 12<br />
WEAK CUSTOMER SATISFACTION AREAS .................................................................................. 19<br />
Emergency Information ........................................................................................................ 19<br />
Maintenance Response.......................................................................................................... 24<br />
INCORPORATING CUSTOMER SATISFACTION INTO STRATEGIC PLANNING .. 31<br />
VDOT’S 2002-2004 STRATEGIC PLAN...................................................................................... 31<br />
A CRITICAL FIRST STEP............................................................................................................. 32<br />
EMPLOYEE EDUCATION AND EMPOWERMENT............................................................................ 33<br />
CONCLUSIONS ......................................................................................................................... 35<br />
APPENDIX A - VIRGINIA DEPARTMENT OF TRANSPORTATION’S NINE<br />
DISTRICTS AND ORGANIZATIONAL STRUCTURE..................................................... A-1<br />
APPENDIX B - SATISFACTION ASSESSMENT ............................................................... B-1<br />
APPENDIX C - VIRGINIA DEPARTMENT OF TRANSPORTATION CUSTOMER<br />
SERVICE INITIATIVES......................................................................................................... C-1<br />
COMMUNICATING CUSTOMER SERVICE VALUES TO EMPLOYEES ............................................ C-1<br />
ORGANIZATIONAL TRAINING AND DEVELOPMENT PROGRAMS................................................ C-2<br />
Coaches Program: Leadership Training & Development Program (LTDP).................... C-2<br />
Learning Partnership Program .......................................................................................... C-3<br />
APPENDIX D - NATIONAL AND VIRGINIA SURVEY COMPARISONS................... D-1<br />
Comparing the 2000 National and 2001 VA Surveys ......................................................... D-1<br />
Overall level of <strong>Satisfaction</strong>................................................................................................ D-1<br />
<strong>Satisfaction</strong> of Eight Characteristics .................................................................................. D-2<br />
ii
APPENDIX E - FATALITY RATES BY ROAD FUNCTION .......................................... E-1<br />
APPENDIX F - VIRGINIA DEPARTMENT OF TRANSPORTATION’S WEB PAGE F-1<br />
Highway Helpline Condition Report ...................................................................................F-1<br />
APPENDIX G - REFERENCES ...........................................................................................G-1<br />
APPENDIX H - ABOUT THE AUTHORS..........................................................................H-1<br />
iii
List of Tables<br />
Table 1 - Public Road Length – 1998 .............................................................................................1<br />
Table 2 – Safety Features of Major Highways, VA 2001............................................................... 6<br />
Table 3 - Virginia and US Comparisons of Characteristics, US..................................................... 7<br />
Table 4 - Statewide Fatality Rates for All Roads ........................................................................... 8<br />
Table 5 – Training Survey ............................................................................................................ 13<br />
List of Figures<br />
Figure 1 - Map of Crash Sites....................................................................................................... 11<br />
Figure 2 - Work Zone Features of Major Highways, VA 2001.................................................... 12<br />
Figure 3 - Work Zone Crashes/Injuries on VA State Maintained Roadways from 1994 – 2001. 14<br />
Figure 4 - Safety Features of Major Highways, VA 2001............................................................ 20<br />
Figure 5 - Maintenance Response Time Features of Major Highways, VA 2001........................ 24<br />
Figure 6 - Roadside Maintenance, Secondary Roads, VA 2001................................................... 25<br />
Figure 7 - Improving the Role of the <strong>Strategic</strong> Plan in the Organization..................................... 32<br />
iv
Disclaimer<br />
The contents of this report reflect the views of the authors and do not necessarily represent those<br />
of Virginia Department of Transportation or <strong>George</strong> <strong>Mason</strong> <strong>University</strong>. The report does not<br />
constitute a standard, specification, or regulation.<br />
v
Preface<br />
“Customer service is a key to keeping the travel economy improving.”<br />
Secretary of Transportation, Norman Mineta<br />
Today’s transportation professionals are confronted by a myriad of new challenges. Their main<br />
focus is no longer concrete, asphalt and steel. Today’s transportation professionals are<br />
challenged with the many complexities found in various industries of transportation as they look<br />
for new ways to deal with key issues that affect personal mobility, safety and equity. In order to<br />
improve as well as keep the transportation system moving forward, transportation professionals<br />
must include customers in the process.<br />
Collectively, practicum students in the Transportation Policy, Operations and Logistics (TPOL)<br />
program at <strong>George</strong> <strong>Mason</strong> <strong>University</strong> analyzed the Virginia Department of Transportation<br />
(VDOT) 2001 Customer <strong>Satisfaction</strong> Survey to determine what measures, if any, VDOT could<br />
implement to improve customer satisfaction.<br />
Already working in the field of transportation, we represent a diverse and wide range of<br />
transportation sectors including federal and state departments of transportation, the private<br />
sector, and defense logistics. Many students have prior training in engineering, transportation<br />
planning, and with intelligent transportation systems.<br />
The TPOL Master’s program at <strong>George</strong> <strong>Mason</strong> <strong>University</strong> started in the Fall of 2000 in response<br />
to the need to educate a “new” kind of transportation professional. Courses are offered at<br />
<strong>George</strong> <strong>Mason</strong>’s Arlington, Virginia campus and are provided through the distance-learning<br />
program to students located in Richmond and Abingdon, Virginia. The program is diverse and<br />
challenging, allowing students to focus on various significant transportation elements and<br />
systems.<br />
The TPOL Practicum students would like to thank Dr. Jonathan L. Gifford, Director of the TPOL<br />
program at <strong>George</strong> <strong>Mason</strong> <strong>University</strong>, for being an instrumental force in implementing this<br />
program and for providing guidance and valuable suggestions to the final product of this report.<br />
vi<br />
TPOL Practicum Team<br />
Spring 2002<br />
<strong>George</strong> <strong>Mason</strong> <strong>University</strong>
Executive Summary<br />
In January 2002, the GMU TPOL project team evaluated VDOT’s customer satisfaction ratings<br />
with the goal of formulating recommendations for its improvement. The sponsor of this project,<br />
VDOT’s Quality Assurance and <strong>Strategic</strong> Management Division, encouraged the utilization of<br />
innovative approaches that are mindful of the current fiscal atmosphere.<br />
Current VDOT customer satisfaction initiatives were investigated to provide the basis for further<br />
analysis. This included:<br />
• VDOT’s customer satisfaction survey questionnaires, results and reports<br />
• Virginia Department of Transportation STRATEGIC PLAN FOR THE 2002 – 2004<br />
BIENNIUM 1<br />
• VDOT’s Executive Team’s employee customer service training program<br />
Members of the Transportation Research Board <strong>Strategic</strong> Planning Committee offered additional<br />
insights, contributing to this report with expertise in the following areas:<br />
• Federal and State highway customer satisfaction surveys<br />
• Transportation performance measures<br />
• <strong>Strategic</strong> planning initiatives<br />
• Private industry best practices<br />
Using the November 2001 VDOT report titled, “Report of Statewide Results - 2001 VDOT<br />
Customer <strong>Satisfaction</strong> Survey” (2001 Survey), eight highway characteristics and 53 associated<br />
highway features were categorized based on the respondents’ satisfaction levels. The public’s<br />
perception of certain subject areas proved inconsistent with organizational performance at<br />
VDOT. For this reason, a Strength, Weakness, Opportunity, and Threat (SWOT) Filter Process<br />
was developed and applied against the survey results and an evaluation of organizational<br />
performance. This process identified four subject areas allowing targeted recommendations to<br />
be developed for improving customer perception and organizational performance. The four<br />
areas filtered include:<br />
• Safety as a Strength (S)<br />
• Maintenance Response as a Weakness (W)<br />
• Emergency Information as an Opportunity (O)<br />
• Work Zone Safety as a Threat (T)<br />
Recommendations solidify a current organizational strength (Strength), alleviate a potential<br />
threat to future satisfaction ratings (Threat), expose an opportunity to communicate a strength to<br />
customers (Opportunity), or improve upon an organizational weakness (Weakness).<br />
1 Virginia Department of Transportation <strong>Strategic</strong> Plan for the 2002 – 2004 Biennium, January 10, 2002<br />
vii
Recommendations for each of the filtered areas are:<br />
Safety:<br />
• Focus on the Maintenance of Existing Facilities<br />
• Continue Safety Efforts<br />
• Continue Partnering and Development of Databases<br />
Work Zone Safety:<br />
• Improved Training and Setup of Work Zone Taper Areas<br />
• Utilization of Rumble Strips<br />
• Installation of Light Shields in Nighttime Work Zones<br />
• Management and Direction of Staff and Training<br />
Emergency Information:<br />
• Improve Customer Awareness and Access to Emergency Info<br />
• Link 511-Travel Info and Virginia Operations Information System (VOIS)<br />
• Offer Emergency Alert Services<br />
• Strengthen Intra and Inter Agency Partnerships<br />
• Expand Development of Road Weather Information System (RWIS)<br />
• Improve VOIS Training and Coordination<br />
Maintenance Response:<br />
• Publicize Contact Information<br />
• Provide One Stop Shopping for Customers<br />
• Track Customer Requests and Provide Feedback<br />
• Create Steering Committees to Review Customer Complaints and Develop<br />
Recommendations<br />
The aforementioned recommendations are all essential for maintaining and, in some cases,<br />
improving VDOT’s customer satisfaction. Many recommendations, though, need to be linked<br />
directly into VDOT’s <strong>Strategic</strong> Plan for the benefits of the recommendation to be realized. This<br />
can be accomplished through the utilization of specific benchmark satisfaction levels that guide<br />
VDOT’s business strategies and measure its successes. These strategies will ensure stronger<br />
customer satisfaction feedback while achieving a higher level of operational excellence.<br />
viii
Introduction<br />
VDOT Background<br />
In 1927, the Virginia Department of Transportation (VDOT) was established as the Virginia<br />
Department of Highways with 4,000 miles in its highway system 2 . The Department is<br />
responsible for the construction, maintenance and operation of the Commonwealth’s 1,118<br />
centerline miles of interstate and 55,594 miles of non-interstate roads. In addition to roads,<br />
VDOT maintains 11,787 bridges, four ferry services, four underwater crossing and two mountain<br />
tunnels, ten welcome centers, 31 rest areas and numerous commuter parking lots.<br />
Virginia has the third largest state-maintained highway system in the country, just behind Texas<br />
and North Carolina. Listed below in Table 1 is a sampling of states with the number of miles,<br />
which are state owned, and the total public miles in the state.<br />
Table 1 - Public Road Length – 1998 3<br />
State State Owned Miles Total Miles in State<br />
District of Columbia 0 1,421<br />
Utah 5,843 41,343<br />
California 15,208 165,951<br />
New York 15,022 112,524<br />
Virginia 57,350 69,860<br />
North Carolina 77,005 98,609<br />
Texas 79,086 296,581<br />
The Commonwealth owns 82% of the roads in the state, which is well above the national<br />
average. According to FHWA, nationwide, 20.4% of roads are owned by states, 4.3% by the<br />
federal government and 75.3% are owned by local jurisdictions 4 . Local ownership refers to<br />
roads owned by counties, towns and cities. In Virginia, because road ownership is primarily at<br />
the state level, VDOT works with local jurisdictions to achieve transportation goals and<br />
objectives. A considerable amount of resources and staff are needed to manage such a vast<br />
system of roadways.<br />
Approximately 10,000 persons are employed by VDOT, 85% of which are located at the nine<br />
highway construction District Offices, with the remaining employees located at VDOT<br />
headquarters (Central Office) in Richmond. The Central Office has 27 divisions that establish<br />
the overall policy and guidelines used to administer transportation programs. The Central Office<br />
2 Management Services Division, Virginia Department of Transportation, Commonwealth Transportation Board<br />
Handbook, Revised January 7, 2000, Page 1-2 http://0501comsd1/ctb/CTB%20Handbook.pdf Accessed 4/17/02<br />
3 United States Department of Transportation, Federal Highway Administration, Public Road Length, Miles-1998 by<br />
Ownership, Table HM-10 http://www.fhwa.dot.gov/////ohim/hs98/tables/hm10.pdf Accessed 4/17/02<br />
4 Federal Highway Administration, United States Department of Transportation, Conditions and Performance<br />
Executive Summary, System and Usage Characteristics: Highway and Bridge, 1999,<br />
http://www.fhwa.dot.gov/////policy/1999cpr/es/cpes_03.htm Accessed 4/17/02<br />
1
coordinates programs among the nine construction highway districts and advises the Virginia<br />
General Assembly and the State’s Governor on transportation issues. The Districts orchestrate<br />
the functions of Residencies that in turn provide direction to Area Headquarters. VDOT’s nine<br />
highway construction districts and organization structure are illustrated in Appendix A.<br />
VDOT has evolved into a multifaceted organization that not only constructs, maintains and<br />
operates roads, but provides intermodal connections, emergency services, and commuter<br />
information. VDOT faces challenges such as an increased focus on the environment, aging<br />
infrastructure and traffic congestion. By employing new techniques, technologies and programs,<br />
VDOT continues to address these issues in an effort to “Keep Virginia Moving into the 21 st<br />
Century.”<br />
Customer <strong>Satisfaction</strong> Movement<br />
In the private sector, customer satisfaction has always been a business focus area. The<br />
competitive nature of the free market allows dissatisfied customers to punish a company by<br />
taking their business elsewhere. Providing a quality product or service and handling customer<br />
concerns in a positive manner ensures that companies stay in business. Public sector agencies,<br />
however, do not have competition to drive their customer service process.<br />
In 1993, the Clinton Administration released Executive Order 12862, entitled “Setting Customer<br />
Service Standards”. This order challenged government agencies to improve efficiency, save<br />
taxpayer dollars, provide better customer service, and to improve public trust. The order<br />
required that private companies with the best customer service practices be analyzed for<br />
techniques that public agencies could incorporate into their business processes in order to<br />
improve customer satisfaction.<br />
Best Practices<br />
All of the companies analyzed had very similar approaches to achieving customer satisfaction.<br />
Some of the techniques and initiatives implemented include:<br />
• Identifying the customer – internal and external;<br />
• Promoting a shared customer service philosophy;<br />
• Making it easy for customers to complain;<br />
• Recognizing and reward employees for their creativity and improvements;<br />
• Using employee and customer feedback to assist in decision making and in developing<br />
future organizational strategic plans;<br />
• Considering complaints as opportunities;<br />
• Training and empowering front-line employees to resolve customer complaints;<br />
• Utilizing a database to track complaints and to monitor improvement in customer<br />
satisfaction.<br />
Some recommendations put forth in this report utilize private sector best practices as the<br />
foundation for developing the strategies VDOT could implement to improve overall customer<br />
2
satisfaction. The recommendations were designed to complement many of VDOT’s current<br />
initiatives.<br />
Literature Review<br />
A November 2001 report prepared by the <strong>University</strong> of Virginia’s Center for Survey Research,<br />
entitled “Report of Statewide Results - 2001 VDOT Customer <strong>Satisfaction</strong> Survey” (2001<br />
Survey), served as the basis for determining VDOT’s customer satisfaction levels. The 2001<br />
Survey summarized the responses of approximately 4,440 Virginians throughout the entire state.<br />
The respondents were randomly selected and contacted via telephone to answer questions based<br />
on their perceived satisfaction of characteristics within the following eight subject areas:<br />
• Safety<br />
• Traffic Flow<br />
• Pavement Conditions<br />
• Bridge Conditions<br />
• Visual Appeal<br />
• Maintenance Response Time<br />
• Travel Amenities<br />
• Work Zone Features<br />
In order to better understand the issues, background information was gathered on internal VDOT<br />
customer satisfaction efforts. VDOT’s organizational structure, strategic planning efforts and<br />
current customer service initiatives were examined. Additionally, customer satisfaction surveys<br />
referenced in the 2001 Survey were reviewed to acquire an insight into national and regional<br />
challenges and compared against the Virginia’s statewide results 5 . The following survey reports<br />
were reviewed:<br />
• Moving Ahead: The American Public Speaks on Roadways and Transportation in<br />
Communities, Federal Highway Administration, 2001<br />
• Customer <strong>Satisfaction</strong> Survey: Report Card, VDOT, 1997<br />
• National Highway User Survey, National Quality Initiative Steering Committee, 1995<br />
Federal customer service initiatives were researched as well as other state transportation<br />
programs and private industry practices. The focus of this research was to gain an understanding<br />
of VDOT’s customer satisfaction and compare VDOT’s practices with best practices in<br />
comparable fields.<br />
Various members of the Transportation Research Board <strong>Strategic</strong> Planning Committee (TRB<br />
Committee Number A1A07) were contacted through telephone and electronic mail. The<br />
committee provided published and unpublished literature on current efforts in their respective<br />
organizations with regards to surveying procedures, strength and weakness analysis, and<br />
performance measures. Comprised of leaders from state DOT’s and academia, this committee is<br />
5 A comparison of the 2001 Virginia Survey and 2000 National survey is located in Appendix D.<br />
3
esponsible for strategic planning, customer satisfaction initiatives, and performance<br />
measurement functions within their respective organizations. The committee directs research in<br />
areas of customer satisfaction improvement and in the development of industry best practices.<br />
Methodology<br />
The customer satisfaction ratings for each of the eight roadway characteristics and associated<br />
features found in the 2001 Survey provided the thresholds for determining customer<br />
satisfaction 6 . A list was prepared that identifies the percentage of respondents that had<br />
satisfactory perceptions within each of the eight subject areas (See Appendix B). The analysis of<br />
these scores proved to be the best and most direct feedback regarding VDOT’s performance and<br />
these results were utilized to form the basis of the subsequent analysis.<br />
Many times, customer’s perceptions may or may not be a reflection of reality. Therefore, the<br />
customer satisfactory perceptions were compared to actual organizational performance. By<br />
comparing data, it immediately became apparent that some of the customer’s perceptions<br />
contradicted reality. For example, customer’s perceived VDOT’s emergency information as<br />
poor (only 51.4% satisfied), yet VDOT has been the recipient of multiple awards in this<br />
category. Hence, a Strengths, Weaknesses, Opportunities and Threats (SWOT) Filter was<br />
applied to differentiate the customer’s perception from organization performance after an initial<br />
identification of customer’s perception of strengths and customer’s perception of weaknesses.<br />
Areas of strong satisfaction and weak satisfaction were compared to organizational performance<br />
and filtered as a Strength, Weakness, Opportunity or Threat. For strengths, VDOT is performing<br />
well and the customers recognize it. Conversely for weaknesses, it is likely that VDOT is<br />
performing poorly and customers perceive it as so, as a result, changes should be made or better<br />
resources are needed to manage the problem. For the areas with contradictory outcomes,<br />
opportunities and threats, the SWOT Filter was able to isolate the reasoning for the contradiction,<br />
which subsequently shaped the way the team’s recommendations evolved.<br />
6 Report of Statewide Results 2001 - VDOT Customer <strong>Satisfaction</strong> Survey<br />
4
SWOT Filter Process<br />
NO<br />
Areas with Strong<br />
Customer <strong>Satisfaction</strong><br />
Is Organization<br />
Performing Well?<br />
YES<br />
STRENGTH<br />
Strong Customer Perception<br />
+<br />
Strong Organizational<br />
Performance<br />
THREAT<br />
Strong Customer Perception<br />
+<br />
Weak Organizational<br />
Performance<br />
Areas with Weak<br />
Customer <strong>Satisfaction</strong><br />
Is Organization<br />
Performing Well?<br />
YES<br />
OPPORTUNITY<br />
Weak Customer Perception<br />
+<br />
Strong Organizational<br />
Performance<br />
WEAKNESS<br />
Weak Customer Perception<br />
+<br />
Weak Organizational<br />
Performance<br />
Safety, Maintenance Response Time, Emergency Information and Work Zones were passed<br />
through the filter and proved to be the best illustrations of a Strength, Weakness, Opportunity,<br />
and Threat under the SWOT filter process. Please note it was important to segregate out some<br />
of characteristics within subject area categories because some individual characteristics provided<br />
the specificity necessary to evaluate organizational performance. For example, the work zone<br />
safety characteristics from the work zone feature subject area were compared against VDOT<br />
work zone safety performance. In this case, the work zone feature, congestion, was not<br />
considered a safety feature and therefore, was not included in the work zone safety evaluation.<br />
The results of this process provide a clearer picture allowing for targeted recommendations<br />
aimed at not only improving customer perception but also organizational performance.<br />
For the purpose of following the logical procession of the analysis, the issues identified in the<br />
SWOT analysis are not presented in order of the acronyms, Strengths, Weaknesses,<br />
Opportunities and Threats, but are presented as they were analyzed. From the areas with strong<br />
customer satisfaction, Strengths and Threats were identified. From the areas with weak customer<br />
satisfaction, Opportunities and Weaknesses were identified.<br />
5<br />
NO
Strong Customer <strong>Satisfaction</strong> Areas<br />
YES<br />
STRENGTH<br />
Strong Customer Perception<br />
+<br />
Strong Organizational<br />
Performance<br />
Safety<br />
Areas with Strong<br />
Customer <strong>Satisfaction</strong><br />
Is Organization<br />
Performing Well?<br />
Step 1 - Customer Perception<br />
NO<br />
THREAT<br />
Strong Customer Perception<br />
+<br />
Weak Organizational<br />
Performance<br />
The 2000 National Survey and the 2001 VDOT Survey both identified safety as an important<br />
characteristic for major highways. In Virginia, 70.9% of respondents rated safety as the most<br />
important of the eight roadway characteristics, with traffic flow ranking second at 15%. In the<br />
National survey, safety was rated the second most important roadway characteristic at 26.6% and<br />
traffic flow was rated first at 28.7%.<br />
The 2001 Survey indicated that 73.9% of respondents are satisfied with the overall safety of<br />
major highways. The highest rated safety features of major highways are:<br />
Table 2 - Safety Features of Major Highways, VA 2001 7<br />
Safety Feature Percent <strong>Satisfaction</strong><br />
Warning Signs 86.6%<br />
Lane Width 82.9%<br />
Safety Barriers 80.5%<br />
Pavement Markings 80.2%<br />
7 Report of Statewide Results 2001 - VDOT Customer <strong>Satisfaction</strong> Survey<br />
6
Customer perception of safety is determined by their observations and experiences when<br />
traveling on a highway. Poor highway signage, missing guardrails or missing attenuators can<br />
make customers anxious and insecure. When comparing the 1995 National and 1997 VDOT<br />
Survey to the 2000 National and 2001 VDOT Survey, it is evident that customers are satisfied<br />
with the results of the organization’s performance.<br />
Table 3 - Virginia and US Comparisons of Characteristics, US<br />
1995 & VA 1997 and US 2000 & VA 2001 8<br />
Virginia Compared to US<br />
Characteristic VA 1997 VA 2001<br />
Safety Same Higher<br />
Traffic Flow Same Same<br />
Pavement Conditions Higher Higher<br />
Bridge Conditions Same Higher<br />
Visual Appeal Higher Higher<br />
Maintenance Response Time Higher Higher<br />
Travel Amenities Higher Higher<br />
Work Zones N/A Higher<br />
(compared to US 1995) (compared to US 2000)<br />
Step 2 – Organizational Performance<br />
Historically Virginia has had low fatality rates. Over the last 27 years, there has been a 6%<br />
decrease in fatalities and a -59% change in deaths per 100 million vehicle miles traveled. These<br />
low fatality rates show that the agency has created one of the safest highway transportation<br />
systems in the United States. Table 4 compares Virginia to other southeastern state neighbors by<br />
providing statewide fatality rates during a six-year window. The fatality rate is the number of<br />
fatal accidents per 100 million vehicle miles traveled.<br />
8 Report of Statewide Results 2001 - VDOT Customer <strong>Satisfaction</strong> Survey, Table 2.2<br />
7
Table 4 - Statewide Fatality Rates for All Roads 9<br />
State 1994 1995 1996 1997 1998 1999<br />
Alabama 2.20 2.20 2.20 2.20 1.90 2.00<br />
Arkansas 2.40 2.40 2.20 2.30 2.20 2.10<br />
Florida 2.20 2.20 2.10 2.10 2.10 2.10<br />
Georgia 1.70 1.70 1.80 1.70 1.60 1.50<br />
Kentucky 2.00 2.10 2.00 1.90 1.80 1.70<br />
Louisiana 2.30 2.30 2.40 2.40 2.30 2.30<br />
Mississippi 2.80 2.90 2.70 2.70 2.80 2.70<br />
N. Carolina 2.00 1.90 1.90 1.80 1.90 1.70<br />
S. Carolina 2.30 2.30 2.30 2.20 2.30 2.40<br />
Tennessee 2.20 2.20 2.10 2.00 1.90 2.00<br />
Virginia 1.40 1.30 1.20 1.40 1.30 1.20<br />
West Virginia 2.10 2.20 2.00 2.10 1.90 2.10<br />
Listed below are a few of the safety awards VDOT has won.<br />
• In 2001, VDOT won AASHTO’s Pathfinder award for excellence and innovation for a<br />
sign clutter reduction program along I-95. The program was recognized for reducing<br />
information overload and providing motorist sufficient time to follow exit instructions<br />
thus providing greater safety.<br />
• FHWA presented VDOT with the National Highway Safety Award, in November 2001,<br />
for demonstrating the effectiveness of milled rumble strips in reducing vehicle crashes<br />
from driver inattentiveness by 51.5%.<br />
• In 2001, VDOT won the National Award for Excellence in E-Emergency Management<br />
for the Virginia Operational Information System (VOIS). 10<br />
9 The Path Kentucky Transportation Cabinet Performance Report 2001.<br />
10 http://www.virginiadot.org/infoservice/news/CO05042001-vois.asp<br />
8
Safety<br />
Strong Customer <strong>Satisfaction</strong><br />
Is Organization<br />
Performing Well?<br />
Step 3 – Filter Results<br />
YES<br />
STRENGTH<br />
Strong Customer Perception<br />
+<br />
Strong Organizational<br />
Performance<br />
Based upon the strong customer perception and proven organizational performance, safety is<br />
filtered as a strength. The Department’s continued efforts to improve safety through the highway<br />
construction improvement programs, maintenance improvements, roadway signage<br />
improvements, the hazard protective measures in construction and maintenance operations have<br />
given the state a good reputation among its customers. The low fatality rates on Virginia’s<br />
highways since 1975 demonstrate the results of the department’s commitment to providing the<br />
traveling public with a safe transportation network. In addition, VDOT has received a number of<br />
awards for innovation in the area of safer roads through common sense ideas and programs like<br />
“Work Zone Safety Awareness Week”. This and other programs demonstrate VDOT’s<br />
commitment to safety.<br />
Step 4 – Recommendations<br />
Maintenance of Existing Facilities and Safety Improvements<br />
A greater emphasis should be placed on the maintenance and improved operations of existing<br />
facilities. The political atmosphere often champions for the building of new construction<br />
projects over the maintenance of existing infrastructure. However, the higher accident rates on<br />
the often-substandard rural secondary roads demonstrate the need for safety improvements to the<br />
existing facilities 11 . Although many projects improve safety, in order to facilitate this goal, a<br />
portion of secondary road funds could be set aside for safety “spot” improvements. This is<br />
currently done to a very small degree with the allocations “safety” projects with the primary<br />
system. The need on the secondary system for safety improvements is far greater which should<br />
require a substantial level of funding commitment.<br />
VDOT’s new asset management system and personnel need to develop critical path processes to<br />
ensure the safety of the facilities is maintained. In addition, Maintenance programs should be<br />
fully funded with a goal of continued stewardship and safety perseverance. Improving existing<br />
11 Chart (in appendix E) – Fatality Rates by Road Function – U.S. Department of Transportation - FHWA<br />
9
infrastructure prior to building new facilities will ensure current assets do not deteriorate and<br />
become a safety hazard.<br />
Continued Safety Focus<br />
VDOT must retain customers’ trust by implementing programs that promote maintaining and<br />
constructing safer highway facilities. TEA-21 and ISTEA provide financial incentives to help in<br />
the hazard elimination. Funds and projects should be prioritized according to need, based on<br />
strict analytical data from cost/benefit analysis of accident and other Hazard Elimination Systems<br />
(HES) related information. Programs such as Northern Virginia’s SMART TRAVEL, Global<br />
Positioning (GPS) based Asset Management System, and other ITS localized tools such as ramp<br />
metering, advanced warning signs, and sequenced traffic signal timing should be expanded. By<br />
backing the development of in-vehicle warning and navigation systems, VDOT can improve<br />
driver’s awareness to conditions around vehicles, which in-turn improve overall safety.<br />
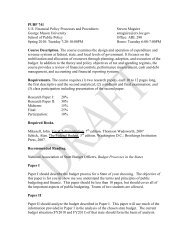
Continued Partnering & Development of Databases<br />
Federal legislation has requested that states compile a nationwide database of safety information.<br />
VDOT, is partnering with other agencies and organizations such as the Department of Motor<br />
Vehicles to bring Highway Traffic Records Information System 12 (HTRIS) crash location data<br />
into a Graphic Information System (GIS) (see Figure 1). Through the use of GPS, a pilot effort<br />
is underway to assemble, store, manipulate and geographically display crash locations. 13 The<br />
traffic accident information obtained and stored should be used by managers to prioritize<br />
improvements to existing infrastructure in areas with high accident ratios. 14 VDOT should<br />
explore the benefits of inclusion in the Highway Safety Information System (HSIS) project that<br />
the <strong>University</strong> of North Carolina and the LENDIS Corporation is doing under a contract with<br />
FHWA. HSIS uses safety information collected from nine states to identify common problems<br />
within the various and assist in finding solutions. 15<br />
12 HTRIS runs on an old mainframe computer and its primary function is to serve as an inventory system. The<br />
technology uses for HTRIS provides no user friendly query languages (for example: Microsoft Access).<br />
13 http://www.virginiadot.org/vtrc/briefs/99-r13rb/Gis_Crash.htm<br />
14 http://www.tfhrc.gov/pubrds/marapr00/safldrs.htm<br />
15 http://www.hsrc.unc.edu/hsis/index.cfm?num=1<br />
10
Figure 1 - Map of Crash Sites 16<br />
The department must continue to research and develop programs that identify safety related<br />
conditions on the states transportation network. Demonstrating the need for various construction<br />
and maintenance projects will remove the political mechanism of the allocation process. The use<br />
of ITS applications in meeting the challenges of congestion and motorist safety along with the<br />
implementation of additional motorist information systems, and the development of a fact based<br />
safety project construction program will allow VDOT to strengthen its customer’s perception and<br />
image.<br />
16 http://www.tfhrc.gov/pubrds/marapr00/safldrs.htm<br />
11
Work Zone Safety<br />
Step 1 – Customer Perception<br />
In the 2001 Survey, respondents rated work zones as the 4 th most important roadway<br />
characteristic. In addition, 65.7% of respondents were satisfied with work zones overall. This is<br />
five percent above the national average of 60% satisfaction. This comparison illustrates that<br />
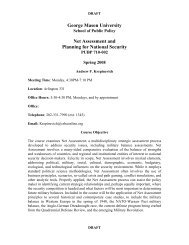
Virginians are more satisfied with Work Zones than the nation as a whole. When considering<br />
work zone features that most directly impact safety – construction signs, detour sign and safety<br />
features – respondents indicated significantly higher levels of satisfaction with the sub-category<br />
features than with the area of work zones as a whole. As shown in Figure 2, respondents were<br />
83.3% satisfied with Construction Signs, 74.7% satisfied with Detour Signs and 75.8% satisfied<br />
with Safety Features. This indicates customers, as a whole, are satisfied with the safety of work<br />
zones in Virginia.<br />
Construction Signs<br />
Detour Signs<br />
Safety Features<br />
Congestion<br />
Speed of Road Repair<br />
10.1%<br />
14.1%<br />
16.9%<br />
42.4%<br />
46.0%<br />
38.5%<br />
51.0%<br />
74.7%<br />
75.8%<br />
83.3%<br />
0% 20% 40% 60% 80% 100%<br />
Dissatisfied Satisfied<br />
Figure 2 - Work Zone Features of Major Highways, VA 2001 17<br />
Step 2 – Organizational Performance<br />
Nationally and locally, work zones are beginning to receive the appropriate level of attention that<br />
is needed in order to protect pedestrians, motorists, and highway workers. Although respondents<br />
from the 2001 VDOT Survey rated construction signs and safety features high, 83.3% and 75.8%<br />
respectively, this does not guarantee that the respondents fully understand the message that the<br />
17 Report of Statewide Results 2001 - VDOT Customer <strong>Satisfaction</strong> Survey, Figure 2.10<br />
12
signs are intended to convey, nor does it ensure that they know what to do to safely navigate<br />
their way through a work zone.<br />
A 1990 study “Work Zone - Stay Alert” conducted by the North Carolina’s Work Zone Safety<br />
Campaign, found that not all motorist have a clear understanding of work zone signs and<br />
features. In this study, interviews with both truckers and the motoring public revealed that they<br />
were unclear and/or did not understand the message being indicated by the signs and the<br />
appropriate safety measures to follow. In this same study, highway workers stated that speed<br />
was the major safety problem in work zones. Surprisingly, some highway workers openly<br />
admitted that they did not understand or practice work zone safety procedures. 18<br />
In an effort to ascertain the opinions of VDOT field managers concerning the level of training<br />
and use of the Work Area Protection Manual (WAPM) in maintenance operations, an informal<br />
three-question survey was administered via VDOT’s intra-agency email system. Of 205 Area<br />
Headquarters reached (approximately 350 people) 115 people replied to the email within the<br />
two-day time limit. Transportation Operations Manager I and Transportation Operations<br />
Manager IIs (Supervisors and Superintendents) were asked to reply to the following questions<br />
seen in Table 5 with the noted results.<br />
Table 5 - Training Survey<br />
Survey Questions: Total Percentages<br />
1. Do you and your work crews have a thorough knowledge of the Work Area Protection<br />
Manual? (Can most everyone apply the requirements to daily operations?)<br />
Yes 108 94%<br />
No 7 6%<br />
2. Do your employees use protective equipment (cones, signs, paddles) in all situations as<br />
required or only when necessary?<br />
As Required 99 86%<br />
When Necessary 16 14%<br />
3. Do you feel that you and your employees need further training in the proper use of the<br />
Work Area Protection Manual?<br />
Yes 61 53%<br />
No 54 47%<br />
While it seems most Area Headquarters Managers feel their crews have a thorough knowledge of<br />
the WAPM, it is concerning that 14% of those responding admitted to not using the safety<br />
measures as required. Although 94% of the respondents indicated that they and their crews have<br />
a thorough knowledge of the WAPM, 53% of respondents indicated that additional training in<br />
18 Roadway Safety Foundation-Roadway Safety Guide. Contact: Construction Unit, NCDOT, (919) 733-2210<br />
13
work zone safety is needed. For construction and maintenance projects along Virginia’s<br />
highway systems, the WAPM is the official guide for uniform standards, guidelines, and<br />
operational procedures. The survey findings indicate a need to train state employees as well as<br />
contractors on the WAPM and related procedures. Inadequately trained workers create a threat to<br />
workers, the public and the agency’s values and creditability.<br />
In 2001, there were 613 work zone accidents in Virginia. Of these, 393 resulted in injuries and<br />
10 resulted in fatalities. Although driver inattentiveness is often the underlying reason for<br />
accidents, improper work zone practices can contribute to accidents and fatalities, as well as,<br />
liability problems for VDOT.<br />
2001 Work Zone Statistics:<br />
Crashes: 613 (1.8% Increase over 2000 figure of 602)<br />
Injuries: 393 (22.8 % Increase over 2000 figure of 320)<br />
Fatalities: 10 (No change over 2000 figure of 10)<br />
800<br />
700<br />
600<br />
500<br />
400<br />
300<br />
200<br />
100<br />
0<br />
Work Zone Crashes/Injuries<br />
1994 1995 1996 1997 1998 1999 2000 2001<br />
Year<br />
# of Crashes<br />
# of Injuries<br />
Crash Trend<br />
Injury Trend<br />
Figure 3 - Work Zone Crashes/Injuries on VA State Maintained Roadways from 1994 – 2001 19<br />
19 Virginia Department of Transportation-Traffic Engineering Division, 2002 Highway Traffic Records Information<br />
System ( HTRIS) database. Contact: David.Rush@VirginiaDOT.org<br />
14
An increase in responsibilities coupled with a decrease in resources has many VDOT personnel<br />
tasked with multiple roles and responsibilities. For instance, some Safety Engineers are also<br />
tasked with managing drug and alcohol programs. A decrease in the number of maintenance<br />
personnel has resulted in area headquarter managers going out and providing assistance to work<br />
crews. Therefore, area managers are unable to provide contract administrators and safety<br />
engineers with the backup they need to monitor work crews.<br />
Work Zone Safety<br />
Strong Customer <strong>Satisfaction</strong><br />
Is Organization<br />
Performing Well?<br />
Step 3 – Filter Results<br />
NO<br />
THREAT<br />
Strong Customer Perception<br />
+<br />
Weak Organizational<br />
Performance<br />
Customers perception of work zones as whole in Virginia is moderate compared to the other<br />
seven roadway characteristic ratings, with 65.7% of those surveyed being satisfied or somewhat<br />
satisfied. When considering the features of work zones that have the most impact on safety,<br />
which include construction signs, detour sign and safety features, satisfaction rating were all<br />
above 74%. With the number of work zone related accidents and fatalities on the rise nationally,<br />
as well as in Virginia, it stands to reason that such incidents pose a threat to motorists,<br />
construction workers and maintenance personnel as well as future customer satisfaction ratings.<br />
As a result, work zone characteristics have filtered down into an area that has the potential to<br />
become an organizational threat unless proactive measures are implemented. The following<br />
recommendations are possible methods for reducing work zone related accidents and<br />
maintaining customer satisfaction levels with work zones.<br />
Step 4 – Recommendations<br />
As infrastructure ages it requires constant repair, maintenance, and ultimately retirement. With<br />
such a rigorous task of keeping traffic moving safely and effectively, work zones become a<br />
common occurrence along Virginia’s streets and highways. The increase in highway<br />
construction and maintenance exposes workers to many dangers, thereby making highway<br />
construction one of the most hazardous occupations in the United States, with risk of death being<br />
15
seven times greater for highway workers than it is for other occupations 20 (Virginia Road and<br />
Transportation Builders).<br />
VDOT should continue to make every possible effort to reduce or eliminate accidents in its work<br />
zones. The following recommendations were developed to help VDOT address Work Zone<br />
Safety issues:<br />
Taper Area<br />
Often, maintenance and construction activities require the utilization of travel lanes. To set up<br />
these work zones, merging traffic is channeled through taper areas into the remaining travel<br />
lanes. The taper area is created using a series of channelization devices and/or pavement<br />
markings placed to move traffic out of its normal path. One of the most commonly used tapers<br />
in a work zone is the merging taper. A merging taper requires the longest distances because<br />
drivers are required to merge with an adjacent lane of traffic at the prevailing speed (Virginia<br />
WAPM). A significant number of work zone accidents occur in these taper areas.<br />
Without the proper knowledge of assembling a taper area, maintenance workers do not provide<br />
motorist with the necessary spacing required to transition into adjacent traffic at the work zone<br />
speed. This can lead to accidents in the work zone. Therefore, following the guidelines as<br />
instructed and illustrated in the Work Area Protection Manual is of utmost importance.<br />
The appropriate training of construction and maintenance personnel becomes critical to the<br />
successful assembly and operations of work zones and VDOT should encourage and mandate<br />
that every construction/maintenance crew have a certified work zone supervisor on site during<br />
the initial phase of operation.<br />
Rumble Strips<br />
“Rumble strips are grooved or raised pavement corrugations placed<br />
perpendicular to the path of vehicles and across the full width of a<br />
roadway approach to alert inattentive drivers of hazards that may not<br />
be readily apparent but which require substantial speed reduction or<br />
other cautionary maneuvers.” 21<br />
Rumble Strips have been used in various forms to control traffic since the 1950’s. Rumble strips<br />
make drivers more attentive by using two types of stimuli: tactile and auditory. The<br />
combination of these tactile (e.g., vibrations from the shaking of the automobile) and auditory<br />
(e.g., noise created by the tires as they go across the strips) can be varied by the type, size, and<br />
spacing of the rumble strips.<br />
20 Kasel, Carol, Road Construction Dangers, Rocky Mountain News.com<br />
http://www.rockymountainnews.com/drmn/local/article/0,1299,DRMN_15_1069961,00.html accessed on April 20,<br />
2002<br />
21 Federal Highway Administration Report # FHWA-TS-89-037, July 1989, page 1<br />
16
Ohio, Pennsylvania, Maryland, and Illinois have developed standards for the use of rumble strips<br />
in work zones, however, in practice, they are only occasionally used 22 . During joint repair and<br />
resurfacing of Interstate 77 in Ohio, two-way traffic was maintained on one side of the roadway.<br />
The crossover section was severely affected by a long downgrade and vertical and horizontal<br />
curvature with opposing super-elevations. Rumble strips were installed because of concern with<br />
vehicle speeds and the geometric of the roadway. The construction project was zoned for a<br />
speed of 50 mph. Two sets of speed bumps were installed and at both locations the 85 th<br />
percentile speed was found to be 55 mph. Construction personnel and officials of the Ohio<br />
Department of Highways believed that the speed reduction was significant and that the rumble<br />
strips were very effective in keeping speed in the construction areas down to a more reasonable<br />
level 23 .<br />
Temporary rumble strips should be installed in traffic lanes prior to work zones in order to<br />
reduce the driver’s speed. By reducing speed and increasing driver awareness through the use of<br />
tactile and auditory stimuli; rumble strips can lead to a decrease in work zone accidents and<br />
fatalities.<br />
Light Shields<br />
During nighttime construction, contractors use portable lighting to illuminate work areas.<br />
Lighting allows workers to see the work area more clearly, and optimizes work zone safety. On<br />
a divided highway, lighting is usually installed on the upstream side of the work zone and the<br />
light is projected in the same direction that the traffic is traveling. Occasionally, this has caused<br />
problems for vehicles traveling from the opposite direction, creating a situation similar to<br />
oncoming traffic with bright headlights.<br />
Glare from work zone lighting can be very uncomfortable and distracting to motorists. Glare<br />
may be caused by the failure to extend the light poles to the proper height or by a failure to<br />
properly direct the work area lighting downwards. The proper positioning and alignment of<br />
work area lighting helps to reduce glare. In addition, light shields, visors, and glare screens<br />
should be installed on the portable floodlights used in night construction work zones 24 . This<br />
feature would reduce glare and “night blindness” experience by motorist traveling through a<br />
work area.<br />
Staffing & Training<br />
VDOT should develop a standardized WAPM certification program similar to the Department of<br />
Conservation and Recreation’s Environmental Contractor Certification. All of VDOT’s<br />
maintenance crews and inspectors should be certified. VDOT should also require that each work<br />
zone project have one certified representative on site. Additionally, VDOT should increase its<br />
inspection of work zones by safety engineers, traffic engineering and local management to<br />
ensure that WAPM regulations are being followed.<br />
22 Ibid, page 4<br />
23 Federal Highway Administration Report # FHWA-TS-89-037, July 1989, page 28<br />
24 B.H. Cottrell, Jr., “Improving Night Work Zone Traffic Control,” Virginia Transportation Research Council,<br />
August 1999, page 16.<br />
17
In addition to inspections, Safety Engineers are also responsible for the administration of<br />
VDOT’s drug and alcohol program. It is recommended that VDOT contract out, or specifically<br />
hire employees to manage these programs. This will allow Safety Engineers and Inspectors to<br />
devote more time to managing and ensuring adherence to work zone regulations.<br />
18
Weak Customer <strong>Satisfaction</strong> Areas<br />
NO<br />
WEAKNESS<br />
Weak Customer Perception<br />
+<br />
Weak Organizational<br />
Performance<br />
Emergency Information<br />
Areas with Weak<br />
Customer <strong>Satisfaction</strong><br />
Is Organization<br />
Performing Well?<br />
Step 1 – Customer Perception<br />
YES<br />
OPPORTUNITY<br />
Weak Customer Perception<br />
+<br />
Strong Organizational<br />
Performance<br />
In the 2001 Survey respondents indicated a relatively high level of satisfaction when considering<br />
the safety of major highways in Virginia. As one of the eight general characteristics rated in the<br />
survey, safety was further disaggregated into eight features. For example, respondents where<br />
asked to reveal their satisfaction with the warning signs located along major highways in<br />
Virginia. For this particular safety feature, the survey indicates an 86.6% satisfaction.<br />
Conversely, the survey reveals that respondents are much less satisfied with the availability of<br />
emergency information. Emergency information received the lowest satisfaction score at 51.4%<br />
and the highest dissatisfaction score, 32.0%, of the eight safety features rated in the survey. See<br />
Figure 4 for satisfaction ratings of safety features.<br />
The implications of emergency information’s low satisfaction rating is compounded by the high<br />
level of importance respondent’s place on the safety of Virginia’s highway system. As<br />
mentioned earlier, 70.9% of respondents rated safety as the most important roadway<br />
characteristic in the 2001 Survey. This is significant considering that only 26.6% of<br />
respondent’s in the 2000 National survey rated safety as the most important roadway<br />
characteristic. As a feature of the safety category, emergency information is considerably below<br />
other safety features and is therefore classified as an area of weak customer satisfaction.<br />
19
Warning Signs<br />
Lane Width<br />
Safety Barriers<br />
Pavement Markings<br />
Lighting<br />
Shoulder Width<br />
Skid Resistant<br />
Emergency Info<br />
8.7%<br />
12.0%<br />
11.1%<br />
14.8%<br />
17.8%<br />
20.4%<br />
24.1%<br />
32.0%<br />
51.4%<br />
63.8%<br />
68.4%<br />
74.4%<br />
82.9%<br />
80.5%<br />
80.2%<br />
86.6%<br />
0.0% 20.0% 40.0% 60.0% 80.0% 100.0%<br />
Dissatisfied Satisfied<br />
Figure 4 - Safety Features of Major Highways, VA 2001 25<br />
STEP 2 – Organizational Performance<br />
One of the most important elements of any emergency management system is the ability to<br />
collect and coordinate data concerning roadway conditions. These conditions may include<br />
adverse weather conditions, major and minor incidents, hazardous material releases, and even<br />
planned maintenance or construction activities. Each of these conditions affects the operation of<br />
the highway system. The ability of a transportation agency to effectively collect this data and<br />
disseminate information to other agencies and the traveling public is key to the safe and efficient<br />
operation of the highway system and the satisfaction of customers.<br />
Emergency Operations<br />
VDOT has created the Transportation Emergency Operations Center (TEOC) to serve as the<br />
central command center for coordinating the exchange of information among VDOT personnel<br />
in the field, as well as, state and local authorities and the public. The tool for accomplishing this<br />
task is the Virginia Operational Information System (VOIS – pronounced like the word “voice”).<br />
This web-based emergency management system provides up-to-the-minute information from<br />
multiple agencies. For example, the state police can enter information about an accident into the<br />
VOIS system thereby informing all other interested agencies of the incident. Based upon the<br />
information entered, VDOT can dispatch road crews to assist should roadway repairs or debris<br />
removal be necessary to return roadway operations back to normal. The VOIS system is<br />
nationally recognized as a model for emergency operations and information exchange and has<br />
received numerous awards from the Federal Highway Administration (FHWA), as well as, the<br />
25 Report of Statewide Results 2001 - VDOT Customer <strong>Satisfaction</strong> Survey<br />
20
2001 National Award for Excellence in E-Emergency Management from the State and Local<br />
Emergency Management Data Users Group.<br />
Traveler Information<br />
In order to make informed travel decisions the public needs quick and convenient access to<br />
accurate data about the conditions of the roadways they utilize. Although the public cannot<br />
directly access VOIS there are a multitude of ways the public can indirectly access the<br />
information in the system. The public can access the VDOT website at www.VirginiaDOT.org<br />
and click on “Road Conditions”. This website provides the public with map depicting roadway<br />
conditions, construction activities and incidents. Alternatively, the public can utilize the<br />
Highway Helpline at 1-800-367-ROAD to receive road conditions, accident information and<br />
weather conditions throughout the state. In addition, VDOT launched the Commonwealth’s first<br />
511-traveler information system in February of 2002. The Federal Communications<br />
Commission designated 511 as a national 3-digit number for travelers to access emergency and<br />
operational information about the transportation system. The Virginia 511 service is a voiceactivated<br />
system currently providing traveler information for the Interstate 81 corridor in western<br />
Virginia. Not only does the system provide travelers with roadway and weather information, but<br />
it also provides information on traveler services such as restaurants, lodging and tourist<br />
attractions.<br />
Emergency Information<br />
Weak Customer <strong>Satisfaction</strong><br />
Is Organization<br />
Performing Well?<br />
STEP 3 – Filter Results<br />
YES<br />
OPPORTUNITY<br />
Weak Customer Perception<br />
+<br />
Strong Organizational<br />
Performance<br />
Although emergency information was identified as an area of low customer satisfaction, this is<br />
an area that VDOT has been quite successful. Therefore, emergency information has been<br />
filtered as an opportunity. Through the following recommendations, VDOT can easily improve<br />
its customer satisfaction rating to better align customer perception with organizational<br />
performance.<br />
21
Step 4 –Recommendations<br />
Improving Customer Awareness and Access<br />
The difference between the low satisfaction ratings and the strong leadership VDOT has<br />
demonstrated regarding emergency information signals a disconnect between the agency and<br />
Virginia’s motorists. Although the information in the VOIS system is readily available to VDOT<br />
emergency personnel and other state agencies, the customers may not be aware of the system or<br />
how and where the information may be accessed. For this reason, efforts should be aimed at<br />
improving the public awareness and access to the emergency information in the VOIS system.<br />
Currently efforts are underway at VDOT to improve access to VOIS information. One potential<br />
modification VDOT is currently working on is the creation of the web page www.myVDOT.org.<br />
This site will provide customers with information about projects in the Virginia Transportation<br />
Development Plan, as well as, display emergency information from the VOIS system. Once this<br />
website is available for the public, a concerted effort should be implemented to increase the<br />
public awareness through the development of an advertising strategy to improve hits on the new<br />
www.myVDOT.org website. VDOT should utilize billboards, advertisements in newspapers and<br />
on radio and TV, variable message signs and bumper stickers to inform the public of the new<br />
website.<br />
Emergency Alert Services<br />
In addition to a web interface for the dissemination of VOIS information, VDOT should offer a<br />
pager alert service to motorists. Motorists could subscribe to this service on the<br />
www.myVDOT.org website and receive emergency information specific to the region they<br />
desire. For example, a motorist commuting in Fairfax could subscribe to the service and receive<br />
emergency alerts for the northern Virginia region. Since many VDOT employees currently carry<br />
pagers that display up-to-date emergency and accident information from the VOIS system,<br />
extending this service to the public would require little development and deployment costs.<br />
Similarly, VDOT should provide an email alert service to notify residents of road closures and<br />
accidents that may affect their travel plans. Not only will these services allow motorists to make<br />
more informed travel decisions, but will increase customer satisfaction with emergency<br />
information.<br />
Linking 511 and the Virginia Operations Information System<br />
VDOT should link capabilities of the new 511-traveler information system and VOIS in order to<br />
provide the traveling public and citizens with options to access emergency information<br />
statewide. With the reporting and web capabilities of VOIS and the voice responsiveness of the<br />
511 system, customers en-route and those with Internet access will be able to receive the latest<br />
emergency information needed to effectively plan travel routes.<br />
Strengthening Intra & Inter-Agency Partnerships<br />
The multiple state agencies utilizing and entering data into the VOIS system raises the issue of<br />
coordinating and standardizing communication and data entry. Many agencies continue to<br />
22
operate individual information systems and the accuracy of VOIS is often dependent upon user<br />
entering information twice – once in their agency’s system and then into the VOIS system. For<br />
this reason, VOIS only captures about 75% of highway incidents in dense urban areas such as<br />
Northern Virginia and only 25% of incidents in rural areas such as Bristol 26 . Also, the users of<br />
the VOIS system often fail to follow protocols for inputting information. For example, field<br />
personal will often choose not to input an incident because they believe the incident will be<br />
removed or addressed in a short amount of time. This hinders the ability of VOIS to contain<br />
accurate and complete information the conditions of roadways in Virginia.<br />
Motorist that access VOIS information via the web need accurate and complete information. If<br />
they do not receive the latest accurate information, they will lose trust and satisfaction with the<br />
system and with the information it provides. Improving data exchange between agencies would<br />
greatly improve the validity of VOIS and make the deployment of a website and beeper service<br />
more feasible. There is currently a Virginia Multi-Agency Steering Committee for the VOIS<br />
program. VDOT should use this forum to develop methods of increasing the compatibility of the<br />
various agency systems and develop a strict training problem for VOIS users to ensure data is<br />
entered into the system in an accurate and timely manner. VDOT should also seek to gain the<br />
support of General Assembly members and the Governor in an effort to improve interagency<br />
buy-in and cooperation. The atmosphere regarding support for emergency operations and<br />
preparations since September 11, 2001 gives VDOT a window-of-opportunity to elevate the role<br />
and support of VOIS across the state.<br />
Road Weather Information System<br />
Consideration should be given to expanding VDOT’s current efforts in developing a Road<br />
Weather Information System (RWIS) on a statewide level and incorporate this effort for its<br />
customers’ use through the VOIS and 511 systems. Cost savings from personnel no longer<br />
required to work ‘snow watch’ could provide savings by allowing the TEOC to monitor sites and<br />
dispatch crews when the conditions are approaching surface freezing in the affected areas. This<br />
would increase the productivity of the workforce and provide cost savings for the agency.<br />
VDOT should develop a road weather system in areas that routinely experience hazardous<br />
weather. Signage improvements could be developed with available and affordable technology to<br />
provide customers with real-time information on road conditions. Information displayed on<br />
variable message signs needs to be more real-time and accurate. VDOT should use available<br />
signs to display accurate traffic conditions. These systems will provide drivers more real time<br />
information to address roadway conditions they will face such as ice, congestion, fog, rain,<br />
flooding and snow.<br />
26 Conversation with Perry Cogburn, VDOT, on April 2, 2002.<br />
23
Maintenance Response<br />
Customer interaction with web pages and information systems is fast becoming the main portal<br />
through which citizens access government information. Although this trend will undoubtedly<br />
continue into the foreseeable future, technology currently cannot serve as a complete stand-alone<br />
substitute for human interaction. Customers should be able to access information via computer<br />
and telephone, however, they also need to be able to interact with government representatives<br />
that are able to answer questions and address specific concerns. As the agency responsible for<br />
the nation’s third largest state maintained highway system, it is impossible for VDOT to monitor<br />
the conditions of every mile of roadway throughout the Commonwealth. For this reason, VDOT<br />
often relies on customers to provide information on roadway conditions that require the attention<br />
of maintenance crews. How an organization handles these service calls can have a tremendous<br />
impact on a customer’s perception and satisfaction.<br />
Step 1 - Customer Perception<br />
A review of the 2001 Survey suggests that respondents consider maintenance requests and<br />
response time to these requests as a weakness. The survey considered these maintenance features<br />
in two ways: ‘Maintenance Response Time of Major Highways’ (Figure 5) and ‘Response to<br />
[maintenance] Service Requests of Secondary Roads’ (Figure 6).<br />
Figure 5 - Maintenance Response Time Features of Major Highways, VA 2001 27<br />
Figure 5 shows the level of satisfaction for Maintenance Response Time Features of Major<br />
Highways. The features considered in the characteristic of maintenance response time of major<br />
highways included litter removal, snow removal, pavement repairs, guardrail and barrier repairs,<br />
and the cleaning of rest areas. Pavement repair scored the lowest of all the maintenance response<br />
time features of major highways with only 54.4% of the respondents being satisfied with<br />
VDOT’s performance in this area. Given that the most prominent reason the respondents stated<br />
27 Report of Statewide Results 2001 - VDOT Customer <strong>Satisfaction</strong> Survey, Figure 2.8<br />
24
for contacting VDOT was for road repairs and potholes, this becomes another area of concern for<br />
the Department from a customer service standpoint.<br />
Figure 6 - Roadside Maintenance, Secondary Roads, VA 2001 28<br />
When considering maintenance features of secondary facilities the respondents suggest<br />
‘Response to Service Request’ as an area of dissatisfaction, with only 47.1% of the respondents<br />
indicating satisfaction with this roadway characteristic. Figure 6 of the 2001 VDOT Survey<br />
illustrates this feature as the weakest of all the roadside maintenance features for secondary<br />
roads.<br />
When asked to reveal the importance of maintenance response time, only 2.6% of the<br />
respondents ranked it as the most important characteristic of secondary roads. However, any<br />
breakdown of perception in the customer service process, such as the response to service<br />
requests can adversely affect satisfaction levels of other characteristics. The transitive nature of<br />
customer satisfaction, although difficult to measure, is an important consideration for any<br />
organization.<br />
Step 2 - Organizational Performance<br />
When looking at VDOT’s strategic plan, values, strategic outcome areas and mission statement,<br />
customer service is a recurring theme and illustrates the organization’s responsibility to serve the<br />
needs of the traveling public. VDOT’s commitment to customer service is reinforced through its<br />
Customer Service Initiative program. This training program teaches employees skills and<br />
strategies for improving customer relations and service. Respondents indicated 75% satisfaction<br />
when asked to rate the helpfulness of VDOT employees. This indicates that VDOT’s Customer<br />
Service Initiative is working. As the survey notes “there are no significant differences between<br />
28 Report of Statewide Results 2001 - VDOT Customer <strong>Satisfaction</strong> Survey, Figure 3.3<br />
25
the construction districts and the overall statewide level of satisfaction with the helpfulness of<br />
employees.” For more information on the Customer Service Initiative, refer to Appendix C.<br />
Currently there are several ways customers can contact VDOT with complaints, comments and<br />
requests. Customers can call the 24-hour Highway Helpline (1-800-367-ROAD), contact the<br />
department via e-mail or file a Highway Helpline Road Condition Report through the VDOT<br />
Internet Web Page (Appendix F). Additionally, the customer can contact their residency or area<br />
headquarters directly or send a letter to any contact persons, including the Secretary of<br />
Transportation and the Commissioner. Although there are specific individuals in place to handle<br />
these concerns, the public is often unsure whom they should contact for queries and requests.<br />
Customer service training serves to improve the interaction between department personnel and<br />
customers. This training, however, can do little to improve the processes of handling customer<br />
service requests after the initial interaction with the customer has occurred and the request has<br />
been taken. Correspondence related to maintenance that is sent directly to the Commissioner or<br />
Secretary of Transportation is forwarded to the Emergency Operations Center (TEOC) where it<br />
is numbered and entered into the VOIS system. This system serves as a database messaging<br />
system and allows request to be sorted and dispersed from the TEOC to the construction districts<br />
and residencies. The requests are reviewed by designated staff and forwarded through the chain<br />
of command where it is reviewed at many different levels. The entire process, from receiving a<br />
letter to sending a reply to the customer and dispatching maintenance crews is constantly<br />
monitored.<br />
Similarly, work requests taken through the highway hotline or condition report taken through the<br />
VDOT’s web site, are entered directly into the VOIS system where the appropriate construction<br />
District and Residency personnel can access and review the information. The majority of<br />
customer requests, however, are received directly by the Residency via telephone calls, letters, emails,<br />
customer walk-ins and the Board of Supervisors. The VOIS only recently has been<br />
reengineered as a web-based application, allowing Residencies to enter requests directly into the<br />
system.<br />
However, requests taken directly at the Area Headquarters cannot be entered directly into the<br />
VOIS system. At the present time, Area Headquarters do not have access to the VOIS system<br />
and therefore, is unable to monitor or check the status of complaints/requests. It may be as long<br />
as three years before the Area Headquarters has access to VOIS. The limiting factor is not the<br />
deployment of the program, which is web-based; it is the time involved to train the Area<br />
Headquarters staff.<br />
Even with VOIS tracking work requests, how the request is handled and to what degree the<br />
customer is informed of the progress of their request depends on who gets the call. Despite<br />
expansion and continued improvement of the VOIS system, TEOC, Highway Helpline, and the<br />
VDOT web page, a clearly defined and systematic process for handling customer requests has<br />
not been developed.<br />
26
Maintenance Response<br />
Weak Customer <strong>Satisfaction</strong><br />
Is Organization<br />
Performing Well?<br />
Step 3 - Filter Results<br />
NO<br />
WEAKNESS<br />
Weak Customer Perception<br />
+<br />
Weak Organizational<br />
Performance<br />
The weaknesses of maintenance response are mainly institutional and procedural in nature.<br />
Without a structured approach, the process becomes uncoordinated and slow, leaving the<br />
customer unsatisfied and without a sense that his or her concerns are important. This weakness<br />
has important implications to VDOT’s public image and efforts to improve maintenance<br />
response can be used to enhance customer satisfaction and improve future survey results.<br />
Although the utilization of the VOIS system enhances internal communication with VDOT and<br />
allows correspondence to be tracked, once the request has been entered, customers are often not<br />
notified as to what actions VDOT has taken in response to their concern.<br />
VDOT has been successful in the implementation of Customer Service Initiatives to increase the<br />
customer service skills of its employees. This is illustrated in the high level of satisfaction<br />
indicated by respondents when asked about their experiences with VDOT employees.<br />
Modifications and improvements to the VOIS system indicate that VDOT is dedicated to<br />
improving customer service. However, VDOT’s Customer Service Initiatives fall short of<br />
improving the processes of contacting the customer after handling the customer’s requests. In<br />
addition, the users of the VOIS system often lack the appropriate training to effectively use it as<br />
a customer service tool.<br />
Districts, such as the Northern Virginia District, see the need for their own separate tracking<br />
system, i.e. MARS (Maintenance Action Requests). Although they use VOIS, they may be<br />
reluctant to use the VOIS system on a regular basis without the appropriate guidance and<br />
training. Customer service extends beyond institutional boundaries and a standardized approach<br />
is necessary to ensure exceptional customer service regardless of where a customer lives. Given<br />
these considerations, maintenance response is filtered as a weakness – weak customer perception<br />
and weak organizational performance.<br />
Step 4 - Recommendations<br />
The process of entering, handling and tracking requests all factors into response time. A clear<br />
opportunity to address maintenance response time starts at the first point of contact. The<br />
customer initiates communication with VDOT to report problems and request assistance. To<br />
assist this process, customers should be provided information on who and how to contact VDOT<br />
as well as receive feedback on the status of their request. The process should be simple and<br />
convenient, leavening the customer with the feeling that their concerns are important and their<br />
27
ecommendations are being addressed. The following recommendations can be incorporated into<br />
many of VDOT’s current efforts.<br />
Publicize Contact Information<br />
VDOT should aggressively publicize the Highway Helpline and agency website. The toll free<br />
number and web address should be used as a standard footer on all newspaper ads and press<br />
releases. The key element to any marketing strategy is repetition. VDOT should take advantage<br />
of every opportunity to bring the Highway Helpline and web site to the public’s attention. This<br />
contact information can be provided at public meetings and VDOT offices on business cards and<br />
brochures. Public events such as the state/regional fairs and local sporting events are ideal<br />
opportunities for VDOT to set-up information booths and kiosks to inform customers how to<br />
contact the agency and inform them of customer service initiatives. Welcome centers operated<br />
by VDOT are ideal settings for information exchanges between staff and motorists.<br />
VDOT could publicize contact information through the use of signs, TV commercials, radio<br />
spots, newspapers, school flyers, church bulletins, and community papers. These suggestions<br />
can easily be incorporated into already existing, planned advertisements, such as the State Map,<br />
which are distributed by VDOT.<br />
One Stop Shopping: Simplify the process for customers and give feedback<br />
VDOT should buy into the idea of one-stop shopping for the average customer. A customer<br />
service center located in every district could provide customers with employees who have a<br />
through knowledge of the agency and are able to immediately address customer’s concerns.<br />
Customer service representatives would have access to the VOIS system thereby being<br />
connected to the TEOC, the Districts, the Residencies, and the Area Headquarters. As a result,<br />
employees on all levels will be able to monitor and track the status of customer complaints and<br />
requests. Once the request has been completed, the customer service representative would relay<br />
the information of the actions taken to the customer.<br />
The VDOT web site should incorporate a customer service section that would allow a one-stop<br />
on-line list of resources for customers who are seeking to contact the Department with work<br />
requests. This web site could include the following:<br />
• The telephone number to the 24-hour Highway Helpline (1-800-367-ROAD).<br />
• Highway Helpline Road Condition Report through the VDOT Internet Web Page<br />
• Contact information for all nine districts and residencies.<br />
• Latest news concerning ITS, traveler information, etc.<br />
Research has shown that about forty percent of complaints are from customers who don’t have<br />
adequate information about a service or a product. Even requests, which cannot be fulfilled,<br />
deserve a response. Providing feedback to the customer as to why the request cannot be fulfilled<br />
can be enough to satisfy the customer. It is important that VDOT use every opportunity they can<br />
to educate the public about laws or other obligations that restrict their product or service.<br />
28
However, when it becomes necessary to say “no” to a customer, customer service representatives<br />
must use personal responses to explain why it is not possible to provide a specific request.<br />
Highway Helpline<br />
The Highway Hotline employs processes that could be used as a benchmark to manage the<br />
communications effort and enhance customer service. When customers make a<br />
complaint/request by way of the Highway Helpline, they are told that it will take approximately<br />
7-10 business days for VDOT to resolve the issue. Problems are resolved based on the priority<br />
of the item. In the meantime, customers have no point of contact or a way to check the status of<br />
their request. Once the problem is resolved, customers are not usually called back.<br />
For example, if customers contact the Highway Helpline to make a request to have potholes<br />
repaired, a work order is completed by the TEOC and tracked through the Virginia Operational<br />
Information System (VOIS). Requests are tracked through this system allowing contact<br />
coordinators at most levels to view the status of each request. The Area Headquarters is the only<br />
area in VDOT that does not have VOIS, but they are the ones who generally will take care of the<br />
problem. Every effort should be taken to implement the VOIS system and train employees to<br />
track customer’s comments, suggestions, and problems at the Area Headquarters. Currently,<br />
once the Area Headquarters completes the request, they call the residency to let them know. The<br />
residency then goes into VOIS and close out the request, but the customer is rarely contacted.<br />
The District Customer Service Center could alleviate some of these issues by providing a local<br />
point of contact for the customer. Customers should be called back before the request is marked<br />
“closed” in the system. Customers should be able to contact the local representative to determine<br />
the status of their request. By providing this service, it allows the customers to always be<br />
informed about their request. If a request is completed the same day, customers will readily<br />
receive that information instead of waiting 7-10 days and having to call back to the Highway<br />
Helpline in order to get their results. Overall, importance should be given to show VDOT’s true<br />
concern for the customer and their problems. These problems must be resolved in a timely<br />
fashion before the customer’s problem becomes a problem for VDOT.<br />
Reviewing the Process - Steering Committees<br />
Dedicated customer service steering committees should be implemented to identify the most<br />
common customer concerns and requests. The committee’s focus should be to analyze trends<br />
and to provide recommendations to VDOT’s leadership on improving business practices.<br />
Through this analysis, preventative strategies can be identified; allowing management to make<br />
informed decisions. Customer service steering committees should be implemented in each<br />
District, with member representation from each Residency.<br />
Customer satisfaction is directly reflected in the effectiveness of an organization’s strategic<br />
planning and execution at the macro level. Recognizing the importance of an organization’s<br />
strategic plan and how it relates to the goals of this project, VDOT’s <strong>Strategic</strong> Plan was<br />
analyzed. The following section identifies key elements of strategic planning and how the needs<br />
of VDOT’s customers can be integrated into this process. It also includes recommendations,<br />
29
which are in conjunction with the recommendations outlined in the SWOT section of this report,<br />
and should improve VDOT’s levels of customer satisfaction.<br />
30
Incorporating Customer <strong>Satisfaction</strong> into <strong>Strategic</strong> Planning<br />
<strong>Strategic</strong> planning is a systematic method of defining an organization’s mission, vision, and<br />
values from which an approach to doing business is developed. Goals and objectives are coupled<br />
with performance measures to evaluate an organization’s progress and success. Assessing the<br />
current political and economic environment within which the organization operates and<br />
forecasting potential future changes helps an organization to react early as priorities shift and to<br />
adapt to the changing needs of its customers. The political landscape in Virginia is constantly<br />
changing, and VDOT must continue to recognize and work within the given context.<br />
VDOT’s 2002-2004 <strong>Strategic</strong> Plan<br />
At the outset of this project, VDOT’s <strong>Strategic</strong> Plan for the 2002 – 2004 Biennium was reviewed<br />
to gain a better understanding of the organization’s strategic planning approach. VDOT’s<br />
approach was then compared to other public and private strategic planning documents as well as<br />
literature in the field strategic planning. Primarily, two concerns surfaced regarding the contents<br />
of the strategic plan. The first concern is the lack of strategy statements for achieving the<br />
identified goals and objectives. An example of this can be found in the maintenance section<br />
where environmental concerns are identified as critical, but no environmental strategies are<br />
identified to deal with the issues. In the construction section of the plan, ensuring public and<br />
worker safety is also identified as a critical issue; however, specific strategies to attain this goal<br />
are not stated.<br />
The second concern deals with the utilization of performance measures. There are several<br />
performance measures that cannot be quantified in order to measure progress toward a specific<br />
goal. An example of this issue is performance measure three in the maintenance section of the<br />
strategic plan. The performance measure reads:<br />
Level of Virginia’s driver’s satisfaction with VDOT for maintenance response as<br />
indicated on formal customer service surveys, maintenance response reports, and<br />
customer response reports.<br />
A specific, measurable level of driver satisfaction should be stated in the document. The formal<br />
customer satisfaction surveys are identified as the vehicle for obtaining satisfaction rating with<br />
maintenance activities. However, specific benchmark satisfaction levels should be identified and<br />
utilized to guide maintenance strategies and measure success.<br />
Organizational performance measures are used to provide insight on "how well" the organization<br />
is accomplishing its goals. These measures should be used by staff and management to<br />
determine performance and to identify problems that require resolution. The measures are linked<br />
to the organizations strategic plan and tactical objectives in the perspective of organizational<br />
effectiveness.<br />
Measures that provide "how many or what we do", are static measures that are not indicative of<br />
performance. However, the "how many/what we do" measure is useful for comparisons of<br />
magnitude and business focus or essential functions that are crucial to the organization’s mission.<br />
31
Static measures are often derived directly from the organization’s strategic plan and tactical<br />
objectives.<br />
Performance and static measures are not stand-alone and require the organization to collect data.<br />
The data collection process should be transparent to the staff and intrinsically linked to the<br />
activity or process. This negates manipulation and improves clarity for staff and managers. All<br />
assigned staff should be acutely aware of the measures and how they will be used.<br />
Unfortunately, transparent data collection usually involves automated tracking systems that can<br />
be very costly, and may not be useful in predominantly manual tasks or may not be indicative of<br />
performance for tasks that are continually unique.<br />
A Critical First Step<br />
<strong>Strategic</strong> plan development is a critical first step to success. The most difficult challenges,<br />
however, lie in implementing the strategic vision into all layers of an organization. Many<br />
organizations invest significant time and money into developing strategic plans, but fail to link<br />
the goals of the strategic plan to project execution. VDOT’s <strong>Strategic</strong> Plan outlines the<br />
objectives it wants to achieve, but only through leadership and articulation of the vision, as well<br />
as from employee buy-in will strategic goals be achieved. The education and empowerment of<br />
employees are key considerations to improving VDOT’s strategic-based performance.<br />
<strong>Strategic</strong> Planning<br />
Key<br />
Clear Vision of<br />
Organizational<br />
Goals<br />
Implementation<br />
Key<br />
Employee<br />
Education<br />
Empowerment<br />
Management and<br />
Evaluation<br />
Key<br />
Performance<br />
and Static<br />
Measures<br />
Figure 7 - Improving the Role of the <strong>Strategic</strong> Plan in the Organization<br />
Every member in the organizational workforce needs to be aware of VDOT’s mission and the<br />
current strategic goals of the organization. This can effectively be achieved through increased<br />
education and involvement of the employees. VDOT should use orientation sessions to educate<br />
and periodic reviews to ensure that employees are actively participating in the achievement of<br />
strategic goals. Employees should be empowered in the strategic structure of the organization.<br />
There is an old management adage, ‘In poorly managed companies, people are problems…In<br />
32
well-managed companies, people are problem solvers”. VDOT’s customers demand rapid<br />
response when problems arise or there is a lapse in service. Front line employees are critical not<br />
only for delivering the product but for solving product delivery problems as well. Rapid<br />
response and effective problem resolution are only attainable when employees are empowered<br />
and motivated to make decisions 29 . Motivating employees does not equate to higher salaries or<br />
more vacation time. The most powerful approach is for management to take interest in<br />
employees and nurture their personal development. In order for VDOT’s employees to be<br />
effective problem solvers and decision-makers, they must not only understand, but also feel a<br />
part of the strategic goals of the organization.<br />
Employee Education and Empowerment<br />
An effective approach to this is to ask employees to provide their list of what VDOT’s strategic<br />
priorities should be as well as a list of suggest changes, such as the elimination of wasteful steps<br />
in the work process, which they feel would increase VDOT’s effectiveness in meeting strategic<br />
goals. In fact, the U.S. General Accounting Office (GAO) recently developed an action plan to<br />
improve its strategic planning process. GAO identified engaging more staff in the process as a<br />
critical step towards strategic planning improvement. GAO has developed an internal website<br />
dedicated to strategic planning. This is an excellent mechanism for providing input to the<br />
planning process, as well as for providing feedback once the plan is developed. 30<br />
Empowering employees and vesting greater responsibility and accountability with front line<br />
employees provides them with initiative to understand the organization’s strategic goals and<br />
specifically their role in achieving them. Employees should be rewarded for their contributions<br />
to VDOT’s strategic planning process at the time of their appraisal. Specific competencies<br />
should be outlined in appraisals, which identify an employee’s knowledge of the organization’s<br />
strategic goals, as well as the steps that employee has taken to help the organization to achieve<br />
those goals.<br />
The strategic plan or highlights of the plan should be distributed to everyone in the organization<br />
and parts of the plan, which are relevant to the individual’s job, should be restated on their<br />
appraisal form. Additionally, including portions of the plan in company newsletters is another<br />
way to remind employees of the goals they are working towards.<br />
Aggressive implementation plans need to be developed at all levels of the organization. District<br />
Administrators need to develop business plans, which not only identify strategies for<br />
implementing VDOT goals and objectives, but also identify actions that specifically describe<br />
how each division is working towards a specific strategy. The ‘how’ and the ‘who’ must be<br />
identified. Secondly, the business plan needs to identify someone who will be responsible for<br />
monitoring the business plan in order to determine if the goals and objectives are being met or<br />
not met, as well as to make critical decisions regarding the organization’s strategic vision.<br />
Skilled management is critically important in order for VDOT to eliminate processes and or<br />
29 Stevens, Mark. Extreme Management: What They Teach at Harvard Business School’s Advanced Management<br />
Program. Warner Books, Inc, New York, NY, 2001.<br />
30 ACTION PLAN: How GAO Will Strengthen Its <strong>Strategic</strong> Planning Process. United State General Accounting<br />
Office. April 2002 <br />
33
tasks, which are not in accordance with the strategic plan. Richard Crater, the Executive Vice<br />
President of Massachusetts General Hospital, had the following to say regarding strategic<br />
decision-making, “Draw a straight line from the issue, concern, request, etc to the strategic goals.<br />
If it does not link, do not do it.” If VDOT’s strategic goals are understood and shared in a<br />
collaborative environment between employees and management, a higher level of operational<br />
excellence will be achieved.<br />
34
Conclusions<br />
VDOT is responsible for the third largest state maintained highway systems in the country. This<br />
statewide control provides opportunities for a more integrated and seamless highway network.<br />
Current trends indicate that VDOT’s responsibilities will only increase as the demand on<br />
transportation infrastructure continues to grow and stress the roadway network. It is estimated<br />
that each year nearly 2.5 million additional drivers will utilize U.S. roads 31 . As these demands<br />
grow, VDOT will face increased customer expectations for services.<br />
The analysis of VDOT’s customer satisfaction program and the proposed recommendations<br />
present VDOT with opportunities that pave the way for improved customer satisfaction.<br />
Simultaneously, the analysis captures those areas of concern to customers and highlights the<br />
need to be proactive as an organization in order to avoid lower survey scores in the future.<br />
Finally, recommendations are provided that addresses those weak areas in need of improvement.<br />
Safety - Strength<br />
Safety is the Virginia traveler’s most important roadway characteristic by a factor of almost five<br />
to one. Intuitively, a drop in confidence in this measure amongst Virginian’s would have the<br />
greatest impact to VDOT’s customer satisfaction. As seen on Table 4, VDOT is the leader in<br />
maintaining significantly low state accident and fatality rates. VDOT, therefore, should continue<br />
its efforts to maintain safe highway facilities, prioritizing its resources for maintaining and<br />
improving existing facilities rather than pursue new construction programs.<br />
Work Zone Safety – Threat<br />
The SWOT filter process was able to isolate work zone safety as a threat to VDOT’s customer<br />
satisfaction. Although Virginia has a strong overall safety record and high customer satisfaction<br />
ratings, the number of work zone fatalities continues to increase. To counter these trends,<br />
recommendations were made to increase the utilization of merging tapers, rumble strips and light<br />
shields in work zones. These are inexpensive, yet effective ways of reducing work zone<br />
incidents. Ultimately, these recommendations may alleviate the threat that exists if customers<br />
become aware of higher work zone incident rates.<br />
Emergency Information – Opportunity<br />
Even though the customer viewed emergency information in a negative light, VDOT has<br />
received numerous awards for its emergency management program and traveler information<br />
services. The current deployment of accident and emergency information systems (VOIS and<br />
511) has opened up even more opportunities that VDOT should pursue. Since the system<br />
already delivers real-time information to VDOT employees, little development would be<br />
required to enhance these systems and make more information available to the public. Strong<br />
outreach, in addition to the successful launch of another customer-oriented service, will<br />
31 http://www.fhwa.dot.gov/ohim/ohimstat.htm Highway Statistics Series<br />
35
accentuate VDOT’s commitment to emergency information and result in more satisfied<br />
customers.<br />
Maintenance Response - Weakness<br />
Maintenance response for pavement repair is typically the most prominent reason for contacting<br />
VDOT. As seen in Figure 5, only 54% of respondents were satisfied with the maintenance<br />
response time. Recent innovations in database management and complaint tracking present a<br />
great opportunity to VDOT. The tracking system would ensure that every complaint is properly<br />
fielded and followed-up. Higher levels of confidence in a database system with greater emphasis<br />
placed on customer feedback will result in substantial gains in customer satisfaction.<br />
The SWOT filter is designed to analyze and compare organizational performance to customer<br />
perception. This strategy not only contributes to short-term analysis to develop<br />
recommendations but can also be used as a tool for future analysis.<br />
VDOT’s business practices need to continue to be integrated into the organization’s strategic<br />
plan. Through the incorporation of performance measures into the strategic plan, VDOT can<br />
more effectively measure progress toward meeting business goals. Through education and<br />
inclusion, employees develop a sense of ownership and responsibility regarding the<br />
organization’s strategic plan and mission. As more and more employees become involved in the<br />
strategic planning process, VDOT will be able to successfully move forward and face the new<br />
challenges of the 21 st century.<br />
36
Appendix A - Virginia Department of Transportation’s<br />
Nine Districts and Organizational Structure<br />
VDOT divides the state into nine districts, each of which oversees maintenance and construction<br />
on the state-maintained highways, bridges and tunnels in its region.<br />
1. Bristol District: (276) 669-6151<br />
P.O. Box 1768<br />
870 Bonham Road<br />
Bristol, Virginia 24203<br />
E-mail: bristolinfo@vdot.state.va.us<br />
(Bland, Buchanan, Dickenson, Grayson, Lee, Russell, Scott,<br />
Smyth, Tazewell, Washington, Wise and Wythe counties)<br />
3. Lynchburg District: (434) 947-6559 or (434) 947-6599<br />
P.O. Box 11649<br />
4219 Campbell Avenue<br />
Lynchburg, Virginia 24506<br />
E-mail: lynchburginfo@vdot.state.va.us<br />
(Amherst, Appomattox, Buckingham, Campbell, Charlotte,<br />
Cumberland, Halifax, Nelson, Pittsylvania and Prince Edward<br />
counties)<br />
5. Hampton Roads District: (757) 925-2584 or<br />
1-888-723-8400<br />
1700 North Main Street<br />
Suffolk, Virginia 23434<br />
E-mail: hamptonroadsinfo@vdot.state.va.us<br />
(Accomack, Greensville, Isle of Wight, James City,<br />
Northampton, Southampton, Surry, Sussex and York counties<br />
and the cities of Chesapeake, Emporia, Franklin, Hampton,<br />
Newport News, Norfolk, Poquoson, Portsmouth, Suffolk,<br />
Virginia Beach and Williamsburg)<br />
7. Culpeper District: (540) 829-7537<br />
1601 Orange Road<br />
Culpeper, Virginia 22701<br />
E-mail: CulpeperInfo@VirginiaDOT.org<br />
(Albermarle, Culpeper, Fauquier, Fluvanna, Greene, Louisa,<br />
Madison, Orange and Rappahannock counties)<br />
9. Northern Virginia District: (703) 383-VDOT<br />
Avion Lakeside I<br />
14685 Avion Parkway<br />
Chantilly, Virginia 20151-1104<br />
E-mail: NOVAinfo@vdot.state.va.us<br />
(Arlington*, Fairfax, Loudoun and Prince William counties<br />
Report signal outages, downed limbs, potholes or any safety<br />
problems on roadways in Northern Virginia to VDOT’s 24hour<br />
Customer Service Line at 703-383-VDOT<br />
*Maintains own county roads<br />
Source: http://www.virginiadot.org/infoservice/vdot-directory.asp<br />
2. Salem District: (540) 387-5320<br />
P.O. Box 3071<br />
731 Harrison Avenue<br />
Salem, Virginia 24153<br />
E-mail: saleminfo@VirginiaDOT.org<br />
(Bedford, Botetourt, Carroll, Craig, Floyd, Franklin, Giles Henry,<br />
Montgomery, Patrick, Pulaski and Roanoke counties)<br />
4. Richmond District: (804) 524-6179 or 1-800-663-4188<br />
P.O. Box 3402<br />
2430 Pine Forest Drive<br />
Colonial Heights, Virginia 23834<br />
E-mail: RichmondInfo@VirginiaDot.org<br />
(Amelia, Brunswick, Charles City, Chesterfield, Dinwiddie,<br />
Goochland, Hanover, Henrico*, Lunenburg, Mecklenburg, New<br />
Kent, Nottoway, Powhatan and Prince <strong>George</strong> counties)<br />
6. Fredericksburg District: (540) 899-4560<br />
87 Deacon Road<br />
Fredericksburg, Virginia 22405<br />
E-mail: fredericksburginfo@vdot.state.va.us<br />
(Caroline, Essex, Gloucester, King & Queen, King <strong>George</strong>,<br />
King William, Lancaster, Mathews, Middlesex, Northumberland,<br />
Richmond, Spotsylvania, Stafford and Westmoreland counties)<br />
8. Staunton District: (540) 332-9075<br />
P.O. Box 2249<br />
Commerce Road<br />
Staunton, Virginia 24402-2249<br />
E-mail: stauntoninfo@vdot.state.va.us<br />
(Alleghany, Augusta, Bath, Clarke, Frederick, Highland, Page,<br />
Rockbridge, Rockingham, Shenandoah and Warren counties)<br />
General Information, VDOT Central Office<br />
(804) 786-2801<br />
1221 East Broad Street, Richmond, Virginia 23219<br />
E-mail: vdotinfo@VirginiaDOT.org<br />
A - 1
A - 2
Appendix B - <strong>Satisfaction</strong> Assessment<br />
Safety Percent Satisfied* Visual Appeal Percent Satisfied*<br />
Lighting 74.40% Advertisements 65.20%<br />
Shoulder Width 68.40% Litter 60.60%<br />
Safety Barriers 80.50% Sound Barriers 72.00%<br />
Lane Width 82.90% Landscaping 84.10%<br />
Warning Signs 86.60% Rest Areas 77.10%<br />
Pavement Markings 80.20%<br />
Blend with<br />
Surroundings<br />
78.90%<br />
Skid Resistant 63.80% Average 73.10%<br />
Emergency Info 51.00%<br />
Average 73.90%<br />
Maintenance<br />
Response Time<br />
Litter Removal 62.90%<br />
Traffic Flow Snow Removal 78.40%<br />
Overall Congestion 36.40% Pavement Repair 54.40%<br />
Toll Booth<br />
Congestion<br />
40.40% Barrier Repair 70.50%<br />
Accident Congestion 50.20% Cleaning Rest Area 66.20%<br />
HOV Lanes 58.00% Average 66.70%<br />
Judging Travel Time 73.40%<br />
Info on Congestion 73.50% Travel Amenities<br />
Timing of Signals 62.50% Patrol for Assistance 66.10%<br />
Average 58.00% Sign for Services 83.90%<br />
Pavement<br />
Conditions<br />
Mileage Signs 90.40%<br />
Number of Rest Areas 69.40%<br />
Smoothness 69.90% Average 78.20%<br />
Appearance 74.60%<br />
Durability 65.00% Work Zone Features<br />
Quiet Ride 72.80% Construction Signs 83.30%<br />
Average 70.70% Detour Signs 74.70%<br />
Safety Features 75.80%<br />
Bridge Conditions Congestion 42.40%<br />
Smoothness 73.70% Speed of Road Repair 51.00%<br />
Appearance 80.40% Average 65.70%<br />
Durability 75.50%<br />
Quiet Ride 71.80%<br />
Average 75.50%<br />
Below Average<br />
Above Average<br />
B - 1<br />
* Percent Satisfied refers<br />
to responses of “Very<br />
Satisfied” of "Somewhat<br />
Satisfied"
Appendix C - Virginia Department of Transportation<br />
Customer Service Initiatives<br />
The Virginia Department of Transportation (VDOT) operates on the same premise of any other<br />
business. It has a core product (infrastructure), and a workforce of dedicated professionals with core<br />
competencies. Together they form the foundation of the organization.<br />
As a team of competent and dedicated professionals VDOT provides its customers (traveling motorists)<br />
with the safest product possible, using sound engineering practices to deliver its core product<br />
(Construction, Maintenance, and Operations). In a continuous effort to provide such a product, its<br />
Executive Team has focused in on providing “comfort and safety to those who travel the highways of<br />
Virginia”. Through an extensive overview of its Product, People, and Processes the Executive Team has<br />
determined that it must return to the fundamental principle of any organization, and that is to provide a<br />
superior product that meets the demands of its customer, while simultaneously providing superior<br />
customer service. This fundamental understanding of the nature of basic business practices has led to<br />
the Customer Service Initiative.<br />
The Customer Service Initiative began through a process of determining where the customer fit in with<br />
VDOT’s overall objective. This may appear to be a simple enough question, but one in which so many<br />
organizations fail to address correctly. Through an exhaustive process VDOT’s Executive Team came<br />
up with a simple solution to a simple problem: a superior product plus superior customer service equal a<br />
superior organization. The next step was to develop a plan. The task of developing this plan was given<br />
to the <strong>Strategic</strong> Management Team, who developed what is now know as the Customer Service<br />
Initiative, which is closely aligned with the <strong>Strategic</strong> Outcome Areas for customer satisfaction.<br />
The mission to achieve superior customer satisfaction would not be an easy task. In order to achieve the<br />
goals of the initiative it would entail changing the attitude of the organization from the top, starting with<br />
the managers, and carried down to lowest level of employment. VDOT began by developing a systems<br />
approach for training managers.<br />
Several key indicators to providing customer service were identified:<br />
• Listen to customers and understand their needs<br />
• Give a high priority to customer satisfaction<br />
• Anticipate and provide creative solutions to customer service needs.<br />
Communicating Customer Service Values to Employees<br />
As with any customer service program, in order for it to work, it must be emphasized throughout<br />
the organization, and everyone must have a complete understanding of the goals and objectives.<br />
Secondly, the vision must be a shared vision and meet the overall objective of the organization.<br />
With this in mind, the Executive Leadership group decided on a concept of ‘achieve global.’<br />
Achieving global customer service training program was selected, with the major components<br />
being:<br />
C - 1
• Managing Extraordinary Service (3 days for managers)<br />
• Achieving Extraordinary Customer Relations’ (2 days for all employees)<br />
• Keeping the Skills Alive (materials for on-the-job reinforcement training for supervisors)<br />
The pilot program was put into place and the Richmond District, along with the Staunton District<br />
volunteered to initially begin training for all three of the components in the Spring of 1996.<br />
Managing Extraordinary Customer Service<br />
Providing customer service is a process by which an organization goes beyond what is expected<br />
in an effort to provide its customer with quality products, and a commitment to delivering<br />
extraordinary service.<br />
Reaching out to the customer and interacting with them in a professional and courteous manner<br />
should be the norm and not the exception.<br />
In an effort to support the customer service initiative VDOT has developed various training<br />
programs to support the mission of the organization.<br />
Organizational Training and Development Programs<br />
Achieving Extraordinary Customer Relations (AECR) is a two day required course for all<br />
VDOT employees, old and new.<br />
The AECR course is a foundational program designed to equip all employees with high impact<br />
skills and strategies that will result in visible improvements in internal and external customer<br />
service. This program sets the stage for improving customer relations and building loyalty with<br />
in the organization by providing a common language and understanding of service; practical<br />
skills to respond to each customer’s situation; and is a proven method for increasing teamwork,<br />
efficiency and productivity.<br />
Coaches Program: Leadership Training & Development Program (LTDP)<br />
Leadership and Peer Coach<br />
&<br />
Customer Service Coach<br />
Leadership Coach: This particular training is for those individuals who are currently in a<br />
supervisory or managerial position, or who have had extensive supervisory experience in the<br />
past. The Leadership Coach will be responsible for facilitating VDOT specific leadership<br />
courses to supervisors/managers and non-supervisory employees<br />
Leadership Peer Coach: These leaders are currently in a non-supervisory position. The Peer<br />
Coach will be responsible for facilitating classes addressed to the audience of team membersemployees<br />
not currently in a supervisory capacity.<br />
C - 2
Customer Service Coach: Typically, Customer Service facilitators/coaches serve as both<br />
trainers and change agents. As trainers, the facilitators present the two-day Achieving<br />
Extraordinary Customer Relations (AECR) training program to their fellow VDOT work unit<br />
employees. After training these coaches become easily recognizable within the work unit as a<br />
customer service coach, and “expert”, they are viewed as change agents and help promote<br />
excellence in customer service. By helping to move the work unit and employees toward a<br />
culture of individual and collective accountability for meeting customer expectations. Customer<br />
Service coaches may also provide assistance to their manager or supervisor as they meet with<br />
their teams to discuss “Keeping the Skills Alive,” 20 short modules designed to reinforce earlier<br />
customer service workshop.<br />
Building Trust: This is a one-day course that helps participants discover their personal role in<br />
cultivating an environment of trust in their organization. This class further assists people to<br />
recognize and avoid five “Trust Traps” behaviors that can make them appear untrustworthy to<br />
others. These techniques, along with the use of Key Principles, form the foundation for building<br />
trust in the workplace. The last component of the course involves the creation of an action plan<br />
by participants to enable them to strengthen trust with their internal partners.<br />
Delegating for Productivity and Growth: This training is for all team leaders, managers and<br />
supervisors in order to promote and maintain a motivated workforce. In this module, leaders<br />
learn skills for successfully matching people, responsibility, and authority to maximize<br />
involvement, productivity, motivation, and growth for individuals, groups, and the organization.<br />
Helping Others Adapt to Change: This module focuses on the crucial role leaders have in<br />
effectively exploring change, introducing change, and helping others overcome resistance<br />
typically associated with change. Leaders learn how to conduct effective change discussions that<br />
minimize the potentially negative effects of change on morale, processes, and productivity.<br />
Learning Partnership Program<br />
Through the Learning Partnership Program, it is VDOT’s intention to encourage each team<br />
member to acquire knowledge, skills, and behaviors in an environment conducive to continuous<br />
learning and in agreement with VDOT’s values. Well-trained team members in all disciplines are<br />
vital to successful accomplishment of VDOT’s Mission.<br />
The Learning Partnership Program offers opportunities for all team members to develop<br />
regardless of current skill level. In exchange for financial support for tuition and certain other<br />
costs, recipients agree to a tenure period after completing the learning event in which you share<br />
your knowledge with your co-workers.<br />
Purpose of the Program:<br />
A learning Partnership grant can include funding and/or leave time. The purpose is to develop<br />
critical skills and knowledge to meet current and future challenges. Through the program VDOT<br />
may help employees to:<br />
C - 3
• Attain the competencies (knowledge, skills, and behaviors) to meet identified needs of<br />
the department<br />
• Learn to use new or modified techniques, methods, and equipment<br />
• Attain those competencies required for VDOT to achieve its mission<br />
• Enhance knowledge and skills for your current responsibilities or in anticipation of future<br />
responsibilities with the agency.<br />
Types of Opportunities Covered:<br />
The Learning Partnership Program covers the following:<br />
• Individual courses at colleges, community colleges, and universities, to include nondegree<br />
programs<br />
• Courses of study leading to degrees at the Associate, Bachelors, Masters, and Doctoral<br />
levels<br />
• Full-time resident degree programs<br />
• Essential workplace skills development for reading, math, writing English, etc.<br />
• General Equivalency Diploma (GED) preparation and examination<br />
• Membership in a profession association<br />
• Professional and technical certificates or license, etc.<br />
Cycle of Service – Development & Recruiting of Civil Engineers<br />
The Civil Engineering and Scholarship Program<br />
This program is geared towards preparing aspiring engineers for future employment with VDOT.<br />
A scholarship stipend of $2500 per semester is available to sophomores, juniors, and seniors.<br />
Summer employment under the supervision of your designated mentor at VDOT Full-time<br />
employment with VDOT upon graduation for those who qualify.<br />
Keeping the Skills Alive<br />
Through continuous training of VDOT personnel in the technical areas of expertise, VDOT<br />
assures itself of having a competent technically knowledgeable workforce. These areas include,<br />
but are not limited to:<br />
• Electrical skills training<br />
• Bridge maintenance inspector training<br />
• Sign and Pavement Markings inspector training<br />
• Air quality modeling (Mobile 6)<br />
• Pavement inspection training<br />
• Construction Inspector Training<br />
• Value Engineering Training<br />
• Construction Specifications Writing<br />
C - 4
Appendix D - National and Virginia Survey Comparisons<br />
Comparing the 2000 National and 2001 VA Surveys<br />
In 2000, the Federal Highway Administration sponsored a customer survey, titled, “Moving<br />
Ahead, The American Public Speaks on Roadways and Transportation in Communities” to<br />
determine the level of satisfaction of users of the national highway system. In response to this<br />
survey, the Commonwealth of Virginia sponsored the VDOT 2001 Customer <strong>Satisfaction</strong> Survey<br />
to determine the level of satisfaction of the users of its highway system. Questions asked on the<br />
national survey were replicated on the Virginia survey for interstate and primary roads.<br />
It is important to compare the results of the two surveys to understand Virginia’s relative ranking<br />
with the rest of the country and investigate the strengths and weaknesses of Virginia’s highway<br />
system when compared with surveys for other road users. The two most important measures<br />
used to compare the two surveys were 1) the customers overall level of satisfaction and 2)<br />
individual satisfaction rankings for each of eight characteristics of major highways.<br />
Overall level of <strong>Satisfaction</strong><br />
Over 77 % of the licensed drivers in Virginia are satisfied with major highways in Virginia while<br />
only 65% of the nation’s travelers were satisfied. In addition, the dissatisfaction rate was better<br />
represented by Virginia drivers. Only 18% of Virginia drivers were dissatisfied as compared to<br />
21% of the nation’s drivers. (See Figures 1 and 2)<br />
Somewhat<br />
Satisfied<br />
49%<br />
Neutral<br />
5%<br />
Very Satisfied<br />
28%<br />
Very<br />
Dissatisfied<br />
7%<br />
Somewhat<br />
Dissatisfied<br />
11%<br />
Figure 1 - <strong>Satisfaction</strong> with Major Highways, VA 2001<br />
D - 1
Somewhat<br />
Satisfied<br />
55%<br />
Neutral<br />
14%<br />
Very Satisfied<br />
10%<br />
Very<br />
Dissatisfied<br />
8%<br />
Somewhat<br />
Dissatisfied<br />
13%<br />
Figure 2 - <strong>Satisfaction</strong> with Major Highways, National 2000<br />
<strong>Satisfaction</strong> of Eight Characteristics<br />
The respondents on both surveys were also asked to indicate how satisfied they were with eight<br />
general categories of road characteristics by using a numerical scale from 1 to 5 (with 5 being the<br />
most satisfied and 1 being the least satisfied). The eight characteristics of major highways that<br />
were evaluated on both the VDOT and the U.S. DOT survey were; Safety, Traffic Flow,<br />
Pavement Conditions, Bridge Conditions, Visual Appeal, Maintenance Response Time, Travel<br />
Amenities, and Work Zones. A comparison of the results of the two surveys is shown in<br />
Table 1.<br />
D - 2
Table 1 - <strong>Satisfaction</strong> with Specific Features of Major Highways, National 2000 & Virginia 2001<br />
Features Year<br />
US2000 VA2001<br />
Safety (Characteristic) 3.59 3.86<br />
Lighting 3.60 3.84<br />
Width of Shoulders 3.52 3.64<br />
Safety Barriers 3.68 4.03<br />
Width of Lanes 3.73 4.10<br />
Warning Signs 3.85 4.24<br />
Pavement Markings 3.66 4.04<br />
Skid Resistant 3.35 3.59<br />
Emergency Road Information 3.27 3.29<br />
Traffic Flow (Characteristic) 3.36 3.38<br />
Overall Congestion 2.74 2.56<br />
Toll Booth Congestion 3.03 3.12<br />
Accident Congestion 3.08 3.09<br />
HOV or carpool 3.68 3.59<br />
Judge Travel Time 3.69 3.79<br />
Information about Delays 3.71 3.88<br />
Traffic Signal Timing 3.47 3.48<br />
Pavement Conditions (Characteristic) 3.28 3.74<br />
Smoothness of Ride 3.15 3.64<br />
Appearance of Road 3.27 3.86<br />
Durability 3.23 3.63<br />
Quiet Ride 3.46 3.84<br />
Bridge Conditions (Characteristic) 3.69 3.91<br />
Smoothness of Ride on Bridges 3.62 3.82<br />
Appearance of Bridges 3.78 4.07<br />
Durability of Bridges 3.66 3.95<br />
Quiet Ride NA 3.82<br />
Visual Appeal (Characteristic) 3.56 3.88<br />
Billboards 3.28 3.65<br />
Litter or Trash 3.11 3.39<br />
Appearance of Sound Barriers 3.61 3.87<br />
Landscaping 3.76 4.20<br />
Design of Rest Areas 3.91 4.08<br />
Blend with Surroundings 3.74 4.09<br />
Maintenance Response Time (Characteristic) 3.41 3.70<br />
Litter Removal Time 3.31 3.62<br />
Snow Removal Time 3.60 4.01<br />
Pavement Repair Time 2.94 3.21<br />
Barrier Repair Time 3.63 3.89<br />
Cleaning Rest Area Time 3.70 3.83<br />
Travel Amenities (Characteristic) 3.75 4.05<br />
Patrol for Assistance 3.53 3.80<br />
D - 3
Signs for Motorist Services 3.88 4.18<br />
Signs for Mileage 3.95 4.37<br />
Number of Rest Areas 3.57 3.80<br />
Work Zones (Characteristic) 3.33 3.60<br />
Construction Signs 3.75 4.14<br />
Detour Signs 3.56 3.93<br />
Safety Features 3.59 3.89<br />
Congestion in Work Zones 2.87 2.89<br />
Speed of Repair 2.88 3.11<br />
The mean scores for satisfaction of major roads for all respondents was 3.81 in the Virginia 2001<br />
Survey. The mean satisfaction level for the 2000 U. S. DOT survey is 3.49, which is<br />
significantly lower than Virginia. Virginia ranks higher than the nation in 7 of the 8 categories<br />
when comparing against the national results.<br />
In general, Virginia drivers are more satisfied with Virginia highways than drivers nationwide.<br />
The major exception to this is with the satisfaction of congestion/traffic flow where the mean<br />
score in the Virginia survey is 2.56 while that of the U.S. survey is 2.74. This appears to be a<br />
geographical problem with the major metropolitan areas (Northern Virginia/Hampton Roads)<br />
expressing dissatisfaction while the more rural areas are content with the traffic flow.<br />
D - 4
Appendix E - Fatality Rates by Road Function<br />
Fatality Rates by Road Function, 1995-1999<br />
U.S. Department of Transportation - Federal Highway Administration<br />
Fatality Rate by Road Function Classification, 1995-1999 (fatality per 100 million vehicle miles<br />
of travel)<br />
1995 1996 1997 1998 1999 Avg<br />
Roadway Function Class<br />
Rural Interstate 1.20 1.23 1.26 1.23 1.24 1.232<br />
Other Principal Artery 2.40 2.41 3.25 2.26 2.16 2.496<br />
Minor Artery 3.09 2.84 2.73 2.53 2.52 2.742<br />
Major Collector 3.05 2.92 2.85 2.85 2.81 2.896<br />
Minor Collector 3.40 3.32 3.52 3.20 3.04 3.296<br />
Local Road 3.82 3.97 3.89 3.69 3.79 3.832<br />
Total Rural 2.57 2.52 2.49 2.43 2.39 2.478<br />
Urban Interstate 0.63 0.66 0.63 0.60 0.61 0.626<br />
Freeway/Expressway 0.85 1.16 0.82 0.77 0.79 0.878<br />
Other Principal<br />
Arterial<br />
1.56<br />
1.44<br />
1.40 1.35 1.27<br />
1.404<br />
Minor Artery 1.27 1.24 1.17 1.08 1.01 1.154<br />
Collector 1.12 1.08 1.07 0.78 0.78 0.966<br />
Local Road 1.69 1.48 1.42 1.29 1.24 1.424<br />
Total Urban 1.20 1.17 1.09 1.01 0.98 1.09<br />
Overall U.S. Fatality Rate 1.73 1.69 1.65 1.57 1.55 1.638<br />
Source: Table FL-1, “motor Vehicle Traffic Fatalities and Injuries by Functional System and Federal-Aid Highways,”<br />
FHWA Highway Statistics, 1995, 1996,1997,1998,1999 and Tables VM-2 “Functional System Travel –<br />
1998” and Table FL-20, “Persons Fatally Injured in Motor Vehicle Crashes – 1998,” FHWA 1999 Highway<br />
Statistics.<br />
Note: Rates based on vehicle miles traveled estimates reported by State Highway agencies to the FHWA; fatality<br />
date are from NHTSA FARS<br />
FHWA SAFETY- Nov. 2000<br />
E - 1
Appendix F - Virginia Department of Transportation’s<br />
Web Page<br />
Highway Helpline Condition Report<br />
F - 1
Appendix G - References<br />
List of References<br />
Cottrell, Ben. “Improving Night Work Zone Traffic Control,” Virginia Transportation Research<br />
Council, August 1999<br />
Cogburn, Perry. Director VDOT Emergency Operations Center. Conversation on April 2, 2002<br />
Federal Highway Administration, United States Department of Transportation, Conditions and<br />
Performance Executive Summary, System and Usage Characteristics: Highway and Bridge,<br />
1999, http://www.fhwa.dot.gov/////policy/1999cpr/es/cpes_03.htm Accessed April 17, 2002<br />
Griffith, Michael S. HSIS – Highway Safety Information System. What is HSIS? Turner-<br />
Fairbank Highway Research Center, http://www.hsrc.unc.edu/hsis/index.cfm?num=1,<br />
Accessed March 27, 2002<br />
Highway Statistics Series, US Department of Transportation, Federal Highway Administration<br />
http://www.fhwa.dot.gov/ohim/ohimstat.htm<br />
Kasel, Carol. Road Construction Dangers, Rocky Mountain News.com<br />
http://www.rockymountainnews.com/drmn/local/article/0,1299,DRMN_15_1069961,00.html<br />
Accessed on April 20, 2002<br />
Kentucky Department of Transportation. The Path: Kentucky Transportation Cabinet<br />
Performance Report 2001.<br />
Kentucky Transportation Cabinet Office of Quality (2001). Path to Progress, Performance<br />
Report 2001, Frankfort, KY.<br />
Management Services Division, Virginia Department of Transportation, Commonwealth<br />
Transportation Board Handbook, Revised January 7, 2000,<br />
http://0501comsd1/ctb/CTB%20Handbook.pdf, Accessed April 17, 2002<br />
MCMXCVII Kaset International and Performance Research Associates, Inc., Managing<br />
Extraordinary Service, Third Edition – TXT979/1 V.3.0 5/99, 1989<br />
Miller, John. Virginia Transportation Research Council. What Value May Geographic<br />
Information Systems Add to the Art of Identifying Crash Countermeasures?<br />
http://www.virginiadot.org/vtrc/briefs/99-r13rb/Gis_Crash.htm, Accessed April 3, 2002<br />
North Carolina Department of Transportation. Roadway Safety Foundation-Roadway Safety<br />
Guide.<br />
G - 1
Pennsylvania Department of Transportation. PennDOT Business Plan, Fiscal Year 2002-2003,<br />
Harrisburg, PA. 2002<br />
Pennsylvania Performance Improvement and Metrics Division. PennDOT 2001 County<br />
Maintenance Customer <strong>Satisfaction</strong> Survey, Harrisburg PA. 2001<br />
Rush, Dave. State Safety Engineer. VDOT, Traffic Engineering Division. Conversation on<br />
April 25, 2002<br />
South Dakota Department of Transportation (1999). South Dakota DOT 1999 Customer<br />
<strong>Satisfaction</strong> Assessment, Pierre, SD<br />
Stevens, Mark. Extreme Management: What They Teach at Harvard Business School’s<br />
Advanced Management Program. New York, NY: Warner Books, Inc. 2001<br />
United State General Accounting Office ACTION PLAN: How GAO Will Strengthen Its<br />
<strong>Strategic</strong> Planning Process.2002). http://www.gao.gov/sp.html, Accessed April 15, 2002<br />
United States Department of Transportation, Federal Highway Administration, “Public Road<br />
Length, Miles-1998 by Ownership”, Table HM-10<br />
http://www.fhwa.dot.gov/////ohim/hs98/tables/hm10.pdf, Accessed April 15, 2002<br />
United State General Accounting Office. ACTION PLAN: How GAO Will Strengthen Its<br />
<strong>Strategic</strong> Planning Process. http://www.gao.gov/sp.html, accessed on April 9, 2002<br />
<strong>University</strong> of Virginia, Center for Survey Research. “Report of Statewide Results 2001 – VDOT<br />
Customer <strong>Satisfaction</strong> Survey.” November 2001<br />
US Department of Transportation, Federal Highway Administration. “Moving Ahead: The<br />
American Public Speaks on Roadways and Transportation in Communities.” February 1,<br />
2001<br />
US Department of Transportation, Federal Highway Administration. “Work Zone Traffic<br />
Management Synthesis: Use of Rumble Strips in Work Zones.” Federal Highway<br />
Administration Report # FHWA-TS-89-037, July 1989<br />
Virginia Department of Transportation. “<strong>Strategic</strong> Plan for the 2002 – 2004 Biennium”, January<br />
10, 2002<br />
Virginia Department of Transportation. “VDOT Earns National Award For Excellence<br />
in E-Emergency Management.” http://www.virginiadot.org/infoservice/news/CO05042001vois.asp,<br />
Accessed March 5, 2002<br />
G - 2
Appendix H - About the Authors<br />
<strong>George</strong> <strong>Mason</strong> <strong>University</strong>, Transportation Policy, Operations and Logistics Students<br />
Abingdon, Virginia<br />
Deborah Atkins-Vance graduated in 1996 with a Bachelor of Science in Civil Engineering Technology<br />
from Bluefield State College. She was employed by Virginia Department of Transportation in 1996 and<br />
promoted to Engineer in Training in 1997. She is now the head of the Equal Opportunity Division at the<br />
Bristol District.<br />
William Lester graduated in 1992 with a Bachelor of Science in Construction Engineering Technology<br />
from East Tennessee State <strong>University</strong>. He was employed in 1993 by the Virginia Department of<br />
Transportation’s Materials Division in the Bristol District, and is currently in charge of materials finals.<br />
He obtained his Engineer in Training Certification in 1993 and will sit for the PE exam in October of<br />
2002.<br />
Glenn G. Wilson, Jr. graduated in 1987 with a Bachelor of Arts from Emory & Henry College. He is a<br />
ten-year veteran of Virginia Department of Transportation’s field maintenance operations in the<br />
Abingdon and Wytheville Residencies. Glenn recently was promotion to Associate Engineer in the<br />
department’s Engineer Development Program.<br />
Arlington, Virginia<br />
Lori Barnhill graduated in 1984 with a Bachelor of Science in Business Computation from Wright State<br />
<strong>University</strong>. She currently serves in the Washington Headquarters Service under the Office of the<br />
Secretary of Defense. Ms. Barnhill has 10 years of experience with logistics inside the Department of<br />
Defense and over 15 years experience with the application of Dr. W.E. Deming's principles inside state<br />
governments and fortune 500 companies.<br />
Dean Fezza graduated in 2000 with a Bachelor of Science in Marine Transportation from the U.S.<br />
Merchant Marine Academy. He is a Senior Consultant with Booz Allen Hamilton where he serves as the<br />
transportation SME for Booz Allen's Maritime enterprise Logistics Group, primarily working with U.S.<br />
Navy clients.<br />
Cynthia Porter graduated in 1993 with a Bachelor of Arts in Government and Politics from <strong>George</strong><br />
<strong>Mason</strong> <strong>University</strong>. She works as a consultant for Keane Federal Systems and serves as a Senior Data<br />
Analyst at the U.S. Department of Transportation, Bureau of Transportation Statistics, and Office of<br />
Airline Information. She provides the U.S. government, DOT, and organizations such as Congress and<br />
Universities with uniform and comprehensive financial and traffic statistical data on airline operations<br />
and the air transportation industry.<br />
Nishit Sahay graduated in 1987 with as a Master’s degree in Experimental Nuclear Physics from the<br />
Center of Advance Research in Physics & Astrophysics, <strong>University</strong> of Delhi, India and in 1996 with a<br />
Master’s degree in International Trade & Commerce from Indian Institute of Foreign trade (IIFT) New<br />
Delhi, India. He is an entrepreneur and has over ten years of experience in International trade &<br />
Commerce. He has worked in consumer Electronics Company and undertaken exports in South East<br />
Asian Countries.<br />
H - 1
Dione Sharmin graduated in 1994 with a Bachelor of Arts Degree in English from <strong>George</strong> <strong>Mason</strong><br />
<strong>University</strong>. She works as a consultant and currently provides logistics support to the Naval Sea Systems<br />
Command. She is helping to ensure that life cycle support is established and in place for the new<br />
amphibious ship class, LPD 17 USS San Antonio, prior to ship delivery.<br />
Dennis Walsh graduated in 1988 with a Bachelor of Science Degree of Civil Engineering Technology<br />
from the <strong>University</strong> of Pittsburgh/Johnstown. He works for the Federal Aviation Administration in the<br />
Planning and Programming Division, which oversees the federal funding program for airport planning<br />
and development projects.<br />
Richmond, Virginia<br />
Rick Barnett graduated in 1985 with a Bachelor’s Degree in Business Administration from Marshall<br />
<strong>University</strong>, Huntington, West Virginia. He has worked for the Virginia Department of Transportation for<br />
15 years and currently works as a Policy Analyst in the Construction and External Audit Division of<br />
VDOT.<br />
Robert A. Donovan graduated in 1980 with a Bachelor’s Degree in Engineering from Manhattan College,<br />
Riverdale, New York. Additionally he has 14 years experience in land-development projectmanagement,<br />
five years as Army military officer on active duty, and three years with VDOT as a<br />
Drainage Engineer. He is a licensed professional engineer in New York and Virginia.<br />
Marsha Fiol graduated in 1989 with a Bachelor’s of Science Degree in Business Administration and a<br />
minor in Finance from Austin Peay State <strong>University</strong>, Clarksville, Tennessee. She has 15 years experience<br />
with the Virginia Department of Transportation in both the field (District) and Central Office in the<br />
Traffic Engineering, Secondary Roads, and Transportation Planning Divisions. Currently, she is a<br />
Principal Transportation Engineer who manages the Statewide and Special Programs Section of VDOT's<br />
Transportation Planning Division.<br />
Travis Glenn graduated in 2000 with a Bachelor of Science Degree in Business Administration from<br />
Virginia Union <strong>University</strong>. He works at the Virginia Department of Transportation as an Engineer<br />
Design Technician/Technical Analyst who drafts, designs, and evaluates traffic control devices that can<br />
be used on state highway projects for construction. He has received training in Value Engineering and is<br />
certified in Specification and Construction Writing, Geometric Design, and Intelligent Transportation<br />
Systems.<br />
Chad Tucker graduated in 1998 with a Bachelor of Science in Urban Studies and Planning from Virginia<br />
Commonwealth <strong>University</strong>. He began working in the Virginia Department of Transportation’s Planning<br />
Division in 1999 and is responsible long-range transportation planning activities in the northern Staunton<br />
Construction District.<br />
Guy Tudor graduated in 1981 with a Bachelor of Science Degree in Civil Engineering from Virginia<br />
Tech. He currently works as the District Hydraulic Engineer for the Staunton District of the Virginia<br />
Department of Transportation. Previously, Guy has spent 15 years working in the private sector as a<br />
Project and Consultant Engineer on municipal and land development projects. He is licensed as a<br />
Professional Engineer and a Land Surveyor in the Commonwealth of Virginia.<br />
H - 2