Fehr and Peers Training Presentation - Regional Air Quality Council
Fehr and Peers Training Presentation - Regional Air Quality Council
Fehr and Peers Training Presentation - Regional Air Quality Council

You also want an ePaper? Increase the reach of your titles
YUMPU automatically turns print PDFs into web optimized ePapers that Google loves.
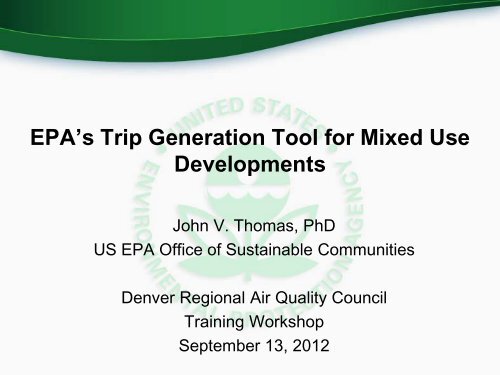
EPA’s Trip Generation Tool for Mixed Use<br />
Developments<br />
John V. Thomas, PhD<br />
US EPA Office of Sustainable Communities<br />
Denver <strong>Regional</strong> <strong>Air</strong> <strong>Quality</strong> <strong>Council</strong><br />
<strong>Training</strong> Workshop<br />
September 13, 2012
Introduction
EPA MXD Trip Generation Tool<br />
• St<strong>and</strong>ard method overstates traffic impact<br />
of walkable mixed use development<br />
• MXD tool is research-based alternative<br />
• ITE advisory committee provided input<br />
• Adopted by SANDAG <strong>and</strong> Virginia DOT as<br />
new st<strong>and</strong>ard method for traffic studies<br />
• Used in traffic impact studies in CA, WA<br />
<strong>and</strong> other western states
Takes user inputs…<br />
• Size of a development or<br />
redevelopment site<br />
• Demographics<br />
• Amount of development<br />
by l<strong>and</strong> use category<br />
• Intersection density<br />
• Destinations within<br />
walking distance of site<br />
• Destinations within a 30<br />
minute transit trip<br />
What does the tool do?<br />
Quantifies their impact on…<br />
• Number of vehicle trips<br />
that stay on site<br />
• Vehicle Trips that go off<br />
site but are made on foot<br />
• Vehicle Trips that go off<br />
site but are made by<br />
transit
Research Foundation for the Tool<br />
• 6 regions: Seattle, Portl<strong>and</strong>, Sacramento, Houston,<br />
Atlanta, Boston<br />
– 240 mixed use sites<br />
– 30,000 trip records to or from those locations<br />
– Urban form data for each site<br />
• Validated against actual traffic counts from 25 sites<br />
– Also validated against traffic counts from 20 “smart growth<br />
opportunity areas” in San Diego region<br />
• Published research in a peer reviewed journal<br />
– ASCE Journal of Urban Planning <strong>and</strong> Development
Free Version Available for Download<br />
http://www.epa.gov/smartgrowth/mxd_tripgeneration.html
LAND USE AND AIR QUALITY - SIP CREDIT THROUGH BASELINE<br />
ADJUSTMENT APPROACH<br />
EPA<br />
Grant <strong>and</strong><br />
Support<br />
Neighborhood <strong>and</strong><br />
Corridor<br />
Analyses/Scenarios<br />
(Scenario Planning<br />
Models)<br />
Plausible /<br />
Certainty<br />
Additional<br />
Approaches<br />
<strong>and</strong><br />
Adjustments<br />
<strong>Regional</strong> Scale<br />
Analyses/Scenarios<br />
(Focus Model)<br />
Calculate<br />
VMT<br />
Reduction<br />
for New<br />
Baseline<br />
<strong>Regional</strong> <strong>Air</strong><br />
<strong>Quality</strong> Model<br />
Calculate<br />
Emission<br />
Reductions
Neighborhood <strong>and</strong><br />
Corridor<br />
Analyses/Scenarios<br />
(Scenario Planning<br />
Models)<br />
• Transit Oriented Development<br />
• Local L<strong>and</strong> Use Tools<br />
•zoning code changes, design<br />
<strong>and</strong> subdivision regulations,<br />
parking requirements<br />
•Corridor Plans<br />
•Changes in Transit Capacity<br />
Additional<br />
Approaches<br />
<strong>and</strong><br />
Adjustments<br />
<strong>Regional</strong> Scale<br />
Analyses/Scenarios<br />
(Focus Model)<br />
•Urban Growth Boundaries<br />
•Community L<strong>and</strong> Trusts<br />
•Purchase or Transfer of Development<br />
Rights / Conservation Easements<br />
•Changes in Transit Capacity<br />
•Changes in Planned Transit Stations<br />
•Community L<strong>and</strong> Trusts<br />
•Purchase or Transfer of<br />
Development Rights/Conservation<br />
Easements<br />
•Car Sharing<br />
•Employer Travel Reduction<br />
•Electric Vehicles
The Broader Context<br />
Where Does the Tool Fit Alongside Other Models / Tools?
Types of Scenario Planning Tools<br />
• Forecasting Models<br />
– e.g. Economic, Travel Dem<strong>and</strong>, L<strong>and</strong> Use, <strong>Air</strong><br />
<strong>Quality</strong> <strong>and</strong> Water <strong>Quality</strong><br />
• GIS Based L<strong>and</strong> Use Scenario Tools<br />
• Spreadsheet Tools
Level of Sophistication<br />
Range of options that can be feasibly tested<br />
Spreadsheet Tools<br />
GIS Based Sketch Planning Tools<br />
<strong>Regional</strong> Travel Dem<strong>and</strong><br />
L<strong>and</strong> Use <strong>and</strong><br />
<strong>Air</strong> <strong>Quality</strong> Models
GIS Based Scenario Planning Tools<br />
• Urban Footprint<br />
– Envision Bay Area, California High Speed Rail<br />
Planning<br />
• Envision Tomorrow<br />
– Envision Utah, Southern California<br />
Association of Governments, Superstition<br />
Vistas (AZ)<br />
• i-Places<br />
– Sacramento <strong>Regional</strong> Blueprint<br />
• INDEX<br />
– Atlantic Station, Redwood City, CA<br />
• CommunityViz<br />
– Cape Cod Climate Change Scenario<br />
Planning, San Diego <strong>Regional</strong><br />
Transportation Plan<br />
https://www.lincolninst.edu/pubs/dl/2027_1352_Opening%2<br />
0Access%20to%20Scenario%20Planning%20Tools.pdf
Typical Steps- Envision Tomorrow<br />
Source – Fregonese <strong>and</strong> Associates, (Envision Tomorrow)
Example – Traditional Transportation Indicators<br />
Source: Sacramento <strong>Regional</strong> Blueprint (2010) Blueprint’s Impact on the Region <strong>and</strong> Resident’s <strong>Quality</strong> of Life
Block Scale Indicators – Proximity to Parks<br />
Source: Criterion Planners, (INDEX)
Financial Indicators- Market Feasibility<br />
Source: SACOG, (iPLACES)
Application Examples
White Flint Sector Plan, Montgomery County, MD
Proposed Redevelopment<br />
Source: Montgomery County, White Flint Sector Plan
White Flint Current Street Conditions
Proposed Boulevard Redesign<br />
Source: Glatting Jackson, White Flint Partnership
Site Level -<br />
Scale & Mix of L<strong>and</strong> Use<br />
• Improved Jobs Housing<br />
Balance<br />
• Large Scale Project<br />
– Greater chance of trip origin<br />
<strong>and</strong> destination match<br />
• Lots of Destinations within<br />
Walking Distance<br />
=<br />
Annual Reduction of<br />
8,678 M Tons of CO2<br />
Source: EPA White Paper: The Placemaking Premium<br />
(2007) Illustrations Dover Kohl & Partners<br />
Source: Glatting Jackson, White Flint Partnership
Pedestrian Connectivity <strong>and</strong><br />
Increased Walking in Project Area<br />
• More than 3x as many<br />
intersections<br />
• Smaller block size<br />
• Lower traffic volume on key<br />
streets<br />
=<br />
Annual Reduction of<br />
6,889 M Tons CO2
Neighborhood Destinations<br />
<strong>and</strong> Transit Accessibility<br />
• 18,000 jobs within 1 Mile<br />
=<br />
Annual Reduction of<br />
3,489 M Tons CO2<br />
• 678,000 jobs w/in 30<br />
Min. Transit Trip<br />
=<br />
Annual Reduction of<br />
5,072 M Tons CO2<br />
M<br />
M<br />
M<br />
M<br />
M
Two Sites Selected for Denver Pilot
TABLE 1. MXD PLANNED INPUTS FOR DENVER FEDERAL CENTER SITE<br />
Input Variable Input<br />
Value<br />
Source<br />
Developed Area (in acres) 894 Calculated in GIS<br />
Number of Intersections 53 Based on Federal Center Site Plan Study (2008)<br />
Transit Available Yes<br />
Proportion of households within ¼<br />
mile of a transit stop<br />
100%<br />
Central Business District or TOD? Yes<br />
Employment within one mile of<br />
MXD<br />
17,405<br />
Employment within a 30 minute<br />
Transit Trip (Door-to-door)<br />
54,146<br />
DRCOG 2035 <strong>Regional</strong> Model<br />
Total <strong>Regional</strong> Employment 1,351,473<br />
Average Household (HH) Size for 3.2<br />
Single Family Dwelling Units<br />
Average Household (HH) Size for<br />
Multi-family Dwelling Units<br />
2.5<br />
Project Estimate<br />
Average HH Size Near Site 2.08<br />
Average Vehicles Owned per<br />
Dwelling Unit Near Site<br />
1.60<br />
2000 Census<br />
Multi-family Dwelling Units 2104 Proposed Campus Development Program by District<br />
General Retail (1000 sq. ft.) 212 from Denver Federal Center Site Plan Study (2008) /<br />
Non Medical Office (1000 sq. ft.) 2193 Existing <strong>and</strong> Future Employment <strong>and</strong> Residences within<br />
Medical Office (1000 sq. ft.) 1050 the Union Boulevard Corridor from Union Boulevard<br />
Hotel Rooms 200<br />
Corridor Connectivity Plan (2011)/<br />
Planned Development along the West Corridor from<br />
Connecting the West Corridor Communities: An<br />
Implementation Strategy for TOD along the Denver<br />
Region’s West Corridor (2011)
TABLE 2. MXD MODEL INPUTS FOR BRIGHTON BLVD SITE<br />
Input Variable Input Value Source<br />
Developed Area (in acres) 138 Calculated in GIS<br />
Number of Intersections 23 Calculated in GIS based on existing road network<br />
Transit Available Yes<br />
Proportion of households within ¼<br />
mile of a transit stop<br />
100%<br />
Central Business District or TOD? Yes<br />
Employment within one mile of<br />
MXD<br />
25,476<br />
Employment within a 30 minute<br />
Transit Trip (Door-to-door)<br />
106,243<br />
Total <strong>Regional</strong> Employment 1,351,473<br />
Average Household (HH) Size for<br />
Single Family Dwelling Units<br />
3.2<br />
Average Household (HH) Size for<br />
Multi-family Dwelling Units<br />
2.5<br />
Average HH Size Near Site 2.27<br />
Average Vehicles Owned per<br />
Dwelling Unit Near Site<br />
1.5<br />
Single Family Dwelling Units 30<br />
Multi-family Dwelling Units 720<br />
General Retail (1000 sq. ft.) 41<br />
Non Medical Office (1000 sq. ft.) 285<br />
DRCOG 2035 <strong>Regional</strong> Model<br />
Project Estimate<br />
2000 Census<br />
Medium Density Development Scenario from Brighton<br />
Corridor Design Guidelines (2008)
Four Test Scenarios<br />
Scenario 1: Planned L<strong>and</strong> Use<br />
Scenario 2: Double Planned L<strong>and</strong> Use<br />
Scenario 3: More Residential <strong>and</strong> Less Commercial<br />
Scenario 4: Less Residential <strong>and</strong> More Commercial
TABLE 5. DENVER FEDERAL CENTER MXD DAILY TRIP GENERATION AND VMT ESTIMATES*<br />
ITE External Vehicle Daily Trips<br />
MXD External Vehicle Daily<br />
Adjusted Trips<br />
Scenario 1:<br />
Planned L<strong>and</strong><br />
Use<br />
Scenario 2:<br />
Double Planned<br />
L<strong>and</strong> Use<br />
Scenario 3: More<br />
Residential <strong>and</strong><br />
Less Commercial<br />
Scenario 4: Less<br />
Residential <strong>and</strong><br />
More Commercial<br />
77,892 146,655 48,409 121,031<br />
64,113 118,959 36,940 106,456<br />
MXD Reduction in External<br />
Vehicle Trips 18% 19% 22% 12%<br />
MXD Internal capture 13% 13% 17% 8%<br />
MXD External Walk / Bike 3% 4% 4% 2%<br />
MXD External Transit 3% 3% 2% 3%<br />
ITE Daily VMT 292,103 549,785 172,263 460,167<br />
MXD Daily Adjusted VMT 244,495 454,401 137,488 408,482<br />
MXD Reduction in Daily VMT 16% 17% 20% 11%<br />
*VMT reflects half the VMT associated with total trips as other areas would be responsible for the other half<br />
Source: <strong>Fehr</strong> & <strong>Peers</strong>, August 2011
TABLE 6. BRIGHTON BLVD MXD DAILY TRIP GENERATION AND VMT ESTIMATES*<br />
Scenario 1:<br />
Planned L<strong>and</strong><br />
Use<br />
Scenario 2:<br />
Double Planned<br />
L<strong>and</strong> Use<br />
Scenario 3: More<br />
Residential <strong>and</strong><br />
Less Commercial<br />
Scenario 4: Less<br />
Residential <strong>and</strong><br />
More Commercial<br />
ITE External Vehicle Daily Trips 11,622 20,565 18,226 12,092<br />
MXD External Vehicle Daily<br />
Adjusted Trips 8,747 15,029 13,999 10,484<br />
MXD Reduction in External<br />
Vehicle Trips 25% 27% 23% 13%<br />
MXD Internal capture 12% 12% 9% 5%<br />
MXD External Walk / Bike 10% 11% 10% 4%<br />
MXD External Transit 5% 5% 5% 4%<br />
ITE Daily VMT 37,611 66,293 56,600 40,555<br />
MXD Daily Adjusted VMT 28,651 49,306 44,073 35,340<br />
MXD Reduction in Daily VMT 24% 26% 22% 13%<br />
*VMT reflects half the VMT associated with total trips as other areas would be responsible for the other half<br />
Source: <strong>Fehr</strong> & <strong>Peers</strong>, August 2011
Transit Ridership: RTD Ridership Model<br />
Boardings<br />
3,000<br />
2,500<br />
2,000<br />
1,500<br />
1,000<br />
500<br />
0<br />
Federal Center Projected Station Boardings<br />
453<br />
561<br />
363<br />
595 608 608<br />
1274 1283 1283<br />
561<br />
454<br />
1180<br />
Scenario 1 Scenario 2 Scenario 3 Scenario 4<br />
PM Peak<br />
Boardings<br />
Off-Peak Boardings<br />
AM Peak<br />
Boardings
MXD Tool Video<br />
• Is it too long, too short, or just about right for<br />
conveying this concept?<br />
• Are there any areas where you would like to see<br />
more (or less) information?<br />
• What do you think about the overall production style<br />
(e.g. music, narration, transitions)?<br />
• Do you have related content we could integrate to<br />
enhance the quality of the presentation?<br />
http://youtu.be/EtsgVavFIik