Anthony Catalano - EEWeb
Anthony Catalano - EEWeb
Anthony Catalano - EEWeb

Create successful ePaper yourself
Turn your PDF publications into a flip-book with our unique Google optimized e-Paper software.
PROJECT<br />
mathematical description might be possible for one or<br />
two of these processes, the complex overlapping and<br />
interdependence of the processes makes it impossible<br />
at this time.<br />
Standards: LM-80 and TM-21<br />
The Illumination Engineering Society (IES) has<br />
developed standards for testing LEDs so performance<br />
and reliability can be characterized in a consistent<br />
fashion to assess their practical life. One standard,<br />
LM-80, provides a description of the method to be used<br />
in determining the “Lumen Maintenance” of LEDs, that<br />
is the light output as a function of time. The essential<br />
features specified by the testing protocol are:<br />
• Ambient and LED Case Temperature and Orientation<br />
• Drive Voltage, Current and Waveform<br />
• Instrumentation<br />
The standard calls for measurement of light output<br />
at an ambient air temperature of 25 o C, but LED case<br />
temperatures of 55 o C, 85 o C and another temperature<br />
selected by the manufacturer. The drive current is<br />
specified by the manufacturer as this varies with the<br />
die area of the LED. Measurements take place over a<br />
minimum of 6000 hrs of operation (10,000 hrs is preferred)<br />
and at intervals of at most 1000 hrs. It is common practice<br />
among first-tier manufacturers to employ several different<br />
drive currents. As we shall see later this is very important<br />
to our method of ensuring LED lifetime.<br />
Although LM-80 provides a uniform method for measuring<br />
light output over time under standardized conditions, in<br />
practice LEDs may be used at temperatures that differ<br />
substantially from the LM-80 values. Moreover, because<br />
this is not an accelerated testing method, very long times<br />
are needed to reach a conclusion on reliability. Another<br />
more recent IES Standard, TM-21 helps solve this<br />
dilemma. The standard is effectively an “ad hoc” model<br />
of LED degradation that allows the interpolation of timetemperature<br />
data between temperatures and formalizes<br />
the extrapolation of data into the future to predict output<br />
over extended times. The major points of the standard<br />
are:<br />
• Exponential Decrease in Light Output (LOP) is<br />
assumed<br />
• LOP May be Extrapolated Maximum of 6x in Time<br />
• Interpolation Between Temperatures Are Based on<br />
“Activation Energy”<br />
In mathematical terms the decrease in light output can<br />
be stated as,<br />
L(t) B[e ]<br />
t -a<br />
=<br />
where L(t) is the Lumen output at time t, B is the<br />
normalized light output at 0 or 1 hours, and α is the<br />
decay rate, which is a function of temperature. The value<br />
of α varies with temperature according to the Arrehenius<br />
expression,<br />
a(T)<br />
= Ce<br />
<strong>EEWeb</strong> | Electrical Engineering Community Visit www.eeweb.com 12<br />
E /kT a -<br />
where Ea is the activation energy, k is Boltzmann’s<br />
constant and T is the temperature in degrees Kelvin, and<br />
C is a constant. The TM-21 standard only allows for the<br />
interpolation of temperature data, so for two temperatures<br />
T 1 and T 2 we can calculate the activation factor, E a /k as,<br />
a1<br />
ln[ a2<br />
] Ea<br />
= ( )<br />
1 1 k<br />
[ - ]<br />
T2<br />
T1<br />
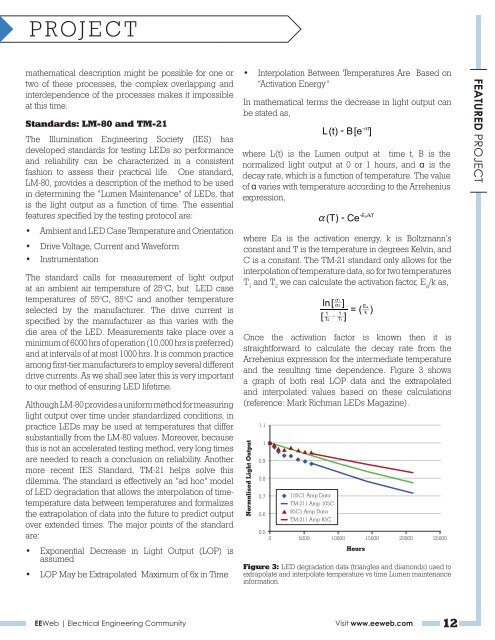
Once the activation factor is known then it is<br />
straightforward to calculate the decay rate from the<br />
Arrehenius expression for the intermediate temperature<br />
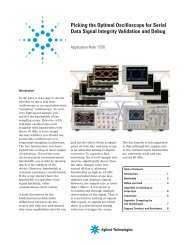
and the resulting time dependence. Figure 3 shows<br />
a graph of both real LOP data and the extrapolated<br />
and interpolated values based on these calculations<br />
(reference: Mark Richman LEDs Magazine).<br />
Normalised Light Output<br />
1.1<br />
1<br />
0.9<br />
0.8<br />
0.7<br />
0.6<br />
105C1 Amp Data<br />
TM-211 Amp 105C<br />
85C1 Amp Data<br />
TM-211 Amp 85C<br />
0.5<br />
0 5000 10000 15000 20000 25000<br />
Hours<br />
Figure 3: LED degradation data (triangles and diamonds) used to<br />
extrapolate and interpolate temperature vs time Lumen maintenance<br />
information.<br />
FEATURED PROJECT