Curbing Cars: - Transportation Alternatives
Curbing Cars: - Transportation Alternatives
Curbing Cars: - Transportation Alternatives

Create successful ePaper yourself
Turn your PDF publications into a flip-book with our unique Google optimized e-Paper software.
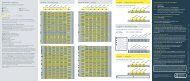
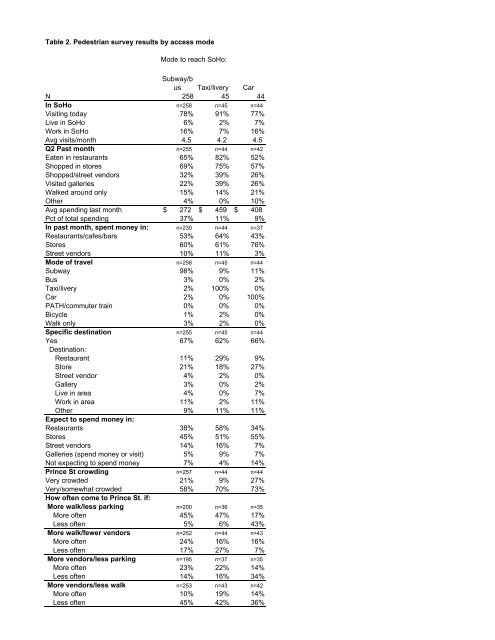
Table 2. Pedestrian survey results by access mode<br />
Mode to reach SoHo:<br />
Subway/b<br />
us Taxi/livery Car<br />
N 258 45 44<br />
In SoHo n=258 n=45 n=44<br />
Visiting today 78% 91% 77%<br />
Live in SoHo 6% 2% 7%<br />
Work in SoHo 16% 7% 16%<br />
Avg visits/month 4.5 4.2 4.5<br />
Q2 Past month n=255 n=44 n=42<br />
Eaten in restaurants 65% 82% 52%<br />
Shopped in stores 69% 75% 57%<br />
Shopped/street vendors 32% 39% 26%<br />
Visited galleries 22% 39% 26%<br />
Walked around only 15% 14% 21%<br />
Other 4% 0% 10%<br />
Avg spending last month $ 272 $ 459 $ 408<br />
Pct of total spending 37% 11% 9%<br />
In past month, spent money in: n=230 n=44 n=37<br />
Restaurants/cafes/bars 53% 64% 43%<br />
Stores 60% 61% 76%<br />
Street vendors 10% 11% 3%<br />
Mode of travel n=258 n=45 n=44<br />
Subway 98% 9% 11%<br />
Bus 3% 0% 2%<br />
Taxi/livery 2% 100% 0%<br />
Car 2% 0% 100%<br />
PATH/commuter train 0% 0% 0%<br />
Bicycle 1% 2% 0%<br />
Walk only 3% 2% 0%<br />
Specific destination n=255 n=45 n=44<br />
Yes<br />
Destination:<br />
67% 62% 66%<br />
Restaurant 11% 29% 9%<br />
Store 21% 18% 27%<br />
Street vendor 4% 2% 0%<br />
Gallery 3% 0% 2%<br />
Live in area 4% 0% 7%<br />
Work in area 11% 2% 11%<br />
Other<br />
Expect to spend money in:<br />
9% 11% 11%<br />
Restaurants 38% 58% 34%<br />
Stores 45% 51% 55%<br />
Street vendors 14% 16% 7%<br />
Galleries (spend money or visit) 5% 9% 7%<br />
Not expecting to spend money 7% 4% 14%<br />
Prince St crowding n=257 n=44 n=44<br />
Very crowded 21% 9% 27%<br />
Very/somewhat crowded<br />
How often come to Prince St. if:<br />
58% 70% 73%<br />
More walk/less parking n=200 n=36 n=35<br />
More often 45% 47% 17%<br />
Less often 5% 6% 43%<br />
More walk/fewer vendors n=252 n=44 n=43<br />
More often 24% 16% 16%<br />
Less often 17% 27% 7%<br />
More vendors/less parking n=195 n=37 n=35<br />
More often 23% 22% 14%<br />
Less often 14% 16% 34%<br />
More vendors/less walk n=253 n=43 n=42<br />
More often 10% 19% 14%<br />
Less often 45% 42% 36%