Curbing Cars: - Transportation Alternatives
Curbing Cars: - Transportation Alternatives
Curbing Cars: - Transportation Alternatives

You also want an ePaper? Increase the reach of your titles
YUMPU automatically turns print PDFs into web optimized ePapers that Google loves.
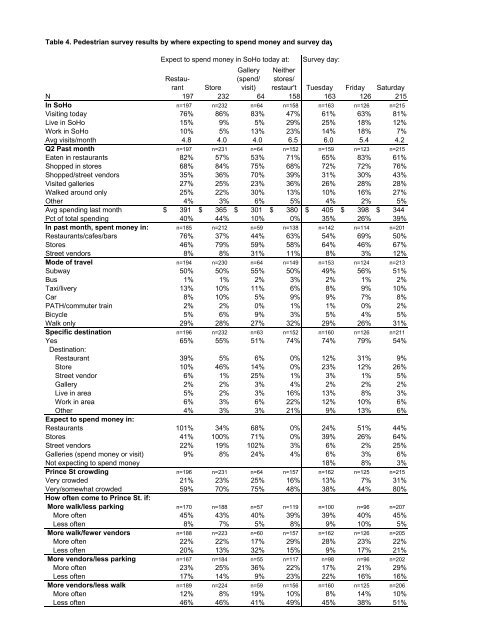
Table 4. Pedestrian survey results by where expecting to spend money and survey day<br />
Expect to spend money in SoHo today at: Survey day:<br />
Gallery<br />
(spend/<br />
visit)<br />
Neither<br />
stores/<br />
restaur't Tuesday Friday Saturday<br />
Restaurant<br />
Store<br />
N 197 232 64 158 163 126 215<br />
In SoHo n=197 n=232 n=64 n=158 n=163 n=126 n=215<br />
Visiting today 76% 86% 83% 47% 61% 63% 81%<br />
Live in SoHo 15% 9% 5% 29% 25% 18% 12%<br />
Work in SoHo 10% 5% 13% 23% 14% 18% 7%<br />
Avg visits/month 4.8 4.0 4.0 6.5 6.0 5.4 4.2<br />
Q2 Past month n=197 n=231 n=64 n=152 n=159 n=123 n=215<br />
Eaten in restaurants 82% 57% 53% 71% 65% 83% 61%<br />
Shopped in stores 68% 84% 75% 68% 72% 72% 76%<br />
Shopped/street vendors 35% 36% 70% 39% 31% 30% 43%<br />
Visited galleries 27% 25% 23% 36% 26% 28% 28%<br />
Walked around only 25% 22% 30% 13% 10% 16% 27%<br />
Other 4% 3% 6% 5% 4% 2% 5%<br />
Avg spending last month $ 391 $ 365 $ 301 $ 380 $ 405 $ 398 $ 344<br />
Pct of total spending 40% 44% 10% 0% 35% 26% 39%<br />
In past month, spent money in: n=185 n=212 n=59 n=138 n=142 n=114 n=201<br />
Restaurants/cafes/bars 76% 37% 44% 63% 54% 69% 50%<br />
Stores 46% 79% 59% 58% 64% 46% 67%<br />
Street vendors 8% 8% 31% 11% 8% 3% 12%<br />
Mode of travel n=194 n=230 n=64 n=149 n=153 n=124 n=213<br />
Subway 50% 50% 55% 50% 49% 56% 51%<br />
Bus 1% 1% 2% 3% 2% 1% 2%<br />
Taxi/livery 13% 10% 11% 6% 8% 9% 10%<br />
Car 8% 10% 5% 9% 9% 7% 8%<br />
PATH/commuter train 2% 2% 0% 1% 1% 0% 2%<br />
Bicycle 5% 6% 9% 3% 5% 4% 5%<br />
Walk only 29% 28% 27% 32% 29% 26% 31%<br />
Specific destination n=196 n=232 n=63 n=152 n=160 n=126 n=211<br />
Yes<br />
Destination:<br />
65% 55% 51% 74% 74% 79% 54%<br />
Restaurant 39% 5% 6% 0% 12% 31% 9%<br />
Store 10% 46% 14% 0% 23% 12% 26%<br />
Street vendor 6% 1% 25% 1% 3% 1% 5%<br />
Gallery 2% 2% 3% 4% 2% 2% 2%<br />
Live in area 5% 2% 3% 16% 13% 8% 3%<br />
Work in area 6% 3% 6% 22% 12% 10% 6%<br />
Other<br />
Expect to spend money in:<br />
4% 3% 3% 21% 9% 13% 6%<br />
Restaurants 101% 34% 68% 0% 24% 51% 44%<br />
Stores 41% 100% 71% 0% 39% 26% 64%<br />
Street vendors 22% 19% 102% 3% 6% 2% 25%<br />
Galleries (spend money or visit) 9% 8% 24% 4% 6% 3% 6%<br />
Not expecting to spend money 18% 8% 3%<br />
Prince St crowding n=196 n=231 n=64 n=157 n=162 n=125 n=215<br />
Very crowded 21% 23% 25% 16% 13% 7% 31%<br />
Very/somewhat crowded<br />
How often come to Prince St. if:<br />
59% 70% 75% 48% 38% 44% 80%<br />
More walk/less parking n=170 n=188 n=57 n=119 n=100 n=96 n=207<br />
More often 45% 43% 40% 39% 39% 40% 45%<br />
Less often 8% 7% 5% 8% 9% 10% 5%<br />
More walk/fewer vendors n=188 n=223 n=60 n=157 n=162 n=126 n=205<br />
More often 22% 22% 17% 29% 28% 23% 22%<br />
Less often 20% 13% 32% 15% 9% 17% 21%<br />
More vendors/less parking n=167 n=184 n=55 n=117 n=98 n=96 n=202<br />
More often 23% 25% 36% 22% 17% 21% 29%<br />
Less often 17% 14% 9% 23% 22% 16% 16%<br />
More vendors/less walk n=189 n=224 n=59 n=156 n=160 n=125 n=206<br />
More often 12% 8% 19% 10% 8% 14% 10%<br />
Less often 46% 46% 41% 49% 45% 38% 51%