Curbing Cars: - Transportation Alternatives
Curbing Cars: - Transportation Alternatives
Curbing Cars: - Transportation Alternatives

Create successful ePaper yourself
Turn your PDF publications into a flip-book with our unique Google optimized e-Paper software.
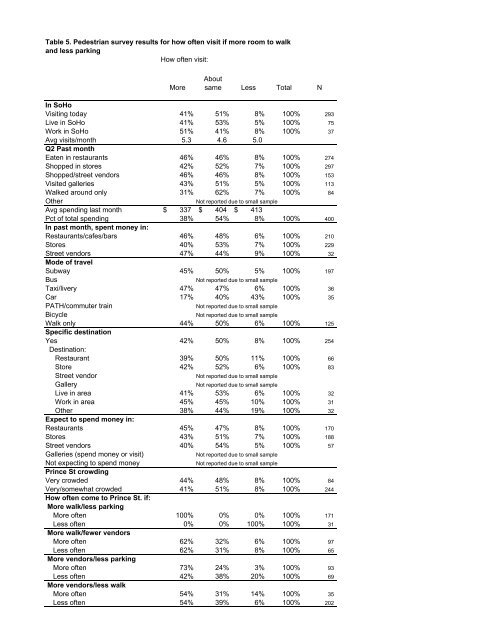
Table 5. Pedestrian survey results for how often visit if more room to walk<br />
and less parking<br />
How often visit:<br />
More<br />
About<br />
same Less Total N<br />
In SoHo<br />
Visiting today 41% 51% 8% 100% 293<br />
Live in SoHo 41% 53% 5% 100% 75<br />
Work in SoHo 51% 41% 8% 100% 37<br />
Avg visits/month<br />
Q2 Past month<br />
5.3 4.6 5.0<br />
Eaten in restaurants 46% 46% 8% 100% 274<br />
Shopped in stores 42% 52% 7% 100% 297<br />
Shopped/street vendors 46% 46% 8% 100% 153<br />
Visited galleries 43% 51% 5% 100% 113<br />
Walked around only 31% 62% 7% 100% 84<br />
Other Not reported due to small sample<br />
Avg spending last month $ 337 $ 404 $ 413<br />
Pct of total spending<br />
In past month, spent money in:<br />
38% 54% 8% 100% 400<br />
Restaurants/cafes/bars 46% 48% 6% 100% 210<br />
Stores 40% 53% 7% 100% 229<br />
Street vendors<br />
Mode of travel<br />
47% 44% 9% 100% 32<br />
Subway 45% 50% 5% 100% 197<br />
Bus Not reported due to small sample<br />
Taxi/livery 47% 47% 6% 100% 36<br />
Car 17% 40% 43% 100% 35<br />
PATH/commuter train Not reported due to small sample<br />
Bicycle Not reported due to small sample<br />
Walk only<br />
Specific destination<br />
44% 50% 6% 100% 125<br />
Yes<br />
Destination:<br />
42% 50% 8% 100% 254<br />
Restaurant 39% 50% 11% 100% 66<br />
Store 42% 52% 6% 100% 83<br />
Street vendor Not reported due to small sample<br />
Gallery Not reported due to small sample<br />
Live in area 41% 53% 6% 100% 32<br />
Work in area 45% 45% 10% 100% 31<br />
Other<br />
Expect to spend money in:<br />
38% 44% 19% 100% 32<br />
Restaurants 45% 47% 8% 100% 170<br />
Stores 43% 51% 7% 100% 188<br />
Street vendors 40% 54% 5% 100% 57<br />
Galleries (spend money or visit) Not reported due to small sample<br />
Not expecting to spend money<br />
Prince St crowding<br />
Not reported due to small sample<br />
Very crowded 44% 48% 8% 100% 84<br />
Very/somewhat crowded<br />
How often come to Prince St. if:<br />
More walk/less parking<br />
41% 51% 8% 100% 244<br />
More often 100% 0% 0% 100% 171<br />
Less often<br />
More walk/fewer vendors<br />
0% 0% 100% 100% 31<br />
More often 62% 32% 6% 100% 97<br />
Less often<br />
More vendors/less parking<br />
62% 31% 8% 100% 65<br />
More often 73% 24% 3% 100% 93<br />
Less often<br />
More vendors/less walk<br />
42% 38% 20% 100% 69<br />
More often 54% 31% 14% 100% 35<br />
Less often 54% 39% 6% 100% 202