Full press release - TNT
Full press release - TNT
Full press release - TNT
You also want an ePaper? Increase the reach of your titles
YUMPU automatically turns print PDFs into web optimized ePapers that Google loves.
PRESS RELEASE<br />
2 9 October 2012 Hoofddorp, The Netherlands<br />
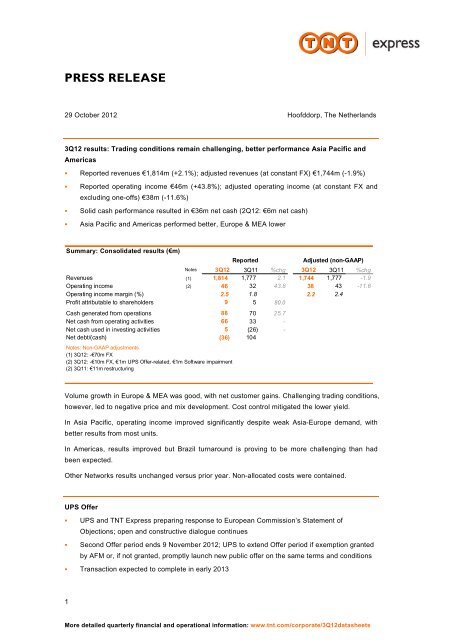
3Q12 results: Trading conditions remain challenging, better performance Asia Pacific and<br />
Americas<br />
Reported revenues €1,814m (+2.1%); adjusted revenues (at constant FX) €1,744m (-1.9%)<br />
Reported operating income €46m (+43.8%); adjusted operating income (at constant FX and<br />
excluding one-offs) €38m (-11.6%)<br />
Solid cash performance resulted in €36m net cash (2Q12: €6m net cash)<br />
Asia Pacific and Americas performed better, Europe & MEA lower<br />
Summary: Consolidated results (€m)<br />
Reported Adjusted (non-GAAP)<br />
Notes 3Q12 3Q11 %chg 3Q12 3Q11 %chg<br />
Revenues (1) 1,814 1,777 2.1 1,744 1,777 -1.9<br />
Operating income (2) 46 32 43.8 38 43 -11.6<br />
Operating income margin (%) 2.5 1.8 2.2 2.4<br />
Profit attributable to shareholders 9 5 80.0<br />
Cash generated from operations 88 70 25.7<br />
Net cash from operating activities 66 33 -<br />
Net cash used in investing activities 5 (26) -<br />
Net debt/(cash)<br />
Notes: Non-GAAP adjustments<br />
(1) 3Q12: -€70m FX<br />
(36) 104<br />
(2) 3Q12: -€10m FX, €1m UPS Offer-related, €1m Software impairment<br />
(2) 3Q11: €11m restructuring<br />
Volume growth in Europe & MEA was good, with net customer gains. Challenging trading conditions,<br />
however, led to negative price and mix development. Cost control mitigated the lower yield.<br />
In Asia Pacific, operating income improved significantly despite weak Asia-Europe demand, with<br />
better results from most units.<br />
In Americas, results improved but Brazil turnaround is proving to be more challenging than had<br />
been expected.<br />
Other Networks results unchanged versus prior year. Non-allocated costs were contained.<br />
UPS Offer<br />
UPS and <strong>TNT</strong> Ex<strong>press</strong> preparing response to European Commission’s Statement of<br />
Objections; open and constructive dialogue continues<br />
Second Offer period ends 9 November 2012; UPS to extend Offer period if exemption granted<br />
by AFM or, if not granted, promptly launch new public offer on the same terms and conditions<br />
Transaction expected to complete in early 2013<br />
1<br />
More detailed quarterly financial and operational information: www.tnt.com/corporate/3Q12datasheets
Date 29 October 2012<br />
Commenting on this quarter’s developments, Bernard Bot, interim CEO said:<br />
‘<strong>TNT</strong> Ex<strong>press</strong> showed a mixed performance this quarter, with lower results in Europe but<br />
improvements in Asia Pacific. In a challenging economic environment, we benefited from our<br />
diversified product portfolio and superior customer service. The quarter saw the highest customer<br />
satisfaction score ever realised. Customer growth was also good, with notable additional business<br />
won in the Automotive, Industrial and High-Tech sectors. Finally, we continue to contain costs and<br />
shed loss-making activities to support our operating results. Our cash performance was also<br />
strong.’<br />
2012 outlook and aims:<br />
Challenging trading conditions in Europe and Asia Pacific intercontinental<br />
Europe & MEA: indirect and fixed cost control initiatives in place to help mitigate impact of<br />
negative yield trend<br />
Asia Pacific: year-on-year benefit from reduced exposure to fixed intercontinental air capacity<br />
and improved performance from domestic businesses<br />
Americas: focus on improving results in Brazil<br />
Working capital to be in line with medium-term aims, capital expenditures lower<br />
2013:<br />
<strong>TNT</strong> Ex<strong>press</strong> and UPS committed to the intended merger and confident that European<br />
competition clearance will be achieved, allowing completion of the transaction in early 2013<br />
2
Date 29 October 2012<br />
Revenue and operating income by segment, reported and adjusted<br />
Reported Adjusted (non-GAAP)<br />
Revenues (€m) Notes 3Q12 3Q11 %chg FX One-offs 3Q12 3Q11 %chg<br />
Europe & MEA 1,118 1,083 3.2 (26)<br />
1,092 1,083 0.8<br />
Asia Pacific 448 460 -2.6 (44)<br />
404 460 -12.2<br />
Americas 118 116 1.7 4<br />
122 116 5.2<br />
Other networks 132 121 9.1 (3)<br />
129 121 6.6<br />
Non-allocated (2) (3) 0.0 (1)<br />
(3) (3) 0.0<br />
Total 1,814 1,777 2.1 (70) 1,744 1,777 -1.9<br />
Operating income (€m)<br />
Europe & MEA 60<br />
Asia Pacific 8<br />
Americas (22)<br />
Other networks 7<br />
Non-allocated (1) (7)<br />
Total 46<br />
69<br />
(8)<br />
(30)<br />
7<br />
(6)<br />
32<br />
-13.0 (4)<br />
0.0 (5)<br />
26.7 (1)<br />
0.0 2<br />
43.8 (10) 2<br />
Operating income margin (%)<br />
Europe & MEA 5.4 6.4 5.1 6.6<br />
Asia Pacific 1.8 -1.7 0.7 -1.7<br />
Americas -18.6 -25.9 -18.9 -25.9<br />
Other networks 5.3 5.8 5.4 5.8<br />
Non-allocated - - - -<br />
Total 2.5 1.8 2.2 2.4<br />
Notes: Non-GAAP adjustments<br />
(1) 3Q12: €1 UPS Offer-related, €1m Software impairment<br />
3<br />
56<br />
3<br />
(23)<br />
7<br />
(5)<br />
38<br />
72 -22.2<br />
(8) 0.0<br />
(30)<br />
7<br />
23.3<br />
2 0.0<br />
43 -11.6
Date 29 October 2012<br />
3Q12 segmental performance overview<br />
EMEA<br />
3Q12 3Q11 %chg YTD'12 YTD'11 %chg<br />
Adjusted revenues 1,092 1,083 0.8 3,366 3,371 -0.1<br />
Adjusted operating income 56 72 -22.2 209 287 -27.2<br />
Average consignments per day ('000) 713<br />
Revenue per consignment (€) (1)<br />
23.6<br />
Average kilos per day ('000) 14,282<br />
Revenue per kilo (€) (1)<br />
(1) based on reported revenues @avg11<br />
1.18<br />
666<br />
25.0<br />
14,044<br />
1.19<br />
7.1 747<br />
-5.6 23.5<br />
1.7 14,726<br />
-0.8 1.19<br />
718<br />
24.4<br />
14,517<br />
1.21<br />
Positive volume development and revenue growth despite challenging economic conditions<br />
Volumes grew in all product segments, with highest growth in International economy services<br />
Consignment growth exceeded kilo growth due to general decrease in weight-per consignment<br />
and lower weight per consignment B2C growth<br />
Pricing <strong>press</strong>ure in addition to negative mix effect from higher growth of lower-priced economy<br />
services continued<br />
Cost control measures (cost per consignment -4.3%) partially mitigated impact of negative<br />
yield<br />
Asia Pacific<br />
3Q12 3Q11 %chg YTD'12 YTD'11 %chg<br />
Adjusted revenues 404 460 -12.2 1,197 1,321 -9.4<br />
Adjusted operating income 3 (8)<br />
6 (28)<br />
Average consignments per day ('000) 165<br />
Revenue per consignment (€) (1)<br />
37.7<br />
Average kilos per day ('000) 10,905<br />
Revenue per kilo (€) (1)<br />
(1) based on reported revenues @avg11<br />
0.57<br />
181<br />
39.0<br />
13,654<br />
0.52<br />
-8.8 165<br />
-3.3 37.8<br />
-20.1 10,636<br />
9.6 0.59<br />
182<br />
37.7<br />
13,462<br />
0.51<br />
4.0<br />
-3.7<br />
1.4<br />
-1.7<br />
-9.3<br />
0.3<br />
-21.0<br />
15.7<br />
Revenue decline because of lower international volumes, targeted reductions in China<br />
Domestic LTL volumes and India domestic road disposal<br />
Day Definite service now represents 36.7% of China Domestic turnover (3Q11: 23.4%)<br />
Lower RPC mostly due to <strong>press</strong>ure on International prices; sequentially lower RPK due to prior<br />
year comparison China Domestic<br />
Emirates SkyCargo agreement currently undergoing further negotiation; alternatives being<br />
prepared, with limited impact on 2012 profitability expected<br />
Operating income improved in most units<br />
Closure India domestic air announced mid-October; India infrastructure and organisation to be<br />
resized, focus on International Ex<strong>press</strong><br />
4
Date 29 October 2012<br />
Americas<br />
3Q12 3Q11 %chg YTD'12 YTD'11 %chg<br />
Adjusted revenues 122 116 5.2 362 344 5.2<br />
Adjusted operating income (23) (30) 23.3 (70) (94) 25.5<br />
Average consignments per day ('000) 53<br />
Revenue per consignment (€) (1)<br />
34.9<br />
Average kilos per day ('000) 3,153<br />
Revenue per kilo (€) (1)<br />
(1) based on reported revenues @avg11<br />
0.59<br />
53<br />
33.6<br />
3,118<br />
0.57<br />
3.9<br />
53<br />
35.3<br />
1.1 3,148<br />
3.5 0.60<br />
54<br />
33.4<br />
3,217<br />
0.56<br />
Brazil’s revenue increased compared to prior year, mainly as a result of higher prices<br />
Brazil’s adjusted operating losses declined, however turnaround more challenging than had<br />
been expected; additional yield and cost actions being taken<br />
The value of Brazil’s service and product offering remains intact<br />
The rest of Americas performed in line with expectations<br />
Other Networks and Non-allocated<br />
Other Networks performance in line with prior year<br />
Non-allocated adjusted costs contained as a result of successful central cost-control initiatives<br />
Other financial indicators<br />
Effective tax rate of 75.0% reflects weighted average statutory tax rate in the countries in<br />
which <strong>TNT</strong> Ex<strong>press</strong> operates, several non-deductible costs and losses for which no tax assets<br />
could be recognised<br />
Net cash from operating activities €33m above prior year mainly due to positive change in<br />
working capital and lower taxes paid<br />
Net cash used in investing activities €31m lower than prior year mainly because of €28m<br />
proceeds from a matured foreign exchange hedge<br />
Net capex below trend at 1.4% of reported revenues<br />
Trade working capital stable at 9.6% of revenues<br />
Net cash €36m (2Q12: €6m net cash)<br />
5<br />
-1.9<br />
5.7<br />
-2.1<br />
7.1
Date 29 October 2012<br />
Year-to-date performance commentary<br />
Year to date, adjusted revenue decreased by 1.5% and adjusted operating income by 15.6%. Most<br />
significant operating trends reported in 1H12 continued through 3Q12, including positive volume<br />
development but yield <strong>press</strong>ure in Europe & MEA and improving results from Asia Pacific and<br />
Americas. Capex and working capital control have remained in focus during the year-to-date period.<br />
Summary: Consolidated results (€m)<br />
Reported Adjusted (non-GAAP)<br />
Notes YTD'12 YTD'11 %chg YTD'12 YTD'11 %chg<br />
Revenues (1) 5,463 5,373 1.7 5,291 5,373 -1.5<br />
Operating income (2) 160 (1)<br />
141 167 -15.6<br />
Operating income margin (%) 2.9 (0.0)<br />
2.7 3.1<br />
Profit attributable to shareholders 65 (97)<br />
Cash generated from operations 185 170 8.8<br />
Net cash from operating activities 103 58 77.6<br />
Net cash used in investing activities (18) (114) 84.2<br />
Net debt/(cash)<br />
Notes: Non-GAAP adjustments<br />
(1) YTD'12: -€172m FX<br />
(36) 104<br />
(2) YTD'12: -€24m FX, €4m UPS Offer-related, €1m Software impairment<br />
(2) YTD'11: €8m demerger related (€(11)m pensions, €14m share-based payments, €5m demerger costs), €160m restructuring/oneoffs<br />
(€16m restructuring, €12m software impairment, €132m Brazil one-offs)<br />
Revenue and operating income by segment, reported and adjusted<br />
Reported Adjusted (non-GAAP)<br />
Revenues (€m) Notes YTD'12 YTD'11 %chg FX One-offs YTD'12 YTD'11 %chg<br />
Europe & MEA 3,422 3,371 1.5 (56)<br />
3,366 3,371 -0.1<br />
Asia Pacific 1,315 1,321 -0.5 (118)<br />
1,197 1,321 -9.4<br />
Americas 354 344 2.9 8<br />
362 344 5.2<br />
Other networks 377 342 10.2 (6)<br />
371 342 8.5<br />
Non-allocated (5) (5) 0.0 -<br />
(5) (5) 0.0<br />
Total 5,463 5,373 1.7 (172)<br />
5,291 5,373 -1.5<br />
Operating income (€m)<br />
Europe & MEA 216<br />
Asia Pacific 17<br />
Americas (68)<br />
Other networks 14<br />
Non-allocated (1) (19)<br />
Total 160<br />
274<br />
(34)<br />
(227)<br />
13<br />
(27)<br />
(1)<br />
-21.2 (7)<br />
0.0 (11)<br />
70.0 (2)<br />
7.7 -<br />
0.0 (4)<br />
0.0 (24)<br />
-<br />
-<br />
-<br />
-<br />
5<br />
5<br />
209<br />
6<br />
(70)<br />
14<br />
(18)<br />
141<br />
287<br />
(28)<br />
(94)<br />
13<br />
(11)<br />
167<br />
Operating income margin (%)<br />
Europe & MEA 6.3 8.1 6.2 8.5<br />
Asia Pacific 1.3 -2.6 0.5 -2.1<br />
Americas -19.2 -66.0 -19.3 -27.3<br />
Other networks 3.7 3.8 3.8 3.8<br />
Non-allocated - - - -<br />
Total<br />
Notes: Non-GAAP adjustments<br />
2.9 0.0 2.7 3.1<br />
(1) YTD'12: €4 UPS Offer-related, €1m Software impairment<br />
6<br />
-27.2<br />
0.0<br />
25.5<br />
7.7<br />
-63.6<br />
-15.6
Date 29 October 2012<br />
CONSOLIDATED INTERIM FINANCIAL STATEMENTS<br />
GENERAL INFORMATION<br />
The interim financial statements have been prepared in accordance with IAS 34 ‘Interim financial<br />
reporting’.<br />
<strong>TNT</strong> Ex<strong>press</strong> N.V. is a public limited liability company domiciled in Amsterdam, the Netherlands.<br />
The consolidated financial statements include the financial statements of <strong>TNT</strong> Ex<strong>press</strong> N.V. and its<br />
consolidated subsidiaries (hereafter referred to as ‘<strong>TNT</strong> Ex<strong>press</strong>’, ‘Group’ or ‘the company’). The<br />
company was incorporated under the laws of the Netherlands and is listed on Euronext Amsterdam.<br />
<strong>TNT</strong> Ex<strong>press</strong> provides door-to-door ex<strong>press</strong> delivery services for customers sending documents,<br />
parcels, freight and special services worldwide, with a focus on time-certain and/or day–certain<br />
pick-up and delivery.<br />
BASIS OF PREPARATION<br />
The information is reported on quarter-to-date and year-to-date bases ending 29 September 2012.<br />
Where material to an understanding of the period starting 1 January 2012 and ending 29<br />
September 2012, further information is disclosed. The interim financial statements were discussed<br />
and approved by the Executive Board. The interim financial statements should be read in<br />
conjunction with <strong>TNT</strong> Ex<strong>press</strong>’ consolidated financial statements in the 2011 annual report as<br />
published on 21 February 2012.<br />
The significant accounting policies applied in these consolidated interim financial statements are<br />
consistent with those applied in <strong>TNT</strong> Ex<strong>press</strong>’ consolidated financial statements in the 2011 annual<br />
report for the year ended 31 December 2011.<br />
The measure of profit and loss and assets and liabilities is based on the <strong>TNT</strong> Ex<strong>press</strong> Group<br />
Accounting Policies, which are compliant with International Financial Reporting Standards (IFRS)<br />
as adopted by the European Union (EU). The pricing of inter-company sales is done at arm’s length.<br />
AUDITOR’S INVOLVEMENT<br />
The content of this interim financial report has been reviewed by an external auditor.<br />
7
Date 29 October 2012<br />
SEGMENT INFORMATION<br />
<strong>TNT</strong> Ex<strong>press</strong> operates its businesses through four reportable segments: Europe & MEA, Asia<br />
Pacific, Americas and Other networks.<br />
The Ex<strong>press</strong> business provides on-demand door-to-door ex<strong>press</strong> delivery services for customers<br />
sending documents, parcels and freight. The Other networks include <strong>TNT</strong> Fashion and <strong>TNT</strong> Innight<br />
business. <strong>TNT</strong> Fashion provides supply chain solutions for the fashion industry and fashion retailers.<br />
<strong>TNT</strong> Innight provides time-critical deliveries to individually agreed service delivery points for<br />
business customers during the night.<br />
The following table presents the segment information relating to the income statement and total<br />
assets of the reportable segments for the first nine months of 2012 and 2011:<br />
in € millions<br />
Q3 2012 ended at 29 September 2012<br />
Europe &<br />
MEA<br />
Net sales 3,306<br />
Inter-company sales 3<br />
Other operating revenues 113<br />
Total operating revenues 3,422<br />
Other income<br />
Depreciation property,<br />
1<br />
plant and equipment (59)<br />
Amortisation intangibles (7)<br />
Total operating income 216<br />
Total assets<br />
Q3 2011 ended at 01 October 2011<br />
3,044<br />
Net sales 3,305<br />
Inter-company sales 5<br />
Other operating revenues 61<br />
Total operating revenues 3,371<br />
Other income<br />
Depreciation property,<br />
5<br />
plant and equipment (74)<br />
Amortisation/impairment intangibles (7)<br />
Total operating income 274<br />
Total assets 3,099<br />
8<br />
Asia<br />
Pacific Americas<br />
1,310<br />
0<br />
5<br />
1,315<br />
1<br />
(24)<br />
(3)<br />
17<br />
704<br />
1,315<br />
0<br />
6<br />
1,321<br />
1<br />
(23)<br />
(3)<br />
(34)<br />
711<br />
351<br />
0<br />
3<br />
354<br />
1<br />
(9)<br />
(2)<br />
(68)<br />
304<br />
342<br />
0<br />
2<br />
344<br />
1<br />
(10)<br />
(123)<br />
(227)<br />
422<br />
Other<br />
networks<br />
375<br />
1<br />
1<br />
377<br />
0<br />
(8)<br />
(1)<br />
14<br />
185<br />
340<br />
1<br />
1<br />
342<br />
0<br />
(8)<br />
0<br />
13<br />
176<br />
Nonallocated<br />
0<br />
0<br />
0<br />
0<br />
0<br />
(6)<br />
(26)<br />
(19)<br />
419<br />
0<br />
0<br />
0<br />
0<br />
2<br />
(6)<br />
(36)<br />
(27)<br />
353<br />
Intercompany<br />
Total<br />
(1)<br />
(4)<br />
(5)<br />
1<br />
0<br />
0<br />
1<br />
(6)<br />
(5)<br />
1<br />
0<br />
0<br />
5,341<br />
0<br />
122<br />
5,463<br />
4<br />
(106)<br />
(39)<br />
160<br />
4,656<br />
5,303<br />
0<br />
70<br />
5,373<br />
10<br />
(121)<br />
(169)<br />
(1)<br />
4,761
Date 29 October 2012<br />
Consolidated statement of financial position <strong>TNT</strong> Ex<strong>press</strong> N.V. 29 Sep 31 Dec<br />
in € millions<br />
Assets<br />
Non-current assets<br />
Intangible assets<br />
2012 2011<br />
Goodwill 1,487 1,483<br />
Other intangible assets 126 146<br />
Total<br />
Property, plant and equipment<br />
1,613 1,629<br />
Land and buildings 474 485<br />
Plant and equipment 225 241<br />
Aircraft 36 50<br />
Other 85 100<br />
Construction in progress 27 23<br />
Total<br />
Financial fixed assets<br />
847 899<br />
Investments in associates 19 20<br />
Other loans receivable 3 3<br />
Deferred tax assets 245 244<br />
Other financial fixed assets 18 17<br />
Total 285 284<br />
Pension assets 50 34<br />
Total non-current assets<br />
Current assets<br />
2,795 2,846<br />
Inventory 14 15<br />
Trade accounts receivable 1,046 1,117<br />
Accounts receivable 97 139<br />
Income tax receivable 18 29<br />
Prepayments and accrued income 165 159<br />
Cash and cash equivalents 313 250<br />
Total current assets 1,653 1,709<br />
Assets classified as held for disposal 208 146<br />
Total assets 4,656 4,701<br />
Liabilities and equity<br />
Equity<br />
Equity attributable to the equity holders of the parent 2,885 2,806<br />
Non-controlling interests 5 6<br />
Total equity<br />
Non-current liabilities<br />
2,890 2,812<br />
Deferred tax liabilities 26 26<br />
Provisions for pension liabilities 44 46<br />
Other provisions 107 101<br />
Long-term debt 203 219<br />
Accrued liabilities 4 4<br />
Total non-current liabilities<br />
Current liabilities<br />
384 396<br />
Trade accounts payable 366 435<br />
Other provisions 69 88<br />
Other current liabilities 325 309<br />
Income tax payable 41 31<br />
Accrued current liabilities 530 630<br />
Total current liabilities 1,331 1,493<br />
Liabilities related to assets classified as held for disposal 51 0<br />
Total liabilities and equity 4,656 4,701<br />
9
Date 29 October 2012<br />
Consolidated income statement <strong>TNT</strong> Ex<strong>press</strong> N.V.<br />
in € millions 3Q12 3Q11 YTD'12 YTD'11<br />
Net sales 1,766<br />
Other operating revenues 48<br />
Total revenues 1,814<br />
Other income 1<br />
Cost of materials (120)<br />
Work contracted out and other external expenses (975)<br />
Salaries and social security contributions (564)<br />
Depreciation, amortisation and impairments (48)<br />
Other operating expenses (62)<br />
Total operating expenses (1,769)<br />
Operating income 46<br />
Interest and similar income 4<br />
Interest and similar expenses (13)<br />
Net financial (expense)/income (9)<br />
1,754<br />
23<br />
1,777<br />
3<br />
(119)<br />
(945)<br />
(552)<br />
(51)<br />
(81)<br />
(1,748)<br />
32<br />
4<br />
(15)<br />
(11)<br />
5,341<br />
122<br />
5,463<br />
4<br />
(357)<br />
(2,881)<br />
(1,725)<br />
(145)<br />
(199)<br />
(5,307)<br />
160<br />
13<br />
(38)<br />
(25)<br />
5,303<br />
70<br />
5,373<br />
10<br />
(355)<br />
(2,813)<br />
(1,667)<br />
(290)<br />
(259)<br />
(5,384)<br />
(1)<br />
17<br />
(50)<br />
(33)<br />
Results from investments in associates (1) 0<br />
0 0<br />
Profit before income taxes 36 21 135 (34)<br />
Income taxes (27) (16) (71) (64)<br />
Profit for the period<br />
Attributable to:<br />
9 5 64 (98)<br />
Non-controlling interests 0 0 (1) (1)<br />
Equity holders of the parent 9 5 65 (97)<br />
Earnings per ordinary share (in € cents) 1<br />
1 Based on an average of 543,239,885 of outstanding ordinary shares (2011: 543,202,420)<br />
1.7 0.9 12.0 (17.9)<br />
Consolidated statement of comprehensive income <strong>TNT</strong> Ex<strong>press</strong> N.V.<br />
in € millions 3Q12 3Q11 YTD'12 YTD'11<br />
Profit for the period 9 5 64 (98)<br />
Gains/(losses) on cashflow hedges, net of tax 0 (20) 0 (17)<br />
Currency translation adjustment net of tax (12) 41 16 (35)<br />
(12) 21 16 (52)<br />
Total comprehensive income for the period<br />
Attributable to:<br />
(3)<br />
Non-controlling interests 0<br />
Equity holders of the parent (3)<br />
26<br />
0<br />
26<br />
80<br />
(1)<br />
81<br />
(150)<br />
(1)<br />
(149)<br />
The YTD 2012 tax impact on the cash flow hedges was €(1)m (2011: €7m). There was no tax<br />
impact on the currency translation adjustment.<br />
10
Date 29 October 2012<br />
Consolidated statement of cash flows <strong>TNT</strong> Ex<strong>press</strong> N.V.<br />
in € millions 3Q12 3Q11 YTD'12 YTD'11<br />
Profit before income taxes<br />
Adjustments for:<br />
36<br />
Depreciation, amortisation and impairments 48<br />
Amortisation of financial instruments/derivatives 1<br />
Share-based compensation<br />
Investment income:<br />
-<br />
(Profit)/loss of assets held for disposal -<br />
Interest and similar income (4)<br />
Foreign exchange (gains) and losses 1<br />
Interest and similar expenses 12<br />
Results from investments in associates -<br />
Changes in provisions: -<br />
Pension liabilities (5)<br />
Other provisions (4)<br />
Changes in working capital: -<br />
Inventory -<br />
Trade accounts receivable 49<br />
Accounts receivable -<br />
Other current assets (18)<br />
Trade accounts payable (22)<br />
Other current liabilities excluding short-term financing and taxes (6)<br />
Cash generated from operations 88<br />
Interest paid (11)<br />
Income taxes received/(paid) (11)<br />
Net cash from operating activities 66<br />
Interest received 4<br />
Disposal of associates -<br />
Capital expenditure on intangible assets (6)<br />
Disposal of intangible assets 1<br />
Capital expenditure on property, plant and equipment (26)<br />
Proceeds from sale of property, plant and equipment 5<br />
Cash from financial instruments/derivatives 28<br />
Other changes in (financial) fixed assets (1)<br />
Net cash from/(used in) investing activities 5<br />
Share-based payments -<br />
Proceeds from long-term borrowings 1<br />
Repayments of long-term borrowings (4)<br />
Proceeds from short-term borrowings 1<br />
Repayments of short-term borrowings (8)<br />
Repayments of finance leases (2)<br />
Dividends paid -<br />
Financing related to PostNL -<br />
Net cash used in financing activities (12)<br />
Total changes in cash 59<br />
11<br />
21<br />
51<br />
-<br />
-<br />
-<br />
(4)<br />
3<br />
12<br />
-<br />
-<br />
(3)<br />
18<br />
-<br />
-<br />
10<br />
8<br />
(20)<br />
(6)<br />
(20)<br />
70<br />
(11)<br />
(26)<br />
33<br />
5<br />
-<br />
(5)<br />
1<br />
(26)<br />
(1)<br />
-<br />
(26)<br />
-<br />
9<br />
(10)<br />
29<br />
(87)<br />
(8)<br />
(14)<br />
-<br />
(81)<br />
(74)<br />
135<br />
145<br />
2<br />
-<br />
(2)<br />
(13)<br />
4<br />
34<br />
(1)<br />
(18)<br />
(27)<br />
-<br />
47<br />
8<br />
(39)<br />
(73)<br />
(17)<br />
185<br />
(32)<br />
(50)<br />
103<br />
13<br />
1<br />
(16)<br />
3<br />
(66)<br />
19<br />
28<br />
-<br />
(18)<br />
-<br />
1<br />
(7)<br />
36<br />
(34)<br />
(12)<br />
(2)<br />
-<br />
(18)<br />
67<br />
(34)<br />
290<br />
-<br />
19<br />
(3)<br />
(17)<br />
5<br />
45<br />
-<br />
(28)<br />
19<br />
-<br />
(11)<br />
9<br />
(36)<br />
(71)<br />
(17)<br />
170<br />
(42)<br />
(70)<br />
58<br />
17<br />
-<br />
(26)<br />
-<br />
(108)<br />
6<br />
(3)<br />
(114)<br />
(9)<br />
5<br />
(11)<br />
142<br />
(143)<br />
(13)<br />
(14)<br />
(526)<br />
(569)<br />
(625)
Date 29 October 2012<br />
Consolidated statement of changes in equity <strong>TNT</strong> Ex<strong>press</strong> N.V.<br />
in € millions<br />
Net<br />
investment<br />
Combined balance at 31 December 2010 3,065<br />
Demerger and related reclassifications (3,065)<br />
Issued<br />
share<br />
capital<br />
43<br />
Additional<br />
paid in<br />
capital<br />
3,035<br />
Legal<br />
reserves<br />
Balance at 1 January 2011 43 3,035 0<br />
Legal reserves reclassifications 29<br />
(71)<br />
71<br />
Other<br />
reserves<br />
-<br />
(29)<br />
Total comprehensive income (52)<br />
Interim dividend 2011 (14)<br />
Share-based compensation 11<br />
Other (3)<br />
Total direct changes in equity - (14) - 8<br />
Balance at 01 October 2011 43 3,021 (23) (21)<br />
Balance at 31 December 2011 43<br />
3,021<br />
Total comprehensive income 16<br />
Final dividend previous year (2)<br />
Changes in legal reserves (13)<br />
Total direct changes in equity - (2) (13)<br />
Balance at 29 September 2012 43 3,019 27<br />
12<br />
24<br />
(12)<br />
13<br />
13<br />
1<br />
Retained<br />
earnings<br />
-<br />
(97)<br />
-<br />
(97)<br />
(270)<br />
-<br />
65<br />
(205)<br />
Attributable to<br />
equity holders of<br />
the parent<br />
2,994<br />
84<br />
3,078<br />
(149)<br />
(14)<br />
11<br />
(3)<br />
(6)<br />
2,923<br />
2,806<br />
81<br />
(2)<br />
-<br />
(2)<br />
2,885<br />
Noncontrolling<br />
interests<br />
8<br />
8<br />
(1)<br />
-<br />
7<br />
-<br />
6<br />
(1)<br />
5<br />
Total<br />
equity<br />
3,002<br />
84<br />
3,086<br />
(150)<br />
(14)<br />
11<br />
(3)<br />
(6)<br />
2,930<br />
2,812<br />
80<br />
(2)<br />
-<br />
(2)<br />
2,890
Date 29 October 2012<br />
NOTES TO THE CONSOLIDATED INTERIM FINANCIAL STATEMENTS<br />
1. INTANGIBLE ASSETS<br />
The movements in the intangible assets are as follows:<br />
in € millions 2012 2011<br />
Balance at 1 January 1,629<br />
1,892<br />
Additions 16<br />
26<br />
Disposals (2)<br />
(1)<br />
Amortisation (37)<br />
(37)<br />
Impairments (2)<br />
(132)<br />
Exchange rate differences 9<br />
(21)<br />
Balance at end of period (29 September 2012, 1 October 2011) 1,613<br />
1,727<br />
The intangible assets of €1,613m consist of goodwill for an amount of €1,487m and other<br />
intangibles for an amount of €126m.<br />
The additions to the intangible assets of €16m are related to software licence and software<br />
development costs.<br />
As at 29 September 2012, the impairment of €2m relates to software development costs.<br />
As at 1 October 2011, the total impairment of €132m related to impairment of goodwill (€105m),<br />
customer relationships (€15m) and software (€12m). The impairment of goodwill and customer<br />
relationships was related to the South American operations and resulted from unexpected volume<br />
losses and performance <strong>press</strong>ure.<br />
2. PROPERTY, PLANT AND EQUIPMENT<br />
The movements in property, plant and equipment are as follows:<br />
in € millions 2012 2011<br />
Balance at 1 January 899<br />
1,089<br />
Capital expenditures in cash 66<br />
108<br />
Capital expenditures in financial leases/other 3<br />
4<br />
Disposals (5)<br />
(2)<br />
Exchange rate differences 8<br />
(21)<br />
Depreciation (106)<br />
(121)<br />
Transfers to assets held for disposal (18)<br />
0<br />
Balance at end of period (29 September 2012, 1 October 2011) 847<br />
1,057<br />
Capital expenditures of €69m consist of investments within Europe & MEA of €42m, Asia Pacific of<br />
€13m, Americas of €7m and Other Networks of €7m. The investments mainly relate to hubs, depots,<br />
sorting machinery, depot equipment and vehicles.<br />
13
Date 29 October 2012<br />
3. PENSIONS<br />
<strong>TNT</strong> Ex<strong>press</strong> operates a number of post-employment benefit plans around the world. Most of <strong>TNT</strong><br />
Ex<strong>press</strong>’ post-employment benefit plans are defined contribution plans. The most significant defined<br />
benefit plans in place are in the Netherlands, the United Kingdom, Germany, Australia and Italy.<br />
On the balance sheet, the pension assets and pension liabilities of the various defined benefit<br />
pension schemes have been presented separately. The pension assets increased by €16m and<br />
pension liability decreased by €2m, resulting in a net movement of €18m. This movement is mainly<br />
due to contributions made to the various defined benefits pension schemes over the first nine<br />
months of 2012.<br />
In 2011, the IASB issued the revised IAS 19 ‘Employee Benefits’ as endorsed by the EU. The<br />
revised IAS 19 is expected to be effective for <strong>TNT</strong> Ex<strong>press</strong> as from 1 January 2013. Had the<br />
revised IAS 19 been applied as at 29 September 2012, the employer pension expense would have<br />
been €3m higher (net of tax) and the net actuarial losses of €40m (net of tax) would have been<br />
recognised immediately in other comprehensive income.<br />
4. ASSETS CLASSIFIED AS HELD FOR DISPOSAL AND LIABILITIES RELATED TO ASSETS<br />
CLASSIED AS HELD FOR DISPOSAL<br />
The assets classified as held for disposal amount to €208m and relate to aircraft of €135m, vehicles<br />
of €1m and to the assets of <strong>TNT</strong> Airways and PanAir of €72m. The liabilities related to assets<br />
classified as held for disposal of €51m relate fully to <strong>TNT</strong> Airways and PanAir.<br />
On 21 June 2012, an Offer Memorandum by United Parcel Services, Inc. (UPS) and a Position<br />
Statement by the Boards of <strong>TNT</strong> Ex<strong>press</strong> were published in connection with the recommended<br />
public cash Offer by UPS for all issued and outstanding shares of <strong>TNT</strong> Ex<strong>press</strong> N.V. The Executive<br />
Board and the Supervisory Board of <strong>TNT</strong> Ex<strong>press</strong> fully support and unanimously recommend the<br />
Offer by UPS.<br />
Under EU airline regulations, <strong>TNT</strong> Ex<strong>press</strong>’ airlines, <strong>TNT</strong> Airways and PanAir, could lose full EU<br />
market access rights as soon as <strong>TNT</strong> Ex<strong>press</strong> is acquired by a non-EU company such as UPS. To<br />
ensure that the airline operations will be able to continue despite the change in ownership and<br />
control of <strong>TNT</strong> Ex<strong>press</strong>, <strong>TNT</strong> Ex<strong>press</strong> and UPS have agreed to implement an independent<br />
European ownership and control structure for <strong>TNT</strong> Airways and PanAir. Consequently, <strong>TNT</strong> Airways<br />
and PanAir are reported as assets held for disposal as at 29 September 2012.<br />
The major classes of assets and liabilities classified as held for sale related to <strong>TNT</strong> Airways and<br />
PanAir are presented below:<br />
in € millions 29 Sep<br />
Balance as at<br />
2012<br />
Property, plant and equipment 17<br />
Current assets 55<br />
Total assets 72<br />
Long-term debt 1<br />
Current liabilities 50<br />
Total liabilities 51<br />
The Current assets position includes €4m Cash and cash equivalents.<br />
14
Date 29 October 2012<br />
5. EQUITY<br />
Total equity attributable to equity holders of the parent increased to €2,885m on 29 September<br />
2012 from €2,806m as per 31 December 2011. This increase of €79m is mainly due to<br />
comprehensive income attributable to equity holders of the parent of €81m, of which €65m relates<br />
to the profit for the period and a positive of €16m due to foreign currency translation results.<br />
The Company’s authorised share capital amounts to €120m, divided into 750,000,000 ordinary<br />
shares with a nominal value of €0.08 each and 750,000,000 Preference shares with a nominal<br />
value of €0.08 each.<br />
The Company’s issued share capital amounts to €43,461,797.92 divided into 543,272,474 ordinary<br />
shares with a nominal value of €0.08 each.<br />
Additional paid-in capital amounted to €3,019m on 29 September 2012 as a final cash dividend of<br />
€2m of €0.4cent per ordinary share was distributed in May 2012. The amount of paid-in capital<br />
recognised for Dutch dividend withholding tax purposes was €797m.<br />
For administration and compliance purposes, a foundation (Stichting Bewaarneming Aandelen <strong>TNT</strong>)<br />
legally holds shares belonging to <strong>TNT</strong> Ex<strong>press</strong> under (former) incentive schemes which are<br />
beneficially owned by the employees. As at 29 September 2012, the number of <strong>TNT</strong> Ex<strong>press</strong><br />
shares involved amounted to 558,821 with a nominal value of €0.08 per share.<br />
6. NET DEBT<br />
The net debt is specified in the table below:<br />
in € millions 29 Sep 31 Dec<br />
2012 2011<br />
Short term debt 77<br />
38<br />
Long term debt 204<br />
219<br />
Total interest bearing debt 281<br />
257<br />
Cash and cash equivalents (317)<br />
(250)<br />
Net debt/(cash) (36)<br />
7<br />
The net debt position as at 29 September 2012 improved by €43m compared to 31 December 2011.<br />
The improvement is due to: net cash from operating activities (€103m), net cash used in investing<br />
activities (€(18)m) and various non-cash items (€(42)m).<br />
The long-term debt position of €204m includes €1m Liabilities related to assets classified as held<br />
for disposal and the Cash and cash equivalents position of €317m includes €4m Assets classified<br />
as held for disposal, see note 4.<br />
15
Date 29 October 2012<br />
7. OTHER PROVISIONS<br />
The other provisions consist of long-term provisions and short-term provisions for employee<br />
benefits, restructuring, claims and indemnities and other obligations and risks incurred in the normal<br />
course of business. The long-term and short-term provisions as at 29 September 2012 decreased<br />
by €13m compared to 1 January 2012.<br />
in € millions 2012 2011<br />
Balance at 1 January 189<br />
168<br />
Additions 51<br />
51<br />
Withdrawals/<strong>release</strong>s (63)<br />
(32)<br />
Other 0<br />
1<br />
Exchange rate differences (1)<br />
(7)<br />
Balance at end of period (29 September 2012, 1 October 2011) 176<br />
181<br />
The additions of €51m relate to claims indemnities (€18m), long-term employment benefits (€7m)<br />
and other movements (€26m). Other additions consist mainly of reclassification of €19m from<br />
accrued liabilities and claims provision in Brazil. The withdrawals of €63m relate to claims<br />
indemnities (€23m), restructuring (€14m), long-term employment benefits (€3m) and other<br />
movements (€23m). Other withdrawals relate mainly to settlement and <strong>release</strong> of claims provisions<br />
in Brazil.<br />
8. TAXES<br />
Effective tax rate YTD 2012 YTD 2011<br />
Dutch statutory tax rate 25.0% 25.0%<br />
Other statutory tax rates -1.6% -3.3%<br />
Weighted average statutory tax rate 23.4% 21.7%<br />
Non and partly deductible costs 4.6% -19.5%<br />
Non and partly deductible impairments 0.0% -86.8%<br />
Other 24.6% -103.6%<br />
Effective tax rate 52.6% -188.2%<br />
The tax expense in the first nine months of 2012 amounted to €71m (2011: €64m). The effective tax<br />
rate was 52.6% (2011: -188.2%).<br />
The mix of income from countries in which <strong>TNT</strong> Ex<strong>press</strong> operates resulted in a weighted average<br />
statutory tax rate of 23.4%. Several non-deductible costs adversely affected the effective tax rate by<br />
4.6 percentage points.<br />
The line ‘other’ shows an impact of 24.6 percentage points and includes:<br />
The net impact of losses for which no deferred tax assets could be recognised due to<br />
uncertainty of the recoverability of those assets: 17.0 percentage points;<br />
Positive effects in connection with intragroup financing structures: -6.8 percentage points;<br />
The remaining ‘other’ of 14.4 percentage points reflects mainly the net impact of several local<br />
taxes and accounting estimates relating to tax balances.<br />
16
Date 29 October 2012<br />
9. LABOUR FORCE<br />
29 Sep 31 Dec<br />
Employees 2012 2011<br />
Europe & MEA 1<br />
35,482<br />
36,262<br />
Asia Pacific 19,426<br />
24,825<br />
Americas 10,810<br />
11,255<br />
Other networks 2,589<br />
2,534<br />
Non-allocated 1,371<br />
1,534<br />
Total 69,678<br />
76,410<br />
Average FTEs YTD 2012 YTD 2011<br />
Europe & MEA 1<br />
33,952<br />
34,298<br />
Asia Pacific 1<br />
21,230<br />
27,862<br />
Americas 11,545<br />
11,312<br />
Other networks 2,408<br />
2,249<br />
Non-allocated 1,379<br />
1,545<br />
Total<br />
70,514<br />
77,266<br />
1 For comparative purposes 2011 numbers have been restated<br />
The average number of full time equivalents working in <strong>TNT</strong> Ex<strong>press</strong> during the first nine months of<br />
2012 was 70,514, which decreased by 6,752, mainly due to China and India.<br />
10. RELATED PARTIES<br />
Purchases of <strong>TNT</strong> Ex<strong>press</strong> from joint ventures amounted to €20m (2011: €20m). During the first<br />
nine months of 2012, €0m sales were made by <strong>TNT</strong> Ex<strong>press</strong> companies to its joint ventures.<br />
As at 29 September 2012, net amounts due to the joint venture entities amounted to €26m (1<br />
October 2011: €30m). Net amounts due to associated companies amounted to €1m (1 October<br />
2011: €1m).<br />
PostNL currently owns 29.8% of <strong>TNT</strong> Ex<strong>press</strong>. It also has trading relationships with a number of<br />
other PostNL companies, joint ventures and uncombined companies in which it holds minority<br />
shares. In some cases there are contractual arrangements in place under which the <strong>TNT</strong> Ex<strong>press</strong><br />
entities source supplies from such undertakings, or such undertakings source supplies from <strong>TNT</strong><br />
Ex<strong>press</strong>.<br />
11. SUBSEQUENT EVENTS<br />
On 19 October 2012, United Parcel Service and <strong>TNT</strong> Ex<strong>press</strong> jointly announced that they had<br />
received a Statement of Objections (SO) from the European Commission (EC). The SO is a normal<br />
step in a second phase merger procedure and its content does not prejudge the final outcome. UPS<br />
and <strong>TNT</strong> Ex<strong>press</strong> have worked closely with the EC during this process, and will continue to have<br />
open and constructive discussions as they work towards completion of the transaction in early 2013.<br />
17
Date 29 October 2012<br />
REVIEW REPORT<br />
To: the Executive Board of <strong>TNT</strong> Ex<strong>press</strong> N.V.<br />
Introduction<br />
We have reviewed the accompanying consolidated interim financial statements for the nine-month<br />
period ended 29 September 2012 of <strong>TNT</strong> Ex<strong>press</strong> N.V., Amsterdam, which comprises the<br />
consolidated statement of financial position as at 29 September 2012, the consolidated income<br />
statement, the consolidated statement of comprehensive income, changes in equity, cash flows and<br />
the selected explanatory notes for the nine-month period then ended. The Executive Board is<br />
responsible for the preparation and presentation of these consolidated interim financial statements<br />
in accordance with IAS 34, ‘Interim Financial Reporting’ as adopted by the European Union. Our<br />
responsibility is to ex<strong>press</strong> a conclusion on this interim financial statements based on our review.<br />
Scope<br />
We conducted our review in accordance with Dutch law including standard 2410, Review of Interim<br />
Financial Information Performed by the Independent Auditor of the company. A review of interim<br />
financial information consists of making inquiries, primarily of persons responsible for financial and<br />
accounting matters, and applying analytical and other review procedures. A review is substantially<br />
less in scope than an audit conducted in accordance with auditing standards and consequently<br />
does not enable us to obtain assurance that we would become aware of all significant matters that<br />
might be identified in an audit. Accordingly, we do not ex<strong>press</strong> an audit opinion.<br />
Conclusion<br />
Based on our review, nothing has come to our attention that causes us to believe that the<br />
accompanying consolidated interim financial statements as at 29 September 2012 are not prepared,<br />
in all material respects, in accordance with IAS 34, ‘Interim Financial Reporting’ as adopted by the<br />
European Union.<br />
Amsterdam, 29 October 2012<br />
PricewaterhouseCoopers Accountants N.V.<br />
Original has been signed by drs. R. Dekkers RA<br />
18
Date 29 October 2012<br />
FINANCIAL CALENDAR<br />
18 February 2013 Publications 4Q12 results<br />
Additional information available at www.tnt.com/corporate/en/site/home.html#<br />
CONTACT INFORMATION<br />
INVESTOR RELATIONS MEDIA RELATIONS PUBLISHED BY <strong>TNT</strong> Ex<strong>press</strong> N.V.<br />
Andrew Beh<br />
Ernst Moeksis<br />
Taurusavenue 111<br />
Director Investor Relations Director External Communication 2132 LS Hoofddorp<br />
Phone +31 (0)88 393 9500 Phone +31 (0)88 393 9323<br />
P.O. Box 13000<br />
Email andrew.beh@tnt.com Mobile +31 (0)6 5118 9384<br />
Email ernst.moeksis@tnt.com<br />
1100 KG Amsterdam<br />
Phone +31 (0)88 393 9000<br />
Fax +31 (0)88 393 3000<br />
Email investorrelations@tnt.com<br />
WARNING ABOUT FORWARD-LOOKING STATEMENTS<br />
Some statements in this <strong>press</strong> <strong>release</strong> are "forward-looking statements". By their nature, forward-looking<br />
statements involve risk and uncertainty because they relate to events and depend on circumstances that will<br />
occur in the future. These forward-looking statements involve known and unknown risks, uncertainties and other<br />
factors that are outside of our control and impossible to predict and may cause actual results to differ materially<br />
from any future results ex<strong>press</strong>ed or implied. These forward-looking statements are based on current<br />
expectations, estimates, forecasts, analyses and projections about the industries in which we operate and<br />
management's beliefs and assumptions about future events. You are cautioned not to put undue reliance on<br />
these forward-looking statements, which only speak as of the date of this <strong>press</strong> <strong>release</strong> and are neither<br />
predictions nor guarantees of future events or circumstances. We do not undertake any obligation to <strong>release</strong><br />
publicly any revisions to these forward-looking statements to reflect events or circumstances after the date of<br />
this <strong>press</strong> <strong>release</strong> or to reflect the occurrence of unanticipated events, except as may be required under<br />
applicable securities laws.<br />
19


