View PDF - College of Veterinary Medicine - Texas A&M University
View PDF - College of Veterinary Medicine - Texas A&M University
View PDF - College of Veterinary Medicine - Texas A&M University

Create successful ePaper yourself
Turn your PDF publications into a flip-book with our unique Google optimized e-Paper software.
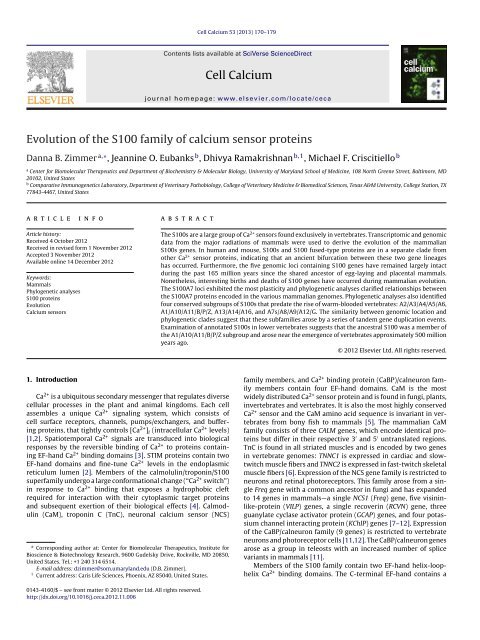
Cell Calcium 53 (2013) 170– 179<br />
Contents lists available at SciVerse ScienceDirect<br />
Cell Calcium<br />
jo u rn al hom epa ge: www.elsevier.com/locate/ceca<br />
Evolution <strong>of</strong> the S100 family <strong>of</strong> calcium sensor proteins<br />
Danna B. Zimmer a,∗ , Jeannine O. Eubanks b , Dhivya Ramakrishnan b,1 , Michael F. Criscitiello b<br />
a Center for Biomolecular Therapeutics and Department <strong>of</strong> Biochemistry & Molecular Biology, <strong>University</strong> <strong>of</strong> Maryland School <strong>of</strong> <strong>Medicine</strong>, 108 North Greene Street, Baltimore, MD<br />
20102, United States<br />
b Comparative Immunogenetics Laboratory, Department <strong>of</strong> <strong>Veterinary</strong> Pathobiology, <strong>College</strong> <strong>of</strong> <strong>Veterinary</strong> <strong>Medicine</strong> & Biomedical Sciences, <strong>Texas</strong> A&M <strong>University</strong>, <strong>College</strong> Station, TX<br />
77843-4467, United States<br />
a r t i c l e i n f o<br />
Article history:<br />
Received 4 October 2012<br />
Received in revised form 1 November 2012<br />
Accepted 3 November 2012<br />
Available online 14 December 2012<br />
Keywords:<br />
Mammals<br />
Phylogenetic analyses<br />
S100 proteins<br />
Evolution<br />
Calcium sensors<br />
1. Introduction<br />
a b s t r a c t<br />
Ca 2+ is a ubiquitous secondary messenger that regulates diverse<br />
cellular processes in the plant and animal kingdoms. Each cell<br />
assembles a unique Ca 2+ signaling system, which consists <strong>of</strong><br />
cell surface receptors, channels, pumps/exchangers, and buffering<br />
proteins, that tightly controls [Ca 2+ ] i (intracellular Ca 2+ levels)<br />
[1,2]. Spatiotemporal Ca 2+ signals are transduced into biological<br />
responses by the reversible binding <strong>of</strong> Ca 2+ to proteins containing<br />
EF-hand Ca 2+ binding domains [3]. STIM proteins contain two<br />
EF-hand domains and fine-tune Ca 2+ levels in the endoplasmic<br />
reticulum lumen [2]. Members <strong>of</strong> the calmolulin/troponin/S100<br />
superfamily undergo a large conformational change (“Ca 2+ switch”)<br />
in response to Ca 2+ binding that exposes a hydrophobic cleft<br />
required for interaction with their cytoplasmic target proteins<br />
and subsequent exertion <strong>of</strong> their biological effects [4]. Calmodulin<br />
(CaM), troponin C (TnC), neuronal calcium sensor (NCS)<br />
∗ Corresponding author at: Center for Biomolecular Therapeutics, Institute for<br />
Bioscience & Biotechnology Research, 9600 Gudelsky Drive, Rockville, MD 20850,<br />
United States. Tel.: +1 240 314 6514.<br />
E-mail address: dzimmer@som.umaryland.edu (D.B. Zimmer).<br />
1 Current address: Caris Life Sciences, Phoenix, AZ 85040, United States.<br />
0143-4160/$ – see front matter ©<br />
2012 Elsevier Ltd. All rights reserved.<br />
http://dx.doi.org/10.1016/j.ceca.2012.11.006<br />
The S100s are a large group <strong>of</strong> Ca 2+ sensors found exclusively in vertebrates. Transcriptomic and genomic<br />
data from the major radiations <strong>of</strong> mammals were used to derive the evolution <strong>of</strong> the mammalian<br />
S100s genes. In human and mouse, S100s and S100 fused-type proteins are in a separate clade from<br />
other Ca 2+ sensor proteins, indicating that an ancient bifurcation between these two gene lineages<br />
has occurred. Furthermore, the five genomic loci containing S100 genes have remained largely intact<br />
during the past 165 million years since the shared ancestor <strong>of</strong> egg-laying and placental mammals.<br />
Nonetheless, interesting births and deaths <strong>of</strong> S100 genes have occurred during mammalian evolution.<br />
The S100A7 loci exhibited the most plasticity and phylogenetic analyses clarified relationships between<br />
the S100A7 proteins encoded in the various mammalian genomes. Phylogenetic analyses also identified<br />
four conserved subgroups <strong>of</strong> S100s that predate the rise <strong>of</strong> warm-blooded vertebrates: A2/A3/A4/A5/A6,<br />
A1/A10/A11/B/P/Z, A13/A14/A16, and A7s/A8/A9/A12/G. The similarity between genomic location and<br />
phylogenetic clades suggest that these subfamilies arose by a series <strong>of</strong> tandem gene duplication events.<br />
Examination <strong>of</strong> annotated S100s in lower vertebrates suggests that the ancestral S100 was a member <strong>of</strong><br />
the A1/A10/A11/B/P/Z subgroup and arose near the emergence <strong>of</strong> vertebrates approximately 500 million<br />
years ago.<br />
© 2012 Elsevier Ltd. All rights reserved.<br />
family members, and Ca 2+ binding protein (CaBP)/calneuron family<br />
members contain four EF-hand domains. CaM is the most<br />
widely distributed Ca 2+ sensor protein and is found in fungi, plants,<br />
invertebrates and vertebrates. It is also the most highly conserved<br />
Ca 2+ sensor and the CaM amino acid sequence is invariant in vertebrates<br />
from bony fish to mammals [5]. The mammalian CaM<br />
family consists <strong>of</strong> three CALM genes, which encode identical proteins<br />
but differ in their respective 3 ′ and 5 ′ untranslated regions.<br />
TnC is found in all striated muscles and is encoded by two genes<br />
in vertebrate genomes: TNNC1 is expressed in cardiac and slowtwitch<br />
muscle fibers and TNNC2 is expressed in fast-twitch skeletal<br />
muscle fibers [6]. Expression <strong>of</strong> the NCS gene family is restricted to<br />
neurons and retinal photoreceptors. This family arose from a single<br />
Freq gene with a common ancestor in fungi and has expanded<br />
to 14 genes in mammals—a single NCS1 (Freq) gene, five visininlike-protein<br />
(VILP) genes, a single recoverin (RCVN) gene, three<br />
guanylate cyclase activator protein (GCAP) genes, and four potassium<br />
channel interacting protein (KChIP) genes [7–12]. Expression<br />
<strong>of</strong> the CaBP/calneuron family (9 genes) is restricted to vertebrate<br />
neurons and photoreceptor cells [11,12]. The CaBP/calneuron genes<br />
arose as a group in teleosts with an increased number <strong>of</strong> splice<br />
variants in mammals [11].<br />
Members <strong>of</strong> the S100 family contain two EF-hand helix-loophelix<br />
Ca 2+ binding domains. The C-terminal EF-hand contains a
12 amino acid Ca 2+ binding loop and is indistinguishable from<br />
EF-hands found in other Ca 2+ sensors. The N-terminal EF-hand,<br />
also referred to as a pseudo or non-canonical EF-hand, contains<br />
a 14 amino acid Ca 2+ binding loop that is unique to S100s<br />
[3]. The pseudo/non-canonical EF-hand is postulated to have<br />
arisen through gene duplication or exon recombination from a<br />
CaM gene with subsequent loss <strong>of</strong> two EF-hands [13]. The term<br />
S100 refers to the solubility <strong>of</strong> the two founding family members,<br />
S100A1 and S100B, in 100% saturated ammonium sulfate<br />
and was used in the early literature to denote a mixture <strong>of</strong><br />
S100A1 and S100B [14]. As new family members were discovered,<br />
the S100 nomenclature evolved, giving rise to numerous aliases<br />
(http://www.genenames.org/genefamilies/S100).<br />
S100 family members exhibit a high degree <strong>of</strong> structural similarity,<br />
but are not functionally interchangeable. With the exception<br />
<strong>of</strong> S100G, which is monomeric, S100 proteins are typically symmetric<br />
dimers [4]. Individual family members exhibit variable affinities<br />
for divalent metal ions (Ca 2+ , Zn 2+ , Cu 2+ ), oligomerization properties,<br />
post-translational modifications, and unique spatial/temporal<br />
expression patterns. S100s bind to and regulate a large number<br />
<strong>of</strong> target proteins, some <strong>of</strong> which are regulated by a single family<br />
member and others by multiple family members. Individual family<br />
members also have different binding orientations for target proteins<br />
that are due in part to differences in surface charge density<br />
[15]. The diversity among S100s, the protein targets that they interact<br />
with, and their cellular distribution allows cells to transduce a<br />
universal Ca 2+ signal into a unique biological response.<br />
The human genome encodes 21 S100 proteins, four <strong>of</strong> which<br />
are singletons dispersed throughout the genome: S100B on chromosome<br />
21, S100G on the X chromosome, S100P on chromosome<br />
4, and S100Z on chromosome 5. Genes for the remaining 17 S100<br />
family members are located in the epidermal differentiation complex<br />
(EDC) on human chromosome 1. The EDC consists <strong>of</strong> over<br />
50 genes within a 2 Mb region that are expressed predominantly<br />
in the skin. The EDC is conserved among humans, rodents, marsupials,<br />
and birds, but not fishes [16]. This region also encodes<br />
the seven S100-fusion type proteins (SFTP), small proline-rich proteins,<br />
cornified envelope proteins, involucrin, and loricrin [17]. The<br />
SFTPs, trichohyalin (TCHH), trichohyalin-like 1 (TCHHL1), repetin<br />
(REPN), hornerin (HRNR), fillagrin (FGL), fillagrin-2 (FGL2), and cornerin<br />
(CRRN), share the same structural organization at the protein<br />
level: a full-length S100 protein domain that is fused in-frame to<br />
differing repeat domains [18]. The S100 protein domain reversibly<br />
binds Ca 2+ and the different repeat domains are believed to function<br />
as intermediate-filament associated proteins or cornified epithelium<br />
proteins. It has been proposed that SFTP genes arose from<br />
the fusion <strong>of</strong> an S100 gene with an epidermal structural gene in<br />
the 1q21 region [19,20]. S100s have been identified in mammals,<br />
birds, reptiles, amphibians, and fish, but not outside <strong>of</strong> the vertebrates.<br />
They are thought to have arisen 460 million years ago<br />
during the Ordovician period long before vertebrates appeared on<br />
land [13,21]. Several S100s are unique to fishes and likely arose<br />
from gene duplication events that occurred after the ray-finned<br />
fish lineage branched from tetrapod lineages [22–25].<br />
This study uses recent whole genome sequencing data from<br />
diverse species to examine the molecular evolution <strong>of</strong> the S100 protein<br />
family in mammals. S100s and SFTPs were in a separate clade<br />
from other Ca 2+ sensor proteins indicating an ancient bifurcation<br />
between these two gene lineages. Furthermore, the five genomic<br />
loci containing S100 genes have remained largely intact in the 165<br />
million years since the shared ancestor <strong>of</strong> egg-laying and placental<br />
mammals. Nonetheless, interesting births and deaths <strong>of</strong> S100<br />
genes have occurred during mammalian evolution. The S100A7 loci<br />
exhibited the most plasticity and phylogenetic analyses clarified<br />
relationships between the S100A7 proteins encoded in the various<br />
mammalian genomes. Phylogenetic analyses also identified four<br />
D.B. Zimmer et al. / Cell Calcium 53 (2013) 170– 179 171<br />
conserved subgroups that predate the rise <strong>of</strong> warm-blooded vertebrates:<br />
A2/A3/A4/A5/A6, A1/A10/A11/B/P/Z, A13/A14/A16, and<br />
A7s/A8/A9/A12/G. The similarity between genomic location and<br />
phylogenetic clades suggests that the subgroups arose by tandem<br />
gene duplication events. Examination <strong>of</strong> annotated S100s in lower<br />
mammals suggests that the ancestral S100 was a member <strong>of</strong> the<br />
A1/A10/A11/B/P/Z subgroup and arose near the emergence <strong>of</strong> vertebrates<br />
approximately 500 million years ago. Additional genomic<br />
and transcriptomic resources will be required to clarify the earliest<br />
natural history <strong>of</strong> this extraordinary family <strong>of</strong> signaling molecules.<br />
2. Methods<br />
2.1. Identification <strong>of</strong> S100s<br />
A stepwise approach was used to identify coding sequences<br />
for the mammalian S100 genes. Keyword searches collecting all<br />
annotated S100s in the National Center for Biotechnological Information<br />
(NCBI) and Ensembl databases were followed by BLAST<br />
searches <strong>of</strong> the GenBank nonredundant protein and expressed<br />
sequence tag (EST) databases to retrieve other S100 family members<br />
using mouse and human sequences as query. For opossum,<br />
platypus, and lizard, the Ensembl database was used extensively.<br />
Other sequences in these species were obtained from EST searches<br />
in NCBI. Out <strong>of</strong> the four lamprey S100 sequences, three were<br />
published [21] but not available in any database, and the fourth<br />
sequence was found in the EST searches. The Xenopus sequences<br />
were obtained by BLAST searches using mouse, human and frog<br />
sequences as query as has been described [26].<br />
2.2. Evolutionary distances<br />
Open reading frame and amino acid alignments <strong>of</strong> S100<br />
homologs were initially made in Bioedit (http://www.mbio.<br />
ncsu.edu/bioedit/bioedit.html) with ClustalW employing gap<br />
opening penalties <strong>of</strong> 10 and gap extension penalties <strong>of</strong> 0.1 for<br />
pairwise alignments, then 0.2 for multiple alignments and the<br />
protein-weighting matrix <strong>of</strong> Gonnett and Blossum [27,28]. These<br />
alignments were then further modified after visual inspection.<br />
MEGA5 [29] was used to infer the phylogenetic relationships <strong>of</strong><br />
S100 and related Ca 2+ sensors. Distance matrices were computed<br />
for nucleotide alignments using the Maximum Composite Likelihood<br />
method and for amino acids using a Dayh<strong>of</strong>f matrix based<br />
method [30]. Accession numbers <strong>of</strong> sequences used in these analyses<br />
are provided in Supplemental Tables 1 and 2.<br />
2.3. Phylogenetic analyses<br />
MEGA5 was used to construct phylogenetic trees. All three<br />
codon positions <strong>of</strong> nucleotide data were included in the analyses:<br />
1290 nucleotide positions total for the human Ca 2+ sensor analysis<br />
and 1056 for the mouse Ca 2+ sensor analysis. Representative genes<br />
were included in the mouse and human trees to represent major<br />
families and produce the most meaningful phylogeny. For the panmammalian<br />
S100 analysis, 135 amino acids columns were used. An<br />
outgroup was not specified in the pan-mammalian analysis due to<br />
the unclear orthology <strong>of</strong> potential lower vertebrate sequences. The<br />
evolutionary histories were inferred using the Neighbor-Joining<br />
method as has been previously described [31]. The percentage <strong>of</strong><br />
replicate trees in which the associated taxa clustered together in<br />
the bootstrap test (1000 replicates) are shown next to the branches<br />
[32]. Trees were viewed using the Treeview s<strong>of</strong>tware [33].
172 D.B. Zimmer et al. / Cell Calcium 53 (2013) 170– 179<br />
2.4. Synteny analysis and annotation<br />
Eight species were chosen for exhaustive S100 synteny analysis<br />
based on balanced phylogenetic representation <strong>of</strong> the major<br />
mammalian radiations and state <strong>of</strong> genome projects (GRCh37 <strong>of</strong><br />
human, GRCm38 <strong>of</strong> mouse, CanFam3.1 <strong>of</strong> dog, UMD3.1<strong>of</strong> cow, das-<br />
Nov2 <strong>of</strong> armadillo, loxAfr3 <strong>of</strong> elephant, BROAD05 <strong>of</strong> opossum, and<br />
OANA5 <strong>of</strong> platypus). Additional work was performed in Tasmanian<br />
devil (DEVIL7.0) and wallaby (Meug 1.0) genomes for S100B. Analysis<br />
<strong>of</strong> genomic synteny was obtained from either the Gene Page<br />
or Map <strong>View</strong>er at the NCBI web site, with similar use <strong>of</strong> Ensembl<br />
when necessary. If an S100 gene was not found in one <strong>of</strong> the eight<br />
model species, the genes flanking it in other species were used as<br />
search queries in an attempt to find the orthologous locus. Intergenic<br />
sequences without an S100 gene present in other species<br />
were manually searched.<br />
3. Results and discussion<br />
3.1. Phylogenetic analysis <strong>of</strong> human and mouse S100s<br />
We began our analysis with the two species for which the most<br />
extensive genomic information and characterization was available,<br />
mouse and human. While excellent phylogenetic analyses <strong>of</strong> S100s<br />
have been produced based on amino acid sequence [13,23,34,35],<br />
nucleotide sequences provide additional data that has proven useful<br />
for other families [31]. However, positional homology is best<br />
established at the amino acid level due to the evolution <strong>of</strong> coding<br />
DNA as triplets <strong>of</strong> nucleotides, the degeneracy <strong>of</strong> the genetic code,<br />
and the larger alphabet <strong>of</strong> proteins that slow sequence similarity<br />
degradation and saturation phenomena [36]. Therefore, individual<br />
phylogenies for these species were created from amino acid alignments<br />
reverted to nucleotides (Fig. 1). Even though the nomenclature<br />
has been updated and additional Ca 2+ sensor families have<br />
been included, the resulting trees were very similar to previously<br />
published S100 trees [37,38]. Humans have 21 S100 proteins, four<br />
<strong>of</strong> which are not present in the mouse, S100P, S100A7, S100A7L2,<br />
and S100A12. In both species, there were two essential groups, one<br />
group consisted <strong>of</strong> S100s and SFTPs and the other group consisted <strong>of</strong><br />
non-S100 Ca 2+ sensors. A clade with parvalbumin and oncomodulin<br />
was the only inclusive difference in the major groupings between<br />
the two species’ trees. Additional analyses will be needed to determine<br />
if this difference is indicative <strong>of</strong> a common precursor for<br />
S100s/parvalbumin or a reflection <strong>of</strong> the resolution <strong>of</strong> the dendograms.<br />
Nonetheless, these results indicate that the S100s and SFTPs<br />
are more closely related to each other than any other Ca 2+ sensor<br />
Fig. 1. Ca 2+ sensor protein phylogenetic trees for human and mouse. Neighbor-joining dendrograms <strong>of</strong> human (Panel A) and mouse (Panel B) Ca 2+ sensor nucleotide sequences.<br />
Trees are drawn to scale with the branch lengths in the units <strong>of</strong> base substitutions per site. Colored blocks to the right <strong>of</strong> the trees highlight groups <strong>of</strong> sequences that cluster<br />
with congruent relationships in the analysis <strong>of</strong> multiple species. Accession numbers can be found in Supplemental Table 1. Numbers at nodes represent percentage <strong>of</strong> support<br />
from 1000 bootstrap replications. (For interpretation <strong>of</strong> the references to color in this figure legend, the reader is referred to the web version <strong>of</strong> this article.)
family in the analysis and are consistent with the hypothesis that<br />
the S100 pseudo EF hand evolved after the canonical EF-hand [13].<br />
The individual Ca 2+ sensor protein families (NSLC, CABP,<br />
CaM/TnC and parvalbumin) each fell into their own clade. Furthermore,<br />
subgroups/subfamilies emerged within the S100 family:<br />
A2/A3/A4/A5/A6 was strongly supported by both trees, and<br />
subgroups <strong>of</strong> A13/A14/A16, A7s/A8/A9/A12/G, and A1/A11/B/P/Z<br />
showed progressively weaker conservation in these two species.<br />
Members within these subgroups were largely located in juxtaposition<br />
to one another in the genome, suggesting that a series<br />
<strong>of</strong> tandem gene duplications contributed to the expansion <strong>of</strong> the<br />
S100 family. The older natural history between these groups was<br />
difficult to determine because, although each <strong>of</strong> the subfamilies<br />
forms clades, there was little statistical support from the bootstrap<br />
iterations for deeper relationships between the groups.<br />
3.2. Genomic organization<br />
As a first step in establishing the molecular evolution <strong>of</strong> the<br />
S100s, we expanded our analysis to include additional mammalian<br />
species. Since S100 expression is regulated at the epigenetic level<br />
[39], genomic rather than EST data was used to collect the complement<br />
<strong>of</strong> S100 family members encoded in the following select<br />
mammalian genomes (Table 1). The platypus was selected to represent<br />
the oldest egg-laying mammals (the monotremes), and the<br />
opossum was chosen as the most complete marsupial genome.<br />
Molecular phylogenetics suggests two major branches <strong>of</strong> extant<br />
placental mammals, and species from the two major bifurcations<br />
<strong>of</strong> each branch were included [40]. The Atlantagenata yielded<br />
Xentharthra (represented here by the armadillo) and Afrotheria<br />
(represented by the elephant). The Boreoeutheria included Lauraiatheria<br />
(represented by cow and dog) and the Euarchontoglires<br />
(represented by the mouse and human). Like the human and mouse,<br />
S100 family members in dog, cow, elephant, and opossum are<br />
encoded at six regions: S100As in two different regions on a single<br />
chromosome and S100B, S100P, S100G, and S100Z on four other<br />
chromosomes (Supplemental Figs. 1–6). With only minor exceptions,<br />
the genomic organization <strong>of</strong> S100 family members was highly<br />
conserved in mammals. These data are in agreement with previous<br />
studies, the only exception being earlier reports that the canine<br />
S100A cluster is located on a different chromosome from that <strong>of</strong><br />
other mammals [41]. While a detailed analysis <strong>of</strong> the organization<br />
<strong>of</strong> individual S100 genes was beyond the scope <strong>of</strong> this study, it<br />
should be noted that the position <strong>of</strong> intron/exon boundaries relative<br />
to 5 ′ UTRs, initiation codons and coding sequences was quite<br />
variable and not as highly conserved as was indicated prior to the<br />
completion <strong>of</strong> the mouse and human genomes [42].<br />
In all mammalian species, S100A11 and S100A10 were located<br />
in tandem adjacent to the SFTP genes (Supplemental Fig. 1). Adjacent<br />
genes on both sides were conserved as well. However, there<br />
were gene insertions between the SFPTs and neighboring genes<br />
in both the mouse (7 genes) and human (13 genes) genomes.<br />
The mouse genome also contained a four-gene insertion between<br />
S100A10 and its conserved neighbor THEM4. The opossum genome<br />
encoded an additional S100A10 on chromosome 4, referred to as<br />
S100A10(2), that was not found in any other species including the<br />
Australian marsupials (wallaby or Tasmanian devil). S100A10(2)<br />
was not detected in any “higher” mammals or the “lower” platypus<br />
by nearest neighbor analysis. The proteins encoded by these<br />
loci differed by 17 (out <strong>of</strong> 97) amino acids. Their pairwise matrix<br />
amino acid identity score (0.254) was much lower than scores for<br />
other opossum S100s (0.601–3.201), suggesting that S100A10(2)<br />
arose from an S100A10 gene duplication/translation event (Fig. 4).<br />
Finally, opossum ESTs were not detected for either loci; therefore<br />
we could not conclude that these genes were expressed.<br />
D.B. Zimmer et al. / Cell Calcium 53 (2013) 170– 179 173<br />
The S100A1-A100A16 loci were located on the same chromosome<br />
in all species and exhibited several interesting changes<br />
(Supplemental Fig. 2). The A1/A13/A14/A16 cluster was intact in<br />
all mammalian species for which complete contigs were available.<br />
The only change in the A8/A9/A12 cluster was the loss <strong>of</strong> S100A12<br />
in the mouse. Changes in the A2/A3/A4/A5/A6 cluster included a<br />
translocation <strong>of</strong> S100A5 in the dog, loss <strong>of</strong> S100A6 in the cow, and<br />
loss <strong>of</strong> S100A5 and S100A2 in the opossum. The largest number<br />
<strong>of</strong> changes occurred in the S100A7 loci. Mouse, dog, and opossum<br />
genomes contained a single S100A7 gene (S100A7A) while<br />
the human, cow, and elephant genomes contained three S100A7<br />
loci. Subsequent phylogenetic analyses <strong>of</strong> all mammalian S100s<br />
(Section 3.3) revealed that the human locus annotated as S100A7A<br />
actually encodes an S100A7-like protein, referred to as S100AL73,<br />
suggesting another duplication in this cluster.<br />
The remaining four S100 genomic loci encoding singletons were<br />
also highly conserved. The S100B locus was present in all species<br />
except the opossum (Supplemental Fig. 3). The platypus represented<br />
a more ancient clade but contained S100B, although there<br />
has been a block inversion <strong>of</strong> a set <strong>of</strong> genes flanking prmt2 that<br />
neighbor S100B. These results suggest that the loss <strong>of</strong> S100B is<br />
confined to the marsupial lineage. The S100B gene was found in<br />
two divergent Australian marsupials, although on an orphan contig<br />
without the commonly syntenic prmt2 and dip2a. Thus, the loss<br />
<strong>of</strong> S100B may be confined to the American marsupials or even a<br />
smaller evolutionary group including the short-tailed opossum.<br />
S100G was not present in platypus, but was found in all other<br />
species with minor changes in nearest neighbors (Supplementary<br />
Fig. 4). The lack <strong>of</strong> platypus S100G sequences and the strong conservation<br />
<strong>of</strong> syntenic genes on this well assembled portion <strong>of</strong><br />
the platypus genome suggest that S100G emerged in the marsupials<br />
and little has changed since then. The S100P locus had<br />
more checkered presentation in the assayed mammalian genomes<br />
(Supplementary Fig. 5). It was lost in mouse, cow, and elephant<br />
where nearest neighbors were conserved. In contrast to the plasticity<br />
<strong>of</strong> S100P, S100Z is maintained with high fidelity in mammalian<br />
genomes. All mammals examined contained an S100Z locus and the<br />
location within the genome did not change (Supplementary Fig. 6).<br />
3.3. Mammalian S100 tree<br />
Next we performed phylogenetic analysis <strong>of</strong> mammalian S100s,<br />
excluding other Ca 2+ sensors, to determine the relationship among<br />
various S100 family members (Fig. 2). This analysis confirmed the<br />
two subgroups observed in the human and mouse trees (Fig. 1):<br />
A2/A3/A4/A5/A6 and A13/A14/A16. In addition, two other subgroups<br />
emerged: A7s/A8/A9/A12/G and A1/A10/A11/Z/B/P. Three<br />
<strong>of</strong> these subgroups are clustered within the genome, suggesting<br />
that these subfamilies arose by tandem gene duplication events<br />
before the rise <strong>of</strong> mammals. These subgroups may also have<br />
structural and functional significance (Fig. 3). Members <strong>of</strong> the<br />
A7/A8/A9/A12 subgroup have demonstrated antimicrobial activity<br />
and play a major role in innate immunity [43]. Members <strong>of</strong><br />
the A2/A3/A4/A5/A6 and A1/A10/A11/Z/B/P subgroups have aromatic<br />
residues at the carboxyl termini that participate in target<br />
protein interactions [44,45]. In addition, four members <strong>of</strong> the<br />
A2/A3/A4/A5/A6 subgroup have amino acids with large side<br />
chains at position 85 and a charged side-chain at position 49<br />
(using S1004 numbering) that impact 3D structure [46]. However,<br />
other attributes that contribute to S100 diversity such as affinity<br />
for divalent metals, oligomerization properties, post-translational<br />
modification(s), surface charge density, target protein pr<strong>of</strong>ile and<br />
spatial/temporal expression patterns do not appear to be subgroup<br />
specific. For example, S100B is negatively charged and S100A10<br />
is neutral, but both are in the same subgroup [15]. S100A4 and<br />
S100P are in different subgroups, but both regulate myosin filament
174 D.B. Zimmer et al. / Cell Calcium 53 (2013) 170– 179<br />
assembly [47,48]. Additional comparative studies will be needed to<br />
determine if these subgroups have functional as well as evolutional<br />
significance.<br />
These analyses also clarified the relationship <strong>of</strong> the S100A7<br />
genes in mammals. There was support for the relationship between<br />
the S100A7A genes, which were adjacent to S100A8, in opossum,<br />
elephant, cow, dog, and mouse. However, some members<br />
<strong>of</strong> both major lineages <strong>of</strong> extant placentals (as evidenced by<br />
human, elephant, and cow) maintained a very different cluster<br />
with two additional genes, S100A7 and S100A7L, proximal to<br />
the A2/A3/A4/A5/A6 cluster. Humans have lost the more ancient<br />
S100A7A gene. All S100A7A genes form a clade with the only exception<br />
being the human S100A7A gene. Examination <strong>of</strong> amino acid<br />
sequences indicates that human S100A7A locus actually encoded<br />
an S100A7-like protein, designated S100A7L3. S100A7L3 had truncated<br />
N- and C-termini when compared to S100A7As. In addition,<br />
amino acid identity scores from pairwise identity matrices indicate<br />
that S100A7L3 was more homologous to S100A7 and S100A7L<br />
genes from elephant and cow than S100A7A genes (Supplemental<br />
Figs. 7 and 8). The distance between these two lineages <strong>of</strong> A7 family<br />
members was clear by 99% bootstrap analysis support in phylogenetic<br />
analysis (Figs. 1 and 2).<br />
Pairwise comparisons <strong>of</strong> S100 genes from human and opossum,<br />
the two most divergent species in the analysis with complete whole<br />
genome sequence data for S100 encoding regions, are shown in<br />
Fig. 4. The amino acid identity score for S100A12s from human<br />
and opossum (1.218) was in the same range as scores for S100A12<br />
comparisons to other human and opossum S100s (0.842–2.642),<br />
indicating that these loci are highly divergent. In contrast, S100A6,<br />
S100A8 and S100A9 exhibit greater conservation (amino acid identity<br />
scores 0.500–0.800). S100A1, S100A3, S100A4, S1005, S100A10,<br />
S100A11, S100A16, S100G, S100P, and S100Z were the most highly<br />
conserved proteins (amino acid identity scores
an annotated/published S100 was the lamprey Petromyzon marinus.<br />
The single lamprey S100 locus in Ensembl was annotated<br />
as S100A12 but BLAST searches indicated that this locus encoded<br />
S100B. However, it was not possible to confirm that this was<br />
S100B by nearest neighbor gene analysis. In fact, lamprey scaffolds<br />
were too short to confirm the presence or absence <strong>of</strong> any<br />
other S100s. Of the 10 lamprey S100 cDNAs reported in the literature,<br />
three (GENSCAN00000118637, GENESCAN00000111444<br />
and GENESCAN00000006715) were no longer in the databases and<br />
one encoded a heat shock protein (EC384389.1) [21,23]. Translated<br />
sequences for the remaining six contained EF-hand motifs but<br />
none matched existing lamprey scaffolds. Thus, additional genome<br />
annotation will be needed before the complement <strong>of</strong> S100 family<br />
members encoded in the lamprey genome can be determined.<br />
Nonetheless, the presence <strong>of</strong> an S100B gene in the lamprey genome<br />
supports our hypothesis that the A1/A10/A11/Z/B/P subgroup is<br />
D.B. Zimmer et al. / Cell Calcium 53 (2013) 170– 179 175<br />
the oldest. Only members <strong>of</strong> the A1/A10/A11/Z/B/P subgroup were<br />
annotated in Ensembl for the genomes <strong>of</strong> bony fishes, coelacanth<br />
and amphibians.<br />
We also used these analyses in lower species to determine if<br />
the absence <strong>of</strong> S100G in platypus was a species-specific deletion<br />
or site for the emergence <strong>of</strong> a gene. For example, S100G was not<br />
present in the opossum, but there was a single report <strong>of</strong> an S100G<br />
cDNA isolated from chicken (Gallus gallus) [50]. The absence <strong>of</strong> an<br />
S100G in birds (G. gallus and zebra finch Taeniopygia guttata) and<br />
reptiles (Anolis caroleninsis) was confirmed by nearest neighbor<br />
analysis and BLAST searches <strong>of</strong> translated ESTs using the opossum<br />
amino acid sequence as a query. In the case <strong>of</strong> Xenopus, bony fishes<br />
(zebrafish Danio rerio), coelacanth (Latimeria chalumnae), and lamprey,<br />
the contigs were too short to confirm the absence <strong>of</strong> an S100G<br />
gene at the genome level. However, no significant matches were<br />
obtained with BLAST searches <strong>of</strong> translated ESTs using the opossum<br />
Fig. 2. Evolutionary tree <strong>of</strong> putative mammalian S100s. Neighbor-joining dendrogram <strong>of</strong> vertebrate S100s. Using pairwise deletion, 182 alignment positions were used in the<br />
analysis. Tree is drawn to scale with the branch lengths in the units <strong>of</strong> amino acid substitutions per site. Colored blocks to the right <strong>of</strong> the tree highlight groups <strong>of</strong> sequences<br />
that cluster as monophyletic clades with congruent relationships in the analysis here and in Fig. 1. Accession numbers can be found in Supplemental Table 2. Numbers at<br />
nodes represent percentage <strong>of</strong> support from 1000 bootstrap replications. (For interpretation <strong>of</strong> the references to color in this figure legend, the reader is referred to the web<br />
version <strong>of</strong> this article.)
176 D.B. Zimmer et al. / Cell Calcium 53 (2013) 170– 179<br />
Fig. 3. Amino acid alignment <strong>of</strong> human S100 proteins. Amino acid sequences <strong>of</strong> human S100 family members (NCBI) organized according to subgroups identified by genomic<br />
organization and phylogenetic analyses. Dashes indicate gaps inserted for aligning EF-hands. The S100 (pseudo) EF-hand Ca 2+ binding loop is in dark blue, the C-terminal<br />
EF-hand Ca 2+ binding loop in light blue, the linker region connecting the EF-hands in green, alpha-helices in black, non-helical regions in gray and amino acids that may<br />
correlate with function domains in red. (For interpretation <strong>of</strong> the references to color in this figure legend, the reader is referred to the web version <strong>of</strong> this article.)<br />
amino acid sequence as a query. Collectively, these data indicate<br />
that the absence <strong>of</strong> an S100G gene in platypus is not the result <strong>of</strong> a<br />
species-specific deletion.<br />
We also investigated whether S100A1 was present in reptiles,<br />
amphibians, and coelacanth. Scaffolds containing the neighboring<br />
chtop were present in the Xenopus and anole genomes, but these<br />
scaffolds contained no other annotated genes and appeared too<br />
short to encode S100A1. Therefore, we searched EST libraries using<br />
the turkey (Meleagris gallopavo) S100A1 amino acid sequence as<br />
query. When limited to reptiles, three ESTs with E values
D.B. Zimmer et al. / Cell Calcium 53 (2013) 170– 179 177<br />
Fig. 5. Model <strong>of</strong> S100 mammalian evolution. Colored rectangles indicate genes present at mammal genesis, circles denote gene emergence and light rectangles gene loss. The<br />
topology <strong>of</strong> the tree is correct but the distances are not to scale. (For interpretation <strong>of</strong> the references to color in this figure legend, the reader is referred to the web version<br />
<strong>of</strong> this article.)<br />
Table 2<br />
S100 family members in lower vertebrates.<br />
Mammals Birds<br />
Chicken<br />
Turkey<br />
Zebrafinch<br />
Reptiles<br />
Lizard<br />
Turtle<br />
Amphibians<br />
Xenopus<br />
Coelacanth Boney<br />
fishes<br />
Tetraodon<br />
Cod<br />
Fugu<br />
S100A1 E E E X X X E E<br />
S100A10 E P E E E P X E<br />
S100A11 E E E E E E<br />
S100B E E E E E –<br />
E<br />
E<br />
S100P E E E E E E<br />
S100Z E E E E E E E E E P<br />
S100A13 E E E<br />
S100A14 E E<br />
S100A16 E E<br />
S100A2 E<br />
E<br />
S100A3 E<br />
S100A4 E E E<br />
S100A5 E<br />
E<br />
S100A6 E P E<br />
S100A7 E<br />
S100A8 E<br />
S100A9 E E E<br />
S100A12 E<br />
S100G E –<br />
P26olf<br />
Dicalcin<br />
–<br />
–<br />
P E<br />
P E<br />
E, Ensembl annotation; P, published; X, annotated in this study; –, no gene or EST identified.<br />
–<br />
–<br />
Lamprey<br />
–
178 D.B. Zimmer et al. / Cell Calcium 53 (2013) 170– 179<br />
Fig. 6. Model <strong>of</strong> S100 vertebrate natural history. Hypothesized emergence <strong>of</strong> the S100 A1/A10/A11/B/P/Z group early in vertebrate evolution, with the relatively recent<br />
emergence <strong>of</strong> the remaining three S100 groups identified in this work (tentatively placed near the common ancestor <strong>of</strong> the Synapsida that led to mammals and the Sauropsida<br />
that led to reptiles and birds). MYA, millions <strong>of</strong> years ago.<br />
complicates their use in this analysis, and the Xenopus tropicalis<br />
genome does not suggest the emergence <strong>of</strong> the three other<br />
S100 groups in the earliest tetrapods (amphibians). Resources in<br />
reptiles and birds are developing, and these must be used to determine<br />
where the large duplicative radiation <strong>of</strong> the chromosome<br />
one locus occurred, birthing the three other structural subgroups<br />
(A13/A14/A16, A2/A3/A4/A5/A6, and A7/A8/A9/A12/G) with subsequent<br />
translocation <strong>of</strong> S100G to a fifth S100-encoding chromosome.<br />
As genomic and transcriptomic resources continue to develop in<br />
cartilaginous fish, non-teleost bony fishes and reptiles, the evolutionary<br />
relationship between the S100s and SFTPs can be clarified.<br />
Structural and functional analyses <strong>of</strong> the ancestral S100 gene, once<br />
identified, will provide new insights regarding the evolution <strong>of</strong> Ca 2+<br />
signaling.<br />
4. Conclusions<br />
To summarize, we have identified four major subgroups<br />
<strong>of</strong> S100 genes based on phylogenetic relationships conserved<br />
across diverse species <strong>of</strong> mammals. One <strong>of</strong> these four subgroups,<br />
A1/A10/A11/B/P/Z, is evolutionarily as old as the vertebrates. The<br />
other three are much younger, and likely arose after amphibians,<br />
but before the first mammals. The phylogenetic relationships<br />
between these four subgroups <strong>of</strong>ten concur with genomic synteny,<br />
suggesting that each subgroup evolved by tandem duplication.<br />
Although there is great conservation <strong>of</strong> S100 genes among mammals,<br />
we observed marked plasticity in the S1007 subfamily and the<br />
occurrence <strong>of</strong> S100P. Understanding the earlier emergence <strong>of</strong> this<br />
fundamental group <strong>of</strong> Ca 2+ sensor proteins will require extension<br />
<strong>of</strong> these analyses into lower vertebrates as genome/transcriptome<br />
resources become available. Structural and functional analyses <strong>of</strong><br />
the ancestral S100 gene, once identified, when coupled with physiological<br />
studies on the impact <strong>of</strong> S100 gene births and deaths will<br />
provide new insights regarding the mechanisms by which cells<br />
transduce a universal Ca 2+ signal into a cell-specific response that<br />
can adapt to environmental changes.<br />
Conflict <strong>of</strong> interest statement<br />
The authors declare that they have no competing interests.<br />
Author’s contributions<br />
D.Z. and M.C. conceived the study, supervised the data collection/analyses<br />
and drafted the manuscript. J.E. collected data,<br />
prepared alignments, and organized figures. D.R. assisted with data<br />
collection/analysis as partial fulfillment <strong>of</strong> the requirements for<br />
a MS degree in the pr<strong>of</strong>essional Program in Biotechnology. All<br />
authors read and approved the final manuscript.<br />
Acknowledgments<br />
We thank S. Dindot and D. Weinstein for critical reading <strong>of</strong> the<br />
manuscript.<br />
Appendix A. Supplementary data<br />
Supplementary data associated with this article can be found, in<br />
the online version, at http://dx.doi.org/10.1016/j.ceca.2012.11.006.
References<br />
[1] M.J. Berridge, Calcium signalling remodelling and disease, Biochemical Society<br />
Transactions 40 (2012) 297–309.<br />
[2] J. Sobol<strong>of</strong>f, B.S. Rothberg, M. Madesh, D.L. Gill, STIM proteins: dynamic calcium<br />
signal transducers, Nature Reviews Molecular Cell Biology 13 (2012)<br />
549–565.<br />
[3] H. Kawasaki, S. Nakayama, R.H. Kretsinger, Classification and evolution <strong>of</strong> EFhand<br />
proteins, Biometals 11 (1998) 277–295.<br />
[4] K.L. Yap, J.B. Ames, M.B. Swindells, M. Ikura, Diversity <strong>of</strong> conformational states<br />
and changes within the EF-hand protein superfamily, Proteins 37 (1999)<br />
499–507.<br />
[5] F. Friedberg, A.R. Rhoads, Evolutionary aspects <strong>of</strong> calmodulin, IUBMB Life 51<br />
(2001) 215–221.<br />
[6] T.E. Gillis, C.R. Marshall, G.F. Tibbits, Functional and evolutionary relationships<br />
<strong>of</strong> troponin C, Physiological Genomics 32 (2007) 16–27.<br />
[7] R.D. Burgoyne, Neuronal calcium sensor proteins: generating diversity in neuronal<br />
Ca 2+ signalling, Nature Reviews Neuroscience 8 (2007) 182–193.<br />
[8] R.D. Burgoyne, J.L. Weiss, The neuronal calcium sensor family <strong>of</strong> Ca 2+ -binding<br />
proteins, Biochemical Journal 353 (2001) 1–12.<br />
[9] K.-H. Braunewell, The darker side <strong>of</strong> Ca 2+ signaling by neuronal Ca 2+ -sensor proteins:<br />
from Alzheimer’s disease to cancer, Trends in Pharmacological Sciences<br />
26 (2005) 345–351.<br />
[10] K.-H. Braunewell, A. Szanto, Visinin-like proteins (VSNLs): interaction partners<br />
and emerging functions in signal transduction <strong>of</strong> a subfamily <strong>of</strong> neuronal Ca 2+ -<br />
sensor proteins, Cell and Tissue Research 335 (2009) 301–316.<br />
[11] H. McCue, L. Haynes, R. Burgoyne, Bioinformatic analysis <strong>of</strong> CaBP/calneuron<br />
proteins reveals a family <strong>of</strong> highly conserved vertebrate Ca 2+ -binding proteins,<br />
BMC Research Notes 3 (2010) 118.<br />
[12] H.V. McCue, L.P. Haynes, R.D. Burgoyne, The diversity <strong>of</strong> calcium sensor proteins<br />
in the regulation <strong>of</strong> neuronal function, Cold Spring Harbor Perspectives<br />
in Biology 2 (2010) a004085.<br />
[13] T. Ravasi, K. Hsu, J. Goyette, K. Schroder, Z. Yang, F. Rahimi, L.P. Miranda, P.F. Alewood,<br />
D.A. Hume, C. Geczy, Probing the S100 protein family through genomic<br />
and functional analysis, Genomics 84 (2004) 10–22.<br />
[14] B.W. Moore, A soluble protein characteristic <strong>of</strong> the nervous system, Biochemical<br />
and Biophysical Research Communications 19 (1965) 739–744.<br />
[15] M. Ikura, J.B. Ames, Genetic polymorphism and protein conformational plasticity<br />
in the calmodulin superfamily: two ways to promote multifunctionality,<br />
Proceedings <strong>of</strong> the National Academy <strong>of</strong> Sciences <strong>of</strong> the United States <strong>of</strong> America<br />
103 (2006) 1159–1164.<br />
[16] K. Magdalini, H. Marcel, H. Daniel, The human epidermal differentiation complex:<br />
cornified envelope precursors, S100 proteins and the ‘fused genes’ family,<br />
Experimental Dermatology 21 (2012) 643–649.<br />
[17] J. Henry, E. Toulza, C.Y. Hsu, L. Pellerin, S. Balica, J. Mazereeuw-Hautier, C. Paul,<br />
G. Serre, N. Jonca, M. Simon, Update on the epidermal differentiation complex,<br />
Frontiers in Bioscience 17 (2012) 1517–1532.<br />
[18] S.J. Brown, W.H.I. McLean, One remarkable molecule: filaggrin, Journal <strong>of</strong> Investigative<br />
Dermatology 132 (2012) 751–762.<br />
[19] P. Krieg, M. Schuppler, R. Koesters, A. Mincheva, P. Lichter, F. Marks, Repetin<br />
(Rptn), a new member <strong>of</strong> the “fused gene” subgroup within the S100 gene family<br />
encoding a murine epidermal differentiation protein, Genomics 43 (1997)<br />
339–348.<br />
[20] R. Contzler, B. Favre, M. Huber, D. Hohl, Cornulin, a new member <strong>of</strong> the “fused<br />
gene” family, is expressed during epidermal differentiation, Journal <strong>of</strong> Investigative<br />
Dermatology 124 (2005) 990–997.<br />
[21] R.O. Morgan, S. Martin-Almedina, M. Garcia, J. Jhoncon-Kooyip, M.-P. Fernandez,<br />
Deciphering function and mechanism <strong>of</strong> calcium-binding proteins from<br />
their evolutionary imprints, Biochimica et Biophysica Acta – Molecular Cell<br />
Research 1763 (2006) 1238–1249.<br />
[22] V.G. Fonseca, J. Rosa, V. Laize, P.J. Gavaia, M.L. Cancela, Identification <strong>of</strong> a new<br />
cartilage-specific S100-like protein up-regulated during endo/perichondral<br />
mineralization in gilthead seabream, Gene Expression Patterns 11 (2011)<br />
448–455.<br />
[23] A.M. Kraemer, L.R. Saraiva, S.I. Korsching, Structural and functional diversification<br />
in the teleost S100 family <strong>of</strong> calcium-binding proteins, BMC Evolutionary<br />
Biology 8 (2008) 48.<br />
[24] C.D. Hsiao, M. Ekker, H.J. Tsai, Skin-specific expression <strong>of</strong> ictacalcin, a homolog<br />
<strong>of</strong> the S100 genes, during zebrafish embryogenesis, Developmental Dynamics<br />
228 (2003) 745–750.<br />
[25] J. Bobe, F.W. Goetz, A S100 homologue mRNA isolated by differential display<br />
PCR is down-regulated in the brook trout (Salvelinus fontinalis) post-ovulatory<br />
ovary, Gene 257 (2000) 187–194.<br />
[26] Z.E. Parra, Y. Ohta, M.F. Criscitiello, M.F. Flajnik, R.D. Miller, The dynamic<br />
TCRdelta: TCRdelta chains in the amphibian Xenopus tropicalis utilize antibodylike<br />
V genes, European Journal <strong>of</strong> Immunology 40 (2010) 2319–2329.<br />
D.B. Zimmer et al. / Cell Calcium 53 (2013) 170– 179 179<br />
[27] T.A. Hall, BioEdit: a user-friendly biological sequence alignment editor and<br />
analysis program for Windows 95/98/NT, Nucleic Acids Symposium Series 41<br />
(1999) 95–98.<br />
[28] K. Tamura, J. Dudley, M. Nei, S. Kumar, MEGA4: Molecular Evolutionary Genetics<br />
Analysis (MEGA) s<strong>of</strong>tware version 4.0, Molecular Biology and Evolution 24<br />
(2007) 1596–1599.<br />
[29] K. Tamura, D. Peterson, N. Peterson, G. Stecher, M. Nei, S. Kumar, MEGA5: molecular<br />
evolutionary genetics analysis using maximum likelihood, evolutionary<br />
distance, and maximum parsimony methods, Molecular Biology and Evolution<br />
28 (2011) 2731–2739.<br />
[30] R. Schwarz, M. Dayh<strong>of</strong>f, Matrices for detecting distant relationships, in: M.<br />
Dayh<strong>of</strong>f (Ed.), Atlas <strong>of</strong> Protein Sequences, National Biomedical Research Foundation,<br />
1979, pp. 353–358.<br />
[31] M.F. Criscitiello, Y. Ohta, M. Saltis, E.C. McKinney, M.F. Flajnik, Evolutionarily<br />
conserved TCR binding sites, identification <strong>of</strong> T cells in primary lymphoid<br />
tissues, and surprising trans-rearrangements in nurse shark, Journal <strong>of</strong><br />
Immunology 184 (2010) 6950–6960.<br />
[32] J. Felsenstein, Confidence limits on phylogenies: an approach using the bootstrap,<br />
Evolution 39 (1985) 783–791.<br />
[33] R.D. Page, Visualizing phylogenetic trees using Tree<strong>View</strong>, in: A.D. Baxevanis,<br />
et al. (Eds.), Current Protocols in Bioinformatics/Editoral Board, John Wiley &<br />
Sons, Hoboken, NJ, 2002 (Chapter 6, Unit 6.2).<br />
[34] R.O. Morgan, S. Martin-Almedina, M. Garcia, J. Jhoncon-Kooyip, M.P. Fernandez,<br />
Deciphering function and mechanism <strong>of</strong> calcium-binding proteins from their<br />
evolutionary imprints, Biochimica et Biophysica Acta 1763 (2006) 1238–1249.<br />
[35] X. Shang, H. Cheng, R. Zhou, Chromosomal mapping, differential origin and evolution<br />
<strong>of</strong> the S100 gene family, Genetics Selection Evolution 40 (2008) 449–464.<br />
[36] F. Abascal, R. Zardoya, M.J. Telford, TranslatorX: multiple alignment <strong>of</strong><br />
nucleotide sequences guided by amino acid translations, Nucleic Acids<br />
Research 38 (2010) W7–W13.<br />
[37] J.K. Kulski, C.P. Lim, D.S. Dunn, M. Bellgard, Genomic and phylogenetic analysis<br />
<strong>of</strong> the S100A7 (Psoriasin) gene duplications within the region <strong>of</strong> the S100 gene<br />
cluster on human chromosome 1q21, Journal <strong>of</strong> Molecular Evolution 56 (2003)<br />
397–406.<br />
[38] Y. Zhou, W. Yang, M. Kirberger, H.W. Lee, G. Ayalasomayajula, J.J. Yang, Prediction<br />
<strong>of</strong> EF-hand calcium-binding proteins and analysis <strong>of</strong> bacterial EF-hand<br />
proteins, Proteins 65 (2006) 643–655.<br />
[39] W. Lesniak, Epigenetic regulation <strong>of</strong> S100 protein expression, Clinical Epigenetics<br />
2 (2011) 77–83.<br />
[40] W.J. Murphy, E. Eizirik, S.J. O’Brien, O. Madsen, M. Scally, C.J. Douady, E. Teeling,<br />
O.A. Ryder, M.J. Stanhope, W.W. de Jong, M.S. Springer, Resolution <strong>of</strong> the early<br />
placental mammal radiation using Bayesian phylogenetics, Science 294 (2001)<br />
2348–2351.<br />
[41] C. de Guzman Strong, S. Conlan, C.B. Deming, J. Cheng, K.E. Sears, J.A. Segre, A<br />
milieu <strong>of</strong> regulatory elements in the epidermal differentiation complex syntenic<br />
block: implications for atopic dermatitis and psoriasis, Human Molecular<br />
Genetics 19 (2010) 1453–1460.<br />
[42] D.B. Zimmer, J. Chessher, W. Song, Nucleotide homologies in genes encoding<br />
members <strong>of</strong> the S100 protein family, Biochimica et Biophysica Acta 1313 (1996)<br />
229–238.<br />
[43] R. Donato, B.R. Cannon, G. Sorci, F. Riuzzi, K. Hsu, D.J. Weber, C.L. Geczy, Functions<br />
<strong>of</strong> S100 proteins, Current Molecular <strong>Medicine</strong> (2012) [Epub ahead <strong>of</strong><br />
print].<br />
[44] D.B. Zimmer, D.J. Weber, The calcium-dependent interaction <strong>of</strong> S100B with its<br />
protein targets, Cardiovascular Psychiatry and Neurology (2010) [2010 Epub].<br />
[45] A. Landar, R.R. Rustandi, D.J. Weber, D.B. Zimmer, S100A1 utilizes different<br />
mechanisms for interacting with calcium-dependent and calciumindependent<br />
target proteins, Biochemistry 37 (1998) 17429–17438.<br />
[46] K.M. Vallely, R.R. Rustandi, K.C. Ellis, O. Varlamova, A.R. Bresnick, D.J. Weber,<br />
Solution structure <strong>of</strong> human Mts1 (S100A4) as determined by NMR spectroscopy,<br />
Biochemistry 41 (2002) 12670–12680.<br />
[47] R.P. House, S.C. Garrett, A.R. Bresnick, Moving aggressively: S100A4 and tumor<br />
invasion, in: A. Fatatis (Ed.), Signaling Pathways and Molecular Mediators in<br />
Mestastasis, Springer, New York, NY, 2012, pp. 91–114.<br />
[48] M. Du, G. Wang, T.M. Ismail, S. Gross, D.G. Fernig, R. Barraclough, P.S. Rudland,<br />
S100p dissociates myosin IIA filaments and focal adhesion sites to reduce<br />
cell adhesion and enhance cell migration, Journal <strong>of</strong> Biological Chemistry 287<br />
(2012) 15330–15344.<br />
[49] D.B. Zimmer, J. Chaplin, A. Baldwin, M. Rast, S100-mediated signal transduction<br />
in the nervous system and neurological diseases, Cellular and Molecular Biology<br />
(Noisy-le-grand) 51 (2005) 201–214.<br />
[50] S.B. Zanello, R.L. Boland, A.W. Norman, cDNA sequence identity <strong>of</strong> a vitamin<br />
D-dependent calcium-binding protein in the chick to calbindin D-9K,<br />
Endocrinology 136 (1995) 2784–2787.<br />
[51] S. Ohno, Evolution by Gene Duplication, Springer-Verlag, Berlin, New York,<br />
1970.
9. SUPPLEMENTAL DATA<br />
Supplemental Table 1. Calcium binding protein gene accession numbers<br />
Species Family Member Accession No. Method Database<br />
Mouse Calmodulin Calm1 NP_33920 Keyword search NCBI<br />
Mouse Calm2 NP_031615 Keyword search NCBI<br />
Mouse Calm3 NP_031616 Keyword search NCBI<br />
Mouse Calm4 NP_064420 Keyword search NCBI<br />
Mouse Cam5 NP_001008706 Keyword search NCBI<br />
Mouse Troponin C Tnnc1 NP_033419 Keyword search NCBI<br />
Mouse Tnnc2 NP_033420 Keyword search NCBI<br />
Mouse Parvalbumin Pvalb NP_038673 Keyword search NCBI<br />
Mouse Ocm NP_149028 Keyword search NCBI<br />
Mouse NSLC Ncs1 NP_062655 Keyword search NCBI<br />
Mouse Rcvrn NP_033064 Keyword search NCBI<br />
Mouse Vsnl1 NP_036168 Keyword search NCBI<br />
Mouse Hpca NP_034601 Keyword search NCBI<br />
Mouse Hpcal1 NP_057886 Keyword search NCBI<br />
Mouse Hpcal4 NP_778163 Keyword search NCBI<br />
Mouse Kcnip1 NP_081674 Keyword search NCBI<br />
Mouse Kcnip2 is<strong>of</strong>orm a NP_663749 Keyword search NCBI<br />
Mouse Kcnip2 is<strong>of</strong>orm b NP_109641 Keyword search NCBI<br />
Mouse Kcnip2 is<strong>of</strong>orm c NP_663750 Keyword search NCBI<br />
Mouse Kcnip3 NP_062763 Keyword search NCBI<br />
Mouse GUCA1A NP_032215 Keyword search NCBI<br />
Mouse GUAC1B NP_666191 Keyword search NCBI<br />
Mouse GUAC2B NP_032217 Keyword search NCBI<br />
Mouse Kcnip4 NP_084541 Keyword search NCBI<br />
Mouse Calbindin D28 Calb1 NP_033918 Keyword search NCBI<br />
Mouse Calb2 NP_031612 Keyword search NCBI<br />
Mouse Fused S100s TCHH NP_001156570 Keyword search NCBI<br />
Mouse TCHHL1 NP_082038 Keyword search NCBI<br />
Mouse Rptn NP_033126 Keyword search NCBI<br />
Mouse FGL XP_485270 Keyword search NCBI<br />
Mouse FGL2 NP_001013826 Keyword search NCBI<br />
Mouse HRNR NP_598456 Keyword search NCBI<br />
Mouse Crnn NP_001074669 Keyword search NCBI<br />
Mouse CaBP Caln1 NP_067346 Keyword search NCBI<br />
Mouse Cabp7 NP_620398 Keyword search NCBI<br />
Page 1
Mouse Cabp1 NP_038907 Keyword search NCBI<br />
Mouse Cabp2 NP_038906 Keyword search NCBI<br />
Mouse Cabp4 NP_653115 Keyword search NCBI<br />
Mouse Cabp5 NP_038905 Keyword search NCBI<br />
Mouse S100 S100B ENSMUST00000036387 Keyword Search Ensembl<br />
Mouse S100G ENSMUST00000038769 Keyword Search Ensembl<br />
Mouse S100P ENSMUST00000071949 Keyword Search Ensembl<br />
Mouse S100Z ENSMUST00000022186 Keyword Search Ensembl<br />
Mouse S100A1 ENSMUST00000060738 Keyword Search Ensembl<br />
Mouse S100A2 ENSMUST00000179550 Keyword Search Ensembl<br />
Mouse S100A3 ENSMUST00000001047 Keyword Search Ensembl<br />
Mouse S100A4 ENSMUST00000107330 Keyword Search Ensembl<br />
Mouse S100A5 ENSMUST00000107329 Keyword Search Ensembl<br />
Mouse S100A6 ENSMUST00000001051 Keyword Search Ensembl<br />
Mouse S100A7 ENSMUST00000079286 Keyword Search Ensembl<br />
Mouse S100A8 ENSMUST00000069927 Keyword Search Ensembl<br />
Mouse S100A9 ENST00000368738 Keyword Search Ensembl<br />
Mouse S100A10 ENSMUST00000045756 Keyword Search Ensembl<br />
Mouse S100A11 ENSMUST00000029515 Keyword Search Ensembl<br />
Mouse S100A13 ENSMUST00000048138 Keyword Search Ensembl<br />
Mouse S100A14 ENSMUST00000164481 Keyword Search Ensembl<br />
Mouse S100A16 ENSMUST00000098911 Keyword Search Ensembl<br />
Human Calmodulin CALM1 NP_008819 Keyword search NCBI<br />
Human CALM2 NP_001734 Keyword search NCBI<br />
Human CALM3 NP_005175 Keyword search NCBI<br />
Human Troponin C TNNC1 NP_003271 Keyword search NCBI<br />
Human TNNC2 NP_003270 Keyword search NCBI<br />
Human Parvalbumin PVALB NP_002845 Keyword search NCBI<br />
Human OCM NP_001091091 Keyword search NCBI<br />
Human OCM2 NP_0016179 Keyword search NCBI<br />
Human NSLC NCS1 is<strong>of</strong>orm 1 NP_055101 Keyword search NCBI<br />
Human NCS1 is<strong>of</strong>orm 2 NP_001122298 Keyword search NCBI<br />
Human RCVRN NP_002894 Keyword search NCBI<br />
Human VSNL1 NP_003376 Keyword search NCBI<br />
Human HPCA NP_002134 Keyword search NCBI<br />
Human HPCAL1 transcript 1 NP_002140 Keyword search NCBI<br />
Human HPCAL1 transcript 2 NP_602293 Keyword search NCBI<br />
Human HPCAL4 NP_057341 Keyword search NCBI<br />
Human KCNIP1 is<strong>of</strong>orm 1 NP_001030009 Keyword search NCBI<br />
Human KCNIP1 is<strong>of</strong>orm 2 NP_055407 Keyword search NCBI<br />
Page 2
Human KCNIP1 is<strong>of</strong>orm 3 NP_001030010 Keyword search NCBI<br />
Human KCNIP2 is<strong>of</strong>orm 1 NP_055406 Keyword search NCBI<br />
Human KCNIP2 is<strong>of</strong>orm 2 NP_775283 Keyword search NCBI<br />
Human KCNIP2 is<strong>of</strong>orm 3 NP_775284 Keyword search NCBI<br />
Human KCNIP2 is<strong>of</strong>orm 4 NP_775285 Keyword search NCBI<br />
Human KCNIP2 is<strong>of</strong>orm 5 NP_775286 Keyword search NCBI<br />
Human KCNIP2 is<strong>of</strong>orm 6 NP_775287 Keyword search NCBI<br />
Human KCNIP2 is<strong>of</strong>orm 7 NP_775289 Keyword search NCBI<br />
Human KNCIP3 is<strong>of</strong>orm 1 NP_038462 Keyword search NCBI<br />
Human KNCIP3 is<strong>of</strong>orm 2 NP_001030086 Keyword search NCBI<br />
Human KNCIP4 is<strong>of</strong>orm 1 NP_079497 Keyword search NCBI<br />
Human KNCIP4 is<strong>of</strong>orm 2 NP_671710 Keyword search NCBI<br />
Human KNCIP4 is<strong>of</strong>orm 3 NP_001030176 Keyword search NCBI<br />
Human KNCIP4 is<strong>of</strong>orm 3 NP_671711 Keyword search NCBI<br />
Human KNCIP4 is<strong>of</strong>orm 4 NP_671712 Keyword search NCBI<br />
Human GUCA1A NP_000400 Keyword search NCBI<br />
Human GUAC1B NP_002089 Keyword search NCBI<br />
Human GUAC2B NP_009033 Keyword search NCBI<br />
Human KNCIP4 is<strong>of</strong>orm 5 NP_001030175 Keyword search NCBI<br />
Human Calbindin D28 CALB1 NP_004920 Keyword search NCBI<br />
Human CALB2 is<strong>of</strong>orm 1 NP_001731 Keyword search NCBI<br />
Human CALB2 is<strong>of</strong>orm 20K NP_009018 Keyword search NCBI<br />
Human CALB2 is<strong>of</strong>orm 22K NP_009019 Keyword search NCBI<br />
Human Fused S100s TCHH NP_009044 Keyword search NCBI<br />
Human TCHHL1 NP_001008536 Keyword search NCBI<br />
Human REPN NP_001116437 Keyword search NCBI<br />
Human FGL NP_002007 Keyword search NCBI<br />
Human FGL2 NP_001014364 Keyword search NCBI<br />
Human HRNR NP_001009931 Keyword search NCBI<br />
Human CRNN NP_057274 Keyword search NCBI<br />
Human CALN1 NP_113656 Keyword search NCBI<br />
Human NP_001017440 Keyword search NCBI<br />
Human CABP7 NP_872333 Keyword search NCBI<br />
Human CABP1 NP_001028849 Keyword search NCBI<br />
Human NP_112482 Keyword search NCBI<br />
Human NP_004267 Keyword search NCBI<br />
Human CABP2 NP_112481 Keyword search NCBI<br />
Human NP_057450 Keyword search NCBI<br />
Human CABP3 AAF25798 Keyword search NCBI<br />
Page 3
Human CABP4 NP_660201 Keyword search NCBI<br />
Human CABP5 NP_062829 Keyword search NCBI<br />
Human S100 S100B ENST00000291700 Keyword Search Ensembl<br />
Human S100G ENST00000380200 Keyword Search Ensembl<br />
Human S100P ENST00000296370 Keyword Search Ensembl<br />
Human S100Z ENST00000513010 Keyword Search Ensembl<br />
Human S100A1 ENST00000292169 Keyword Search Ensembl<br />
Human S100A2 ENST00000368708 Keyword Search Ensembl<br />
Human S100A3 ENST00000368713 Keyword Search Ensembl<br />
Human S100A4 ENST00000368716 Keyword Search Ensembl<br />
Human S100A5 ENST00000368718 Keyword Search Ensembl<br />
Human S100A6 ENST00000368720 Keyword Search Ensembl<br />
Human S100A7A ENST00000368729 Keyword Search Ensembl<br />
Human S1007L2 ENST00000368725 Keyword Search Ensembl<br />
Human S100A7 ENST00000368723 Keyword Search Ensembl<br />
Human S100A8 ENST00000368733 Keyword Search Ensembl<br />
Human S100A9 ENSMUST00000069960 Keyword Search Ensembl<br />
Human S100A10 ENST00000368811 Keyword Search Ensembl<br />
Human S100A11 ENST00000271638 Keyword Search Ensembl<br />
Human S100A12 ENST00000368737 Keyword Search Ensembl<br />
Human S100A13 ENST00000339556 Keyword Search Ensembl<br />
Human S100A14 ENST00000476873 Keyword Search Ensembl<br />
Human S100A16 ENST00000368703 Keyword Search Ensembl<br />
Page 4
Supplemental Table 2: Accession Numbers for Mammalian S100s<br />
S100 Species locus (S100 coordinates) build Annoted As Gene accession<br />
S100B human chr 21q22.3 48,018,875-<br />
48,025,121<br />
GRCh37 ENSP00000291700<br />
mouse chr 10c1 75,716,598-75,723,904 NCBIM37 ENSMUSP00000047968<br />
dog chr 31 42,152,420-42,155,916 BROADD2 ENSCAFG00000012228<br />
cattle chr 1 148,009,651-148,016,981 UMD3.1 ENSBTAG00000004777<br />
armadillo scaf 6436 320,705-323,226 dasNOV2 not ENSDNOP00000013481<br />
elephant scaf 110 3,539,000-3,542,551 loxAfr3 ENSLAFG00000014935<br />
opossum chr 2 523,811,717-523,856,003 BROAD05 ENSMODG00000008324<br />
Tazmanian<br />
devil<br />
scaf GL 857102 DEVIL7.0 ENSSHAG00000005156<br />
wallaby est FY475974<br />
wallaby scaf 58856 7,785-9,224 Meug_1.0 ENSMEUG00000013166<br />
wallaby scaf 6612 Meug_1.0 ENSMEUG00000000150<br />
platypus contig 273 280,484-285,865 OANA5 F7DN18 ENSOANG00000013550<br />
S100G human chr x 16,668,281-16,672,793 GRCh37 ENSG00000169906<br />
mouse chr x 159,399,924-159,402,531 NCBIM37 ENSMUSG00000040808<br />
dog chr x 12,764,087-12,768,341 BROADD2 ENSCAFG00000012583<br />
cattle chr X: 134101039-134104560 UMD3.1 ENSBTAG00000017020<br />
armadillo scaf 307: 156,749-159,701 dasNOV2 ENSDNOG00000009022<br />
elephant scaf 39 15,069,030-15,072,124 loxAfr3 ENSLAFG00000016495<br />
opossum chr 7 23,039,919-23,043,569 BROAD05 ENSMODG00000017180<br />
platypus contig 462 8,635,600-8,673,252 OANA5 F7FDW4 ENSOANG00000002569<br />
S100P human chr 4 6,694,796-6,698,897 GRCh37 ENSG00000163993<br />
mouse chr 5 37,138,613-37,139,918 NCBIM37 ENSMUSG00000060708<br />
dog chr 3 61,624,720-61,627,128 BROADD2 ENSCAFG00000014333<br />
cattle chr 6 118,023,637-118,025,125 UMD3.1 QOVCC3 ENSBTAG00000003766<br />
armadillo scaf 102319 2,464-5,563 dasNOV2 ENSDNOG00000015334<br />
elephant scaf 167 93,494-94,126 loxAfr3 ENSLAFG00000005182<br />
opossum chr 5 224,088,517-224,093,675 BROAD05 ENSMODG00000002897<br />
platypus contig 29525 9,396-11,190 OANA5 F6SVG7 ENSOANG00000022358<br />
platypus contig 4744 9,396-11,190 OANA5 F7BP21 ENSOANG00000003982<br />
S100Z human chr 5 76,145,826-76,217,475 GRCh37 ENSG00000171643<br />
mouse chr 13 96,247,256-96,248,610 NCBIM37 ENSMUSG00000021679<br />
dog chr 3 32,660,581-32,663,688 BROADD2 ENSCAFG00000023143<br />
cattle chr 10 7,992,986-7,995,677 UMD3.1 ENSBTAG00000020201<br />
armadillo scaf 5094 53,186-56,209 dasNOV2 ENSDNOG00000002472<br />
elephant scaf 7 79,997,061-79,999,118 loxAfr3 ENSLAFG00000013035<br />
opossum chr 3 40,003,360-40,006,269 BROAD05 ENSMODG00000019747<br />
platypus chr 1 15,688,842-15,691,393 OANA5 F7G3H7 ENSOANG00000015763<br />
Page 5
S100A10 human chr 1 151,955,391-151,966,866 GRCh37 ENSG00000197747<br />
mouse chr 3 93,359,002-93,368,565 NCBIM37 ENSMUSG00000041959<br />
dog chr 17 64,061,414-64,072,120 BROADD2 ENSCAFG00000023111<br />
cattle chr 3 18,799,612-18,810,545 UMD3.1 ENSBTAG00000015147<br />
armadillo scaf 63281 5,204-5,496 dasNOV2 ENSDNOG00000011265<br />
elephant scaf 11 40,275,914-40,279,559 loxAfr3 ENSLAFG00000011183<br />
opossum chr 2 497,258,786-497,265,212 BROAD05 ENSMODG00000018919<br />
opossum(2) chr 4 26,381,268-26,381,561 BROAD05 ENSMODG00000025292<br />
S100A11 human chr 1 152,004,982-152,020,383 GRCh37 ENSG00000163191<br />
mouse chr 3 93,324,410-93,330,209 NCBIM37 ENSMUSG00000027907<br />
dog chr 17 64,097,517-64,102,698 BROADD2 ENSCAFG00000012916<br />
cattle chr 3 18,768,796-18,770,416 UMD3.1 Q862H7 ENSBTAG00000015145<br />
armadillo scaf 205856 486-1,079 dasNOV2 ENSDNOG00000005442<br />
elephant scaf 11 40,230,602-40,231,806 loxAfr3 ENSLAFG00000026763<br />
opossum chr 2 497,322,873-497,325,570 BROAD05 ENSMODG00000018920<br />
platypus contig 12765 26,772-28,669 OANA5 F6S011 ENSOANG00000009693<br />
S100A1 human chr 1 153,600,402-153,604,513 GRCh37 ENSG00000160678<br />
mouse chr 3 90,314,956-90,318,314 NCBIM37 ENSMUSG00000044080<br />
cattle chr 3 16,812,602-16,816,588 UMD3.1 S10A1 ENSBTAG00000005163<br />
armadillo scaf 6778 51,476-55,790 dasNOV2 ENSDNOG00000004826<br />
elephant scaf 33 2,165,397-2,166,706 loxAfr3 ENSLAFG00000002657<br />
opossum chr 2 187,950,053-187,951,689 BROAD05 ENSMODG00000017368<br />
S100A2 human chr 1 153,533,584-153,540,366 GRCh37 ENSG00000196754<br />
mouse chr 3 90,394,169-90,394,277 NCBIM37 predicted NP_001182689<br />
90,395,223-90,395,430<br />
dog chr 7 46,457,830-46,458,909 BROADD2 ENSCAFG00000017547<br />
cattle chr 3 16,869,280-16,872,613 UMD3.1 S10A2 ENSBTAG00000037651<br />
elephant scaf 33 2,105,516-2,107,174 loxAfr3 ENSLAFG00000026541<br />
platypus contig 11856 27,759-29,865 OANA5 F6Q7Q8 ENSOANG00000014147<br />
S100A3 human chr 1 153,519,805-153,521,848 GRCh37 ENSG00000188015<br />
mouse chr 3 90,404,137-90,406,624 NCBIM37 ENSMUSG00000001021<br />
dog chr 7 46,468,586-46,469,240 BROADD2 ENSCAFG00000017548<br />
cattle chr 3 16,880,769-16,884,904 UMD3.1 A4FUH7 ENSBTAG00000039105<br />
elephant scaf 33 2,091,966-2,092,762 loxAfr3 ENSLAFG00000028157<br />
opossum chr 3 187,871,908-187,874,350 BROAD05 ENSMODG00000017395<br />
platypus contig 11856 20,135-21,548 OANA5 F6Q7F6 ENSOANG00000014146<br />
S100A4 human chr 1 153,516,089-153,522,612 GRCh37 ENSG00000196154<br />
mouse chr 3 90,407,692-90,409,967 NCBIM37 ENSMUSG00000001020<br />
dog chr 7 46,471,122-46,473,134 BROADD2 ENSCAFG00000017550<br />
cattle chr 3 16,887,102-16,888,570 UMD3.1 S10A4 ENSBTAG00000019203<br />
armadillo scaf 81406 2,676-3,717 dasNOV2 ENSDNOG00000018653<br />
elephant scaf 33 2,088,093-2,089,345 loxAfr3 ENSLAFG00000015008<br />
Page 6
opossum chr 2 187,864,578-187,865,727 BROAD05 ENSMODG00000017397<br />
platypus contig 11856 14,931-15,397 OANA5 F6Q7T6 ENSOANG00000014144<br />
S100A5 human chr 1 153,509,623-153,514,241 GRCh37 ENSG00000196420<br />
mouse chr 3 90,412,445-90,415,702 NCBIM37 ENSMUSG00000001023<br />
dog chr 7 46,476,026-46,478,009 BROADD2 ENSCAFG00000017552<br />
cattle chr 3 16,891,318-16,894,701 UMD3.1 E1B8S0 ENSBTAG00000000644<br />
elephant scaf 33 2,082,026-2,084,572 loxAfr3 ENSLAFG00000015005<br />
opossum chr 2 187,846,662-187,858,463 BROAD05 ENSMODG00000017400<br />
S100A6 human chr 1 153,507,075-153,508,720 GRCh37 ENSG00000197956<br />
mouse chr 3 90,416,816-90,418,336 NCBIM37 ENSMUSG00000001025<br />
dog chr 7 46,478,503-46,480,182 BROADD2 ENSCAFG00000017553<br />
armadillo scaf 59060 2,839-3,445 dasNOV2 ENSDNOG00000009294<br />
elephant scaf 33 2,079,007-2,079,661 loxAfr3 ENSLAFG00000027113<br />
platypus contig11856 10,098-11,426 OANA5 F6R394 ENSOANG00000014143<br />
S100A7 human 7A chr 1 153,388,945-153,395,701 GRCh37 ENSG00000184330<br />
human 7L2 chr 1 153,409,471-153,412,503 GRCh37 ENSG00000197364<br />
human 7 chr 1 153,430,220-153,433,177 GRCh37 ENSG00000143556<br />
mouse chr 3 90,458,224-90,462,052 NCBIM37 ENSMUSG00000063767<br />
dog chr 7 46,508,505-46,510,721 BROADD2 XM_850076.1 ENSCAFG00000017554<br />
cattle 7 chr 3 16,967,602-16,971,446 UMD3.1 S10A7 ENSBTAG00000008238<br />
cattle 7A chr 3 17,086,462-17,089,235 UMD3.1 S100A7 ENSBTAG00000033007<br />
cattle 15 chr 3 17,137,845-17,140,530 UMD3.1 E1BPR8 ENSBTAG00000024437<br />
elephant 7A scaf 33 1,451,124-1,453,601 loxAfr3 novel ENSLAFG00000032266<br />
elephant 7L2 scaf 33 1,819,975-1,822,053 loxAfr3 novel ENSLAFG00000027467<br />
elephant 7 scaf 33 1,964,341-1,965,961 loxAfr3 novel ENSLAFG00000026442<br />
opossum 7A chr 2 187,744,792-187,750,533 BROAD05 XM_001372135.1 ENSMODG00000017402<br />
S100A8 human chr 1 153,362,508-153,363,664 GRCh37 ENSG00000143546<br />
mouse chr 3 90,472,993-90,473,956 NCBIM37 ENSMUSG00000056054<br />
dog chr 7 46,518,213-46,518,630 BROADD2 COLQLO ENSCAFG00000017557<br />
cattle chr 3 17,146,918-17,147,898 UMD3.1 S10A8 ENSBTAG00000012640<br />
elephant scaf 33 1,443,095-1,443,500 loxAfr3 ENSLAFG00000028077<br />
opossum chr 2 187,727,621-187,728,606 BROAD05 ENSMODG00000017403<br />
S100A9 human chr 1 153,330,330-153,333,503 GRCh37 ENSG00000163220<br />
mouse chr 3 90,496,554-90,499,643 NCBIM37 ENSMUSG00000056071<br />
dog chr 7 46,544,157-46,546,227 BROADD2 ENSCAFG00000017558<br />
cattle chr 3 17,176,217-17,179,005 UMD3.1 ENSBTAG00000006505<br />
armadillo scaf 12075 46,052-47,949 dasNOV2 ENSDNOG00000016750<br />
elephant scaf 33 1,401,492-1,403,766 loxAfr3 ENSLAFG00000030986<br />
opossum chr 2 187,669,504-187,671,573 BROAD05 ENSMODG00000017410<br />
S100A12 human chr 1 153,346,184-153,348,125 GRCh37 ENSG00000163221<br />
dog chr 7 46,531,797-46,532,462 BROADD2 ENSCAFG00000023324<br />
Page 7
cattle chr 3 17,163,820-17,165,262 UMD3.1 S10AC ENSBTAG00000012638<br />
armadillo scaf 4927 53,473-54,247 dasNOV2 ENSDNOG00000016751<br />
elephant scaf 33 1,427,267-1,428,062 loxAfr3 ENSLAFG00000000593<br />
opossum chr 2 187,688,712-187,690,101 BROAD05 ENSMODG00000017406<br />
S100A13 human chr 1 153,591,263-153,606,873 GRCh37 ENSG00000189171<br />
mouse chr 3 90,318,357-90,328,503 NCBIM37 ENSMUSG00000042312<br />
dog chr 7 46,410,463-46,419,158 BROADD2 ENSCAFG00000017542<br />
cattle chr 3 16,818,414-16,824,125 UMD3.1 S10AD ENSBTAG00000021378<br />
armadillo scaf 6778 37,104-50,040 dasNOV2 ENSDNOG00000004825<br />
elephant scaf 33 2,151,146-2,161,331 loxAfr3 ENSLAFG00000026554<br />
opossum chr 2 187,934,436-187,945,057 BROAD05 ENSMODG00000017387<br />
S100A14 human chr 1 153,586,731-153,589,462 GRCh37 ENSG00000189334<br />
mouse chr 3 90,330,778-90,332,755 NCBIM37 ENSMUSG00000042306<br />
dog chr 7 46,422,006-46,422,967 BROADD2 ENSCAFG00000017544<br />
cattle chr 3 16,827,337-16,829,392 UMD3.1 S10AE ENSBTAG00000021377<br />
armadillo scaf 6778 33,004-33,976 dasNOV2 ENSDNOG00000004820<br />
elephant scaf 33 2,146,590-2,147,584 loxAfr3 ENSLAFG00000011995<br />
opossum chr 2 187,929,738-187,931,292 BROAD05 ENSMODG00000017390<br />
S100A16 human chr 1 153,579,362-153,585,644 GRCh37 ENSG00000188643<br />
mouse chr 3 90,341,176-90,347,073 NCBIM37 ENSMUSG00000074457<br />
dog chr 7 46,424,683-46,429,683 BROADD2 ENSCAFG00000017545<br />
cattle chr 3 16,830,511-16,837,422 UMD3.1 S10AG ENSBTAG00000014204<br />
elephant scaf 33 2,139,379-2,140,033 loxAfr3 ENSLAFG00000002656<br />
opossum chr 2 187,918,881-187,919,666 BROAD05 ENSMODG00000017391<br />
Page 8
Supplemental Figure 1: S100A10-A11 and SFTP protein locus synteny. S100 genes are<br />
shown in red and S100 fused-type proteins (SFTP) in pink. Syntenic genes found in at least two<br />
mammalian genomes are shown in grey. Gene polygons point in transcriptional orientation. With<br />
the exception <strong>of</strong> gene insertions in the human and mouse indicated in white, black lines denote<br />
intergenic space where no other genes were detected. Orthologs between species are<br />
vertically aligned and distances are not to scale.<br />
Supplemental Figure 2: S100A1-A9, A12-A14 and A16 locus synteny. S100 genes are<br />
shown in red, purple, green and yellow. Syntenic genes found in at least two mammalian<br />
genomes are shown in grey. Gene polygons point in transcriptional orientation. Black lines<br />
denote intergenic space where no other genes were detected. Orthologs between species are<br />
vertically aligned and distances are not to scale.<br />
Supplemental Figure 3: S100B locus synteny. S100B genes are shown in red. Syntenic<br />
genes found in at least two mammalian genomes are shown in grey. Gene polygons point in<br />
transcriptional orientation. Black lines denote intergenic space where no other genes were<br />
detected. Dashed lines highlight syntenic blocks that have been inverted or translocated.<br />
Orthologs between species are vertically aligned and distances are not to scale.<br />
Supplemental Figure 4: S100G locus synteny. S100G genes are shown in yellow. Syntenic<br />
genes found in at least two mammalian genomes are shown in grey. Gene polygons point in<br />
transcriptional orientation. Black lines denote intergenic space where no other genes were<br />
detected. Dashed lines highlight syntenic blocks that have been inverted or translocated.<br />
Orthologs between species are vertically aligned and distances are not to scale.<br />
Supplemental Figure 5: S100P locus synteny. S100P genes are shown in red. Syntenic<br />
genes found in at least two mammalian genomes are shown in grey. Gene polygons point in<br />
transcriptional orientation. Black lines denote intergenic space where no other genes were<br />
detected. Orthologs between species are vertically aligned and distances are not to scale.<br />
Page 9
Supplemental Figure 6: S100Z locus synteny. S100Z genes are shown in red. Syntenic<br />
genes found in at least two mammalian genomes are shown in grey. Gene polygons point in<br />
transcriptional orientation. Black lines denote intergenic space where no other genes were<br />
detected, except where blocks <strong>of</strong> genes inserted below. Dashed arrow highlight a syntenic<br />
gene that has been translocated. Orthologs between species are vertically aligned and<br />
distances are not to scale.<br />
Supplemental Figure 7: Pairwise identity matrix for mammalian S100A7 loci. Number <strong>of</strong><br />
predicted amino acid substitutions per site using a Dayh<strong>of</strong>f matrix based model analyzing 108<br />
positions between 12 sequences. Darker pink in the heatmap indicates greater divergence<br />
between the two sequences.<br />
Supplemental Figure 8: Amino acid alignments for mammalian S100A7 loci. Amino acid<br />
sequences <strong>of</strong> mammalian S100A7 family members. Dashes indicate gaps inserted for<br />
alignment to other family members. The S100 (pseudo) EF-hand Ca 2+ binding loop is in dark<br />
blue, the C-terminal EF-hand Ca 2+ binding loop in light blue, the linker region connecting the EF-<br />
hands in green, alpha-helices in black, and non-helical regions in gray.<br />
Page 10
Human Chromosome 1<br />
RORC C2CD4D THEM5 THEM4<br />
10 11 T1 T R H F F2 C KPRP IVL LELP1 PRR9<br />
Mouse Chromosome 3<br />
Rorc C2cd4d Them5 Them4<br />
10 11 T1 T R H F F2 C Kprp Ivl Lelp1 Prr9<br />
Dog Chromosome 17<br />
Armadillo Scaffold<br />
Opossum Chromosome 4<br />
Tdpoz1 Tdpoz4 Tdpoz3 Tdpoz5<br />
63281<br />
Platypus Contig 44554 Ultracontig 222<br />
10<br />
11<br />
205856<br />
410 kb<br />
mid1iP1 tspan7 10 otc rgpr srpx sytl5<br />
7genes 12 genes 16 genes<br />
rorc them5 them4<br />
10 11 t1 t r f f2 c kprp ivl lelp1 prr9<br />
Cow Chromosome 3<br />
rorc c2cd4d them5 them4<br />
Elephant Scaffold 11<br />
426 kb<br />
13 genes 8 genes 10 genes<br />
rorc them5 them4<br />
10 11 t1 t r f f2 c klhl1<br />
Opossum Chromosome 2<br />
Supplemental Figure 1<br />
10 11 t1 r f f2 c kprp<br />
ivl<br />
rorc lingo4 them5<br />
10 11 t1 t r f f2 c actb<br />
hnf1b heatr6<br />
them5 tspan7 otc rgpr srpx<br />
12765 Chromosome 2<br />
Ultracontig 9<br />
11 tnrc18 fbxl18 actb rnf216<br />
ddx52 hnf1b heatr6 tcf7i1
Human Chromosome 1<br />
LELP1 POR9 LOR PGLYRP3 PGLYRP4 9 12 8 7L3 7L2 7 6 5 4 3 2 16 14 13 1 CHTOP SNAPIN ILF2 NPR1<br />
Mouse Chromosome 3<br />
Dog Chromosome 7<br />
Cow Chromosome 3<br />
Armadillo Scaffold<br />
Elephant Scaffold 33<br />
smad2 il9r<br />
Opossum Chromosome 2<br />
Pglyrp4 9 8<br />
7A<br />
6 5 4 3 2 16 14 13 1 Chtop Snapin Ilf2 Npr1<br />
9 12 8 7A 6 4 3 2 16 14 13 1 Chtop snapin ilf2 npr1 5<br />
lor pglyrp3 9 12 8 7A 7L2 7 5 4 3 2 16 14 13 1 chtop snapin<br />
4927<br />
pglyrp4 12<br />
12075<br />
rplp1 pglyrp3 pglyrp4 9 12 8<br />
9<br />
59060<br />
6<br />
81406<br />
4<br />
6778<br />
14 13 1 chtop<br />
lelp1 pglyrp3<br />
9 12 8 7A<br />
6 4 3 16 14 13 1 chtop snapin ilf2 npr1<br />
Platypus Contig<br />
7A<br />
43131 52308<br />
9 8<br />
Supplemental Figure 2<br />
copz2<br />
7L2<br />
7 6 5 4 3 2 16 14 13 1 chtop snapin ilf2 npr1<br />
11856 52166<br />
6 4 3 2<br />
13
Human Chromosome 21<br />
FTCD LSS MCM3AP YBEY PCNT DIP2A B<br />
PRMT2 DSTNTP1 RPL23AP4<br />
Mouse Chromosome 10<br />
Dog Chromosome 31<br />
Cow Chromosome 1<br />
Armadillo Scaffold 6436<br />
Elephant Scaffold 110<br />
Tasmanian Devil Scaffold GL857102<br />
Wallaby Scaffold<br />
Opossum Chromosome 2<br />
Platypus Contig 273<br />
Ybey Pcnt Dip2a B<br />
Prmt2 Slc5a4a Slc5a5b<br />
mcm3ap ybey pcnt dip2a b<br />
prmt2<br />
ybey pcnt dip2a b<br />
prmt2 fbxo25 clik6<br />
6612<br />
piwl3 b<br />
prmt2<br />
b<br />
b<br />
prmt2 ahr titin<br />
spp2 trpm8 ugt1a1<br />
mcm3ap ybey pcnt dip2a spp2 trpm8 ugt1a1<br />
ahr2 slit1 b<br />
Supplemental Figure 3<br />
dip2a prmt2<br />
58856<br />
b<br />
prmt2<br />
dip2a<br />
pcnt<br />
ybey<br />
mcm3ap
Human Chromosome X<br />
Mouse Chromosome X<br />
Tmem27 Sian1b Car5b Zrsr2 Ap1s2 Grpr Ctps2 G Syap1 Txlng Rbbp7 Reps2<br />
Dog Chromosome X<br />
Cow Chromosome X<br />
Armadillo Scaffold 307<br />
Elephant Scaffold 39<br />
Opossum Chromosome 7<br />
Platypus Chromosome 7<br />
Supplemental Figure 4<br />
TMEM27 CA5B ZRSR2 AP1S2 GRPR MAGEB17 CTPS2 G SYAP1 TXLNG RBBP7 REPS2<br />
ap1s2 grpr ctps2 g<br />
syap1 txlng rbbp7 reps2<br />
ap1s2 grpr taf5l g<br />
pyrg2 qt3161<br />
txlng rbbp7 reps2<br />
ctps2 g<br />
pld6 syap1<br />
car5b zrsr2 ap1s2 grpr g ctps2<br />
syap1 txlng rbbp7<br />
tmem27 ca5b ap1s2 grpr g ctps2 syap1 txlng rbbp7 reps2<br />
tmem27 ca5b ap1s2 grpr ctps2 syap1 rbbp7 reps2
Human Chromosome 4<br />
WFS1 PPP2R2C MAN2B2 MRFAP1 P MRFAP1L1 CNO KIAA0232 TBC1D14 CCDC96<br />
Mouse Chromosome 5<br />
Wfs1 Ppp2r2c Man2b2 Mrfap1 Cno D5ertd579e Tbc1d14 Ccdc96 Tada2b<br />
Dog Chromosome 3<br />
dnaja4 wdr61<br />
Cow Chromosome 6<br />
dhpr clrn2<br />
Armadillo Scaffold 102319<br />
Elephant Scaffold 167<br />
Opossum Chromosome 5<br />
Platypus Contig 4744<br />
ppp2r2c mrfap1 p<br />
cno kiaa0232 tbc1d14 ccdc96 tada2b<br />
man2b2 man2b2 mcfa1<br />
Supplemental Figure 5<br />
p<br />
cno kiaa0232<br />
tbc14 ccdc96 tada2b<br />
man2b2 mrfap1 cno kiaa0232<br />
tbc14 ccdc96 tada2b<br />
clrn2 man2b2 man2b2 mcfa1 p kiaa0232 tbc1d14 tada2b Xm_001372282<br />
29525<br />
man2b2 cno
Human Chromosome 5<br />
Mouse Chromosome 13<br />
Dog Chromosome 3<br />
Cow Chromosome 10<br />
Armadillo Scaffold 5094<br />
Elephant Scaffold 7<br />
F2rl2 Iqgap2 F2r F2rl1 Z Crhbp Aggf1<br />
Zbed3 Pde8b<br />
f2rl2 iqgap2 f2r f2rl1 z crhbp aggf1<br />
pde8b wdr413<br />
f2rl2 iqgap2 f2r f2rl1 z crhbp aggf1<br />
pde8b wdr413<br />
sv2c iqgap2 f2r f2rl1 z crhbp eef1a1 aggf1<br />
zbed3<br />
Opossum Chromosome 3<br />
Platypus Chromosome 1<br />
poc5<br />
sv2c<br />
IQGAP2 F2RL2 F2R F2FL1 Z CRHBP AGGF1<br />
ZBED3 PDE8B<br />
f2fl1<br />
f2r<br />
f2rl2<br />
f2rl1 z<br />
iqgap2<br />
Supplemental Figure 6<br />
z crhbp<br />
aggf1 zbed3 pde8b wdr413<br />
f2rl2 iqgap2<br />
f2rl1 z aggf1 zbed3 pde8b wdr413
Supplemental Figure 7
Supplemental Figure 8<br />
Human S100A7 M SNTQAERSII GMIDMFHKYT RRDDKIDKPS LLTMMKENFP NFL--SACDK KGTNYLADVF EKKDKNEDKK IDFSEFLSLL GDIATDYHKQ SHGAAPCSGG SQ<br />
Human S100A7L3(S100A7A1) M SNTQAERSII GMIDMFHKYT GRDGKIEKPS LLTMMKENFP NFL--SACDK KGIHYLATVF EKKDKNEDKK IDFSEFLSLL GDIAADYHKQ SHGAAPCSGG SQ<br />
Human S100A7L2 M NIPLGEKVML DIVAMFRQYS GDDGRMDMPG LVNLMKENFP NFL--SGCEK SDMDYLSNAL EKKDDNKDKK VNYSEFLSLL GDITIDHHKI MHGVAPCSGG SQ<br />
Cattle A7 M SSSQLEQAIT DLINLFHKYS GSDDTIEKED LLRLMKDNFP NFL--GACEK RGRDYLSNIF EKQDKNKDRK IDFSEFLSLL ADIATDYHNH SHGAQLCSGG NQ<br />
Cattle A7L2 M SGFHLEQAIT DLINLFHKYS GSDDTIEKED LLRLMKENFP NFL--SACEK RGRQYLSDIF EKKDKNKDKK IDFSEFLSLL ADIATDYHNH SHGAQLCSGG NQ<br />
Elephant A7 I CHTSSENLLL SLVDLFHQYT GRDDKINKEN LLKLLKENFP NFL--NDCER RGKDYLCNVF EKKDKNEDKK IDFSEFLCVV GDIATDYHKQ SHGAPPCSGG PQ<br />
Elephant A7L2 L GDFLGENLVL SLVELFHQYT GYDDKINREN LLKLLKENFP NFL--NDCER RGKDYLCNVF EKKDKNKDKK IDFSEFLSVV GDIANDYHKQ SHGAPPCSGG CQ<br />
Mouse S100A7A(2) MPDT PVEDSLFQII HCFHHYAARE GDKETLSLEE LKALLLDSVP RFM--DTLGR RQPYYITELF RAADKNKDNQ ICFDEFLYIL GKLVKDYHLQ FHRQLCAHYC TEHSLY<br />
Dog S100A7A(2) MTHK PMEESLFQIV HCYHQYAARE GDVETLSLEE LKALLMDNVP CFM--ESLGR KEPYYISELF RAADKNKDNQ ICFDEFLFIL GRLLKDYHLL YHRQLCACYC ARHSLH<br />
Cattle A7A(2) MTDT PVEESLFQII HCYHEYAARE GDAETLSLEE LKALLMDNVP RFM--ETLGR KEPYYITQLF RAADKNQDNQ ICFEEFLYIL GKLVKDYHLQ YHRQLCAHYC TQHSLY<br />
Elephant A7A(2) FTGT PVEESLFQII HCYHQYAARE GDKETLSLEE LRALLMDNLP HFM--ESLGW KQLYYISELF RAADKNKDNQ ICFEEFLYIL GKLAKDYHLQ YHRQLCAHCC TQHGLY<br />
Opossum A7A(2) MPDT PIEDSIFHII HCYHLYAARE GDVDTLSLDE LNALLTENTP RFM--KGLGR TQPEYLKQLF EVADKNKDNQ ISFDEFIYIV GKLMKDYHLQ YHRQLCAHYC QANGLY