Lab Guidelines Exp. #4C
Lab Guidelines Exp. #4C
Lab Guidelines Exp. #4C

Create successful ePaper yourself
Turn your PDF publications into a flip-book with our unique Google optimized e-Paper software.
CHEM 14BL Winter 2002<br />
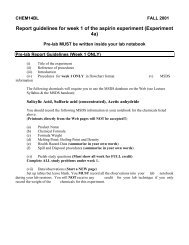
Report <strong>Guidelines</strong> for Week 3 of the Aspirin <strong>Exp</strong>eriment (4c).<br />
Pre-lab <strong>Guidelines</strong> (Week 3 ONLY)<br />
Note: We will not do part 2 of this experiment<br />
(i) Title<br />
(ii) Reference<br />
(iii) Introduction<br />
(iv) Procedures (flow chart) (see 58 under week 3)<br />
(v) MSDS information<br />
The following chemicals will require you to use the MSDS database on the Web (see Lecture<br />
Syllabus):<br />
FeCl3<br />
Note: In MSDS, select the site that gives you the MSDS information closest to the<br />
concentration or grade listed above for each individual chemical.<br />
You should record the following MSDS information in your notebook for the chemicals listed<br />
above.<br />
(Printouts directly from the Web pages will NOT be accepted!!)<br />
(a) Product Name<br />
(b) Chemical Formula<br />
(c) Formula Weight<br />
(d) Melting Point; Boiling Point and Density<br />
(e) Health Hazard Data (summarize in your own words)<br />
(f) Spill and Disposal procedures (summarize in your own words)<br />
(vi) Prelab study questions (Must show all work for FULL credit)<br />
Complete ALL problems under week 3 on p.56.<br />
(vii) Data/observations<br />
Set up tables but leave blank. You MUST record all the observations into your lab notebook<br />
during your lab sessions. You will NOT receive any credit for your lab technique if you only<br />
record the weight of the chemicals for this experiment.
CHEM 14BL Winter 2002<br />
Postlab Report <strong>Guidelines</strong> for <strong>Exp</strong>eriment 4c (Aspirin Analysis)<br />
This is a GROUP Report<br />
(i.e. TURN IN ONLY ONE REPORT PER GROUP)<br />
(A) Data<br />
- Write the names of your group members and their responsibility in the experiment and in writing<br />
this postlab report<br />
- Orderly record of data AND observations<br />
- EXPERIMENTAL melting point of EACH INDIVIDUAL GROUP MEMBER<br />
- Data tables should have proper titles/labels<br />
(B) Graph<br />
- Beer's law plot of concentration vs. absorbance for the standard solutions<br />
Your graph must have proper title, labels. Data points must be clearly marked.<br />
Make sure you use the correct type of graph paper. If you use EXCEL, make sure that the gridlines are set<br />
properly.<br />
(C) Data Analysis (MUST SHOW ALL WORK FOR FULL CREDIT)<br />
- slope of the line (with proper unit)<br />
(indicate which two points on the line you use for calculating the slope).<br />
- concentrations for all the standard solutions<br />
- concentration of salicylic acid in the aspirin sample (with proper unit)<br />
- % purity<br />
(D) Error Analysis (MUST SHOW ALL WORK FOR FULL CREDIT)<br />
(Refer to the lecture guide for details on error analysis)<br />
You may assume the absolute error in the 1.00-mL syringe to be ± 0.1ml<br />
- error in concentration (i.e. range of concentration) for ONE of your standard solution<br />
(all terms identified and error bar placed on graph)<br />
- error in absorbance (i.e. range of absorbance) for ONE of your standard solution<br />
(all terms identified and error bar placed on graph)<br />
- calculate the range of slopes of standard line. You MUST show mathematically how you obtain<br />
those slopes (i.e. max. slope and min. slope must be labeled clearly on your graph)<br />
- error in absorbance of your experimental aspirin solution<br />
- error in concentration of your experimental aspirin solution<br />
- estimate the inherent error in your experimental aspirin solution<br />
(E) Conclusions<br />
- Summarize results and comment on % aspirin in your sample.
- Compare the melting point of aspirin from the literature with the melting point range that you<br />
observed in the lab. Is your product pure based on the melting point range that you observed?<br />
What can you conclude? (pick the BEST melting point to answer the questions for this part)<br />
Make sure you turn in the mass spectrum post-lab (refer to the mass<br />
spectroscopy post-lab handout) with this report.