Bander Coalfield - Western Coalfields Ltd. India.
Bander Coalfield - Western Coalfields Ltd. India.
Bander Coalfield - Western Coalfields Ltd. India.

Create successful ePaper yourself
Turn your PDF publications into a flip-book with our unique Google optimized e-Paper software.
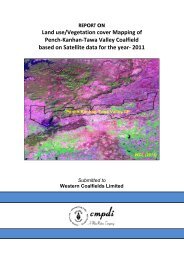
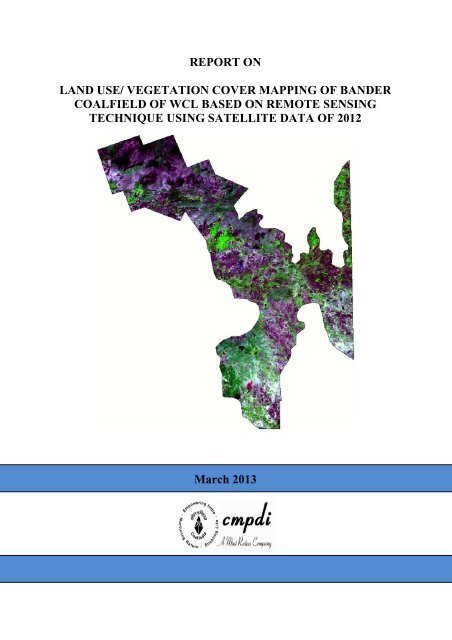
REPORT ON<br />
LAND USE/ VEGETATION COVER MAPPING OF BANDER<br />
COALFIELD OF WCL BASED ON REMOTE SENSING<br />
TECHNIQUE USING SATELLITE DATA OF 2012<br />
March 2013
REPORT ON<br />
LAND USE/ VEGETATION COVER MAPPING OF BANDER<br />
COALFIELD OF WCL, BASED ON REMOTE SENSING<br />
TECHNIQUE USING SATELLITE DATA OF 2012<br />
Submitted to<br />
<strong>Western</strong> <strong>Coalfield</strong>s Limited (WCL)<br />
Nagpur, Maharashtra<br />
March 2013<br />
Central Mine Planning & Design Institute <strong>Ltd</strong>.<br />
Gondwana Place, Kanke Road<br />
Ranchi 834 008, <strong>India</strong>
Contents<br />
Page No.<br />
Document Control Sheet i<br />
List of Figures ii<br />
List of Tables ii<br />
List of Plates ii<br />
1.0 Introduction 1 - 4<br />
1.1 Project Reference<br />
1.2 Objectives<br />
1.3 Location & Accessibility<br />
1.4 Drainage<br />
1.5 Reserved Forests<br />
2.0 Remote Sensing Concept & Methodology 5 - 13<br />
2.1 Data Source<br />
2.2 Characteristics of Satellite/Sensor<br />
2.3 Data Processing<br />
2.3.1 Geometric Correction, rectification & geo-referencing<br />
2.3.2 Image enhancement<br />
2.3.3 Training set selection<br />
2.3.4 Signature generation & classification<br />
2.3.5 Creation / Overlay of vector database<br />
2.3.6 Validation of classified image<br />
2.3.7 Final thematic map preparation<br />
3.0 Land Use/ Vegatation Cover Monitoring 14- 27<br />
3.1 Introduction<br />
3.2 Land use/cover Classification<br />
3.3 Data Analysis & Change Detection<br />
3.3.1 Vegetation cover<br />
3.3.2 Agricultural Land<br />
3.3.3 Wasteland<br />
3.3.4 Settlements/Built-up area<br />
3.3.5 Water bodies<br />
3.3.5 Changes in Land Use/ Vegatation Cover Classes<br />
4.0 Conclusion and Recommendations 28-29<br />
4.1 Conclusion<br />
4.2 Recommendations
Document Control Sheet<br />
(1) Ref. No. CIL/WP/ENV/2011/4706 Dt. 12.10.12<br />
(2) Publication Date March 2013<br />
(3) Number of Pages 29<br />
(4) Number of Figures 10<br />
(5) Number of Tables 8<br />
(6) Number of Plates 1<br />
(7) Title of Report Land use/ Vegetation cover mapping of <strong>Bander</strong> <strong>Coalfield</strong> of<br />
WCL, based on remote sensing technique using Satellite<br />
data of 2012.<br />
(8) Aim of the Report To prepare land use/ Vegetation cover map of <strong>Bander</strong><br />
coalfield in 1:50,000 scale based on satellite data (IRS-R2<br />
LISS-IV) of the year 2012 using remote sensing technique.<br />
To analyze land use/ Vegetation cover pattern within the<br />
area of <strong>Bander</strong> <strong>Coalfield</strong>s and change detection in 2012<br />
over 2009<br />
(9) Executing Unit Remote Sensing Cell, Geomatics Division,<br />
Central Mine Planning & Design Institute Limited,<br />
Gondwana Place, Kanke Road,<br />
Ranchi 834008 <strong>India</strong><br />
(10) User Agency <strong>Western</strong> <strong>Coalfield</strong>s Limited (WCL), Nagpur, Maharashtra<br />
(11) Authors Mr Hariharalal B, Manager (System)<br />
(12) Security Restriction Restricted Circulation<br />
(13) No. of Copies 5<br />
(14) Distribution Statement Official<br />
Mr. N.P. Singh, General Manager (Geomatics)<br />
i
List of Figures<br />
1.1 Location map of <strong>Bander</strong> Coalfileds, nagpur, WCL<br />
2.1 Methodology for land use/cover mapping.<br />
2.2 Geoid-Ellipsoid –Projection Relationship<br />
3.1 Pie-chart depicting land use/Vegetation cover pattern in <strong>Bander</strong> <strong>Coalfield</strong> in the year 2012<br />
List of Tables<br />
2.1 Characteristics of the satellite/sensor used in the present project work<br />
2.2 Classification Accuracy Matrix for <strong>Bander</strong> <strong>Coalfield</strong> in the year 2012<br />
3.1 Land use/cover classes identified in <strong>Bander</strong> <strong>Coalfield</strong><br />
3.2 Land use/cover statistics of <strong>Bander</strong> <strong>Coalfield</strong><br />
List of Plates<br />
List of maps/plates prepared on a scale of 1:50,000 are given below:<br />
1. Plate No. HQ/REM/001: Land use/ Vegetation cover map based on IRS – R2 LISS-IV<br />
[2012] data.
1.1 Project Reference<br />
Chapter 1<br />
Introduction<br />
Job No 561410027 [ Page 1 of 29]<br />
CMPDI<br />
CGM (WBP/FPD/ENV), Coal <strong>India</strong> <strong>Ltd</strong>. issued a work order to CMPDI vide letter No<br />
CIL/WBP/ENV/2011/4706 datet 12 th October 2012 for monitoring the status of Land<br />
Reclamation in all the Open Cast Projects and Land use/ Vegetation cover Mapping of<br />
various <strong>Coalfield</strong>s under the command area of CIL. Accordingly Land Use/Vegetation<br />
Cover Mapping of <strong>Bander</strong> <strong>Coalfield</strong> of <strong>Western</strong> <strong>Coalfield</strong>s <strong>Ltd</strong>. was carried out based on<br />
satellite data of the year 2012 to assess the changes taken place on land use/vegetation<br />
cover in <strong>Bander</strong> <strong>Coalfield</strong>.<br />
Project Background<br />
<strong>Western</strong> <strong>Coalfield</strong>s <strong>Ltd</strong> (WCL) is a Mini Ratna Company under the Maha Ratna Com-<br />
pany M/s Coal <strong>India</strong> <strong>Ltd</strong>(CIL). WCL is an established company dedicated for coal mining<br />
in the western and central part of the country. For maintaining the ecological balance in<br />
the aftermath of mining operations in the region, the company has initiated various plan-<br />
tation programmes on areas like backfilled region, OB dump area and wasteland area etc.<br />
The advent of high resolution, multispectral satellite data has opened a new avenue in the<br />
field of mapping and monitoring of vegetation cover and changes that may have taken<br />
place over a period of time. The present study has been taken up to assess the changes in<br />
vegetation cover in <strong>Bander</strong> <strong>Coalfield</strong> in a span of last three years. While assessing the<br />
Land Use/ Vegetation Cover in the <strong>Coalfield</strong> region, changes in different categories of<br />
vegetation cover are also analysed to formulate the remedial measures, if any, required to<br />
be taken up to maintain the ecological balance in the region.
1.2 Objectives<br />
The objectives are:<br />
Job No 561410027 [ Page 2 of 29]<br />
CMPDI<br />
To prepare land use/vegetation cover map of <strong>Bander</strong> <strong>Coalfield</strong> covering an area of<br />
361.09 km 2 on a scale of 1:50,000 based on satellite data of the year 2012, using<br />
digital image processing techniques.<br />
to assess the impact on vegetation cover and analyse the changes in a span of last<br />
three years.<br />
1.3 Location & Accessibility<br />
<strong>Bander</strong> <strong>Coalfield</strong> (BCF), situated about 70 km south of Nagpur, consists of part of<br />
Nagpur and Chandrapur districts of Maharashtra State. The area is bounded between<br />
North Latitudes 20 0 29’ 06” to 20 0 48’ 22” and East Longitudes 79 0 09’ 15” to 79 0 26’ 39”<br />
and is covered by Survey of <strong>India</strong> (SoI) toposheet Nos. 55 P /1, 55 P /2, 55 P /5 and 55 P /6. The<br />
location map and the incidence of study area on toposheets are shown in Figure 1.1. The<br />
area extends for about 32 km in north-south direction and 35 km in east-west direction<br />
encompassing an area of 361.09 sq. km.<br />
BCF is approachable by road from Nagpur via Umrer on the northern side and<br />
Chandrapur on the southern side. Nand town, situated in the middle of the coalfield<br />
region, is connected with Umrer by all-weather tarred road, which in turn connects Bhisi<br />
and Bhagawanpur by fair-weathered roads.
1.4 Drainage<br />
Job No 561410027 [ Page 3 of 29]<br />
CMPDI<br />
The <strong>Bander</strong> <strong>Coalfield</strong> region is drained by Nand river and its tributaries in the central,<br />
Kalhai river and its tributaries in the eastern and Uma river in the southern region. The<br />
general flow direction of the Nand river is from west to east and is locally characterized<br />
by open and closed meanders. Some of the tributaries pass through the Nand reserved<br />
forest in the western part of the coalfield. Kalhai river, though do not pass through the<br />
coalfield region, its tributaries are passing through the southern side of Bhisi village.<br />
Uma river in <strong>Bander</strong> area originate from the Nand reserved forest and flow in the south-<br />
east direction.
Fig. 1.1 : Location Map of <strong>Bander</strong> <strong>Coalfield</strong>, WCL, Nagpur<br />
[ Page 4 of 29]<br />
CMPDI
2.1 Data Source<br />
Chapter 2<br />
Methodology<br />
The following data are used in the present study:<br />
Job No 561410027 [ Page 5 of 29]<br />
CMPDI<br />
Primary Data - Raw satellite data, obtained from National Remote Sensing Centre<br />
(NRSC), Hyderabad, as follows, was used as primary data source for the study.<br />
IRS R2/ LISS IV; Band 2,3,4 Path # 100, Row # 58A; Date of pass 08.03.2012.<br />
The detailed specification of the data is also given in Table 2.2.<br />
Secondary Data<br />
Secondary (ancillary) and ground data constitute important baseline information in<br />
remote sensing, as they improve the interpretation accuracy and reliability of remotely<br />
sensed data by enabling verification of the interpreted details and by supplementing it<br />
with the information that cannot be obtained directly from the remotely sensed data.<br />
For <strong>Bander</strong> <strong>Coalfield</strong>, Survey of <strong>India</strong> toposheet no. 55 P /1, 55 P /2, 55 P /5 and 55 P /6 as<br />
well as map showing details of location of area boundary, block boundary and road<br />
supplied by WCL were used in the study.
2.2 Characteristics of Satellite/Sensor<br />
The basic properties of a satellite’s sensor system can be summarised as:<br />
Job No 561410027 [ Page 6 of 29]<br />
CMPDI<br />
(a) Spectral coverage/resolution, i.e., band locations/width; (b) spectral dimensionality:<br />
number of bands; (c) radiometric resolution: quantisation; (d) spatial<br />
resolution/instantaneous field of view or IFOV; and (e) temporal resolution. Table 2.1<br />
illustrates the basic properties of IRS-R2 satellite/sensor that was used in the present<br />
study.<br />
Table 2.2 Characteristics of the satellite/sensor used in the present project work<br />
Platform Sensor Spectral Bands in µm Radiometric<br />
Resolution<br />
IRS- R2 LISS-IV B2 0.52 - 0.59 Green 10-bit<br />
B3 0.62 - 0.68 Red<br />
B4 0.77 - 0.86 NIR<br />
NIR: Near Infra-Red<br />
2.3 Data Processing<br />
Spatial<br />
Resolution<br />
5.8 m<br />
5.8 m<br />
5.8 m<br />
Temporal<br />
Resolution<br />
5 days<br />
Country<br />
The details of data processing carried out in the present study are shown in Figure 2.1.<br />
The processing methodology involves the following major steps:<br />
(a) Geometric correction, rectification and geo-referencing;<br />
(b) Image enhancement;<br />
(c) Training set selection;<br />
(d) Signature generation and classification;<br />
(e) Creation/overlay of vector database;<br />
(f) Validation of classified image;<br />
(g) Final thematic map preparation.<br />
<strong>India</strong>
Basic Data<br />
IRS – P6 (LISSIII)<br />
Pre-processing, geometric<br />
correction, rectification<br />
& geo-referencing<br />
Image<br />
Enhancement<br />
Training set<br />
Identification<br />
Signature<br />
Generation<br />
Pre-Field<br />
Classification<br />
Validation through<br />
Ground Verification<br />
Final Land Use/<br />
Cover Map<br />
Fail<br />
Job No 561410027 [ Page 7 of 29]<br />
CMPDI<br />
Data Source Secondary Data<br />
Geo-coded FCC<br />
Generation<br />
Training Set<br />
Refinement<br />
Integration of<br />
Thematic<br />
Information<br />
Report<br />
Preparation<br />
Topographical Maps<br />
(Scale 1:50,000)<br />
Creation of Vector Database<br />
(Drainage, Road Network,<br />
Lease Area)<br />
Fig. 2.1 Methodology for Land use/Vegetation Cover Analysis
2.3.1 Geometric correction, rectification and geo-referencing<br />
Job No 561410027 [ Page 8 of 29]<br />
CMPDI<br />
Inaccuracies in digital imagery may occur due to ‘systematic errors’ attributed to earth<br />
curvature and rotation as well as ‘non-systematic errors’ attributed to intermittent sensor<br />
malfunctions, etc. Systematic errors are corrected at the satellite receiving station itself<br />
while non-systematic errors/ random errors are corrected in pre-processing stage.<br />
In spite of ‘System / Bulk correction’ carried out at supplier end; some residual errors in<br />
respect of attitude attributes still remains even after correction. Therefore, fine tuning is<br />
required for correcting the image geometrically using ground control points (GCP).<br />
Raw digital images contain geometric distortions, which make them unusable as maps. A<br />
map is defined as a flat representation of part of the earth’s spheroidal surface that should<br />
confirm to an internationally accepted type of cartographic projection, so that any<br />
measurements made on the map will be accurate with those made on the ground. Any<br />
map has two basic characteristics: (a) scale and (b) projection. While scale is the ratio<br />
between reduced depiction of geographical features on a map and the geographical<br />
features in the real world, projection is the method of transforming map information from<br />
a sphere (round Earth) to a flat (map) sheet. Therefore, it is essential to transform the<br />
digital image data from a generic co-ordinate system (i.e. from line and pixel co-<br />
ordinates) to a projected co-ordinate system.<br />
In the present study georeferencing was done with the help of Survey of <strong>India</strong> (SoI) topo-<br />
sheets so that information from various sources can be compared and integrated on a GIS<br />
platform, if required.<br />
An understanding of the basics of projection system is required before selecting any<br />
transformation model. While maps are flat surfaces, Earth however is an irregular sphere,<br />
slightly flattened at the poles and bulging at the Equator. Map projections are systemic<br />
methods for “flattening the orange peel” in measurable ways. When transferring the
Job No 561410027 [ Page 9 of 29]<br />
CMPDI<br />
Earth and its irregularities onto the plane surface of a map, the following three factors are<br />
involved: (a) geoid (b) ellipsoid and (c) projection. Figure 2.2 illustrates the relationship<br />
between these three factors. The geoid is the rendition of the irregular spheroidal shape of<br />
the Earth; here the variations in gravity are taken into account. The observation made on<br />
the geoid is then transferred to a regular geometric reference surface, the ellipsoid.<br />
Finally, the geographical relationships of the ellipsoid (in 3-D form) are transformed into<br />
the 2-D plane of a map by a transformation process called map projection. As shown in<br />
Figure 2.2, the vast majority of projections are based upon cones, cylinders and planes.<br />
Fig 2.2 : Geoid – Ellipsoid – Projection Relationship<br />
In the present study, Polyconic projection along with Modified Everest Ellipsoidal<br />
model was used so as to prepare the map compatible with the SoI topo-sheets. Polyconic<br />
projection is used in SoI topo-sheets as it is best suited for small - scale mapping and<br />
larger area as well as for areas with North-South orientation (viz. <strong>India</strong>). Maps prepared<br />
using these projections are a compromise of many properties; it is neither conformal<br />
perspective nor equal area. Distances, areas and shapes are true only along central<br />
meridian. Distortion increases away from central meridian. Image transformation from<br />
generic co-ordinate system to a projected co-ordinate system was carried out using<br />
IMAGINE v.9.0 digital image processing system.
2.3.2 Image enhancement<br />
Job No 561410027 [ Page 10 of 29]<br />
CMPDI<br />
To improve the interpretability of the raw data, image enhancement is necessary. Most of<br />
the digital image enhancement techniques are categorised as either point or local<br />
operations. Point operations modify the value of each pixel in the image data<br />
independently. However, local operations modify the value of each pixel based on<br />
brightness value of neighbouring pixels. Contrast manipulations/ stretching technique<br />
based on local operation was applied on the image data using IMAGINE s/w.<br />
2.3.3 Training set selection<br />
The image data were analysed based on the interpretation keys. These keys are evolved<br />
from certain fundamental image-elements such as tone/colour, size, shape, texture,<br />
pattern, location, association and shadow. Based on the image-elements and other geo-<br />
technical elements like land form, drainage pattern and physiography; training sets were<br />
selected/identified for each land use/cover class. Field survey was carried out by taking<br />
selective traverses in order to collect the ground information (or reference data) so that<br />
training sets are selected accurately in the image. This was intended to serve as an aid for<br />
classification. Based on the variability of land use/cover condition and terrain<br />
characteristics and accessibility, 100 points were selected to generate the training sets.<br />
2.3.4 Signature generation and classification<br />
Image classification was carried out using the maximum likelihood algorithm. The<br />
classification proceeds through the following steps: (a) calculation of statistics [i.e.<br />
signature generation] for the identified training areas, and (b) the decision boundary of<br />
maximum probability based on the mean vector, variance, covariance and correlation<br />
matrix of the pixels.
Job No 561410027 [ Page 11 of 29]<br />
CMPDI<br />
After evaluating the statistical parameters of the training sets, reliability test of training<br />
sets was conducted by measuring the statistical separation between the classes that<br />
resulted from computing divergence matrix. The overall accuracy of the classification<br />
was finally assessed with reference to ground truth data. The aerial extent of each land<br />
use class in the coalfield was determined using ERDAS IMAGINE s/w. The classified<br />
image for the year 2012 for <strong>Bander</strong> <strong>Coalfield</strong> is shown in Plate No. 1.<br />
2.3.5 Creation/Overlay of Vector Database<br />
Plan showing areas and block boundaries are superimposed on the image as vector layer<br />
in the ArcGIS database. Road network, forest boundary and district boundary are<br />
digitised on different vector layers of ArcGIS 9.0.
2.3.6 Validation of classified image<br />
Job No 561410027 [ Page 12 of 29]<br />
CMPDI<br />
Ground truth survey was carried out for validation of the interpreted results from the<br />
study area. Based on the validation, classification accuracy matrix was prepared. The<br />
classification accuracy matrix is shown in Table 2.3.<br />
Classification accuracy in case of built-up land, waste land and water bodies lie between<br />
100% - 90%. In case of open forest, dense forest, the classification accuracy varies from<br />
90.0% to 95.0%. Classification for scrubs was 91.7%. It was mostly due to poor<br />
signature separability index. The overall classification accuracy in case <strong>Bander</strong><br />
<strong>Coalfield</strong> was 93.1%.<br />
2.3.7 Final thematic map preparation<br />
Final land use/Vegetation cover map (Plate - 1) was printed using HP Designjet 4500<br />
Colour Plotter. The map is prepared and printed on a scale of 1:50000 and is given in<br />
Drawing No. 1 along with the report. However, a soft copy in .pdf format is also enclosed<br />
for printing on any desired scale.
Sl.<br />
No<br />
.<br />
Classes<br />
in the<br />
Satellite Data Class<br />
Job No 561410027 [ Page 13 of 29]<br />
CMPDI<br />
Table 2.2 : Classification Accuracy Matrix for <strong>Bander</strong> <strong>Coalfield</strong><br />
Total<br />
Obsrv<br />
.<br />
Points<br />
C1 C2 C3<br />
1 Rural Settlement<br />
C1 05 5<br />
2 Dense Forest C2 12 11 1<br />
3 Open Forest C3 10 1 9 1<br />
Land use classes as observed in the field<br />
4 Scrubs C4 12 11 1<br />
5 Agriculture<br />
Land<br />
C5 10 9 1<br />
6 Fallow Land C6 10 9 1<br />
7 Waste Upland C7 12 11<br />
8 Water Bodies C8 5 5<br />
Total no. of observation<br />
points<br />
76<br />
% of commission 0.0 8.3 10.0 8.3 10 10 0 0<br />
% of omission 0.0 8.3 10.0 8.3 10 10 8.3 0<br />
% of Classification Accuracy<br />
100.0 91.7 90.0 91.7 90.0 90 91.7 100<br />
Overall Accuracy (%) 93.1<br />
C4<br />
C5<br />
C6<br />
C7<br />
C8
Job No 561410027 Page 14 of 29<br />
Chapter 3<br />
Land Use/ Vegetation Cover Monitoring<br />
3.1 Introduction<br />
CMPDI<br />
The need for information on land use/ vegetation cover has gained importance due to the<br />
all-round concern on environmental impact of mining. The information on land use/cover<br />
inventory that includes spatial distribution, aerial extent, location, rate and pattern of<br />
change of each category is of paramount importance for assessing the impact of coal<br />
mining on vegetation cover. Remote sensing data with its various spectral and spatial<br />
resolutions, offers comprehensive and accurate information for mapping and monitoring<br />
of land use/cover over a period of time. Since production from the mines are increasing<br />
and the mining areas also keep on increasing, it has become very important to reclaim the<br />
areas where the mining operations have been completed to reclaim the surface of the earth<br />
to its original form along with the vegetation cover.<br />
Realising the need of monitoring of land use/ vegetation cover and land reclamation in<br />
major coalfields; CIL requested the services of CMPDI to prepare land use/vegetation<br />
cover map of all coalfields at an interval of 3 years, including Banader coalfield for<br />
assessing the possible impact of coal mining on land use pattern and vegetation cover<br />
using remote sensing data. The first report in this series was prepared in year 2009 to<br />
analyse the existing land use/ vegetation cover, which will serve as the base data for<br />
future purposes. Currently the findings of analysis of the data of year 2012 is now<br />
compared for temporal changes with the results of the analysis of 2009, for the changes in<br />
land use / vegetation cover during the 3 year interval. This will help in formulating the<br />
mitigative measures, if any required for environmental protection in the coal mining area.
3.2 Land Use / Vegetation Cover Classification<br />
Job No 561410027 Page 15 of 29<br />
CMPDI<br />
The array of information available on land use/cover requires to be arranged or grouped<br />
under a suitable framework in order to facilitate the creation of database. Further, to<br />
accommodate the changing land use/vegetation cover pattern, it becomes essential to<br />
develop a standardised classification system that is not only flexible in nomenclature and<br />
definition, but also capable of incorporating information obtained from the satellite data<br />
and other different sources.<br />
The present framework of land use/cover classification has been primarily based on the<br />
‘Manual of Nationwide Land Use/ Land Cover Mapping Using Satellite Imagery’<br />
developed by National Remote Sensing Centre, Hyderabad, which has further been<br />
modified by CMPDI for coal mining areas. Land use/vegetation cover map was prepared<br />
on the basis of image interpretation carried out based on the satellite data for the year<br />
2012. Following land use/cover classes are identified in the <strong>Bander</strong> coalfield region<br />
(Table 3.1).
-<br />
3.3 Data Analysis & Change Detection<br />
Job No 561410027 Page 16 of 29<br />
CMPDI<br />
Satellite data of the year 2012 was processed using ERDAS Imagine v.9.0 image<br />
processing s/w in order to interpret the various land use and vegetation cover classes<br />
present in the <strong>Bander</strong> coalfield. The analysis was carried out for entire coalfield covering<br />
about 361.09 sq. km.<br />
The area of each class was calculated and analysed using ERDAS Digital Image<br />
Processing s/w and ArcGIS s/w. Analysis of land use / vegetation cover pattern in <strong>Bander</strong><br />
<strong>Coalfield</strong> and changes therein for the year 2009 and 2012 was carried out, details are and<br />
shown in table 3.2.<br />
Table 3.1<br />
Land use / Vegetation Cover classes identified in <strong>Bander</strong><br />
<strong>Coalfield</strong><br />
1 Vegetation Cover<br />
2 Agricultural Land<br />
LEVEL –I LEVEL-II<br />
3.1 Dense Forest<br />
3.2 Open Forest<br />
3.3 Scrubs<br />
2.1 Crop Land<br />
2.2 Fallow Land<br />
3 Wasteland 3.1 Waste upland with/without scrubs<br />
4 Settlements<br />
4.1 Urban<br />
4.2 Rural<br />
5 Water Bodies 5.1 River/Streams /Reservoir
Job No 561410027 Page 17 of 29<br />
TABLE – 3.2<br />
CMPDI<br />
STATUS OF VEGETATION COVER & LANDUSE PATTERN IN BANDER<br />
COALFIELD DURING YEAR 2009 & 2012<br />
Area in Sq km<br />
Year 2009 Year 2012 Change<br />
Land Use Classes<br />
VEGETATION COVER<br />
Area<br />
% of<br />
total<br />
Area<br />
% of<br />
total<br />
Area % of<br />
total<br />
Reasons<br />
Dense forest 45.78 12.68 43.18 11.96 -2.60 -0.72<br />
Due to biotic<br />
interference<br />
Open Forest 50.52 13.99 49.32 13.66 -1.20 -0.33 -do-<br />
Total Forest 96.3 26.67 92.50 25.62 -3.80 -1.05<br />
Scrubs 62.02 17.17 58.65 16.24 -3.37 -0.93<br />
AGRICULTURAL LAND<br />
Sub Total 158.32 43.84 151.15 41.86 -7.17 -1.92<br />
Crop Land 87.43 24.21 88.05 24.38 0.62 0.17<br />
Fallow Land 99.35 27.51 107.67 29.82 8.32 2.31<br />
WASTELAND<br />
Sub Total 186.78 51.72 195.72 54.20 8.94 2.48<br />
Wasteland 10.79 2.99 9.85 2.73 -0.94 -0.26<br />
Sub Total 10.79 2.99 9.85 2.73 -0.94 -0.26<br />
SETTLEMENTS<br />
Urban 0.36 0.10 0.69 0.19 0.33 0.09<br />
Rural 0.33 0.09 1.12 0.31 0.79 0.22<br />
Sub Total 0.69 0.19 1.81 0.50 1.02 0.31<br />
WATER BODIES 4.55 1.26 2.56 0.71 -1.99 -0.55<br />
TOTAL 361.09 100.00 361.09 100.00 0.00 0.00<br />
Due to conversion<br />
of scrubs,<br />
wasteland and<br />
water bodies in<br />
agriculture land<br />
Due to urbanisation
3.3.1 Vegetation Cover<br />
Job No 561410027 [ Page 18 of 29]<br />
CMPDI<br />
Vegetation cover in the coalfield area has been found to be predominantly of three classes.<br />
Dense Forest<br />
Open Forest<br />
Scrubs have been put into a separate class.<br />
There has been no significant variation in the land use under the vegetation classes within<br />
the area as shown in in Table 3.3<br />
. TABLE – 3.3<br />
Changes in Agricultural Land in <strong>Bander</strong> <strong>Coalfield</strong> during the year 2009 & 2012<br />
Land Use Classes<br />
VEGETATION COVER<br />
Year 2009 Year 2012 Change<br />
Area<br />
% of<br />
total<br />
Area<br />
% of<br />
total<br />
Area % of<br />
total<br />
Dense forest 45.78 12.68 43.18 11.96 -2.60 -0.72<br />
Open Forest 50.52 13.99 49.32 13.66 -1.20 -0.33<br />
Total Forest 96.3 26.67 92.50 25.62 -3.80 -1.05<br />
Scrubs 62.02 17.17 58.65 16.24 -3.37 -0.93<br />
Total Vegetation Cover 158.32 43.84 151.15 41.86 -7.17 -1.92<br />
Dense forest – Forest having crown density of above 40% comes in this class. Dense<br />
forest over the area has decreased slightly, basically due to natural degradation. A total<br />
decrease in dense forest is estimated to be 2.60 sq km, i.e. 0.72% of the coalfield area.<br />
Open Forest – Forest having crown density between 10% to 40% comes under this class.<br />
Open forest cover over the area has also reduced in the coalfield area. Some of the<br />
reduction is also due to deforestation and natural degradation. The total decrease observed<br />
in open forest is 1.20sq km, i.e. 0.33% of the coalfield area..<br />
Scrubs – Scrubs are vegetation with crown density less than 10%. Scrubs in the coalfield<br />
has also decreased. This is because of being converted into agricultural land and
Job No 561410027 [ Page 19 of 29]<br />
CMPDI<br />
settlements. There has been decrease of 3.37 sq km, ie 0.93% of land with scrubs in the<br />
coalfield area.<br />
It is significant to note that the vegetation cover in <strong>Bander</strong> <strong>Coalfield</strong> has decreased by 7.17<br />
sq km which is about 1.92% % of the coalfield area. This decrease is mainly due to natural<br />
depletion of vegetation cover and land being converted into agriculture and settlements<br />
areas. Also depletion of forest is seen at many places.<br />
The variation in the vegetation classes which took place during year 2009 and 2012 within<br />
the area are shown in bar diagram in Figure – 3.1.<br />
AREA (Sq Km)<br />
70<br />
60<br />
50<br />
40<br />
30<br />
20<br />
10<br />
0<br />
Figures represent area in sq km<br />
FIGURE - 3.1<br />
CHANGES IN VEGETATION COVER IN BANDER COALFIELD<br />
DURING 2009 & 2012<br />
62.02<br />
58.65<br />
50.52<br />
45.78<br />
49.32<br />
43.18<br />
2009 2012<br />
YEAR<br />
Dense Forest<br />
Open Forest<br />
Scrubs
3.3.2 Agricultural Land<br />
Job No 561410027 [ Page 20 of 29]<br />
CMPDI<br />
Land primarily used for farming and production of food, fibre and other commercial and<br />
horticultural crops falls under this category. It includes crop land (irrigated and<br />
unirrigated) and fallow land (land used for cultivation, but temporarily allowed to rest)<br />
Total agricultural land which was 186.78 sq km in year 2009 has marginally increased to<br />
195.72 sq km in the year 2012. The increase of 8.94 km (2.48%) in agricultural land is<br />
due to conversion of some scrubs, area around waterbodies and waste land into agriculture.<br />
The details are shown below in Table 3.4.<br />
TABLE – 3.4<br />
Changes in Agricultural Land in <strong>Bander</strong> <strong>Coalfield</strong> during the year 2009 & 2012<br />
Agricultural<br />
Land<br />
Crop Land<br />
Fallow Land<br />
Year 2009 Year 2012<br />
Area<br />
(sq km)<br />
% of<br />
total<br />
Area<br />
(sq km)<br />
% of<br />
total<br />
Area<br />
(sq<br />
km)<br />
Change<br />
Analysis<br />
% of<br />
total<br />
87.43 24.21 88.05 24.38 0.62 0.17<br />
99.35 27.51 107.67 29.82 8.32 2.31<br />
Sub Total 186.78 51.72 195.72 54.20 8.94 2.48<br />
The variation in the Agricultural Land which took place during year 2009 and 2012 within<br />
the coalfield area are shown in bar diagram in Figure – 3.2.
AREA (Sq Km)<br />
120<br />
100<br />
80<br />
60<br />
40<br />
20<br />
0<br />
3.3.3 Wasteland<br />
Job No 561410027 [ Page 21 of 29]<br />
CMPDI<br />
Wasteland is degraded and unutilised class of land which is deteriorating on account of<br />
natural causes or due to lack of appropriate water and soil management. Wasteland can<br />
result from inherent/imposed constraints such as location, environment, chemical and<br />
physical properties of the soil or financial or management constraints.<br />
There has been a slight reduction of 0.94 sq km, ie 0.26% of the area. Some of the waste<br />
lands have become fallow land.<br />
The land use pattern within the area for waste lands is shown below in Table – 3.5.<br />
TABLE – 3.5<br />
Changes in Wastelands in <strong>Bander</strong> <strong>Coalfield</strong> during the year 2009 & 2012<br />
Waste land<br />
Wasteland with/<br />
without scrub<br />
FIGURE - 3.2<br />
CHANGES IN AGRICULTURAL LAND IN BANDER<br />
COALFIELD DURING 2009 & 2012<br />
99.35<br />
107.67<br />
87.43 88.05<br />
2009 2012<br />
YEAR<br />
Year 2009 Year 2012 Change Analysis<br />
Area<br />
(sq km)<br />
% of<br />
total<br />
Area<br />
(sq km)<br />
% of<br />
total<br />
Crop Land<br />
Fallow Land<br />
Area<br />
(sq<br />
km)<br />
% of<br />
total<br />
10.79 2.99 9.85 2.73 -0.94 -0.26
Job No 561410027 [ Page 22 of 29]<br />
CMPDI<br />
The variation in the Waste Land which took place during year 2009 and 2012 within the<br />
coalfield area are shown in bar diagram in Figure – 3.3<br />
AREA (Sq Km)<br />
12<br />
10<br />
8<br />
6<br />
4<br />
2<br />
0<br />
FIGURE - 3.3<br />
CHANGES IN WASTE LAND IN BANDER COALFIELD DURING<br />
2009 & 2012<br />
10.79<br />
9.85<br />
2009 2012<br />
YEAR<br />
Wasteland
3.3.4 Settlements<br />
Job No 561410027 [ Page 23 of 29]<br />
CMPDI<br />
All the man-made constructions covering the land surface are included under this category.<br />
Built-up land has been further divided in to rural and urban classes. The details of the land<br />
use under this category are shown in Table 3.6 as follows:<br />
TABLE- 3.6<br />
Changes in Settlements in <strong>Bander</strong> <strong>Coalfield</strong>s during the year 2009 & 2012<br />
Settlements<br />
Year 2009 Year 2012 Change Analysis<br />
Area<br />
(sq km)<br />
% of<br />
total<br />
Area<br />
(sq km)<br />
% of<br />
total<br />
Area<br />
(sq km)<br />
% of total<br />
Urban 0.36 0.10 0.69 0.19 0.33 0.09<br />
Rural 0.33 0.09 1.12 0.31 0.79 0.22<br />
Sub Total 0.69 0.19 1.81 0.50 1.02 0.31<br />
It is observed that the settlements within the coalfield have grown by 1.02 sq km, which is<br />
about 0.31% of the coalfield area. It is observed that the rural settlements have grown<br />
marginally by 0.79 sq km which is 0.22% of the coalfield area. The Urban settlement within<br />
the coalfield area has grown by about 0.33 sq km, i.e. 0.09%. This increase is due to the<br />
increasing trend of urbanisation.<br />
The variation in the Built-up Land/Settlements which took place during year 2009 and 2012<br />
within the coalfield area are shown in bar diagram in Figure – 3.4
AREA (Sq Km)<br />
1.2<br />
3.3.5 Water bodies<br />
1<br />
0.8<br />
0.6<br />
0.4<br />
0.2<br />
0<br />
0.36<br />
0.33<br />
0.69<br />
2009 2012<br />
Job No 561410027 [ Page 24 of 29]<br />
CMPDI<br />
It is the area of impounded water includes natural lakes, rivers/streams and man made ca-<br />
nal, reservoirs, tanks etc. The water bodies in the study area have decreased from 4.55 sq<br />
km in year 2009 (1.26%) to 2.56 sq km (0.71%) in 2012. This is due to the reason of natu-<br />
ral drying up of surface water bodies in many places and the increase in settlements. The<br />
variation in area under various water bodies within the coalfield area is shown in figure 3.5<br />
AREA (Sq Km)<br />
5<br />
4<br />
3<br />
2<br />
1<br />
0<br />
FIGURE - 3.4<br />
CHANGES IN BUILT-UP LAND IN BANDER COALFIELD DURING 2009 & 2012<br />
4.55<br />
YEAR<br />
1.12<br />
2.56<br />
2009 2012<br />
YEAR<br />
Urban Settlements<br />
Rural Settlements<br />
FIGURE - 3.5<br />
CHANGES IN WATERBODIES IN BANDER COALFIELD<br />
DURING 2009 & 2012<br />
Waterbodies
3.3.6 Changes in Land Use/Vegetation Cover Classes<br />
250<br />
200<br />
150<br />
100<br />
50<br />
0<br />
158.32<br />
151.15<br />
186.78<br />
195.72<br />
Vegetation Agricultural<br />
Land<br />
10.79<br />
9.85<br />
Job No 561410027 [ Page 25 of 29]<br />
0.69<br />
1.81<br />
4.55<br />
2.56<br />
Wasteland Settlements Waterbodies<br />
CMPDI<br />
The overall variation in various Land Use /Cover classes in <strong>Bander</strong> <strong>Coalfield</strong> during the<br />
year 2009 and 2012 is shown in the Bar Chart below:<br />
Area<br />
(Sq km)<br />
Year<br />
Fig 3.6 Overall Changes in Land Use/Cover Classes in <strong>Bander</strong> <strong>Coalfield</strong><br />
in the Year 2009 & 2012<br />
It can be seen from the chart above that there is a decrease in vegetation cover in the coal-<br />
field area mainly because of deforestation and scrub areas becoming suitable for the purpose<br />
of agriculture. Agricultural land has increased which may be due enhanced human activities<br />
near the forest areas and other related activities. Wasteland has also reduced due to increase<br />
in human activities. Settlements have also increased, which is due to increase in population<br />
and other related human activities.<br />
2009<br />
2012
Plate -1 VegetationCover Classes in <strong>Bander</strong> <strong>Coalfield</strong> in the Year 2012<br />
Job No 561410027 [ Page 26 of 29]<br />
CMPDI
107.67<br />
0.69<br />
2.56<br />
9.85<br />
88.05<br />
1.12<br />
43.18<br />
Fig. 3.7 Land use / cover pattern in <strong>Bander</strong> <strong>Coalfield</strong> region<br />
Job No 561410027 [ Page 27 of 29]<br />
49.32<br />
58.64<br />
Urban Settlements<br />
Rural Settlements<br />
Dense Forest<br />
Open Forest<br />
Scrubs<br />
Crop land<br />
Fallow Land<br />
Waste Land<br />
River/ Ponds<br />
CMPDI
Chapter 4<br />
Conclusion & Recommendations<br />
4.1 Conclusion<br />
Job No 561410027 [ Page 28 of 29]<br />
CMPDI<br />
In the present study, land use/vegetation cover map of <strong>Bander</strong> <strong>Coalfield</strong> is prepared based<br />
on IRS-R2/ LISS IV data of March 2012 in order to generate the database on vegetation<br />
cover and land use pattern to detect the changes in respect to the year 2009 for effective<br />
natural resource management and its planning. The Land use/vegetation cover analysis will<br />
help to analyse and monitor the possible impact of mining and other industrial activities in<br />
the area.<br />
Study reveals that vegetation cover has decreased by 7.17 sq km which is 1.92% of the<br />
coalfield area in a span of last three years. The major factors for decrease in vegetation cover<br />
has been found to be the depletion of natural forests and increase of settlements and related<br />
activities. Scrubs have been kept as separate entity from the forests in line with the practice<br />
adopted by Forest Survey of <strong>India</strong> (FSI). The Scrubs have decreased by 0.93 % in the area<br />
because of the settlements and agricultural needs. This shows that the area is under<br />
advancement of human activities. Study reveals that decrease in dense forest (-0.72%) and<br />
open forests (-0.33%) is mostly due natural depletion and human interferences.<br />
Besides vegetation cover, other land use classes were also analysed and it was observed that<br />
in a span of three years, agricultural area has increased from 186.78 sq km to 195.72 sq km.<br />
This increase of 8.94 sq km (2.48%) in agricultural area is due to increase in human<br />
settlements and related activities for livelihood.<br />
Further study reveals the area of wasteland has also decreased very marginally from 10.79<br />
sq km to 9.85 sq km during the last 3 years. This reduction of 0.94 sq km is mainly due to<br />
conversion of wasteland into settlements and building the infrastructure in urban areas. Area<br />
of settlement has increased from 0.69 sq km to 1.81 sq km. This increase of 1.02 sq km in<br />
settlement area has taken place mainly due to growth of rural population and migration to<br />
urban settlements in the region.
The detailed change analysis is given in Table-3.2.<br />
4.2 Recommendations<br />
Job No 561410027 [ Page 29 of 29]<br />
CMPDI<br />
Keeping in view the sustainable development together with coal mining in the area, it is<br />
recommended that;<br />
A. To combat the effect of rapid deforestation, WCL should start the afforestation<br />
programme to balance the ecological changes.<br />
B. Efforts should be made to protect the vegetation cover from further depletion.<br />
C. Fresh settlements should not be allowed in the region.<br />
D. Surface water bodies should be protected and preserved. Efforts are required for<br />
rain water harvesting in both urban & rural areas, which may in turn contribute to<br />
the ground water table.
Central Mine Planning & Design Institute <strong>Ltd</strong>.<br />
(A Subsidiary of Coal <strong>India</strong> <strong>Ltd</strong>.)<br />
Gondwana Place, Kanke Road, Ranchi 834031, Jharkhand<br />
Phone : (+91) 651 2230001, 2230002, 2230483, FAX (+91) 651 2231447, 2231851<br />
Wesite : www.cmpdi.co.in, Email : cmpdihq@cmpdi.co.in