pench-kanhan coalfields - Western Coalfields Ltd. India.
pench-kanhan coalfields - Western Coalfields Ltd. India.
pench-kanhan coalfields - Western Coalfields Ltd. India.

You also want an ePaper? Increase the reach of your titles
YUMPU automatically turns print PDFs into web optimized ePapers that Google loves.
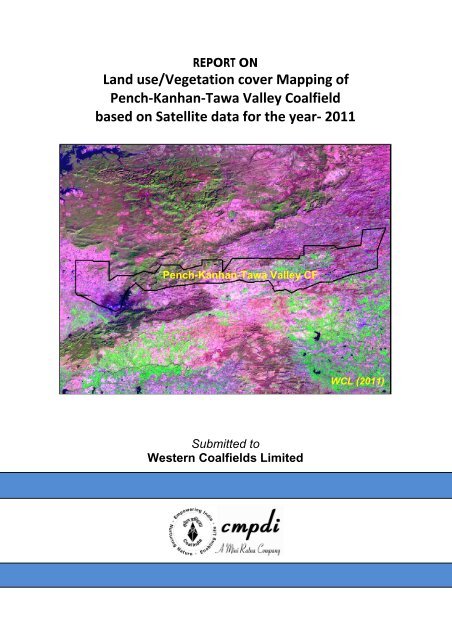
REPORT ON<br />
Land use/Vegetation cover Mapping of<br />
Pench‐Kanhan‐Tawa Valley Coalfield<br />
based on Satellite data for the year‐ 2011<br />
Pench-Kanhan-Tawa Valley CF<br />
Submitted to<br />
<strong>Western</strong> <strong>Coalfields</strong> Limited<br />
WCL (2011)
Job No. 561410027 (WCL) i<br />
CMPDI<br />
Land use/Vegetation cover Mapping of<br />
Pench‐Kanhan‐Tawa Valley Coalfield based on<br />
Satellite data for the year‐ 2011<br />
March-2012<br />
Remote Sensing Cell<br />
Geomatics Division<br />
CMPDI, Ranchi
Document Control Sheet<br />
(1) Job No. RSC/561410027<br />
(2) Publication Date March 2012<br />
(3) Number of Pages 32<br />
(4) Number of Figures 7<br />
(5) Number of Tables 6<br />
(6) Number of Plates 2<br />
Job No. 561410027 (WCL) ii<br />
CMPDI<br />
(7) Title of Report Land use / Vegetation cover mapping of<br />
Pench-Kanhan-Tawa Valley Coalfield based on<br />
satellite data for the year 2011.<br />
(8) Aim of the Report To prepare Land use / Vegetation cover map of<br />
Pench-Kanhan-Tawa Valley Coalfield on<br />
1:50000 scale for creating the geo-<br />
(9) Executing Unit<br />
environmental data base for land, vegetation<br />
cover, drainage, surface water, coal mines and<br />
infrastructure.<br />
Remote Sensing Cell,<br />
Geomatics Division<br />
Central Mine Planning & Design Institute<br />
Limited, Gondwana Place, Kanke Road,<br />
Ranchi 834008<br />
(10) User Agency <strong>Western</strong> <strong>Coalfields</strong> <strong>Ltd</strong>.<br />
(11) Authors P.Chowdhury (Senior Officer)<br />
Mr. N.P.Singh, GM(Remote sensing)<br />
Mr. V.K.Gupta, GM(Geomatics)<br />
(12) Security Restriction Restricted Circulation<br />
(13) No. of Copies 5<br />
(14) Distribution Statement Official
Contents<br />
Job No. 561410027 (WCL) iii<br />
Restricted<br />
CMPDI<br />
Page No.<br />
Document Control Sheet ii<br />
List of Figures iv<br />
List of Tables iv<br />
List of Plates iv<br />
1.0 Introduction 1 - 4<br />
1.1 Project Reference<br />
1.2 Objectives<br />
1.3 Location and Accessibility<br />
1.4 Drainage<br />
1.5 Reserve Forest<br />
2.0 Remote Sensing Concept & Methodology 5 - 18<br />
2.1 Remote Sensing<br />
2.2 Electromagnetic Spectrum<br />
2.3 Scanning System<br />
2.4 Data Source<br />
2.5 Characteristics of Satellite/Sensor<br />
2.6 Data Processing<br />
2.6.1 Geometric Correction, rectification & geo-referencing<br />
2.6.2 Image enhancement<br />
2.6.3 Training set selection<br />
2.6.4 Signature generation & classification<br />
2.6.5 Creation / Overlay of vector database in GIS<br />
2.6.6 Validation of classified image<br />
3.0 Land use / Vegetation Cover Mapping 19- 31<br />
3.1 Introduction<br />
3.2 Landuse / Cover Classification<br />
3.3 Data Analysis<br />
3.3.1 Settlement<br />
3.3.2 Vegetation Cover<br />
3.3.3 Mining Area<br />
3.3.4 Agricultural Land<br />
3.3.5 Wasteland<br />
3.3.6 Water Bodies<br />
4.0 Conclusion and Recommendations 32<br />
4.1 Conclusion<br />
4.2 Recommendations
List of Figures<br />
1.1 Location Map of Pench-Kanhan-Tawa Valley Coal Field.<br />
2.1 Remote Sensing Radiation system<br />
2.2 Electromagnetic Spectrum.<br />
2.3 Expanded diagram of the visible and infrared regions (upper) and<br />
Microwave regions (lower) showing atmospheric windows.<br />
2.4 Methodology for Land use / Cover mapping.<br />
2.5 Geoid-Ellipsoid -Projection Relationship.<br />
2.6 Area-wise percentage of different land use/cover in the coalfield.<br />
List of Tables<br />
2.1 Electromagnetic spectral regions.<br />
2.2 Characteristics of the satellite/sensor used in the present project work.<br />
2.3: Classification Accuracy Matrix.<br />
3.1 Vegetation cover / landuse classes identified in Pench-Kanhan-Tawa<br />
Valley Coalfield.<br />
3.2 Distribution of Landuse / Cover Patten in Pench-Kanhan-Tawa Valley<br />
Job No. 561410027 (WCL) iv<br />
CMPDI<br />
Coalfield in 2011<br />
3.3 Distribution of Landuse / Cover Patten in 91 coal blocks of Pench-Kanhan-<br />
Tawa Valley in 2011<br />
List of Plates<br />
List of maps/plates prepared on a scale of 1:50,000 are given below:<br />
1. Plate No. 1 IRS-P6/ LISS-III FCC of Pench-Kanhan-Tawa Valley Coalfield<br />
2. Plate No. 2 Landuse / Cover Map Pench-Kanhan-Tawa Valley C.F. based on<br />
IRS – P6/ LISS-III data.
Introduction<br />
1.1 Project Reference<br />
Chapter 1<br />
Job No. 561410027 (WCL) 1<br />
CMPDI<br />
A road map was submitted by CMPDI to Coal <strong>India</strong> <strong>Ltd</strong>. for creating the<br />
geo-environmental data base of all the 28 major <strong>coalfields</strong> and to assess<br />
the impact of coal mining and associated industrialization on land use and<br />
vegetation cover at regular interval of three years. Work order no.<br />
CIL/WBP/Env/2009/2428 dated 29.12.009; was issued by CIL to CMPDI for<br />
the above study. In pursuant to the above work order, land use/vegetation<br />
cover mapping of Pench-Kanhan-Tawa Valley Coalfield based on satellite<br />
data was taken up to create the geo-environmental data base of the coal-<br />
field using remote sensing data & GIS.<br />
1.2 Objectives<br />
The objective of the present study is to prepare a regional land use and<br />
vegetation cover map of Pench-Kanhan-Tawa Valley coalfield on 1:50,000<br />
scale based on satellite data of the year 2011, using digital image<br />
processing technique for creating the geo-environmental data base in<br />
respect of land use, vegetation cover, drainage, mining area, infrastructure<br />
etc. and updation of database at regular interval of three years to assess<br />
the impact of coal mining and other industrial activities on land use and<br />
vegetation cover in the coalfield area.<br />
1.3 Location & Accessibility<br />
Pench-Kanhan-Tawa Valley Coalfield covering an area of about 907.90 sq.<br />
Km. lies in the Chhindwara and Betul district of Madhya Pradesh. It forms<br />
the southern fringes of Satpura basin. This coalfield has been divided into<br />
three parts: Pench, Kanhan and Tawa. It is bounded by Latitude 22 0 05’ to
Job No. 561410027 (WCL) 2<br />
CMPDI<br />
22 0 25’ and Longitudes 78 0 00’ to 79 0 05’ and located in the central part of<br />
<strong>India</strong> i,e M.P. The coalfield area is covered under Survey of <strong>India</strong> topo-<br />
sheet no. 55 J/4, 55 J/8, 55 J/11, 55 J/12, 55 J/15, 55 J/16 & 55 N/3 on RF<br />
1:50000.This coalfield holds a premier position in <strong>India</strong> for having a<br />
considerable share of reserve of thermal grades of non-coking coal.<br />
Pench-Kanhan-Tawa Valley coalfield is well connected by rail and road<br />
ways. Parasia is the major mining town in the coalfield situated in Pench<br />
which is connected to the district town Chhindwara (27Km) in the south east<br />
via MP State Highway No.19 and South-Eastern Railway Barkuhi Branch<br />
(0.76 m gauge). Parasia is connected to Barkuhi and Chandmeta via SE<br />
railway (Barkuhi branch) in the west and Rawanwara (4.0 Km) towards<br />
east. Broad gauge line of Central Railways (Amla-Parasia Branch) is<br />
passing south of the coalfield connecting Parasia with Amla (87 Km) via<br />
Jamai (17 Km). The nearest air port is Nagpur at 160 Km. away from<br />
Chhindwara. MP State Highway No. 43 is running through the coalfield<br />
connecting Parasia, Chandmeta, Bhamodi, Eklehra in the east; Jamai,<br />
Damua in central part (Kanhan Area) and Sarni, Bagdona in the west (Tawa<br />
Valley). Satpura Reservoir is situated in the southern edge of Tawa valley<br />
connected to Sarni (5 Km.) by a weather road built by Madhya Pradesh<br />
State Electricity Board. Sarni Thermal Power Station is one of the coal<br />
based power plants of MPPGCL situated 18 Km. from Ghora Dongri railway<br />
station.<br />
1.4 Drainage<br />
The southern and eastern part of Tawa valley is hilly and rugged with thick<br />
forest cover whereas the western. North-western parts are comparatively<br />
flat. Tawa river flowing to the west and south is controlling the drainage of<br />
Tawa reservoir. Few seasonal nallahs (Latiya Nala, Dagdaga Nala etc.)<br />
originating from Kilandev Pahad, Bagdev Pahad, Shri Phar and other ele-
Job No. 561410027 (WCL) 3<br />
CMPDI<br />
vated regions discharge in to Tawa river which flows in westerly direction.<br />
Satpura dam has been built across Tawa river to store water for Thermal<br />
Power Station at Sarni as well as to regulate the flow of water in the down-<br />
stream of Tawa river. Pench-Kanhan area exhibits a rugged topography<br />
covered with Deccan Trap. The terrain comprises of many hills and val-<br />
leys- structural hills, covered by Gondwanas, are seen in northern part;<br />
denudational hills in southern part and dissected Deccan plateau in east-<br />
ern and northeastern parts. The area is drained by two major rivers -<br />
Pench and Kanhan river (flowing towards south east) and their tributaries<br />
namely Gonur, Magrahi, Ghatamai, Sukri river, Bor Nala, Rakhi Nala,<br />
Tambiya Nadi, Bardhar Nadi etc. The recent alluvium deposits are found at<br />
places along these rivers.<br />
1.5 Reserved Forests<br />
Sobhapur RF, Ladardev RF are situated in the western part (Tawa) of<br />
Pench-Kanhan-Tawa Valley <strong>coalfields</strong>. Extensive Asir RF in the northern<br />
part of Tawa valley and Kanhan Area is the main reserved forest in the<br />
<strong>coalfields</strong>. There are number of reserved forests in the Pench area –<br />
Bilawar RF, Garadei RF, Kotakhari RF, Dhob RF, Marwa RF, Bhandariya<br />
RF, Rawanwara RF, Nawegaon RF, Duddi RF, Thaonri RF, Bardiya RF in<br />
the central part; Urdhan RF, Gunor RF, Naheriya RF in the easternmost<br />
part & Thesgora RF in the south-eastern part of the <strong>coalfields</strong>.
LOCATION MAP OF PENCH-KANHAN-TAWA VALLEY COAL FIELD<br />
Job No. 561410027 (WCL) 4<br />
CMPDI<br />
1.1: Location Map of<br />
Pench-Kanhan-Tawa<br />
Valley Coalfield in<br />
Chhindwara & Betul<br />
districts, MP
2.11<br />
Remote<br />
Sennsing<br />
object<br />
or areea<br />
throughh<br />
the<br />
anaalysis<br />
of<br />
by<br />
a device<br />
phyysical<br />
conntact<br />
withh<br />
the<br />
object<br />
or<br />
inveestigationn.<br />
The<br />
remmote<br />
ssensing<br />
commmonly<br />
meethods<br />
tthat<br />
emmploy<br />
electro-magnnetic<br />
ennergy<br />
(such<br />
as ligght,<br />
heat<br />
raddio<br />
wavees)<br />
as<br />
meeans<br />
of ddetecting<br />
meeasuring<br />
chaaracteristiccs.<br />
data acquuired<br />
that is nnot<br />
in<br />
area uunder<br />
restrictedd<br />
to<br />
All physical oobjects<br />
onn<br />
the<br />
earrth<br />
surfacee<br />
continuoously<br />
emit<br />
electromagnetic<br />
raddiation<br />
beecause<br />
off<br />
the oscillations<br />
of o their aatomic<br />
paarticles.<br />
Remote R<br />
eneergy<br />
fromm<br />
the SUNN,<br />
which<br />
objects<br />
on thhe<br />
surfacee<br />
of the eearth.<br />
Figu ure 2.1 scchematicaally<br />
illustra ate the<br />
Job No. 5614100027<br />
(WCLL)<br />
term<br />
is<br />
and<br />
the<br />
and<br />
oobject<br />
CChapte<br />
er 2<br />
Reemote<br />
Sensinng<br />
Conncepts<br />
and Meethodoology<br />
Remote<br />
sensing<br />
is thhe<br />
sciencee<br />
and art of obtainning<br />
informmation<br />
about<br />
an<br />
sennsing<br />
is laargely<br />
concerned<br />
with the measuremment<br />
of eelectro-ma<br />
agnetic<br />
is reflec cted, scatttered<br />
or<br />
5<br />
CMPDI C<br />
emitted by b the
Job No. 561410027 (WCL) 6<br />
CMPDI<br />
generalised processes involved in electromagnetic remote sensing of the<br />
earth resources.<br />
2.2 Electromagnetic Spectrum<br />
The electromagnetic (EM) spectrum is the continuum of energy that ranges<br />
from meters to nanometres in wavelength and travels at the speed of light.<br />
Different objects on the earth surface reflect different amounts of energy in<br />
various wavelengths of the EM spectrum.<br />
Figure 2.2 shows the electromagnetic spectrum, which is divided on the<br />
basis of wavelength into different regions that are described in Table 2.1.<br />
The EM spectrum ranges from the very short wavelengths of the gamma-ray<br />
region to the long wavelengths of the radio region. The visible region (0.4-<br />
0.7µm wavelengths) occupies only a small portion of the entire EM<br />
spectrum.<br />
Energy reflected from the objects on the surface of the earth is recorded as<br />
a function of wavelength. During daytime, the maximum amount of energy is<br />
reflected at 0.5µm wavelengths, which corresponds to the green band of the
Job No. 561410027 (WCL) 7<br />
CMPDI<br />
visible region, and is called the reflected energy peak (Figure 2.2). The earth<br />
also radiates energy both day and night, with the maximum energy 9.7µm<br />
wavelength. This radiant energy peak occurs in the thermal band of the IR<br />
region (Figure 2.2).
Job No. 561410027 (WCL) 8<br />
CMPDI<br />
Table 2.1 Electromagnetic spectral regions<br />
Region Wavelength Remarks<br />
Gamma ray < 0.03 nm Incoming radiation is completely absorbed by the<br />
upper atmosphere and is not available for remote<br />
sensing.<br />
X-ray 0.0 to 3.00 nm Completely absorbed by atmosphere. Not<br />
3<br />
Ultraviolet 0.0<br />
3<br />
Photographic UV<br />
band<br />
0.3<br />
0<br />
Visible 0.4<br />
0<br />
Infrared 0.7<br />
0<br />
Reflected IR band 0.7<br />
0<br />
Thermal IR band 3.0<br />
0<br />
8.0<br />
0<br />
Microwave 0.1<br />
0<br />
Radar 0.1<br />
0<br />
employed in remote sensing.<br />
to 0.40 µm Incoming wavelengths less than 0.3mm are<br />
completely absorbed by Ozone in the upper<br />
atmosphere.<br />
to 0.40 µm Transmitted through atmosphere. Detectable<br />
with film and photo detectors, but atmospheric<br />
scattering is severe.<br />
to 0.70 µm Imaged with film and photo detectors. Includes<br />
to 100.0<br />
0<br />
reflected energy peak of earth at 0.5mm.<br />
µm Interaction with matter varies with wavelength.<br />
Absorption bands separate atmospheric<br />
transmission windows.<br />
to 3.00 µm Reflected solar radiation that contains no<br />
information about thermal properties of materials.<br />
The band from 0.7-0.9mm is detectable with film<br />
to<br />
to<br />
5.00<br />
14.00<br />
µm<br />
µm<br />
and is called the photographic IR band.<br />
Principal atmospheric windows in the thermal<br />
region. Images at these wavelengths are<br />
acquired by optical-mechanical scanners and<br />
special vediocon systems but not by film.<br />
to 30.00 cm Longer wavelengths can penetrate clouds, fog<br />
and rain. Images may be acquired in the active<br />
or passive mode.<br />
to 30.00 cm Active form of microwave remote sensing. Radar<br />
images are acquired at various wavelength<br />
bands.<br />
Radio > 30.00 cm Longest wavelength portion of electromagnetic<br />
spectrum. Some classified radars with very long<br />
wavelength operate in this region.<br />
The earth's atmosphere absorbs energy in the gamma-ray, X-ray and most<br />
of the ultraviolet (UV) region; therefore, these regions are not used for re-<br />
mote sensing. Details of these regions are shown in Figure 2.3. The hori-<br />
zontal axes show wavelength on a logarithmic scale; the vertical axes show<br />
percent atmospheric transmission of EM energy. Wavelength regions with<br />
high transmission are called atmospheric windows and are used to acquire<br />
remote sensing data. Detection and measurement of the recorded energy<br />
enables identification of surface objects (by their characteristic wavelength
Job No. 561410027 (WCL) 9<br />
CMPDI<br />
patterns or spectral signatures), both from air-borne and space-borne plat-<br />
forms.<br />
2.3 Scanning System<br />
The sensing device in a remotely placed platform (aircraft/satellite) records<br />
EM radiation using a scanning system. In scanning system, a sensor, with a<br />
narrow field of view is employed; this sweeps across the terrain to produce<br />
an image. The sensor receives electromagnetic energy radiated or reflected<br />
from the terrain and converts them into signal that is recorded as numerical<br />
data. In a remote sensing satellite, multiple arrays of linear sensors are<br />
used, with each array recording simultaneously a separate band of EM<br />
energy. The array of sensors employs a spectrometer to disperse the<br />
incoming energy into a spectrum. Sensors (or detectors) are positioned to<br />
record specific wavelength bands of energy. The information received by the<br />
sensor is suitably manipulated and transported back to the ground receiving<br />
station. The data are reconstructed on ground into digital images. The digital<br />
image data on magnetic/optical media consist of picture elements arranged<br />
in regular rows and columns. The position of any picture element, pixel, is<br />
determined on a x-y co-ordinate system. Each pixel has a numeric value,<br />
called digital number (DN) that records the intensity of electromagnetic<br />
energy measured for the ground resolution cell represented by that pixel.<br />
The range of digital numbers in an image data is controlled by the<br />
radiometric resolution of the satellite’s sensor system. The digital image<br />
data are further processed to produce master images of the study area. By<br />
analysing the digital data/imagery, digitally/visually, it is possible to detect,<br />
identify and classify various objects and phenomenon on the earth surface.<br />
Remote sensing technique (airborne/satellite) in conjunction with traditional<br />
techniques harbours in an efficient, speedy and cost-effective method for<br />
natural resource management due to its inherited capabilities of being mul-
Job No. 561410027 (WCL) 10<br />
CMPDI<br />
tispectral, repetitive and synoptic areal coverage. Generation of environ-<br />
mental 'Data Base' on land use, soil, forest, surface and subsurface water,<br />
topography and terrain characteristics, settlement and transport network,<br />
etc., and their monitoring in near real - time is very useful for environmental<br />
management planning; this is possible only with remote sensing data.<br />
2.4 Data Source<br />
The following data are used in the present study:<br />
Primary Data<br />
Remote Sensing Satellite data viz. Resourcesat-IRS-P6/LISS-III of<br />
January, February 2011 having 23.5 m. spatial resolution was used in<br />
the present study. The raw digital satellite data was obtained from<br />
NRSC, Hyderabad, on CD-ROM media.<br />
Secondary Data<br />
Secondary (ancillary) and ground data constitute important baseline<br />
information in remote sensing, as they improve the interpretation accuracy<br />
and reliability of remotely sensed data by enabling verification of the<br />
interpreted details and by supplementing it with the information that cannot<br />
be obtained directly from the remotely sensed data. For Pench-Kanhan-<br />
Tawa Valley Coalfield, Survey of <strong>India</strong> topo-sheet no. 55 J/4, 55 J/8, 55<br />
J/11, 55 J/12, 55 J/15, 55 J/16 & 55 N/3 on RF 1:50000 as well as map<br />
showing details of location of area boundary, block boundary and road<br />
supplied by WCL were used in the study.<br />
2.5 Characteristics of Satellite/Sensor<br />
The basic properties of a satellite’s sensor system can be summarised as:
Job No. 561410027 (WCL) 11<br />
CMPDI<br />
(a) Spectral coverage/resolution, i.e., band locations/width; (b) spectral<br />
dimensionality: number of bands; (c) radiometric resolution:<br />
quantisation; (d) spatial resolution/instantaneous field of view or<br />
IFOV; and (e) temporal resolution. Table 2.2 illustrates the basic<br />
properties of Resourcesat satellite/sensor that was used in the<br />
present study.<br />
Table 2.2 Characteristics of the satellite/sensor used in the present project work<br />
Platform Sensor Spectral Bands in µm Radiometric<br />
Resolution<br />
Rsource<br />
sat<br />
(P6)<br />
LISS-III B<br />
2<br />
B<br />
3<br />
B<br />
4<br />
B<br />
5<br />
0.28<br />
0.25<br />
0.27<br />
6.90<br />
-<br />
-<br />
-<br />
0.3<br />
1<br />
0.3<br />
8<br />
0.3<br />
0<br />
NIR: Near Infra-Red MIR: Middle Infra-Red<br />
2.6 Data Processing<br />
Green<br />
Red<br />
NIR<br />
MIR<br />
7-bit<br />
(128-grey levels)<br />
Spatial<br />
Resolution Temporal<br />
Resolution Country<br />
23.5 m<br />
23.5 m<br />
23.5 m<br />
70.5 m<br />
24 days <strong>India</strong><br />
The details of data processing carried out in the present study are shown in<br />
Figure 2.4. The processing methodology involves the following major steps:<br />
(a) Geometric correction, rectification and geo-referencing;<br />
(b) Image enhancement;<br />
(c) Training set selection;<br />
(d) Signature generation and classification;<br />
(e) Creation/overlay of vector database;<br />
(f) Validation of classified image;<br />
(g) Final thematic map preparation.
Basic Data<br />
Job No. 561410027 (WCL) 12<br />
Data Source Secondary Data<br />
CMPDI<br />
IRS – P6 (LISSIII) Topographical Maps<br />
(Scale 1:50,000)<br />
Pre-processing, geometric<br />
correction, rectification<br />
& geo-referencing<br />
Image<br />
Enhancement<br />
Training set<br />
Identification<br />
Signature<br />
Generation<br />
Pre-Field<br />
Classification<br />
Validation through<br />
Ground Verification<br />
Final Land Use/<br />
Cover Map<br />
Fail<br />
Pass<br />
Geo-coded FCC<br />
Generation<br />
Training Set<br />
Refinement<br />
Integration of<br />
Thematic<br />
Information on GIS<br />
Report<br />
Preparation<br />
Fig-2.4 –Methodology of Land Use/Vegetation Cover Analysis<br />
Creation of Vector<br />
Database<br />
(Drainage, Road<br />
Network, Coal
2.6.1 Geometric correction, rectification and geo-referencing<br />
Job No. 561410027 (WCL) 13<br />
CMPDI<br />
Inaccuracies in digital imagery may occur due to ‘systematic errors’<br />
attributed to earth curvature and rotation as well as ‘non-systematic errors’<br />
attributed to intermittent sensor malfunctions, etc. Systematic errors are<br />
corrected at the satellite receiving station itself while non-systematic errors/<br />
random errors are corrected in pre-processing stage.<br />
In spite of ‘System / Bulk correction’ carried out at supplier end; some<br />
residual errors in respect of attitude attributes still remains even after<br />
correction. Therefore, fine tuning is required for correcting the image<br />
geometrically using ground control points (GCP).<br />
Raw digital images contain geometric distortions, which make them<br />
unusable as maps. A map is defined as a flat representation of part of the<br />
earth’s spheroidal surface that should conform to an internationally accepted<br />
type of cartographic projection, so that any measurements made on the map<br />
will be accurate with those made on the ground. Any map has two basic<br />
characteristics: (a) scale and (b) projection. While scale is the ratio between<br />
reduced depiction of geographical features on a map and the geographical<br />
features in the real world, projection is the method of transforming map<br />
information from a sphere (round Earth) to a flat (map) sheet. Therefore, it is<br />
essential to transform the digital image data from a generic co-ordinate<br />
system (i.e. from line and pixel co-ordinates) to a projected co-ordinate<br />
system. In the present study georeferencing was done with the help of<br />
Survey of <strong>India</strong> (SoI) topo-sheets so that information from various sources<br />
can be compared and integrated on a GIS platform, if required.<br />
An understanding of the basics of projection system is required before<br />
selecting any trans/formation model. While maps are flat surfaces, Earth<br />
however is an irregular sphere, slightly flattened at the poles and bulging at
Job No. 561410027 (WCL) 14<br />
CMPDI<br />
the Equator. Map projections are systemic methods for “flattening the<br />
orange peel” in measurable ways. When transferring the Earth and its<br />
irregularities onto the plane surface of a map, the following three factors are<br />
involved: (a) geoid (b) ellipsoid and (c) projection. Figure 2.5 illustrates the<br />
relationship between these three factors. The geoid is the rendition of the<br />
irregular spheroidal shape of the Earth; here the variations in gravity are<br />
taken into account. The observation made on the geoid is then transferred<br />
to a regular geometric reference surface, the ellipsoid. Finally, the<br />
geographical relationships of the ellipsoid (in 3-D form) are transformed into<br />
the 2-D plane of a map by a transformation process called map projection.<br />
As shown in Figure 2.5, the vast majority of projections are based upon<br />
cones, cylinders and planes.<br />
Fig 2.5: Geoid – Ellipsoid – Projection Relationship<br />
In the present study, Polyconic projection along with Everest 1956<br />
Ellipsoidal model was used so as to prepare the map compatible with the<br />
SoI topo-sheets. Polyconic projection is used in SoI topo-sheets as it is best<br />
suited for small - scale mapping and larger area as well as for areas with<br />
North-South orientation (viz. <strong>India</strong>). Maps prepared using these projections
Job No. 561410027 (WCL) 15<br />
CMPDI<br />
are a compromise of many properties; it is neither conformal perspective nor<br />
equal area. Distances, areas and shapes are true only along central<br />
meridian. Distortion increases away from central meridian. Image<br />
transformation from generic co-ordinate system to a projected co-ordinate<br />
system was carried out using IMAGINE v.9.0 digital image processing<br />
system.<br />
2.6.2 Image enhancement<br />
To improve the interpretability of the raw data, image enhancement is<br />
necessary. Most of the digital image enhancement techniques are<br />
categorised as either point or local operations. Point operations modify the<br />
value of each pixel in the image data independently. However, local<br />
operations modify the value of each pixel based on brightness value of<br />
neighbouring pixels. Contrast manipulations/ stretching technique based on<br />
local operation was applied on the image data using IMAGINE s/w. The<br />
enhanced and geocoded FCC image of Pench-Kanhan-Tawa Valley<br />
Coalfield is shown in Plate No. 1.<br />
2.6.3 Training set selection<br />
The image data were analysed based on the interpretation keys. These<br />
keys are evolved from certain fundamental image-elements such as<br />
tone/colour, size, shape, texture, pattern, location, association and shadow.<br />
Based on the image-elements and other geo-technical elements like land<br />
form, drainage pattern and physiography; training sets were<br />
selected/identified for each land use/cover class. Field survey was carried<br />
out by taking selective traverses in order to collect the ground information<br />
(or reference data) so that training sets are selected accurately in the image.<br />
This was intended to serve as an aid for classification. Based on the
Job No. 561410027 (WCL) 16<br />
CMPDI<br />
variability of land use/cover condition and terrain characteristics and<br />
accessibility, 250 points were selected to generate the training sets.<br />
2.6.4 Signature generation and classification<br />
Image classification was carried out using the maximum likelihood<br />
algorithm. The classification proceeds through the following steps: (a)<br />
calculation of statistics [i.e. signature generation] for the identified training<br />
areas, and (b) the decision boundary of maximum probability based on the<br />
mean vector, variance, covariance and correlation matrix of the pixels.<br />
After evaluating the statistical parameters of the training sets, reliability test<br />
of training sets was conducted by measuring the statistical separation<br />
between the classes that resulted from computing divergence matrix. The<br />
overall accuracy of the classification was finally assessed with reference to<br />
ground truth data. The aerial extent of each land use class in the coalfield<br />
was determined using ERDAS IMAGINE v 9.0 s/w. The classified image for<br />
the year 2011 for Pench-Kanhan-Tawa Valley Coalfield is shown in Plate<br />
No.2.<br />
2.6.5 Creation/overlay of vector database<br />
Plan showing coal block boundary is superimposed on the image as vector<br />
layer in the Arc GIS database. Road and drainage network are also digitised<br />
on Arc GIS database and superimposed on the classified image. Geo-<br />
environmental data base created on GIS platform to analyse the impact of<br />
mining on land use and vegetation cover at interval of three years.
2.6.6 Validation of classified image<br />
Job No. 561410027 (WCL) 17<br />
CMPDI<br />
Ground truth survey was carried out for validation of the interpreted results<br />
from the study area. Based on the validation, classification accuracy matrix<br />
was prepared. The classification accuracy matrix is shown in Table 2.3.<br />
Classification accuracy in case of Plantation on OB Dump, Sand Body and<br />
Barren OB Dump was 100%. Classification accuracy in case of Dense<br />
Forest and Water Bodies lie between 90% to 100%. In case of open forest,<br />
built-up land, the classification accuracy varies from 80.0% to 90.0%.<br />
Classification accuracy for scrubs was 73.3% due to poor signature<br />
separability index. The overall classification accuracy is 90%.<br />
2.6.7 Final land use/vegetation cover map preparation<br />
Final land use/vegetation cover map (Plate - 2) was generated on 1:50,000<br />
scale & printed in 1:90,000 scale for handling convenience using HP Design<br />
jet 4500 Colour plotter and the same is enclosed in the report. A soft copy in<br />
.pdf format is also attached. .
Sl.<br />
No.<br />
Table 2.3: Classification Accuracy Matrix for Pench-Kanhan-Tawa Valley Coalfield<br />
Classes<br />
in the<br />
Satellite Data<br />
Class<br />
Total<br />
Obsrv.<br />
Points<br />
1 Urban Settlement C1 05 5<br />
Job No. 561410027 (WCL) 18<br />
C1<br />
C2<br />
Land use classes as observed in the field<br />
2 Dense Forest C2 10 8 1 1<br />
3 Open Forest C3 10 1 8 1<br />
4 Scrubs C4 10 1 1 7 1<br />
5 Social Forestry C5 10 1 8 1<br />
6 Agriculture Land C6 10 1 9<br />
7 Waste Upland C7 10 10<br />
8 Sand Body C8 10 10<br />
9 Quarry Area C9 10 10<br />
10 Water Bodies C10 10 10<br />
Total no. of observation points 110 05 10 10 10 10 10 10 10 10 10<br />
% of commission 00.0 20.0 20.0 30.0 20.0 10.0 0.0 0.0 0.0 0.0<br />
% of omission 00.0 20.0 20.0 30.0 20.0 10.0 0.0 0.0 0.0 0.0<br />
% of Classification Accuracy 100.0 80.0 80.0 70.0 80.0 90.0 100.0 100.0 100.0 100.0<br />
Overall Accuracy (%) 90.000<br />
C3<br />
C4<br />
C5<br />
C6<br />
C7<br />
C8<br />
C9<br />
C10<br />
CMPDI
Chapter 3<br />
Land Use/ Cover Mapping<br />
3.1 Introduction<br />
Job No. 561410027 (WCL) 19<br />
CMPDI<br />
Land is one of the most important natural resource on which all human<br />
activities are based. Therefore, knowledge on different type of lands as well<br />
as its spatial distribution in the form of map and statistical data is vital for its<br />
geospatial planning and management for optimal use of the land resources.<br />
In mining industry, the need for information on land use/ vegetation cover<br />
pattern has gained importance due to the all-round concern on<br />
environmental impact of mining. The information on land use/ cover<br />
inventory that includes type, spatial distribution, aerial extent, location, rate<br />
and pattern of change of each category is of paramount importance for<br />
assessing the impact of coal mining on land use/ vegetation cover.<br />
Remote sensing data with its various spectral and spatial resolution offers<br />
comprehensive and accurate information for mapping and monitoring of land<br />
use/cover pattern, dynamics of changing pattern and trends over a period of<br />
time. By analysing the data of different cut-off dates, impact of coal mining<br />
on land use and vegetation cover can be determined.<br />
3.2 Land Use/Cover Classification<br />
The array of information available on land use/cover requires be arranging<br />
or grouping under a suitable framework in order to facilitate the creation of a<br />
land use/cover database. Further, to accommodate the changing land<br />
use/cover pattern, it becomes essential to develop a standardised<br />
classification system that is not only flexible in nomenclature and definition,
Job No. 561410027 (WCL) 20<br />
CMPDI<br />
but also capable of incorporating information obtained from the satellite data<br />
and other different sources.<br />
The present framework of land use/cover classification has been primarily<br />
based on the ‘Manual of Nationwide Land Use/ Land Cover Mapping<br />
Using Satellite Imagery’ developed by National Remote Sensing Agency,<br />
Hyderabad. Land use map was prepared on the basis of image<br />
interpretation carried out based on the satellite data for the year 2011 for<br />
Pench-Kanhan-Tawa Valley coalfield and following land use/cover classes<br />
are identified (Table 3).<br />
Table 3.1:<br />
Land use/cover classes identified in Pench-Kanha-Tawa Valley Coalfield<br />
Level -I Level -II<br />
1. Built-Up Land<br />
2.<br />
Forest/Vegetation Cover<br />
3. Mining Area<br />
4. Agricultural land<br />
5. Waste Land<br />
1.1 Urban<br />
1.2 Rural<br />
1.3 Industrial<br />
2.1 Dense Forest<br />
2.2 Open Forest<br />
2.3 Scrub<br />
2.4 Plantation under Social Forestry<br />
2.5 Plantation on OB Dumps<br />
3.1 Coal Quarry<br />
3.2 Barren OB Dump<br />
3.3 Barren Backfill<br />
3.4 Coal Dump<br />
3.5 Advanced Quarry<br />
3.6 Water filled Quarry<br />
4.1 Crop Land<br />
4.2 Fallow Land<br />
5.1 Waste upland with/without scrubs<br />
5.2 Fly Ash Pond<br />
5.3 Sand Body<br />
6. Water bodies 6.1 River/Streams /Reservoir/Ponds
Following maps are prepared on 1:50,000 scale:<br />
Job No. 561410027 (WCL) 21<br />
CMPDI<br />
3. Plate No. 1: Drawing No. HQ/REM/ 001: FCC (IRS – P6 LISS-III data of<br />
Pench-Kanhan-Tawa Valley coalfield of the year 2011) with Coalfield<br />
boundary and other infrastructural details.<br />
4. Plate No. 2: Drawing No. HQ/REM/ 002 - Land use/Cover Map of Pench-<br />
Kanhan-Tawa Valley Coalfield based on IRS-P6 LISS-III data..<br />
3.3 Land use/cover Analysis<br />
Satellite data of the year 2011 was processed using ERDAS IMAGINE 9.0<br />
image processing s/w in order to interpret the various land use/cover classes<br />
present in the study area of Pench-Kanhan-Tawa Valley Coalfield covering<br />
907.90 sq. kms. Blockwise area of each land use/cover class for Pench-<br />
Kanhan-Tawa Valley coalfield was calculated using Arc-Info GIS & ERDAS<br />
IMAGINE 9.0 s/w and tabulated in Table 3.2. Distribution of various land use<br />
classes are shown in the Pie Charts (Fig. 2.6). Pench-Kanhan-Tawa Valley<br />
coalfield contains 91 coal blocks (identified till) whose land use/cover<br />
classes are tabulated in Table 3.3. Blockwise land use/vegetation cover<br />
database are generated on GIS platform for further temporal analysis.<br />
3.3.1 Settlement/ Built-up land<br />
All the man-made constructions covering the land surface are included<br />
under this category. Built-up land has been divided in to rural, urban and<br />
industrial classes based on availability of infrastructure facilities. Total area<br />
of settlements in Pench-Kanhan-Tawa valley CF covers 23.24 km 2 (2.56%)<br />
out of which urban settlement covers 15.25 km 2 , rural settlement covers<br />
5.53 km 2 and industrial settlement covers 2.46 km 2 area (Refer Table 3.2).
3.3.2 Vegetation cover<br />
Job No. 561410027 (WCL) 22<br />
CMPDI<br />
Vegetation cover is an association of trees and other vegetation type<br />
capable of producing timber and other forest produce. It is also defined as<br />
the percentage of soil which is covered by green vegetation. Leaf area index<br />
(LAI) is an alternative expression of the term vegetation cover which gives<br />
the area of leaves in m 2 corresponding to an area of one m 2 of ground.<br />
Primarily vegetation cover is classified into the following three sub-classes<br />
based on crown density as per modified FAO-1963 (Food & Agricultural<br />
Organisation of United Nations) norms: (a) dense forest (crown density more<br />
than 40%), (b) open/degraded forest (crown density between 10% to 40%),<br />
and (c) scrubs (crown density less than 10%). The plantation that has been<br />
carried out on wasteland along the roadside and on the overburden dumps<br />
is also included under vegetation cover as social forestry and plantation on<br />
backfilled/over-burden dumps respectively. The percentage of vegetation<br />
cover shown in the analysis here are in terms of total land use cover only.<br />
Details of area statistics of the vegetation cover in Pench-Kanhan-Tawa<br />
Valley Coalfield area is given in Table 3.2.<br />
Analysis of data reveals that total vegetation cover in Pench-Kanhan-Tawa<br />
Valley Coalfield occupies an area of 442.37 km 2 (48.72%). Out of which<br />
forest occupies 245.11 km 2 (27.00%) [Dense forest occupies 159.87 km 2<br />
(17.61%), open forest cover occupies 85.24 km 2 (9.39%)]. scrub covers<br />
187.05 km 2 (20.60%), social forestry 8.31 km 2 (0.92%) and plantation on OB<br />
covers 1.89 km 2 (0.21%) of the area.<br />
3.3.3 Mining<br />
The mining area includes the area of existing quarry, over burden, backfill,<br />
coal dump, advanced quarry and water filled quarry area,
Job No. 561410027 (WCL) 23<br />
CMPDI<br />
Total mining area covers 6.84 km 2 (0.75%) out of which quarry covers 0.16<br />
km 2 (0.02%), barren OB dump covers 4.52 km 2 (0.50%), backfill covers 0.41<br />
km 2 (0.05%), coal dump covers 0.19 km 2 (0.02%), advanced quarry covers<br />
0.18 km 2 (0.02%), and water filled quarry covers 1.38 km 2 (0.15%).<br />
3.3.4 Agriculture<br />
Land primarily used for farming and production of food, fibre and other<br />
commercial and horticultural crops falls under this category. It includes crop<br />
land and fallow land. Crop lands are those agricultural lands where standing<br />
crop occurs on the date of satellite imagery or land is used for agricultural<br />
purposes during any season of the year. Crops may be either kharif or rabi.<br />
Fallow lands are also agricultural land which is taken up for cultivation but<br />
temporarily allowed to rest, un-cropped for one or more season.<br />
Analysis of data reveals that agriculture land in Pench-Kanhan-Tawa Valley<br />
Coalfield area occupies an area of 331.27 km 2 (36.49%). Out of which crop<br />
land is 151.07 km 2 (16.64%) and fallow land covers an area of 180.21 km 2<br />
(19.85%).<br />
3.3.5 Wasteland<br />
Wasteland is a degraded and under-utilised class of land that has<br />
deteriorated on account of natural causes or due to lack of appropriate water<br />
and soil management. Wasteland can result from inherent/imposed<br />
constraints such as location, environment, chemical and physical properties<br />
of the soil or financial or other management constraints (NWDB, 1987). This<br />
also includes fly ash pond and sand body formed on the banks of the river<br />
owing to the non flow of water there.
Job No. 561410027 (WCL) 24<br />
CMPDI<br />
Analysis of data reveals that in Pench-Kanhan-Tawa Valley <strong>Coalfields</strong>,<br />
wasteland covers an area of 89.85 km 2 (9.90%). out of which waste up land<br />
is 82.52 km 2 (9.09%), fly ash pond is 2.68 km 2 (0.30%) and sand body is<br />
4.65 km 2 (0.51%).<br />
3.3.6 Surface Water bodies<br />
Analysis of data reveals that surface water bodies in Pench-Kanhan-Tawa<br />
Valley <strong>coalfields</strong> covers an area of 14.32 km 2 (1.58%),
Job No. 561410027 (WCL) 25<br />
CMPDI<br />
Table 3.2<br />
Land use/ cover pattern in the Pench-Kanhan-Tawa Valley Coalfield<br />
in the year 2011<br />
Sl. No.<br />
Land Use / Cover Classes<br />
Level - I Level - II Km 2<br />
%<br />
Urban 15.25 1.68<br />
1 Settlement<br />
Rural<br />
Industrial<br />
5.53<br />
2.46<br />
0.61<br />
0.27<br />
Total Settlement 23.24 2.56<br />
Dense Forest 159.87 17.61<br />
Open Forest 85.24 9.39<br />
Total Forest 245.11 27.00<br />
2<br />
Vegetation<br />
Cover<br />
Scrubs<br />
Social forestry<br />
187.05<br />
8.31<br />
20.60<br />
0.92<br />
Plantation on OB 1.89 0.21<br />
Total Plantation 10.20 1.12<br />
Total Vegetation 442.37 48.72<br />
Coal Quarry 0.16 0.02<br />
Barren OB Dump 4.52 0.50<br />
Barren Backfill 0.41 0.05<br />
3 Mining Area Coal Dump 0.19 0.02<br />
Advanced Quarry 0.18 0.02<br />
Water filled Quarry 1.38 0.15<br />
Total Mining area 6.84 0.75<br />
4<br />
Agricultural<br />
Land<br />
Crop Land<br />
Fallow Land<br />
Total Agriculture<br />
151.07<br />
180.21<br />
331.27<br />
16.64<br />
19.85<br />
36.49<br />
Waste land with / without<br />
Scrubs<br />
82.52 9.09<br />
5 Waste Land Fly Ash Pond 2.68 0.30<br />
Sand Body 4.65 0.51<br />
Total Waste Land 89.85 9.90<br />
6 Water Body River, nallah, pond etc. 14.32 1.58<br />
TOTAL 907.90 100.00<br />
(Based on IRS-P6-LISS-III Data)<br />
Jan-Feb 2011<br />
IRS – P6 / LISS – III Data
Table 3.3 Block wise Area Statistics of Pench-Kanhan-Tawa Valley <strong>coalfields</strong> (2011)<br />
Job No. 561410027 (WCL) 26<br />
CMPDI<br />
Object Block Name Urban Rural Industrial Dense Forest Open Forest Scrubs Plantation Social Crop land Fallow Land Waste Land Fly Ash Pond Sand Body Coal Quarry Barren Barren Coal Dump Advanced Water Filled River/ Pond<br />
ID Settlement Settlement Settlement on OB Dump Forestry OB Dump Backfill Quarry Quarry<br />
1 BANSI 0.000 0.000 0.000 1.139 0.281 0.038 0.000 0.000 0.479 0.120 0.021 0.000 0.000 0.000 0.000 0.000 0.000 0.000 0.000 0.000<br />
2 BARKHUHI 0.396 0.000 0.000 0.000 0.000 0.446 0.019 0.384 1.793 0.639 0.467 0.000 0.000 0.000 0.052 0.000 0.000 0.000 0.059 0.005<br />
3 BHAKRA 0.000 0.000 0.000 0.000 0.021 0.630 0.000 0.000 0.313 0.508 0.063 0.000 0.000 0.000 0.000 0.000 0.000 0.000 0.000 0.051<br />
4 BHAMORI 0.146 0.052 0.000 0.010 0.000 0.441 0.000 0.529 3.856 0.653 0.139 0.000 0.444 0.000 0.000 0.000 0.000 0.000 0.000 0.176<br />
5 BRAHMPURI 0.000 0.012 0.006 0.503 0.387 1.226 0.041 0.000 0.485 1.127 0.688 0.000 0.000 0.000 0.000 0.000 0.000 0.000 0.092 0.000<br />
6 CHANDMETA 0.162 0.034 0.000 0.000 0.000 0.517 0.000 0.030 0.686 0.771 0.766 0.000 0.000 0.000 0.000 0.000 0.000 0.000 0.000 0.000<br />
7 CHARATPUR 0.000 0.000 0.056 0.073 0.045 1.943 0.000 0.000 0.130 0.108 0.551 0.000 0.000 0.000 0.000 0.000 0.000 0.000 0.000 0.000<br />
8 CHARATPUR‐I 0.000 0.205 0.010 0.000 0.000 0.848 0.000 0.103 0.359 1.935 0.871 0.000 0.000 0.000 0.000 0.000 0.000 0.000 0.000 0.002<br />
9 CHARATPUR‐II 0.000 0.000 0.063 0.000 0.000 1.385 0.000 0.000 0.008 0.000 0.134 0.000 0.000 0.000 0.000 0.000 0.000 0.000 0.000 0.000<br />
10 CHINDA 0.117 0.000 0.000 0.017 0.068 0.055 0.071 0.000 0.176 0.227 0.044 0.000 0.000 0.000 0.028 0.000 0.000 0.000 0.079 0.000<br />
11 DAMUA 0.566 0.032 0.000 0.005 0.073 0.590 0.000 0.217 0.082 0.088 0.939 0.000 0.001 0.000 0.271 0.000 0.000 0.000 0.006 0.032<br />
12 DAMUA EAST 0.002 0.000 0.002 0.225 0.351 0.649 0.000 0.011 0.030 0.204 0.483 0.000 0.013 0.000 0.000 0.000 0.000 0.000 0.000 0.025<br />
13 DAMUA GORAWARO 0.116 0.044 0.043 0.236 1.163 3.123 0.077 0.263 0.444 1.054 1.208 0.000 0.000 0.014 0.632 0.000 0.003 0.000 0.074 0.021<br />
14 DATLA EAST 1.092 0.051 0.000 0.000 0.000 1.910 0.071 0.404 1.572 1.699 1.997 0.000 0.000 0.041 0.551 0.210 0.010 0.087 0.153 0.000<br />
15 DATLA WEST 0.000 0.017 0.000 0.165 1.173 1.464 0.000 0.036 1.673 0.552 0.261 0.000 0.000 0.000 0.000 0.009 0.000 0.028 0.000 0.005<br />
16 DHANKASA 0.000 0.014 0.000 0.449 1.301 1.226 0.000 0.000 0.426 1.049 0.442 0.000 0.003 0.000 0.000 0.000 0.000 0.000 0.000 0.041<br />
17 DHANKASA EXTN 0.000 0.000 0.000 0.000 0.149 0.339 0.000 0.000 0.109 0.536 0.108 0.000 0.007 0.000 0.000 0.000 0.000 0.000 0.000 0.013<br />
18 DHANWA 0.000 0.000 0.000 22.019 2.048 0.635 0.000 0.000 0.000 0.000 0.373 0.000 0.060 0.000 0.000 0.000 0.000 0.000 0.000 0.366<br />
19 DHAU EXTN 0.000 0.000 0.000 4.968 0.586 0.422 0.000 0.000 1.540 0.366 0.251 0.000 0.002 0.000 0.000 0.000 0.000 0.000 0.000 0.090<br />
20 DHAU NORTH 0.000 0.000 0.000 4.024 1.102 1.498 0.000 0.000 0.663 0.255 0.446 0.000 0.012 0.000 0.000 0.000 0.000 0.000 0.000 0.081<br />
21 EDC UG 0.172 0.042 0.000 0.000 0.062 1.672 0.000 0.048 0.632 0.273 1.034 0.000 0.000 0.000 0.001 0.000 0.000 0.000 0.000 0.000<br />
22 EKLEHARA 0.264 0.150 0.000 0.000 0.000 0.130 0.015 0.367 6.399 1.407 0.542 0.000 0.045 0.000 0.055 0.098 0.000 0.000 0.000 0.036<br />
23 GANDHIGRAM 0.000 0.081 0.000 3.936 0.736 3.496 0.000 0.050 0.126 1.492 0.269 0.000 0.000 0.000 0.000 0.000 0.000 0.000 0.000 0.143<br />
24 GANPATI INCLINE 0.000 0.000 0.000 0.000 0.104 2.177 0.000 0.000 0.097 0.039 0.363 0.000 0.000 0.000 0.000 0.000 0.000 0.000 0.000 0.003<br />
25 GORADEVI 0.000 0.225 0.000 5.446 3.518 8.699 0.000 0.055 9.733 7.661 7.489 0.000 0.056 0.000 0.000 0.000 0.000 0.000 0.000 0.617<br />
26 HARANBHATTA 0.000 0.018 0.000 0.000 0.000 0.728 0.054 0.000 0.448 0.710 0.139 0.000 0.000 0.000 0.344 0.000 0.000 0.000 0.026 0.028<br />
27 HATHIAGARH 0.000 0.000 0.000 0.010 0.190 1.491 0.000 0.000 1.363 0.339 0.487 0.000 0.048 0.000 0.000 0.000 0.000 0.000 0.000 0.028<br />
28 JAMUNIA 0.000 0.031 0.000 0.000 0.153 1.069 0.000 0.000 0.835 1.720 0.786 0.000 0.022 0.000 0.000 0.000 0.000 0.000 0.000 0.050<br />
29 JHARNA 0.000 0.000 0.000 0.493 0.522 1.116 0.000 0.000 0.070 0.050 0.480 0.000 0.000 0.000 0.000 0.000 0.000 0.000 0.000 0.000<br />
30 JHUREE 0.124 0.000 0.000 0.712 1.068 0.761 0.000 0.000 0.236 1.622 0.053 0.000 0.000 0.000 0.000 0.000 0.000 0.000 0.000 0.065
Table 3.3 Block wise Area Statistics of Pench-Kanhan-Tawa Valley <strong>coalfields</strong> (2011)<br />
Job No. 561410027 (WCL) 27<br />
CMPDI<br />
Object Block Name Urban Rural Industrial Dense Forest Open Forest Scrubs Plantation Social Crop land Fallow Land Waste Land Fly Ash Pond Sand Body Coal Quarry Barren Barren Coal Dump Advanced Water Filled River/ Pond<br />
ID Settlement Settlement Settlement on OB Dump Forestry OB Dump Backfill Quarry Quarry<br />
31 KALIO 0.088 0.054 0.045 0.001 0.028 0.135 0.000 0.194 0.000 0.003 0.213 0.000 0.014 0.000 0.000 0.000 0.000 0.000 0.000 0.017<br />
32 KHIRSADOH 0.204 0.007 0.000 0.000 0.000 0.771 0.000 0.005 0.642 0.537 0.540 0.000 0.000 0.000 0.093 0.000 0.000 0.000 0.012 0.001<br />
33 KHIRSADOH SOUTH 0.204 0.007 0.000 0.000 0.000 0.771 0.000 0.005 0.642 0.537 0.540 0.000 0.000 0.000 0.093 0.000 0.000 0.000 0.012 0.001<br />
34 KHIRSADOH EXTN. 0.019 0.021 0.055 0.000 0.228 3.507 0.000 0.000 0.298 0.962 3.209 0.000 0.000 0.000 0.000 0.000 0.000 0.000 0.000 0.000<br />
35 KOYALWARI 0.000 0.000 0.000 2.462 0.461 0.230 0.000 0.000 1.365 0.339 0.112 0.000 0.000 0.000 0.000 0.000 0.000 0.000 0.000 0.000<br />
36 MAHADEOPURI UG 0.158 0.000 0.010 0.000 0.262 1.178 0.000 0.000 0.028 0.073 0.090 0.000 0.000 0.000 0.000 0.000 0.000 0.000 0.000 0.001<br />
37 MANDLA NORTH 0.000 0.017 0.000 2.186 5.050 1.090 0.005 0.000 0.317 1.702 0.326 0.000 0.000 0.000 0.000 0.000 0.000 0.000 0.000 0.001<br />
38 MANDLA SOUTH 0.000 0.000 0.000 0.511 1.000 0.899 0.000 0.000 0.660 1.768 0.329 0.000 0.000 0.000 0.000 0.000 0.000 0.000 0.000 0.006<br />
39 MATHANI UG 0.000 0.000 0.000 0.000 0.137 0.341 0.000 0.000 0.168 0.339 0.046 0.000 0.000 0.000 0.000 0.000 0.000 0.000 0.000 0.000<br />
40 MOHAN 0.005 0.000 0.000 0.000 0.000 0.668 0.043 0.001 0.261 0.615 0.229 0.000 0.000 0.000 0.411 0.000 0.000 0.025 0.057 0.009<br />
41 MOHAN UG 0.000 0.000 0.000 0.177 0.522 1.758 0.054 0.000 0.033 0.101 1.028 0.000 0.000 0.000 0.187 0.000 0.000 0.000 0.000 0.000<br />
42 MOHAN EXTN. 0.000 0.047 0.000 0.000 0.000 0.442 0.000 0.000 0.191 0.487 1.382 0.000 0.000 0.000 0.015 0.001 0.000 0.000 0.000 0.000<br />
43 MAGRAHI 0.000 0.000 0.000 0.081 0.184 0.437 0.000 0.000 0.229 0.565 0.154 0.000 0.000 0.000 0.000 0.000 0.000 0.000 0.000 0.000<br />
44 NEHERIYA 0.000 0.033 0.000 0.154 0.370 1.458 0.000 0.000 0.817 1.791 0.346 0.000 0.122 0.000 0.000 0.000 0.000 0.000 0.000 0.188<br />
45 NANDAN‐I 0.012 0.055 0.026 0.275 0.569 1.287 0.000 0.065 0.364 0.566 0.748 0.000 0.029 0.000 0.000 0.000 0.000 0.000 0.000 0.107<br />
46 NANDAN‐II 0.000 0.000 0.000 1.183 0.520 0.656 0.000 0.000 0.090 0.130 0.256 0.000 0.000 0.000 0.000 0.000 0.000 0.000 0.000 0.032<br />
47 NEW CHIKALMAU 0.017 0.090 0.000 0.000 0.000 0.112 0.000 0.089 2.447 1.057 0.067 0.000 0.000 0.000 0.000 0.000 0.000 0.000 0.000 0.000<br />
48 NEWTON CHIKLI NO 0.000 0.363 0.000 0.728 1.537 3.346 0.000 0.103 14.561 4.722 2.163 0.000 0.400 0.000 0.000 0.000 0.000 0.000 0.000 0.472<br />
49 NORTH NANDORA 0.327 0.018 0.035 0.090 0.240 0.915 0.000 0.164 0.095 0.081 0.437 0.000 0.002 0.000 0.000 0.000 0.000 0.000 0.000 0.000<br />
50 PARASIA 0.495 0.076 0.000 0.000 0.063 1.333 0.000 0.124 0.529 0.478 0.234 0.000 0.000 0.000 0.000 0.000 0.104 0.000 0.000 0.000<br />
51 PATHERKHERA I & II 0.888 0.000 0.021 3.734 1.213 1.068 0.000 0.134 0.001 0.000 0.114 0.000 0.000 0.000 0.000 0.000 0.000 0.000 0.000 0.365<br />
52 RAKHINALA 0.000 0.000 0.000 6.599 1.071 0.199 0.000 0.000 0.766 0.406 0.182 0.000 0.000 0.000 0.000 0.000 0.000 0.000 0.000 0.073<br />
53 RAWANWARA UG 0.374 0.040 0.000 0.000 0.005 0.590 0.098 0.089 0.973 0.414 0.613 0.000 0.000 0.020 0.088 0.000 0.000 0.000 0.050 0.002<br />
54 RAWANWARA EAST 0.000 0.000 0.000 0.000 0.000 1.403 0.010 0.000 1.309 0.831 0.604 0.000 0.005 0.000 0.038 0.000 0.000 0.000 0.000 0.008<br />
55 RAWANWARA NORT 0.000 0.025 0.000 0.259 0.677 0.892 0.000 0.000 6.478 2.355 1.061 0.000 0.592 0.000 0.000 0.000 0.000 0.000 0.000 0.605<br />
56 RAWANWARA KHAS 0.438 0.026 0.023 0.198 0.583 1.595 0.164 0.083 0.523 0.450 0.952 0.000 0.000 0.016 0.384 0.059 0.008 0.000 0.043 0.000<br />
57 SOUTH AMBARA 0.184 0.111 0.000 0.000 0.000 0.361 0.009 0.132 5.208 3.442 1.014 0.000 0.000 0.000 0.370 0.000 0.033 0.051 0.122 0.006<br />
58 SARNI 0.418 0.000 0.131 0.001 0.217 2.091 0.000 0.000 0.001 0.200 0.051 1.207 0.000 0.000 0.000 0.000 0.000 0.000 0.000 0.000<br />
59 SARNI EXTN. 0.372 0.000 0.759 0.001 0.096 1.074 0.000 0.013 0.001 0.006 0.047 0.000 0.000 0.000 0.000 0.000 0.000 0.000 0.000 0.043<br />
60 SATPURA‐I 0.397 0.000 0.023 0.394 0.293 1.289 0.000 0.074 0.000 0.000 0.103 0.000 0.000 0.000 0.000 0.000 0.000 0.000 0.000 0.000<br />
61 SATPURA‐II 0.743 0.000 0.025 0.594 0.597 1.394 0.000 0.021 0.065 0.030 0.352 0.000 0.000 0.000 0.000 0.000 0.000 0.000 0.000 0.000
Table 3.3 Block wise Area Statistics of Pench-Kanhan-Tawa Valley <strong>coalfields</strong> (2011)<br />
Job No. 561410027 (WCL) 28<br />
CMPDI<br />
Object Block Name Urban Rural Industrial Dense Forest Open Forest Scrubs Plantation Social Crop land Fallow Land Waste Land Fly Ash Pond Sand Body Coal Quarry Barren Barren Coal Dump Advanced Water Filled River/ Pond<br />
ID Settlement Settlement Settlement on OB Dump Forestry OB Dump Backfill Quarry Quarry<br />
62 SETHIA 0.018 0.000 0.000 0.000 0.003 0.008 0.295 0.000 0.011 0.144 0.020 0.000 0.022 0.000 0.026 0.000 0.007 0.000 0.228 0.036<br />
63 SAKTIGARH 0.000 0.188 0.000 0.000 0.003 3.085 0.000 0.369 1.720 6.645 0.334 0.000 0.262 0.000 0.000 0.000 0.000 0.000 0.000 0.465<br />
64 SHARDA 0.000 0.032 0.000 0.000 0.000 0.035 0.000 0.010 0.764 0.268 0.190 0.000 0.000 0.000 0.000 0.000 0.000 0.000 0.000 0.004<br />
65 SHIVPURI OCP 0.000 0.000 0.032 0.000 0.035 0.135 0.182 0.000 0.000 0.511 0.139 0.000 0.000 0.010 0.069 0.000 0.000 0.000 0.069 0.000<br />
66 SHIVPURI UG 0.024 0.183 0.005 0.000 0.060 0.015 0.396 0.000 0.381 0.545 0.153 0.000 0.000 0.000 0.242 0.000 0.009 0.000 0.031 0.000<br />
67 SOBHAPUR 0.000 0.000 0.000 0.922 0.747 1.589 0.000 0.000 0.043 0.984 0.028 0.000 0.020 0.000 0.000 0.000 0.000 0.000 0.000 0.031<br />
68 SOBHAPUR EXTN. 0.000 0.157 0.000 0.051 0.154 2.618 0.000 0.027 0.816 4.591 1.249 0.000 0.217 0.000 0.000 0.000 0.000 0.000 0.000 0.253<br />
69 SOBHAPUR‐I 0.041 0.000 0.000 0.001 0.100 1.754 0.000 0.052 0.274 0.195 0.196 0.000 0.000 0.000 0.000 0.000 0.000 0.000 0.000 0.020<br />
70 SONPUR 0.000 0.012 0.000 0.354 0.344 0.843 0.000 0.000 0.388 1.054 0.237 0.000 0.000 0.000 0.000 0.000 0.000 0.000 0.000 0.000<br />
71 SUKRI 0.344 0.048 0.000 0.000 0.000 0.334 0.000 0.029 2.287 1.793 0.892 0.000 0.000 0.000 0.000 0.000 0.000 0.000 0.000 0.005<br />
72 TAMBIA 0.000 0.000 0.000 7.452 0.526 0.117 0.000 0.000 0.074 0.046 0.067 0.000 0.067 0.000 0.000 0.000 0.000 0.000 0.000 0.134<br />
73 TATARWARA 0.000 0.025 0.000 0.000 0.000 0.058 0.000 0.027 1.560 1.013 0.419 0.000 0.000 0.000 0.000 0.000 0.000 0.000 0.000 0.000<br />
74 TANDSI 0.000 0.000 0.000 8.420 0.697 0.104 0.000 0.000 0.163 0.030 0.065 0.000 0.011 0.000 0.000 0.000 0.000 0.000 0.000 0.009<br />
75 TANDSI NORTH 0.000 0.000 0.000 3.487 0.450 0.212 0.000 0.000 0.250 0.251 0.119 0.000 0.022 0.000 0.000 0.000 0.000 0.000 0.000 0.048<br />
76 TANDSI SOUTH 0.000 0.000 0.069 4.514 0.544 0.319 0.000 0.000 0.099 0.528 0.079 0.000 0.018 0.000 0.000 0.000 0.000 0.000 0.000 0.038<br />
77 TANDSI‐III 0.000 0.000 0.000 1.890 0.205 0.013 0.000 0.000 0.000 0.000 0.009 0.000 0.000 0.000 0.000 0.000 0.000 0.000 0.000 0.000<br />
78 TAWA‐I 0.000 0.000 0.000 2.559 2.086 1.579 0.000 0.000 0.021 0.220 0.109 0.000 0.282 0.000 0.000 0.000 0.000 0.000 0.000 0.567<br />
79 TAWA‐II 0.000 0.000 0.000 2.261 0.381 1.579 0.000 0.000 0.256 0.463 0.362 0.000 0.000 0.000 0.000 0.000 0.000 0.000 0.000 0.047<br />
80 TAWA 0.000 0.103 0.000 0.000 0.000 1.830 0.000 0.065 1.313 3.013 0.264 0.000 0.000 0.000 0.000 0.000 0.000 0.000 0.000 0.139<br />
81 THESGORA‐A 0.099 0.000 0.000 0.000 0.157 0.740 0.000 0.000 0.291 1.647 0.138 0.000 0.000 0.000 0.000 0.000 0.000 0.000 0.000 0.035<br />
82 THESGORA‐B 0.000 0.009 0.000 0.113 0.442 1.528 0.000 0.000 0.938 1.662 0.229 0.000 0.000 0.000 0.000 0.000 0.000 0.000 0.000 0.001<br />
83 THESGORA‐C 0.000 0.054 0.000 0.019 0.554 1.784 0.000 0.000 1.213 3.518 0.189 0.000 0.000 0.000 0.000 0.000 0.000 0.000 0.000 0.000<br />
84 UMRI 0.000 0.000 0.000 0.233 0.272 0.812 0.000 0.000 0.297 1.011 0.799 0.000 0.055 0.000 0.000 0.000 0.000 0.000 0.000 0.024<br />
85 URDHAN 0.000 0.020 0.000 0.000 0.069 0.733 0.000 0.000 0.339 0.930 0.052 0.000 0.000 0.000 0.000 0.000 0.000 0.000 0.000 0.000<br />
86 VISHNUPURI 0.000 0.008 0.025 0.000 0.144 0.801 0.013 0.000 0.218 0.949 0.112 0.000 0.000 0.000 0.003 0.000 0.000 0.000 0.000 0.002<br />
87 VISHNUPURI‐I 0.003 0.039 0.110 0.000 0.063 0.359 0.038 0.000 0.492 1.318 0.252 0.000 0.000 0.014 0.074 0.000 0.000 0.000 0.090 0.000<br />
88 UNNAMED 0.003 0.000 0.000 0.000 0.000 0.020 0.000 0.000 0.497 0.654 0.480 0.000 0.000 0.000 0.000 0.000 0.000 0.000 0.000 0.000<br />
89 UNNAMED 0.098 0.020 0.000 0.000 0.000 1.056 0.000 0.006 0.033 0.098 0.536 0.000 0.000 0.000 0.000 0.000 0.006 0.000 0.000 0.000<br />
90 UNNAMED 0.000 0.032 0.000 0.388 0.857 0.940 0.000 0.000 0.119 0.665 0.385 0.000 0.010 0.000 0.000 0.000 0.000 0.000 0.000 0.028<br />
91 UNNAMED 0.000 0.000 0.000 0.526 0.540 0.558 0.000 0.000 0.563 0.139 0.242 0.000 0.000 0.000 0.000 0.000 0.000 0.000 0.000 0.000
366.49<br />
Job No. 5561410027<br />
(WWCL)<br />
Landuuse/Vegettation<br />
covver<br />
in Pen nch-Kanhhan-Tawaa<br />
Valley CF C<br />
9.990<br />
0.75<br />
1.58 2. .56<br />
(values in n %)<br />
Fig. 2.6<br />
29 2<br />
48.72<br />
SETTLEMENT<br />
CMPDI C<br />
VEGETATIO ON COVER<br />
MINING AR REA<br />
AGRICULTU URAL LAND<br />
WASTE LAN ND<br />
WATER BO ODY
Job No. 561410027 (WCL) 30<br />
CMPDI
Job No. 561410027 (WCL) 31<br />
CMPDI
Chapter 4<br />
Conclusion & Recommendation<br />
4.1 Conclusion<br />
Job No. 561410027 (WCL) 32<br />
CMPDI<br />
In the present study, land use/ vegetation cover mapping has been carried out,<br />
based on IRS-P6/ LISS III satellite data of 2011 in order to generate the geo-<br />
environmental database on land use/vegetation cover in Pench-Kanhan-Tawa Val-<br />
ley Coalfield for monitoring the impact of coal mining on land environment. Change<br />
analysis in land use pattern may helps in formulating the mitigation measures re-<br />
quired, if any.<br />
Study reveals that the settlements in the Pench-Kanhan-Tawa Valley <strong>Coalfields</strong> are<br />
a mix of urban, rural and industrial which covers an area of 23.24 km 2 (2.56%).<br />
Forest cover occupies 245.11 km 2 (27.00%) and total vegetation cover including<br />
dense forests, open forests & scrubs occupies an area of 442.37 km 2 (48.72%).<br />
The study further indicates that total agricultural land which includes crop and fallow<br />
land covers an area of 331.27 km 2 (36.49%). Waste land covered an area of 89.85<br />
km 2 (1.58%). Surface water bodies, mainly rivers, reservoir and ponds covered an<br />
area of 14.32 km 2 (1.58%).<br />
4.2 Recommendation<br />
Keeping in view the sustainable development together with proposed coal mining in<br />
the area, it is recommended that similar study should be carried out regularly at<br />
interval of three years to monitor the land use and vegetation cover status and<br />
impact of coal mining on land environment. In the eastern, south eastern and<br />
western side of Pench-Kanhan-Tawa Valley <strong>Coalfields</strong>, some parts of the forest<br />
area have become fallow/ barren land due to deforestation or other biotic<br />
interferences. This can be restored back by planting of suitable trees that grow in<br />
this region easily.
Central Mine Planning & Design Institute <strong>Ltd</strong>.<br />
(A Subsidiary of Coal <strong>India</strong> <strong>Ltd</strong>.)<br />
Gondwana Place, Kanke Road, Ranchi 834031, Jharkhand<br />
Phone : (+91) 651 2230001, 2230002, 2230483, FAX (+91) 651 2231447, 2231851<br />
Wesite : www.cmpdi.co.in, Email : cmpdihq@cmpdi.co.in