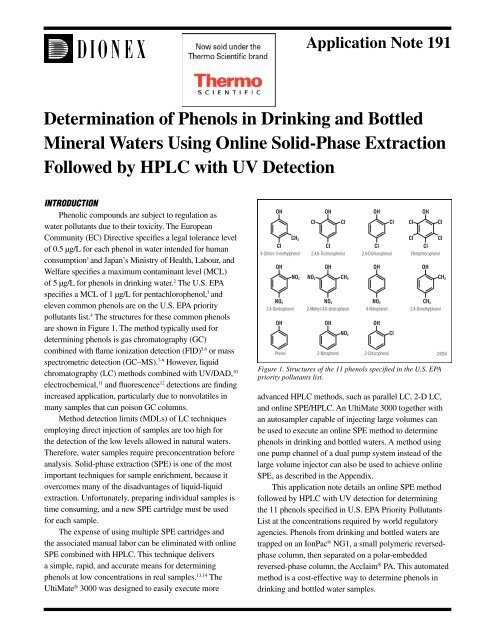
Determination of Phenols in Drinking and Bottled Mineral ... - Dionex
Determination of Phenols in Drinking and Bottled Mineral ... - Dionex
Determination of Phenols in Drinking and Bottled Mineral ... - Dionex

Create successful ePaper yourself
Turn your PDF publications into a flip-book with our unique Google optimized e-Paper software.
Application Note 191<br />
<strong>Determ<strong>in</strong>ation</strong> <strong>of</strong> <strong>Phenols</strong> <strong>in</strong> Dr<strong>in</strong>k<strong>in</strong>g <strong>and</strong> <strong>Bottled</strong><br />
M<strong>in</strong>eral Waters Us<strong>in</strong>g Onl<strong>in</strong>e Solid-Phase Extraction<br />
Followed by HPLC with UV Detection<br />
INTRODUCTION<br />
Phenolic compounds are subject to regulation as<br />
water pollutants due to their toxicity. The European<br />
Community (EC) Directive specifies a legal tolerance level<br />
<strong>of</strong> 0.5 µg/L for each phenol <strong>in</strong> water <strong>in</strong>tended for human<br />
consumption 1 <strong>and</strong> Japan’s M<strong>in</strong>istry <strong>of</strong> Health, Labour, <strong>and</strong><br />
Welfare specifies a maximum contam<strong>in</strong>ant level (MCL)<br />
<strong>of</strong> 5 µg/L for phenols <strong>in</strong> dr<strong>in</strong>k<strong>in</strong>g water. 2 The U.S. EPA<br />
specifies a MCL <strong>of</strong> 1 µg/L for pentachlorophenol, 3 <strong>and</strong><br />
eleven common phenols are on the U.S. EPA priority<br />
pollutants list. 4 The structures for these common phenols<br />
are shown <strong>in</strong> Figure 1. The method typically used for<br />
determ<strong>in</strong><strong>in</strong>g phenols is gas chromatography (GC)<br />
comb<strong>in</strong>ed with flame ionization detection (FID) 5,6 or mass<br />
spectrometric detection (GC–MS). 7-9 However, liquid<br />
chromatography (LC) methods comb<strong>in</strong>ed with UV/DAD, 10<br />
electrochemical, 11 <strong>and</strong> fluorescence 12 detections are f<strong>in</strong>d<strong>in</strong>g<br />
<strong>in</strong>creased application, particularly due to nonvolatiles <strong>in</strong><br />
many samples that can poison GC columns.<br />
Method detection limits (MDLs) <strong>of</strong> LC techniques<br />
employ<strong>in</strong>g direct <strong>in</strong>jection <strong>of</strong> samples are too high for<br />
the detection <strong>of</strong> the low levels allowed <strong>in</strong> natural waters.<br />
Therefore, water samples require preconcentration before<br />
analysis. Solid-phase extraction (SPE) is one <strong>of</strong> the most<br />
important techniques for sample enrichment, because it<br />
overcomes many <strong>of</strong> the disadvantages <strong>of</strong> liquid-liquid<br />
extraction. Unfortunately, prepar<strong>in</strong>g <strong>in</strong>dividual samples is<br />
time consum<strong>in</strong>g, <strong>and</strong> a new SPE cartridge must be used<br />
for each sample.<br />
The expense <strong>of</strong> us<strong>in</strong>g multiple SPE cartridges <strong>and</strong><br />
the associated manual labor can be elim<strong>in</strong>ated with onl<strong>in</strong>e<br />
SPE comb<strong>in</strong>ed with HPLC. This technique delivers<br />
a simple, rapid, <strong>and</strong> accurate means for determ<strong>in</strong><strong>in</strong>g<br />
phenols at low concentrations <strong>in</strong> real samples. 13,14 The<br />
UltiMate ® 3000 was designed to easily execute more<br />
OH<br />
OH<br />
CH3 CI CI<br />
CI CI<br />
CI<br />
CI<br />
4-Chloro-3-methylphenol 2,4,6-Trichlorophenol 2,4-Dichlorophenol Pentachlorophenol<br />
OH<br />
NO2 NO 2<br />
CI CI<br />
OH OH<br />
CH3<br />
NO2 NO2 NO2 CH3 2,4-D<strong>in</strong>itrophenol 2-Methyl-4,6-d<strong>in</strong>itrophenol 4-Nitrophenol<br />
2,4-Dimethylphenol<br />
OH OH OH<br />
NO2<br />
advanced HPLC methods, such as parallel LC, 2-D LC,<br />
<strong>and</strong> onl<strong>in</strong>e SPE/HPLC. An UltiMate 3000 together with<br />
an autosampler capable <strong>of</strong> <strong>in</strong>ject<strong>in</strong>g large volumes can<br />
be used to execute an onl<strong>in</strong>e SPE method to determ<strong>in</strong>e<br />
phenols <strong>in</strong> dr<strong>in</strong>k<strong>in</strong>g <strong>and</strong> bottled waters. A method us<strong>in</strong>g<br />
one pump channel <strong>of</strong> a dual pump system <strong>in</strong>stead <strong>of</strong> the<br />
large volume <strong>in</strong>jector can also be used to achieve onl<strong>in</strong>e<br />
SPE, as described <strong>in</strong> the Appendix.<br />
This application note details an onl<strong>in</strong>e SPE method<br />
followed by HPLC with UV detection for determ<strong>in</strong><strong>in</strong>g<br />
the 11 phenols specified <strong>in</strong> U.S. EPA Priority Pollutants<br />
List at the concentrations required by world regulatory<br />
agencies. <strong>Phenols</strong> from dr<strong>in</strong>k<strong>in</strong>g <strong>and</strong> bottled waters are<br />
trapped on an IonPac ® NG1, a small polymeric reversedphase<br />
column, then separated on a polar-embedded<br />
reversed-phase column, the Acclaim ® PA. This automated<br />
method is a cost-effective way to determ<strong>in</strong>e phenols <strong>in</strong><br />
dr<strong>in</strong>k<strong>in</strong>g <strong>and</strong> bottled water samples.<br />
OH<br />
Phenol 2-Nitrophenol 2-Chlorophenol<br />
Figure 1. Structures <strong>of</strong> the 11 phenols specified <strong>in</strong> the U.S. EPA<br />
priority pollutants list.<br />
CI<br />
CI<br />
OH<br />
OH<br />
CH 3<br />
24354<br />
Application Note 191 1<br />
CI<br />
CI
EQUIPMENT<br />
<strong>Dionex</strong> UltiMate 3000 HPLC system consist<strong>in</strong>g <strong>of</strong>:<br />
DGP 3600M dual gradient pump<br />
SRD 3600 solvent rack with <strong>in</strong>tegrated vacuum<br />
degasser<br />
TCC-3200 Thermostatted Column Compartment with<br />
two two-port, six-position (2P-6P) valves<br />
VWD-3400 Variable Wavelength Detector<br />
AS-HV High-Volume Autosampler*<br />
Chromeleon ® Chromatography Management S<strong>of</strong>tware,<br />
version 6.80<br />
*See Precautions.<br />
REAGENTS AND STANDARDS<br />
Use only ACS reagent grade chemicals for all<br />
reagents <strong>and</strong> st<strong>and</strong>ards.<br />
Deionized (DI) water from a Milli-Q ® Gradient A10 water<br />
purification system<br />
Methanol (CH OH), HPLC grade (Fisher)<br />
3<br />
Acetonitrile (CH CN), HPLC grade (Fisher)<br />
3<br />
Glacial acetic acid (HAc), analytical reagent-grade<br />
(Shanghai Chemical Reagent Company)<br />
Ammonium acetate (NH Ac), analytical reagent-grade<br />
4<br />
(Shanghai Chemical Reagent Company)<br />
Methanesulfonic acid (MSA), > 99.5% (Aldrich)<br />
Trifluoroacetic acid (TFA), > 99% (Aldrich)<br />
604 <strong>Phenols</strong> Calibration Mix (Restec) 2000 µg/mL <strong>in</strong><br />
methanol, consist<strong>in</strong>g <strong>of</strong>:<br />
4-chloro-3-methylphenol, 2-chlorophenol,<br />
2,4-dichlorophenol, 2,4-dimethylphenol,<br />
2,4-d<strong>in</strong>itrophenol, 2-methyl-4,6-d<strong>in</strong>itrophenol,<br />
2-nitrophenol, 4-nitrophenol, pentachlorophenol,<br />
phenol, <strong>and</strong> 2,4,6-trichlorophenol<br />
2 <strong>Determ<strong>in</strong>ation</strong> <strong>of</strong> <strong>Phenols</strong> <strong>in</strong> Dr<strong>in</strong>k<strong>in</strong>g <strong>and</strong> <strong>Bottled</strong> M<strong>in</strong>eral Waters Us<strong>in</strong>g Onl<strong>in</strong>e<br />
Solid-Phase Extraction Followed by HPLC with UV Detection<br />
CONDITIONS<br />
Solid-Phase Extraction<br />
Column: IonPac NG1, 5 µm, 4 × 35 mm<br />
(P/N 039567)<br />
Mobile Phases for SPE<br />
(Left Pump): A. 0.2 mM MSA<br />
B. CH CN 3<br />
Flow Rates: R<strong>in</strong>se: 1 mL/m<strong>in</strong> with 100% B<br />
Load<strong>in</strong>g: 2 mL/m<strong>in</strong> with<br />
100% A<br />
Phenol Elution: 1 mL/m<strong>in</strong> with<br />
15% B<br />
Inj. Volume:<br />
Column<br />
10 mL<br />
Temperature: 40 ºC<br />
The total time for on-l<strong>in</strong>e SPE is 14 m<strong>in</strong>. For the<br />
detailed program see Table 1A.<br />
Analytical<br />
Column: Acclaim PA, 5 µm,<br />
4.6 × 150 mm (P/N 061320)<br />
Mobile Phases for<br />
Analysis (Right Pump): A. 25 mM HAc /<br />
25 mM NH Ac (1.45 : 1, v/v)<br />
4<br />
B. CH CN 3<br />
Gradient: 25 to 70% B <strong>in</strong> 17.5 m<strong>in</strong><br />
Flow Rate: 1 mL/m<strong>in</strong><br />
Inj. Volume: 10 mL<br />
Temperature: 40 ºC<br />
Detection: UV, 280 nm<br />
Total analysis time is 18 m<strong>in</strong>. Dur<strong>in</strong>g SPE, the<br />
column is equilibrated for the next separation prior to<br />
<strong>in</strong>jection while onl<strong>in</strong>e SPE is occurr<strong>in</strong>g. For the detailed<br />
program see Table 1B.
Table 1A. Left Pump Program<br />
(Load<strong>in</strong>g Pump Used for SPE)<br />
A = 0.2 mM MSA, B = Acetonitrile<br />
Time (m<strong>in</strong>) Comm<strong>and</strong>s Comments<br />
Preparation<br />
–14.0<br />
–11.5<br />
–11.0<br />
–8.5<br />
–3.5<br />
–3.0<br />
0.2<br />
3.5<br />
ValveLeft = 6_1,<br />
ValveRight = 6_1<br />
Flow = 1000 [µL/m<strong>in</strong>]<br />
%B = 100.0, %C = 0.0,<br />
Curve = 5<br />
Flow = 1000 [µL/m<strong>in</strong>]<br />
%B = 100.0, %C = 0.0,<br />
Curve = 5<br />
Flow = 1000 [µL/m<strong>in</strong>]<br />
%B = 1.0, %C = 0.0,<br />
Curve = 5<br />
Flow = 2000 [µL/m<strong>in</strong>]<br />
%B = 1.0, %C = 0.0,<br />
Curve = 5<br />
Flow = 2000 [µL/m<strong>in</strong>]<br />
%B = 1.0, %C = 0.0,<br />
Curve = 5<br />
Flow = 1000 [µL/m<strong>in</strong>]<br />
%B = 15.0, %C = 0.0,<br />
Curve = 5<br />
Flow = 0 [µL/m<strong>in</strong>]<br />
%B = 0.0, %C = 0.0,<br />
Curve = 5<br />
Flow = 200 [µL/m<strong>in</strong>]<br />
%B = 100.0, %C = 0.0,<br />
Curve = 5<br />
R<strong>in</strong>se the SPE column<br />
(NG1) us<strong>in</strong>g 100%<br />
CH 3 CN, about 3 m<strong>in</strong>.<br />
Equilibrate the SPE column.<br />
Load sample from the loop<br />
to SPE column at 2 mL/m<strong>in</strong>,<br />
about 5 m<strong>in</strong>.<br />
Wash the SPE column.<br />
SPE column switches back<br />
to the system. Beg<strong>in</strong> to<br />
wash the SPE column to<br />
prepare for load<strong>in</strong>g the next<br />
sample.<br />
PREPARATION OF STANDARDS<br />
The preparation <strong>of</strong> st<strong>and</strong>ards for calibration is based<br />
on the requirements <strong>of</strong> EPA Method 604. 6<br />
Stock St<strong>and</strong>ard Solution 1<br />
Add 9.95 mL methanol us<strong>in</strong>g a graduated 5-mL<br />
pipette (two times) to a 10-mL vial, <strong>and</strong> add 50 µL <strong>of</strong> the<br />
604 <strong>Phenols</strong> Calibration Mix (2000 µg/mL) us<strong>in</strong>g a<br />
250-µL syr<strong>in</strong>ge. The concentration <strong>of</strong> stock st<strong>and</strong>ard<br />
solution 1 is 10 µg/mL.<br />
Stock St<strong>and</strong>ard Solution 2<br />
Add 900 µL methanol to a 10-mL vial us<strong>in</strong>g a 5-mL<br />
graduated pipette, <strong>and</strong> add 100 µL <strong>of</strong> stock st<strong>and</strong>ard<br />
solution 1 us<strong>in</strong>g a 250-µL syr<strong>in</strong>ge. The concentration <strong>of</strong><br />
stock st<strong>and</strong>ard solution 2 is 1 µg/mL.<br />
Table 1B. Right Pump Program<br />
(Analytical Pump)<br />
A = 25 mM HAc/NH 4Ac, B = Acetonitrile<br />
Time (m<strong>in</strong>) Comm<strong>and</strong>s Comments<br />
Preparation<br />
–14.0<br />
–13.0<br />
–7.0<br />
–5.0<br />
17.5<br />
18.0<br />
ValveLeft = 6_1,<br />
ValveRight = 6_1<br />
Flow = 200 [µL/m<strong>in</strong>]<br />
%B = 100.0, %C = 0.0,<br />
Curve = 5<br />
Flow = 200 [µL/m<strong>in</strong>]<br />
%B = 25.0, %C = 0.0,<br />
Curve = 5<br />
Flow = 200 [µL/m<strong>in</strong>]<br />
%B = 25.0, %C = 0.0,<br />
Curve = 5<br />
Flow = 1000 [µL/m<strong>in</strong>]<br />
%B = 25.0, %C = 0.0,<br />
Curve = 5<br />
Flow = 1000 [µL/m<strong>in</strong>]<br />
%B = 70.0, %C = 0.0,<br />
Curve = 5<br />
Flow = 1000 [µL/m<strong>in</strong>]<br />
%B = 100.0, %C = 0.0,<br />
Curve = 5<br />
Wash the analytical column.<br />
Beg<strong>in</strong> to equilbrate the<br />
analytical column us<strong>in</strong>g<br />
<strong>in</strong>itial conditions for 5 m<strong>in</strong>.<br />
Injections at 0 m<strong>in</strong>.<br />
17.5 m<strong>in</strong> gradient<br />
Beg<strong>in</strong> the column wash.<br />
Work<strong>in</strong>g St<strong>and</strong>ard Solutions<br />
Add 50, 100 <strong>and</strong> 200 µL <strong>of</strong> stock st<strong>and</strong>ard solution 2<br />
<strong>in</strong>to three separate 100-mL volumetric flasks, us<strong>in</strong>g a<br />
250-µL syr<strong>in</strong>ge. Br<strong>in</strong>g each to volume with a<br />
0.2 mM MSA solution conta<strong>in</strong><strong>in</strong>g 1% methanol. The<br />
concentrations <strong>of</strong> these solutions are 0.5, 1.0 <strong>and</strong> 2.0 µg/L.<br />
Add 50, 100 <strong>and</strong> 200 µL <strong>of</strong> stock st<strong>and</strong>ard solution 1<br />
<strong>in</strong>to three separate 100-mL volumetric flasks, us<strong>in</strong>g a<br />
250-µL syr<strong>in</strong>ge. Br<strong>in</strong>g each to volume with a<br />
0.2 mM MSA solution conta<strong>in</strong><strong>in</strong>g 1% methanol. The<br />
concentrations <strong>of</strong> these solutions are 5, 10 <strong>and</strong> 20 µg/L.<br />
Application Note 191 3
SySTEM SETUP<br />
Figure 2A is a schematic <strong>of</strong> the devices used for<br />
the determ<strong>in</strong>ation <strong>of</strong> phenols us<strong>in</strong>g onl<strong>in</strong>e solid-phase<br />
extraction (SPE) followed by HPLC with UV detection.<br />
The AS-HV has a peristaltic pump that can draw samples<br />
from sample bottles through a movable needle. This<br />
needle can sample from 15 different 100 mL sample<br />
bottles <strong>in</strong> the sample tray. The movement <strong>of</strong> the AS-HV is<br />
controlled by Chromeleon s<strong>of</strong>tware. The AS-HV uses the<br />
left valve <strong>of</strong> the TCC-3200 as a sample valve <strong>and</strong> the right<br />
valve as an onl<strong>in</strong>e SPE switch<strong>in</strong>g valve. Figure 2B shows<br />
the diagram for programm<strong>in</strong>g the large volume <strong>in</strong>jection<br />
us<strong>in</strong>g the AS-HV. The program for the AS-HV is listed <strong>in</strong><br />
Table 2. Tables 1A <strong>and</strong> 1B list the programs for the left<br />
(SPE) <strong>and</strong> right (analytical) UltiMate pumps.<br />
SAMPLE PREPARATION<br />
For the present analysis, tap water was collected at the<br />
<strong>Dionex</strong> Shanghai Applications Lab located <strong>in</strong> the Pudong<br />
District, Shanghai, Ch<strong>in</strong>a. One bottle <strong>of</strong> pure distilled<br />
dr<strong>in</strong>k<strong>in</strong>g water <strong>and</strong> two br<strong>and</strong>s <strong>of</strong> bottled m<strong>in</strong>eral dr<strong>in</strong>k<strong>in</strong>g<br />
water (named m<strong>in</strong>eral dr<strong>in</strong>k<strong>in</strong>g water 1 <strong>and</strong> 2, respectively)<br />
were purchased from a local supermarket.<br />
<strong>Bottled</strong> pure distilled dr<strong>in</strong>k<strong>in</strong>g water, bottled m<strong>in</strong>eral<br />
dr<strong>in</strong>k<strong>in</strong>g waters 1 <strong>and</strong> 2, <strong>and</strong> tap water samples were<br />
prepared by filter<strong>in</strong>g 495 mL <strong>of</strong> each through 0.45 µm filters<br />
<strong>in</strong>to four 500-mL bottles <strong>and</strong> add<strong>in</strong>g 5 mL methanol <strong>and</strong><br />
56 µL MSA to each. The f<strong>in</strong>al concentration <strong>of</strong> MSA <strong>in</strong> the<br />
samples was approximately 2 mM.<br />
Spiked samples were prepared from the above solutions.<br />
The procedures for preparation <strong>of</strong> spiked water samples are<br />
shown <strong>in</strong> Table 3.<br />
4 <strong>Determ<strong>in</strong>ation</strong> <strong>of</strong> <strong>Phenols</strong> <strong>in</strong> Dr<strong>in</strong>k<strong>in</strong>g <strong>and</strong> <strong>Bottled</strong> M<strong>in</strong>eral Waters Us<strong>in</strong>g Onl<strong>in</strong>e<br />
Solid-Phase Extraction Followed by HPLC with UV Detection<br />
Waste<br />
Figure 2. A) Schematic <strong>of</strong> devices for determ<strong>in</strong>ation <strong>of</strong> phenols<br />
us<strong>in</strong>g onl<strong>in</strong>e solid-phase extraction (SPE) followed by HPLC with<br />
UV detection. B) Time l<strong>in</strong>e diagram for programm<strong>in</strong>g the highvolume<br />
<strong>in</strong>jection us<strong>in</strong>g the AS-HV.<br />
Table 2. AS-HV Program<br />
Time (m<strong>in</strong>) Comm<strong>and</strong>s Comments<br />
Preparation<br />
–14.0 Pump On<br />
–10.0<br />
–2.8<br />
Peristaltic Pump<br />
<strong>of</strong> AS-HV<br />
3<br />
Needle <strong>of</strong> AS-HV<br />
Y_Axis = AIM_sampler.position<br />
X_Axis = AIM_sampler.<br />
position Needle = 157, Go To<br />
Position<br />
Pump Off<br />
Needle Home<br />
In-L<strong>in</strong>e Filter<br />
10-mL Loop NG1<br />
TCC-3200<br />
4<br />
5<br />
6<br />
–14 to –10 m<strong>in</strong>: load sample to loop<br />
–11 to –8.6 m<strong>in</strong>: equilibrate NG1<br />
Pump on <strong>of</strong> AS-HV,<br />
left valve switch<br />
to 6-1<br />
–10 m<strong>in</strong>, pump <strong>of</strong>f<br />
<strong>of</strong> AS-HV<br />
–8.6 m<strong>in</strong>, left valve<br />
switch to 1-2<br />
2<br />
1<br />
(A) Schematic <strong>of</strong> Devices<br />
UltiMate DGP-3600<br />
Left Right<br />
Waste<br />
(B) Time L<strong>in</strong>e Diagram<br />
–8.6 to –3.5 m<strong>in</strong>: load sample to NG1,<br />
–3.5 to 0 m<strong>in</strong>: wash NG1<br />
–3 m<strong>in</strong>, left valve<br />
switch to 6-1<br />
AIM Sampler,<br />
Wash = On, Pump On<br />
–2.8 m<strong>in</strong>, wash<br />
the needle<br />
VWD-3400<br />
0 to 18 m<strong>in</strong>: sample analysis<br />
3 m<strong>in</strong>, right valve<br />
switch to 6-1<br />
0 m<strong>in</strong>, right valve<br />
switch to 1-2<br />
beg<strong>in</strong> analysis<br />
F<strong>in</strong>d position from<br />
CM sequence. Set the<br />
needle’s height <strong>and</strong> enter<br />
the sample bottle.<br />
Beg<strong>in</strong> to load sample<br />
from the bottle. The flow<br />
rate <strong>of</strong> the peristaltic<br />
pump is about<br />
3.3 mL/m<strong>in</strong>.<br />
End sample load<strong>in</strong>g. After<br />
sample load<strong>in</strong>g, sample<br />
loop switches <strong>in</strong>l<strong>in</strong>e with<br />
the SPE column.<br />
Wash the sampl<strong>in</strong>g<br />
needle <strong>and</strong> the sample<br />
loop <strong>in</strong> preparation for<br />
the next <strong>in</strong>jection.<br />
3.0 Pump Off, Needle Home End <strong>of</strong> AS-HV wash.<br />
3<br />
4<br />
2<br />
5<br />
1<br />
6<br />
Acclaim<br />
PA<br />
24355
Table 3. Preparation <strong>of</strong> Spiked Water Samples<br />
Samples prepared<br />
with 1% methanol <strong>and</strong><br />
2 mM MSA<br />
Amount <strong>of</strong> added<br />
stock st<strong>and</strong>ard<br />
solution 1 (µL)<br />
Phenol<br />
concentration<br />
(µg/L)<br />
Distilled dr<strong>in</strong>k<strong>in</strong>g water 50 5<br />
M<strong>in</strong>eral dr<strong>in</strong>k<strong>in</strong>g water 1 100 10<br />
M<strong>in</strong>eral dr<strong>in</strong>k<strong>in</strong>g water 2 100 10<br />
Tap water 150 15<br />
RESULTS AND DISCUSSION<br />
Optimization <strong>of</strong> the Onl<strong>in</strong>e SPE Method<br />
Different concentrations <strong>of</strong> acids (HAc or MSA)<br />
mixed with methanol or acetonitrile were <strong>in</strong>vestigated<br />
as wash solutions to elute phenols concentrated on the<br />
SPE column. Experiments demonstrated that compared<br />
to the acid/methanol solutions, acid/acetonitrile solutions<br />
yielded higher peak efficiency, <strong>and</strong> 0.2 mM MSA/<br />
acetonitrile yielded the lowest background.<br />
Figure 3 shows an overlay <strong>of</strong> chromatograms <strong>of</strong><br />
phenols spiked <strong>in</strong>to tap water samples, eluted from the<br />
SPE column us<strong>in</strong>g acetonitrile solutions with different<br />
concentrations, <strong>and</strong> then separated on an Acclaim PA<br />
column. More impurities <strong>and</strong> a high background (poor<br />
basel<strong>in</strong>e) were obta<strong>in</strong>ed when us<strong>in</strong>g acidified water<br />
only (Chromatogram A). Although fewer impurities<br />
<strong>and</strong> a lower background were found when us<strong>in</strong>g a 20%<br />
acetonitrile solution, the recovery <strong>of</strong> early elut<strong>in</strong>g phenols<br />
was reduced (Chromatogram D). Therefore, a 15%<br />
acetonitrile solution was selected to ensure recovery <strong>of</strong> all<br />
phenols (Chromatogram C).<br />
Column: Acclaim PA, 5 µm,<br />
4.6 × 150 mm<br />
Eluent: A: 0.1% HAc<br />
B: CH3CN<br />
Flow Rate: 1.0 mL/m<strong>in</strong><br />
Inj. Volume: 6 mL<br />
Temperature: 40 °C<br />
Detection: UV, 280 nm<br />
Sample: Spiked tap water, 5 µg/L each phenol<br />
45<br />
mAU<br />
A<br />
B<br />
C<br />
D<br />
–10<br />
14 16 18 20 22 24 26 28 30 32 34 36 38 40<br />
M<strong>in</strong>utes 24356<br />
Figure 3. Overlay <strong>of</strong> chromatograms <strong>of</strong> tap water samples spiked<br />
with 5 µg/L <strong>of</strong> each phenol, <strong>and</strong> washed from the IonPac NG1 SPE<br />
column us<strong>in</strong>g acetonitrile solutions with different concentrations:<br />
A) 0% CH CN, B) 10% CH CN, C) 15% CH CN, D) 20% CH CN.<br />
3 3 3 3<br />
Effect <strong>of</strong> Acidic Solution <strong>and</strong> Its Concentration <strong>in</strong> the<br />
Mobile Phase on Retention <strong>of</strong> <strong>Phenols</strong><br />
Several acid solutions 15-17 can be used as mobile<br />
phases to separate phenols. As shown <strong>in</strong> Figure 4, good<br />
separation <strong>of</strong> the phenols can be obta<strong>in</strong>ed when us<strong>in</strong>g<br />
methanesulfonic acid (MSA), trifluoroacetic acid (TFA),<br />
acetic acid (HAc), or an acetic acid-ammonium acetate<br />
buffer (HAc-NH 4 Ac).<br />
Column: Acclaim PA, 5 µm,<br />
4.6 × 150 mm<br />
Eluent: A: See legend<br />
B: CH3CN<br />
Flow Rate: 1.0 mL/m<strong>in</strong><br />
Inj. Volume: 5 µL<br />
Temperature: 40 °C<br />
Detection: UV, 280 nm<br />
25<br />
mAU<br />
–3<br />
40<br />
mAU<br />
–5<br />
45<br />
mAU<br />
–5<br />
20<br />
A<br />
B<br />
C<br />
D<br />
1<br />
mAU 1<br />
6<br />
1<br />
1<br />
9<br />
2<br />
2<br />
2<br />
2<br />
3<br />
3<br />
3<br />
44<br />
6<br />
4<br />
5<br />
6<br />
4<br />
3<br />
55<br />
6<br />
7 8<br />
5<br />
7 8<br />
4<br />
5<br />
Peaks:<br />
1. Phenol 10 µg/L<br />
2. 4-Nitrophenol 10<br />
3. 2-Chlorophenol 10<br />
4. 2-Nitrophenol 10<br />
5. 2,4-Dimethylphenol 10<br />
6. 2,4-D<strong>in</strong>itrophenol 10<br />
7. 4-Chloro-3-methylphenol 10<br />
8. 2,4-Dichlorophenol 10<br />
9. 4,6-D<strong>in</strong>itro-2-methylphenol 10<br />
10. 2,4,6-Trichlorophenol 10<br />
11. Pentachlorophenol 10<br />
7 8<br />
–5<br />
0 5 10 15 20<br />
M<strong>in</strong>utes<br />
24357<br />
9<br />
9<br />
7 8<br />
Figure 4. Chromatograms <strong>of</strong> 10 µg/L phenol work<strong>in</strong>g st<strong>and</strong>ard<br />
separated us<strong>in</strong>g acetonitrile as mobile phase B <strong>and</strong> different acid<br />
solutions as mobile phase A: A) 0.1 mM MSA, B) 0.1% TFA,<br />
C) 0.1% HAc, D) 25 mM HAc/NH 4 Ac.<br />
10<br />
10<br />
9<br />
10<br />
10 11<br />
11<br />
11<br />
Application Note 191 5<br />
11
The effect <strong>of</strong> chang<strong>in</strong>g the mobile phase acid<br />
concentration on retention <strong>of</strong> phenols was <strong>in</strong>vestigated.<br />
As shown <strong>in</strong> Figure 5, the retention time <strong>of</strong> most phenols<br />
changed slightly, but that <strong>of</strong> a few phenols changed<br />
significantly with mobile phases <strong>and</strong> concentrations.<br />
When MSA concentration was <strong>in</strong>creased from 0.1 mM<br />
to 3.0 mM, the retention time <strong>of</strong> 2,4-d<strong>in</strong>itrophenol<br />
shifted considerably. The retention time <strong>of</strong> 4,6-d<strong>in</strong>itro-2methylphenol<br />
also decreased slightly (Figure 5A). When<br />
HAc concentration was <strong>in</strong>creased from 0.03% to 2.0%,<br />
the same pattern <strong>of</strong> retention change was observed<br />
(Figure 5B). Substitut<strong>in</strong>g TFA for HAc yielded similar<br />
results, therefore those data have been omitted.<br />
Chang<strong>in</strong>g the proportions <strong>of</strong> the 25 mM HAc/<br />
NH 4 Ac buffer had a stronger effect on the retention times<br />
<strong>of</strong> 2,4-d<strong>in</strong>itrophenol <strong>and</strong> 4,6-d<strong>in</strong>itro-2-methylphenol<br />
than chang<strong>in</strong>g the concentrations <strong>of</strong> the acid solutions.<br />
The retention times <strong>of</strong> 2,4,6-trichlorophenol <strong>and</strong><br />
pentachlorophenol also shifted more with changes <strong>in</strong><br />
the buffer than with changes <strong>in</strong> the acid concentration<br />
(Figure 5C).<br />
Selection <strong>of</strong> Mobile Phase<br />
HAc, MSA, <strong>and</strong> TFA solutions all yielded good<br />
separation <strong>of</strong> the eleven phenols specified <strong>in</strong> U.S. EPA<br />
Method 604. When the concentration <strong>of</strong> acid <strong>in</strong> the mobile<br />
phase was lower, the separation was much better, but the<br />
retention times <strong>of</strong> a few phenols were sensitive to small<br />
changes <strong>in</strong> acid concentration, result<strong>in</strong>g <strong>in</strong> unsatisfactory<br />
method reproducibility. Therefore, HAc/NH 4 Ac buffer<br />
was selected as the mobile phase for separat<strong>in</strong>g phenols,<br />
because it delivered good separation <strong>and</strong> reproducibility.<br />
From Figure 5C, we can predict all eleven phenols will be<br />
well resolved us<strong>in</strong>g the buffer at about a 1.5:1 (v/v) ratio<br />
<strong>of</strong> the two 25 mM components.<br />
6 <strong>Determ<strong>in</strong>ation</strong> <strong>of</strong> <strong>Phenols</strong> <strong>in</strong> Dr<strong>in</strong>k<strong>in</strong>g <strong>and</strong> <strong>Bottled</strong> M<strong>in</strong>eral Waters Us<strong>in</strong>g Onl<strong>in</strong>e<br />
Solid-Phase Extraction Followed by HPLC with UV Detection<br />
20<br />
Retention time (m<strong>in</strong>)<br />
4 0 .1 .2 .3 .4 .5 1 2 3<br />
20<br />
Retention time (m<strong>in</strong>)<br />
4<br />
20<br />
Retention time (m<strong>in</strong>)<br />
4<br />
MSA (mM)<br />
.06 .13 .25 .50 1.0 2.0<br />
HAc (%)<br />
HAc 2:1 1:1 1:2 NH4Ac<br />
25 mM HAc/25 mM NH4Ac (v/v)<br />
24358<br />
Figure 5. Effect <strong>of</strong> chang<strong>in</strong>g acid concentration <strong>in</strong> the mobile<br />
phase on retention time. A) MSA from 0.1 to 3.0 mM, B) HAc from<br />
0.03 to 2.0%, C) 25 mM HAc-NH 4 Ac buffer from 100% HAc to<br />
100% NH 4 Ac (v/v).<br />
A<br />
B<br />
C<br />
phenol<br />
4-nitrophenol<br />
2-chlorophenol<br />
2-nitrophenol<br />
2,4-d<strong>in</strong>itrophenol<br />
2,4-dimethylphenol<br />
4-chloro-3-methylphenol<br />
2,4-dichlorophenol<br />
4,6-d<strong>in</strong>itro-2-methylphenol<br />
2,4,6-trichlorophenol<br />
pentachlorophenol
Table 4. Retention Time Reproducibility, Peak Area Reproducibility, <strong>and</strong> Comparison <strong>of</strong> Detection Limits<br />
for the 11 <strong>Phenols</strong> on the U. S. EPA Priority Pollutants List<br />
Phenol RT RSD a (%) Area RSD a (%) MDL b (µg/L) MDL (µg/L)<br />
obta<strong>in</strong>ed by<br />
GC-FID <strong>in</strong> EPA 604<br />
Reproducibility, Detection Limits, <strong>and</strong> L<strong>in</strong>earity<br />
The reproducibility was estimated by mak<strong>in</strong>g seven<br />
replicate <strong>in</strong>jections <strong>of</strong> the 2 µg/L calibration st<strong>and</strong>ard.<br />
Table 4 summarizes the retention time <strong>and</strong> peak area<br />
precision data. The method detection limits (MDLs) <strong>of</strong><br />
the phenols are also listed <strong>in</strong> Table 4, as are the MDLs<br />
reported for the GC method <strong>in</strong> U.S. EPA Method 604.<br />
The MDLs <strong>of</strong> the on-l<strong>in</strong>e SPE-HPLC method are similar<br />
to <strong>and</strong> <strong>in</strong> most cases better than those achieved us<strong>in</strong>g GC,<br />
without the labor <strong>and</strong> cost <strong>of</strong> liquid/liquid extraction or<br />
manual SPE.<br />
Calibration l<strong>in</strong>earity for the determ<strong>in</strong>ation <strong>of</strong><br />
phenols was <strong>in</strong>vestigated by mak<strong>in</strong>g replicate <strong>in</strong>jections<br />
<strong>of</strong> a mixed st<strong>and</strong>ard <strong>of</strong> phenols prepared at six different<br />
concentrations. The external st<strong>and</strong>ard method is used <strong>in</strong><br />
EPA Method 604. Therefore, we used it to calculate the<br />
calibration curve <strong>and</strong> for sample analysis. Table 5 lists the<br />
data from the calibration as reported by Chromeleon.<br />
MDL (µg/L)<br />
obta<strong>in</strong>ed by<br />
GC-ECD <strong>in</strong> EPA 604<br />
2,4-D<strong>in</strong>itrophenol 0.292 1.358 0.46 13.0 0.63<br />
Phenol 0.240 5.584 0.87 0.14 2.2<br />
4,6-D<strong>in</strong>itro-2-methylphenol 0.164 0.647 0.40 16.0 not detected<br />
4-Nitrophenol 0.155 0.432 0.42 2.8 0.70<br />
2-Chlorophenol 0.122 1.659 0.41 0.31 0.58<br />
2-Nitrophenol 0.092 1.487 0.41 0.45 0.77<br />
2,4-Dimethylphenol 0.089 0.462 0.30 0.32 0.68<br />
4-Chloro-3-methylphenol 0.085 0.477 0.31 0.36 1.8<br />
2,4-Dichlorophenol 0.072 0.731 0.08 0.39 not detected<br />
2,4,6-Trichlorophenol 0.056 0.717 0.20 0.64 0.58<br />
Pentachlorophenol 0.064 8.599 0.93 7.40 0.59<br />
a Seven <strong>in</strong>jections <strong>of</strong> the 2 µg/L work<strong>in</strong>g st<strong>and</strong>ard solution.<br />
b The s<strong>in</strong>gle-sided Student’s t test method (at the 99% confidence limit) was used for estimat<strong>in</strong>g MDL, where the st<strong>and</strong>ard deviation (SD) <strong>of</strong> the peak area <strong>of</strong> seven<br />
<strong>in</strong>jections is multiplied by 3.14 (at n = 7) to yield the MDL.<br />
Table 5. Calibration Data <strong>and</strong> L<strong>in</strong>earity<br />
<strong>of</strong> the 11 <strong>Phenols</strong><br />
Phenol r RSD (%)<br />
2,4-D<strong>in</strong>itrophenol 0.9998 1.73<br />
Phenol 0.9984 4.29<br />
4,6-D<strong>in</strong>itro-2-methylphenol 0.9998 1.69<br />
4-Nitrophenol 0.9997 1.79<br />
2-Chlorophenol 0.9996 2.22<br />
2-Nitrophenol 0.9992 3.03<br />
2,4-Dimethylphenol 0.9999 1.33<br />
4-Chloro-3-methylphenol 0.9998 1.42<br />
2,4-Dichlorophenol 0.9998 1.33<br />
2,4,6-Trichlorophenol 0.9999 1.28<br />
Pentachlorophenol 0.9965 6.07<br />
Application Note 191 7
Sample Analysis<br />
To achieve satisfactory chromatography <strong>of</strong> phenols <strong>in</strong><br />
the tap <strong>and</strong> m<strong>in</strong>eral water samples, these samples should<br />
be acidified to approximately pH 3.5 prior to analysis.<br />
Figure 6 shows the chromatograms <strong>of</strong> spiked m<strong>in</strong>eral<br />
water sample acidified to pH 7 <strong>and</strong> pH 3 with MSA,<br />
respectively. The peak shapes <strong>of</strong> 2,4-d<strong>in</strong>itrophenol,<br />
4,6-d<strong>in</strong>itro-2-methylphenol, <strong>and</strong> 4-nitrophenol are<br />
superior at pH 3.<br />
For different water samples, the amount <strong>of</strong> acid<br />
required to achieve a pH < 4.5 varies. For example,<br />
6 µL MSA (about 0.2 mM f<strong>in</strong>al concentration) was<br />
added to the 500 mL pure distilled water sample<br />
solution (495 mL distilled water + 5 mL methanol) to<br />
yield a pH <strong>of</strong> approximately 3.9. For the tap water <strong>and</strong><br />
m<strong>in</strong>eral water samples, much more MSA was needed<br />
because these samples conta<strong>in</strong> ions that are capable <strong>of</strong><br />
buffer<strong>in</strong>g the MSA, most notably bicarbonate (Table 6).<br />
Therefore, approximately 56 µL MSA (about 2 mM f<strong>in</strong>al<br />
concentration) was added to the tap <strong>and</strong> m<strong>in</strong>eral water<br />
samples to achieve pH values rang<strong>in</strong>g from 2.5 to 4.5.<br />
Column: Acclaim PA, 5 µm,<br />
4.6 × 150 mm<br />
Eluent: A: 25 mM HAc/<br />
NH4Ac (1.45:1 v/v)<br />
B: CH3CN<br />
Flow Rate: 1.0 mL/m<strong>in</strong><br />
Inj. Volume: 10 µL<br />
Temperature: 40 °C<br />
Detection: UV, 280 nm<br />
8 <strong>Determ<strong>in</strong>ation</strong> <strong>of</strong> <strong>Phenols</strong> <strong>in</strong> Dr<strong>in</strong>k<strong>in</strong>g <strong>and</strong> <strong>Bottled</strong> M<strong>in</strong>eral Waters Us<strong>in</strong>g Onl<strong>in</strong>e<br />
Solid-Phase Extraction Followed by HPLC with UV Detection<br />
35<br />
mAU<br />
–5<br />
35<br />
mAU<br />
A<br />
B<br />
–5<br />
0 2 4 6 8 10<br />
M<strong>in</strong>utes<br />
12 14 16 18<br />
24359<br />
Figure 6. Chromatograms <strong>of</strong> bottled m<strong>in</strong>eral dr<strong>in</strong>k<strong>in</strong>g water 1<br />
spiked with 10 µg/L phenols <strong>and</strong> acidified with MSA to A) pH 7,<br />
<strong>and</strong> B) pH 3.<br />
Table 6. Listed Amounts <strong>of</strong> Ions <strong>in</strong><br />
<strong>Bottled</strong> M<strong>in</strong>eral Dr<strong>in</strong>k<strong>in</strong>g Waters<br />
Labeled contents <strong>Bottled</strong> m<strong>in</strong>eral<br />
dr<strong>in</strong>k<strong>in</strong>g water 1<br />
(mg/L)<br />
<strong>Bottled</strong> m<strong>in</strong>eral<br />
dr<strong>in</strong>k<strong>in</strong>g water 2<br />
(mg/L)<br />
Na + >0.8 4–12<br />
K + >0.35 0.3–1.0<br />
Ca 2+ >4 not reported<br />
Mg 2+ >0.5 0.3–0.5<br />
Zn 2+ not reported 0.25<br />
Sr 2+ not reported 0.14<br />
HSiO 2<br />
1<br />
1<br />
2<br />
2<br />
4<br />
3<br />
3<br />
4<br />
Peaks:<br />
1. 2,4-D<strong>in</strong>itrophenol 10 µg/L<br />
2. Phenol 10<br />
3. 4,6-D<strong>in</strong>itro-2-methylphenol 10<br />
4. 4-Nitrophenol 10<br />
5. 2-Chlorophenol 10<br />
6. 2-Nitrophenol 10<br />
7. 2,4-Dimethylphenol 10<br />
8. 4-Chloro-3-methylphenol 10<br />
9. 2,4-Dichlorophenol 10<br />
10. 2,4,6-Trichlorophenol 10<br />
11. Pentachlorophenol 10<br />
>1.8 71.6<br />
- HCO3 not reported 14<br />
pH (25 °C) 7.35 ± 0.5 7.0–8.0<br />
5<br />
5<br />
6<br />
6<br />
7<br />
7<br />
8 9<br />
8 9<br />
10<br />
11<br />
10<br />
11
<strong>Bottled</strong> M<strong>in</strong>eral Dr<strong>in</strong>k<strong>in</strong>g Water<br />
Two br<strong>and</strong>s <strong>of</strong> bottled m<strong>in</strong>eral dr<strong>in</strong>k<strong>in</strong>g water were<br />
analyzed. Table 6 shows the contents listed on the labels<br />
<strong>of</strong> each. Figures 7 <strong>and</strong> 8 show chromatograms <strong>of</strong> the<br />
bottled m<strong>in</strong>eral water samples <strong>and</strong> the same samples<br />
spiked with phenols. The results are summarized <strong>in</strong><br />
Table 7. <strong>Bottled</strong> M<strong>in</strong>eral Dr<strong>in</strong>k<strong>in</strong>g Water Analytical Results<br />
Phenol <strong>Bottled</strong> m<strong>in</strong>eral dr<strong>in</strong>k<strong>in</strong>g water 1 a <strong>Bottled</strong> m<strong>in</strong>eral dr<strong>in</strong>k<strong>in</strong>g water 2 b<br />
Unspiked<br />
(µM)<br />
Added (µM) Found (µM) Recovery<br />
(%)<br />
Unspiked<br />
(µM)<br />
Added (µM) Found (µM) Recovery<br />
(%)<br />
2,4-D<strong>in</strong>itrophenol ND c 10 9.44 94.4 ND 10 9.57 95.7<br />
Phenol ND 10 11.9 119 0.37 10 10.0 100<br />
4,6-D<strong>in</strong>itro-2-methylphenol ND 10 9.56 95.6 ND 10 9.57 95.7<br />
4-Nitrophenol ND 10 10.2 102 ND 10 10.0 100<br />
2-Chlorophenol ND 10 10.4 104 ND 10 9.02 90.2<br />
2-Nitrophenol ND 10 11.9 119 ND 10 10.9 109<br />
2,4-Dimethylphenol ND 10 10.5 105 ND 10 9.97 99.7<br />
4-Chloro-3-methylphenol ND 10 9.56 95.6 ND 10 9.40 94.0<br />
2,4-Dichlorophenol ND 10 9.75 97.5 ND 10 9.05 90.5<br />
2,4,6-Trichlorophenol ND 10 10.1 101 0.75 10 9.55 95.5<br />
Pentachlorophenol 0.73 10 9.67 96.7 ND 10 9.60 96.0<br />
a One unspiked sample <strong>of</strong> m<strong>in</strong>eral dr<strong>in</strong>k<strong>in</strong>g water 1 was prepared <strong>and</strong> two <strong>in</strong>jections were made. One spiked sample was prepared <strong>and</strong> four <strong>in</strong>jections were made.<br />
b One unspiked sample <strong>of</strong> m<strong>in</strong>eral dr<strong>in</strong>k<strong>in</strong>g water 2 was prepared <strong>and</strong> three <strong>in</strong>jections were made. One spiked sample was prepared <strong>and</strong> five <strong>in</strong>jections were made.<br />
c ND = not detected.<br />
Column: Acclaim PA, 5µm,<br />
4.6 × 150 mm<br />
Eluent: A: 25 mM HAc/<br />
NH4Ac (1.45:1 v/v)<br />
B: CH3CN<br />
Flow Rate: 1.0 mL/m<strong>in</strong><br />
Inj. Volume: 10 mL<br />
Temperature: 40 °C<br />
Detection: UV, 280 nm<br />
35<br />
mAU<br />
B<br />
A<br />
1<br />
2<br />
3<br />
4<br />
Peaks:<br />
1. 2,4-D<strong>in</strong>itrophenol 10 µg/L<br />
2. Phenol 10<br />
3. 4,6-D<strong>in</strong>itro-2-methylphenol 10<br />
4. 4-Nitrophenol 10<br />
5. 2-Chlorophenol 10<br />
6. 2-Nitrophenol 10<br />
7. 2,4-Dimethylphenol 10<br />
8. 4-Chloro-3-methylphenol 10<br />
9. 2,4-Dichlorophenol 10<br />
10. 2,4,6-Trichlorophenol 10<br />
11. Pentachlorophenol<br />
6<br />
10<br />
–10<br />
0 2 4 6 8 10<br />
M<strong>in</strong>utes<br />
12 14 16 18<br />
24360<br />
Figure 7. Overlay <strong>of</strong> chromatograms <strong>of</strong> bottled m<strong>in</strong>eral dr<strong>in</strong>k<strong>in</strong>g<br />
water 1, A) unspiked, <strong>and</strong> B) spiked with 10 µg/L phenols.<br />
5<br />
7<br />
8 9<br />
10<br />
11<br />
Table 7. Low concentrations <strong>of</strong> two phenols were<br />
detected <strong>in</strong> the unspiked m<strong>in</strong>eral water 2 sample <strong>and</strong> a<br />
low concentration <strong>of</strong> one phenol <strong>in</strong> the unspiked m<strong>in</strong>eral<br />
water 1. Good recoveries were obta<strong>in</strong>ed for all eleven<br />
phenols.<br />
Column: Acclaim PA, 5µm,<br />
4.6 × 150 mm<br />
Eluent: A: 25 mM HAc/<br />
NH4Ac (1.45:1 v/v)<br />
B: CH3CN<br />
Flow Rate: 1.0 mL/m<strong>in</strong><br />
Inj. Volume: 10 mL<br />
Temperature: 40 °C<br />
Detection: UV, 280 nm<br />
35<br />
mAU<br />
B<br />
A<br />
1<br />
2<br />
3<br />
4<br />
Peaks:<br />
1. 2,4-D<strong>in</strong>itrophenol 10 µg/L<br />
2. Phenol 10<br />
3. 4,6-D<strong>in</strong>itro-2-methylphenol 10<br />
4. 4-Nitrophenol 10<br />
5. 2-Chlorophenol 10<br />
6. 2-Nitrophenol 10<br />
7. 2,4-Dimethylphenol 10<br />
8. 4-Chloro-3-methylphenol 10<br />
9. 2,4-Dichlorophenol 10<br />
10. 2,4,6-Trichlorophenol 10<br />
11. Pentachlorophenol 10<br />
–5<br />
0 2 4 6 8 10 12 14 16 18<br />
M<strong>in</strong>utes<br />
24361<br />
Figure 8. Overlay <strong>of</strong> chromatograms <strong>of</strong> bottled m<strong>in</strong>eral dr<strong>in</strong>k<strong>in</strong>g<br />
water 2, A) unspiked, <strong>and</strong> B) spiked with 10 µg/L phenols.<br />
5<br />
6<br />
7<br />
8 9<br />
Application Note 191 9<br />
10<br />
11
Table 8. <strong>Bottled</strong> Pure Distilled Dr<strong>in</strong>k<strong>in</strong>g Water <strong>and</strong> Tap Water Analytical Results<br />
Phenol Pure distilled water a Tap water b<br />
Unspiked<br />
(µM)<br />
Added (µM) Found (µM) Recovery<br />
(%)<br />
<strong>Bottled</strong> Pure Distilled Dr<strong>in</strong>k<strong>in</strong>g Water<br />
Figure 9 shows chromatograms <strong>of</strong> pure distilled<br />
dr<strong>in</strong>k<strong>in</strong>g water <strong>and</strong> the same water spiked with phenols.<br />
The results are summarized <strong>in</strong> Table 8. No phenols<br />
were found <strong>in</strong> the unspiked sample, <strong>and</strong> recovery <strong>of</strong> all<br />
phenols <strong>in</strong> the spiked sample was excellent.<br />
Unspiked<br />
(µM)<br />
10 <strong>Determ<strong>in</strong>ation</strong> <strong>of</strong> <strong>Phenols</strong> <strong>in</strong> Dr<strong>in</strong>k<strong>in</strong>g <strong>and</strong> <strong>Bottled</strong> M<strong>in</strong>eral Waters Us<strong>in</strong>g Onl<strong>in</strong>e<br />
Solid-Phase Extraction Followed by HPLC with UV Detection<br />
Added (µM) Found (µM) Recovery<br />
(%)<br />
2,4-D<strong>in</strong>itrophenol ND c 5 4.95 99.0 2.11 15 10.4 70.0<br />
Phenol ND 5 4.84 96.8 0.41 15 14.2 94.7<br />
4,6-D<strong>in</strong>itro-2-methylphenol ND 5 5.02 100 ND 15 15.1 101<br />
4-Nitrophenol ND 5 5.09 102 0.80 15 15.2 101<br />
2-Chlorophenol ND 5 5.22 104
CONCLUSION<br />
The successful analysis <strong>of</strong> all the water samples<br />
above demonstrates that onl<strong>in</strong>e SPE with a dual UltiMate<br />
system can determ<strong>in</strong>e the 11 phenols designated on the<br />
EPA Priority Pollutants List without laborious <strong>of</strong>fl<strong>in</strong>e<br />
sample preparation. The onl<strong>in</strong>e SPE method with UV<br />
detection has very good reproducibility, with detection<br />
limits similar to <strong>and</strong> <strong>in</strong> many cases superior to the GC<br />
methods described <strong>in</strong> EPA Method 604.<br />
PRECAUTIONS<br />
Method <strong>in</strong>terferences may be caused by contam<strong>in</strong>ants<br />
<strong>in</strong> solvents, reagents, glassware, <strong>and</strong> other sample<br />
process<strong>in</strong>g hardware. Clean all glassware scrupulously<br />
<strong>and</strong> use high purity reagents <strong>and</strong> solvents to m<strong>in</strong>imize<br />
<strong>in</strong>terference problems.<br />
Samples must be acidified to about pH 3.5 with<br />
MSA before large volume <strong>in</strong>jections, especially for the<br />
m<strong>in</strong>eral dr<strong>in</strong>k<strong>in</strong>g water <strong>and</strong> tap water samples. If not,<br />
the determ<strong>in</strong>ation <strong>of</strong> 2,4-d<strong>in</strong>itrophenol, 4,6-d<strong>in</strong>itro-2methylphenol<br />
<strong>and</strong> 4-nitrophenol can be affected.<br />
The tub<strong>in</strong>g <strong>and</strong> sample loop <strong>of</strong> the AS-HV are not<br />
compatible with high concentration organic solvents.<br />
Change the sample loop <strong>and</strong> the tub<strong>in</strong>g used to connect<br />
the loop to the sample valve to either sta<strong>in</strong>less steel or<br />
PEEK .<br />
APPENDIx<br />
Us<strong>in</strong>g One Pump Channel <strong>of</strong> a Dual Pump System Instead<br />
<strong>of</strong> the High-Volume Autosampler<br />
If only a few samples need to be analyzed for<br />
phenols, it is possible to use one pump channel <strong>of</strong> a<br />
dual pump system <strong>in</strong>stead <strong>of</strong> the AS-HV autosampler<br />
for sample <strong>in</strong>jection. This configuration is shown <strong>in</strong><br />
Figure 11. Figure 11A shows the system schematic <strong>and</strong><br />
Figure 11B shows the program.<br />
Place the sample <strong>in</strong> an eluent bottle <strong>and</strong> use one pump<br />
<strong>of</strong> the dual pump system to deliver the sample to the SPE<br />
column at a def<strong>in</strong>ed flow rate for a set amount <strong>of</strong> time.<br />
Bypass the degasser with the eluent l<strong>in</strong>es used to deliver<br />
sample to m<strong>in</strong>imize carryover between <strong>in</strong>jections. Clean<br />
eluent l<strong>in</strong>es thoroughly with 100% organic solvent <strong>and</strong><br />
pure water prior to us<strong>in</strong>g this pump channel for other<br />
applications.<br />
Use the left pump as the SPE pump <strong>and</strong> channel C <strong>of</strong><br />
the left pump as an <strong>in</strong>jector. Pump the sample for 6 m<strong>in</strong> at<br />
1 mL/m<strong>in</strong> to deliver 6 mL <strong>of</strong> sample to the SPE column.<br />
Use channels A (0.2mM MSA) <strong>and</strong> B (acetonitrile) <strong>of</strong><br />
the left pump to r<strong>in</strong>se the SPE column <strong>and</strong> elute the<br />
captured phenols. Use the second (right) pump to deliver<br />
the gradient to separate the phenols on the Acclaim<br />
PA column. Figure 12 shows a chromatogram <strong>of</strong> the<br />
separation <strong>of</strong> phenols <strong>in</strong> a spiked tap water sample us<strong>in</strong>g<br />
this setup.<br />
Column: Acclaim PA, 5 µm,<br />
4.6 × 150 mm<br />
Eluent: A: 2.5 mM MSA<br />
B: CH3CN<br />
Flow Rate: 1.0 mL/m<strong>in</strong><br />
Inj. Volume: 6 mL<br />
Temperature: 40 °C<br />
Detection: UV, 280 nm<br />
SPE Column: IonPac NG1, 4 × 35 mm<br />
Sample: Spiked tap water<br />
40<br />
mAU<br />
NG1<br />
1<br />
2<br />
(A) System Schematic<br />
UltiMate DGP-3600<br />
Left Right<br />
3<br />
4<br />
5<br />
6<br />
7<br />
8<br />
9<br />
Acclaim PA<br />
Peaks:<br />
1. Phenol 10 µg/L<br />
2. 4-Nitrophenol 10<br />
3. 2-Chlorophenol 10<br />
4. 2,4-D<strong>in</strong>itrophenol 10<br />
5. 2-Nitrophenol 10<br />
6. 2,4-Dimethylphenol 10<br />
7. 4-Chloro-3-methylphenol 10<br />
8. 2,4-Dichlorophenol 10<br />
9. 4,6-D<strong>in</strong>itro-2-methylphenol 10<br />
10. 2,4,6-Trichlorophenol 10<br />
11. Pentachlorophenol 10<br />
–10<br />
10 15 20 25<br />
M<strong>in</strong>utes<br />
24365<br />
Figure 12. Chromatogram <strong>of</strong> a tap water sample spiked with<br />
10 µg/L phenols, us<strong>in</strong>g one pump channel <strong>of</strong> a dual pump system<br />
<strong>in</strong>stead <strong>of</strong> the AS-HV Autosampler.<br />
10<br />
11<br />
VWD-3400<br />
(B) One Pump Channel <strong>of</strong> Dual Pump System<br />
Figure 11. A) System schematic <strong>and</strong> B) program for us<strong>in</strong>g one pump<br />
channel <strong>of</strong> a dual pump system <strong>in</strong> place <strong>of</strong> the AS-HV Autosampler.<br />
24364<br />
Application Note 191 11
REFERENCES<br />
1. Dr<strong>in</strong>k<strong>in</strong>g Water Directive 80/778/EEC, Commission<br />
<strong>of</strong> the European Communities, 1980.<br />
2. M<strong>in</strong>istry Ord<strong>in</strong>ance No. 15, M<strong>in</strong>istry <strong>of</strong> Health <strong>and</strong><br />
Welfare, Tokyo, Japan, 2000.<br />
3. U.S. EPA Title 40, Chapter 1, Part 141, National<br />
Primary Dr<strong>in</strong>k<strong>in</strong>g Water Regulation.<br />
4. U.S. Environmental Protection Agency. Current<br />
National Recommended Water Quality Criteria.<br />
http://www.epa.gov/waterscience/criteria/wqcriteria.<br />
html (accessed Aug 23, 2007).<br />
5. Fiamegos, Y.C.; Nanos, C.G.; Pilidis, G.A.; Stalikas,<br />
C.D. Phase-Transfer Catalytic <strong>Determ<strong>in</strong>ation</strong><br />
<strong>of</strong> <strong>Phenols</strong> as Methylated Derivatives by Gas<br />
Chromatography with Flame Ionization <strong>and</strong> Mass-<br />
Selective Detection. J. Chromatogr., A 2003, 983,<br />
215-223.<br />
6. U.S. Environmental Protection Agency. 40 CFR<br />
136: Appendix A to Part 136, Methods for Organic<br />
Chemical Analysis <strong>of</strong> Municipal <strong>and</strong> Industrial<br />
Wastewater, Method 604—<strong>Phenols</strong>. C<strong>in</strong>c<strong>in</strong>nati, OH,<br />
1984<br />
7. Peng, X.; Wang, Z;. Yang, C.; Chen, F.; Mai, B.<br />
Simultaneous <strong>Determ<strong>in</strong>ation</strong> <strong>of</strong> Endocr<strong>in</strong>e-Disrupt<strong>in</strong>g<br />
<strong>Phenols</strong> <strong>and</strong> Steroid Estrogens <strong>in</strong> Sediment by Gas<br />
Chromatography–Mass Spectrometry. J. Chromatogr.,<br />
A 2006, 1116, 51-56.<br />
8. Montero, L.; Conradi, S.; Weiss, H.; Popp, P.<br />
<strong>Determ<strong>in</strong>ation</strong> <strong>of</strong> <strong>Phenols</strong> <strong>in</strong> Lake <strong>and</strong> Ground Water<br />
Samples by Stir Bar Sorptive Extraction-Thermal<br />
Desorption-Gas Chromatography-Mass Spectrometry.<br />
J. Chromatogr., A 2005, 1071, 163-169.<br />
9. Saraji, M.; Bakhshi, M. <strong>Determ<strong>in</strong>ation</strong> <strong>of</strong> <strong>Phenols</strong><br />
<strong>in</strong> Water Samples by S<strong>in</strong>gle-Drop Microextraction<br />
Followed by In-Syr<strong>in</strong>ge Derivatization <strong>and</strong> Gas<br />
Chromatography-Mass Spectrometric Detection. J.<br />
Chromatogr., A 2005, 1098, 30-36.<br />
Passion. Power. Productivity.<br />
<strong>Dionex</strong> Corporation<br />
1228 Titan Way<br />
P.O. Box 3603<br />
Sunnyvale, CA<br />
94088-3603<br />
(408) 737-0700<br />
North America<br />
U.S. (847) 295-7500<br />
Canada (905) 844-9650<br />
Europe<br />
Austria (43) 1 616 51 25 Benelux (31) 20 683 9768 (32) 3 353 4294<br />
Denmark (45) 36 36 90 90 France (33) 1 39 30 01 10 Germany (49) 6126 991 0<br />
PEEK is a trademark <strong>of</strong> Victrex PLC.<br />
Milli-Q is a registered trademark <strong>of</strong> Millipore Corporation.<br />
Acclaim, Chromeleon, IonPac, <strong>and</strong> UltiMate are registered trademarks <strong>of</strong> <strong>Dionex</strong> Corporation.<br />
Irel<strong>and</strong> (353) 1 644 0064 Italy (39) 02 51 62 1267 Switzerl<strong>and</strong> (41) 62 205 9966 Taiwan (886) 2 8751 6655<br />
12 <strong>Determ<strong>in</strong>ation</strong> South America <strong>of</strong> <strong>Phenols</strong> <strong>in</strong> Dr<strong>in</strong>k<strong>in</strong>g <strong>and</strong> <strong>Bottled</strong> M<strong>in</strong>eral Waters Us<strong>in</strong>g Onl<strong>in</strong>e<br />
United K<strong>in</strong>gdom (44) 1276 691722<br />
Brazil (55) 11 3731 5140<br />
Solid-Phase Extraction Followed by HPLC with UV Detection<br />
10. Yang, L.; Wang, Z.; Xu, L. Simultaneous<br />
<strong>Determ<strong>in</strong>ation</strong> <strong>of</strong> <strong>Phenols</strong> (Bibenzyl, Phenanthrene,<br />
<strong>and</strong> Fluorenone) <strong>in</strong> Dendrobium Species by High-<br />
Performance Liquid Chromatography with Diode<br />
Array Detection. J. Chromatogr., A 2006, 1104, 230-<br />
237.<br />
11. Vanbeneden, N.; Delvaux, F.; Delvaux, F.R.<br />
<strong>Determ<strong>in</strong>ation</strong> <strong>of</strong> Hydroxyc<strong>in</strong>namic Acids <strong>and</strong><br />
Volatile <strong>Phenols</strong> <strong>in</strong> Wort <strong>and</strong> Beer by Isocratic<br />
High-Performance Liquid Chromatography Us<strong>in</strong>g<br />
Electrochemical Detection. J. Chromatogr., A 2006,<br />
1136, 237-242.<br />
12. Masque, N.; Galia, M.; Marce, R.M.; Borrull,<br />
F. Chemically Modified Polymeric Res<strong>in</strong> Used<br />
as Sorbent <strong>in</strong> a Solid-Phase Extraction Process<br />
to Determ<strong>in</strong>e Phenolic Compounds <strong>in</strong> Water. J.<br />
Chromatogr., A 1997, 771, 55-61.<br />
13. Ye, X.; Kuklenyik, Z.; Needham, L.; Calafat, M.<br />
Automated On-L<strong>in</strong>e Column-Switch<strong>in</strong>g HPLC-<br />
MS/MS Method with Peak Focus<strong>in</strong>g for the<br />
<strong>Determ<strong>in</strong>ation</strong> <strong>of</strong> N<strong>in</strong>e Environmental <strong>Phenols</strong> <strong>in</strong><br />
Ur<strong>in</strong>e. Anal. Chem. 2005, 77, 5407-5413.<br />
14. Masque, N.; Marce, R.M.; Borrull, F.; Comparison<br />
<strong>of</strong> Different Sorbents for On-L<strong>in</strong>e Solid-Phase<br />
Extraction <strong>of</strong> Pesticides <strong>and</strong> Phenolic Compounds<br />
from Natural Water followed by Liquid<br />
Chromatography. J. Chromatogr., A 1998, 793, 257-<br />
263.<br />
15. <strong>Dionex</strong> Corporation. <strong>Phenols</strong>; Application Update<br />
119, LPN 032841-04. Sunnyvale, CA, 2000.<br />
16. <strong>Dionex</strong> Corporation. Environmental Applications.<br />
Acclaim Column Catalog, LPN 1668-02. Sunnyvale,<br />
CA, 2006, pp 34-36.<br />
17. Xuan, D.; Li, Y. <strong>Determ<strong>in</strong>ation</strong> <strong>of</strong> <strong>Phenols</strong> <strong>in</strong><br />
Environmental Water by Solid Phase Extraction <strong>and</strong><br />
High Performance Liquid Chromatography. Ch<strong>in</strong>a<br />
Public Health 2002, 18, 1102-1103.<br />
Asia Pacific<br />
Australia (61) 2 9420 5233 Ch<strong>in</strong>a (852) 2428 3282 India (91) 22 2764 2735<br />
Japan (81) 6 6885 1213 Korea (82) 2 2653 2580 S<strong>in</strong>gapore (65) 6289 1190<br />
www.dionex.com<br />
LPN 1949-02 PDF 04/08<br />
©2008 <strong>Dionex</strong> Corporation