Fruit and Tree Nuts Outlook - Economic Research Service - US ...
Fruit and Tree Nuts Outlook - Economic Research Service - US ...
Fruit and Tree Nuts Outlook - Economic Research Service - US ...

Create successful ePaper yourself
Turn your PDF publications into a flip-book with our unique Google optimized e-Paper software.
FTS-354<br />
Dec. 18, 2012<br />
Contents<br />
Price <strong>Outlook</strong><br />
<strong>Fruit</strong> <strong>and</strong> <strong>Tree</strong><br />
<strong>Nuts</strong> <strong>Outlook</strong><br />
Trade <strong>Outlook</strong><br />
Special article:<br />
Dietary<br />
Assessment of<br />
<strong>Fruit</strong> Consumption<br />
Special article:<br />
Trans-Pacific<br />
Partnership<br />
Contacts <strong>and</strong> Links<br />
Selected Tables<br />
Grower prices<br />
Retail prices<br />
Forecast production<br />
Total citrus<br />
Orange<br />
Grapefruit<br />
Lemon<br />
Supply <strong>and</strong> use<br />
Orange juice<br />
Brazilian O.J.<br />
Grapefruit juice<br />
<strong>Fruit</strong> exports<br />
<strong>Fruit</strong> imports<br />
Topic Page<br />
<strong>Fruit</strong> & <strong>Tree</strong> <strong>Nuts</strong><br />
----------------<br />
The next release is<br />
March 29, 2013<br />
----------------<br />
Approved by the<br />
World Agricultural<br />
<strong>Outlook</strong> Board.<br />
<strong>Fruit</strong> <strong>and</strong> <strong>Tree</strong> <strong>Nuts</strong> <strong>Outlook</strong><br />
Kristy Plattner<br />
kplattner@ers.usda.gov<br />
Agnes Perez<br />
acperez@ers.usda.gov<br />
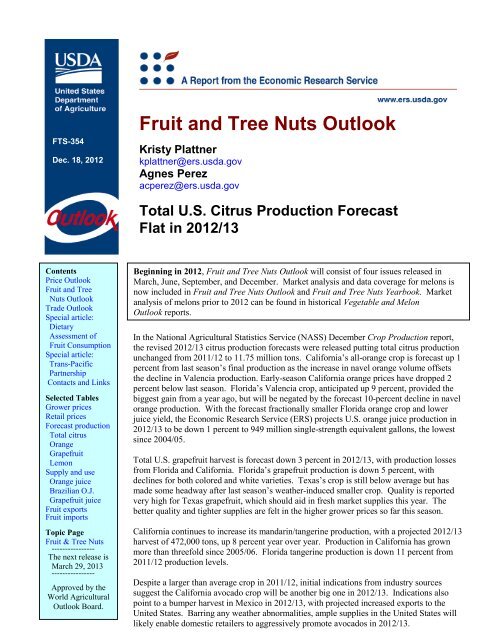
Total U.S. Citrus Production Forecast<br />
Flat in 2012/13<br />
Beginning in 2012, <strong>Fruit</strong> <strong>and</strong> <strong>Tree</strong> <strong>Nuts</strong> <strong>Outlook</strong> will consist of four issues released in<br />
March, June, September, <strong>and</strong> December. Market analysis <strong>and</strong> data coverage for melons is<br />
now included in <strong>Fruit</strong> <strong>and</strong> <strong>Tree</strong> <strong>Nuts</strong> <strong>Outlook</strong> <strong>and</strong> <strong>Fruit</strong> <strong>and</strong> <strong>Tree</strong> <strong>Nuts</strong> Yearbook. Market<br />
analysis of melons prior to 2012 can be found in historical Vegetable <strong>and</strong> Melon<br />
<strong>Outlook</strong> reports.<br />
In the National Agricultural Statistics <strong>Service</strong> (NASS) December Crop Production report,<br />
the revised 2012/13 citrus production forecasts were released putting total citrus production<br />
unchanged from 2011/12 to 11.75 million tons. California’s all-orange crop is forecast up 1<br />
percent from last season’s final production as the increase in navel orange volume offsets<br />
the decline in Valencia production. Early-season California orange prices have dropped 2<br />
percent below last season. Florida’s Valencia crop, anticipated up 9 percent, provided the<br />
biggest gain from a year ago, but will be negated by the forecast 10-percent decline in navel<br />
orange production. With the forecast fractionally smaller Florida orange crop <strong>and</strong> lower<br />
juice yield, the <strong>Economic</strong> <strong>Research</strong> <strong>Service</strong> (ERS) projects U.S. orange juice production in<br />
2012/13 to be down 1 percent to 949 million single-strength equivalent gallons, the lowest<br />
since 2004/05.<br />
Total U.S. grapefruit harvest is forecast down 3 percent in 2012/13, with production losses<br />
from Florida <strong>and</strong> California. Florida’s grapefruit production is down 5 percent, with<br />
declines for both colored <strong>and</strong> white varieties. Texas’s crop is still below average but has<br />
made some headway after last season’s weather-induced smaller crop. Quality is reported<br />
very high for Texas grapefruit, which should aid in fresh market supplies this year. The<br />
better quality <strong>and</strong> tighter supplies are felt in the higher grower prices so far this season.<br />
California continues to increase its m<strong>and</strong>arin/tangerine production, with a projected 2012/13<br />
harvest of 472,000 tons, up 8 percent year over year. Production in California has grown<br />
more than threefold since 2005/06. Florida tangerine production is down 11 percent from<br />
2011/12 production levels.<br />
Despite a larger than average crop in 2011/12, initial indications from industry sources<br />
suggest the California avocado crop will be another big one in 2012/13. Indications also<br />
point to a bumper harvest in Mexico in 2012/13, with projected increased exports to the<br />
United States. Barring any weather abnormalities, ample supplies in the United States will<br />
likely enable domestic retailers to aggressively promote avocados in 2012/13.
Price <strong>Outlook</strong><br />
Strong <strong>Fruit</strong> <strong>and</strong> Nut Grower Prices Sustained<br />
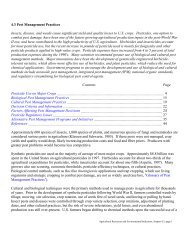
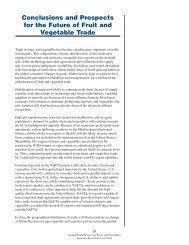
The November fruit <strong>and</strong> tree nut grower price index slipped 3 percent from the<br />
previous month but is up from any corresponding November index since 2005 (fig.<br />
1). At 201 (1990-92=100), it is also the second highest for any month since 2005,<br />
after the record-high 207 reported in October 2012. The higher prices growers<br />
received in November for fresh grapefruit, apples, grapes, pears, <strong>and</strong> strawberries<br />
compared with the same period a year ago provided strength to the index (table 1).<br />
Average fresh strawberry <strong>and</strong> grape prices showed the greatest gains in November,<br />
increasing by more than 50 percent from the same time a year ago. Reduced<br />
strawberry production in California helped boost strawberry prices over this<br />
summer <strong>and</strong> through most of the fall. California strawberry supplies are winding<br />
down by this time of year, providing additional strength to the market. Though<br />
supplies remain light, reports of an earlier harvest in Florida indicate promotable<br />
volume by mid-December. Barring any weather problems, should Florida volumes<br />
rise above a year ago, strawberry grower prices are likely to receive a downward<br />
push during the remainder of this year <strong>and</strong> into early 2013. Favorable weather has<br />
kept table grape production in California fairly unchanged from a year ago <strong>and</strong> with<br />
good quality, thus aiding grower prices, especially as robust dem<strong>and</strong> in export<br />
markets is sustained thus far this season.<br />
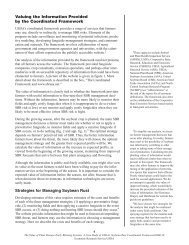
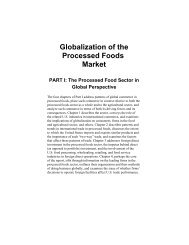
Despite a large harvest of apples in Washington State, strong dem<strong>and</strong> for these<br />
apples in the eastern half of the country where supplies are tight, has led to an<br />
overall boost in fresh apple grower prices through November of the 2012/13<br />
marketing season (August through July). Fresh apple grower prices in Michigan,<br />
New York, Ohio, Pennsylvania, Virginia, <strong>and</strong> Washington were all up sharply than<br />
a year ago in November, based on NASS data (fig. 2). Strong international dem<strong>and</strong><br />
Figure 1<br />
Index of prices received by growers for fruit <strong>and</strong> tree nuts<br />
1990-92=100<br />
220<br />
200<br />
180<br />
160<br />
140<br />
120<br />
100<br />
2010<br />
2012<br />
2011<br />
Average 2005-09<br />
Jan. Apr. July Oct.<br />
Source: <strong>US</strong>DA, National Agricultural Statistics <strong>Service</strong>, Agricultural Prices.<br />
2<br />
<strong>Fruit</strong> <strong>and</strong> <strong>Tree</strong> <strong>Nuts</strong> <strong>Outlook</strong>/FTS-354/December 18, 2012<br />
<strong>Economic</strong> <strong>Research</strong> <strong>Service</strong>, <strong>US</strong>DA
Table 1--Monthly fruit prices received by growers, United States<br />
2011 2012 2011-12 change<br />
Commodity October November October November October November<br />
---------------------Dollars per box ----------------------- Percent<br />
Citrus fruit: 1/<br />
Grapefruit, all 8.67 7.90 13.06 8.49 50.6 7.5<br />
Grapefruit, fresh 10.44 10.09 16.42 12.20 57.3 20.9<br />
Lemons, all 12.87 14.10 15.80 14.57 22.8 3.3<br />
Lemons, fresh 19.50 18.97 19.36 17.36 -0.7 -8.5<br />
Oranges, all 8.47 8.86 8.43 8.46 -0.5 -4.5<br />
Oranges, fresh 11.15 13.99 12.13 14.01 8.8 0.1<br />
------------------Dollars per pound ----------------------<br />
Noncitrus fruit:<br />
Apples, fresh 2/ 0.431 0.344 0.535 0.479 24.1 39.2<br />
Grapes, fresh 2/ 0.395 0.490 0.610 0.750 54.4 53.1<br />
Peaches, fresh 2/ -- -- -- -- -- --<br />
Pears, fresh 2/ 0.267 0.256 0.351 0.343 31.5 34.0<br />
Strawberries, fresh 0.669 0.844 0.901 1.330 34.7 57.6<br />
-- Insufficient number of reports to establish an estimate.<br />
1/ Equivalent on-tree price.<br />
2/ Equivalent packinghouse-door returns for CA, NY (apples only), OR (pears only), <strong>and</strong> WA (apples, peaches,<br />
<strong>and</strong> pears). Prices as sold for other States.<br />
Source: <strong>US</strong>DA, National Agricultural Statistics <strong>Service</strong>, Agricultural Prices <strong>and</strong> Noncitrus <strong>Fruit</strong> <strong>and</strong> <strong>Nuts</strong><br />
2011 Summary.<br />
Figure 2<br />
October fresh apple grower prices are strong relative to a year ago<br />
Dollars per pound<br />
0.800<br />
0.700<br />
2011 2012<br />
0.600<br />
0.500<br />
0.400<br />
0.300<br />
0.200<br />
0.100<br />
0.000<br />
Michigan New York Ohio Pennsylvania Virginia Washington<br />
Source: <strong>US</strong>DA, National Agriculturtal Statistics <strong>Service</strong>, Agricultural Prices, November 2012.<br />
is also aiding the market for U.S. fresh apples. November fresh apple grower prices<br />
averaged $0.479 per pound, down from the October average of $0.535, but 39<br />
percent higher than the November 2011 average. At the same time, reduced<br />
domestic production, strong export dem<strong>and</strong>, <strong>and</strong> lack of competing U.S. fresh<br />
apples all combine to elevate domestic fresh pear prices.<br />
Navel orange <strong>and</strong> lemon harvest is underway. California fresh orange supplies are<br />
running 4 percent above last season through December 1, based on <strong>US</strong>DA<br />
Agricultural Marketing <strong>Service</strong> (AMS) shipment data. Season-to-date lemon<br />
shipments are also ahead. November orange grower prices declined from a year<br />
ago, mostly reflecting declines in processed orange prices. At the same time, fresh<br />
orange prices remained relatively steady averaging $14.01 per box. Lemon<br />
3<br />
<strong>Fruit</strong> <strong>and</strong> <strong>Tree</strong> <strong>Nuts</strong> <strong>Outlook</strong>/FTS-354/December 18, 2012<br />
<strong>Economic</strong> <strong>Research</strong> <strong>Service</strong>, <strong>US</strong>DA
production is on a rebound in Arizona while production remains steady in<br />
California in 2012/13. Partly due to increased production, lemon prices also<br />
declined in November. Both fresh <strong>and</strong> processed grapefruit prices made strong<br />
gains due to high quality <strong>and</strong> lower shipment volumes to date relative to last season.<br />
Retail Fresh <strong>Fruit</strong> Prices Improve<br />
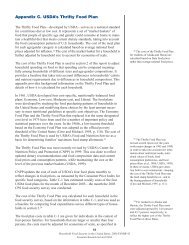
After falling below year-ago levels this summer, the U.S. consumer price index<br />
(CPI) for fresh fruit in October 2012 advanced to 341.7 (1982-1984=100), slightly<br />
improved from the previous month <strong>and</strong> 2 percent above the October 2011 CPI (fig.<br />
3). Year-to-year price gains in grapefruits, lemons, Red Delicious apples, <strong>and</strong><br />
Thompson Seedless grapes at the retail level led to the higher CPI. And, although<br />
October price gains for grapefruits <strong>and</strong> Thompson seedless grapes ranged from 12-<br />
13 percent from a year ago, price declines for navel oranges, bananas, <strong>and</strong><br />
strawberries moderated the overall boost in the October CPI.<br />
Retail prices have increased for grapefruit over the same time last year (table 2).<br />
Similar to the situation with grower prices, lower fresh production out of California<br />
<strong>and</strong> higher quality grapefruit from Texas have pushed prices up. Texas grapefruit<br />
have better appearance, due to less wind scarring <strong>and</strong> pest damage. A drier growing<br />
season has resulted in fruit that are smaller but sweet. Navel orange prices are<br />
down as the 2011/12 marketing year comes to a close. Higher fresh orange imports<br />
over the summer when domestic production was low has brought prices down. As<br />
the 2012/13 season gets under way, prices through the early spring should remain<br />
close to last-season prices with the higher production of California navels <strong>and</strong> as<br />
sizes are so far smaller than last year.<br />
As with grower prices, retail apple prices have held strong through October. Even<br />
with greater imports, light supplies in some regional markets <strong>and</strong> higher exports<br />
strengthened apple retail prices in general. The Bureau of Labor Statistics (BLS)<br />
report the October consumer price index for apples at 340.4 (1982-84=100), up 6<br />
percent from the same time a year ago. As the export market continues to compete<br />
with domestic availability, apple retail prices are likely to remain strong through the<br />
remainder of 2012.<br />
Reduced shipments of California grapes in October from a year ago boosted their<br />
retail prices while increased imports through most of the first 9 months of 2012<br />
helped put downward pressure on banana prices. As banana shipments fell below a<br />
year ago in October, price declines only amounted to less than 1 percent in October,<br />
compared with the 2-percent drop in September on higher imports. AMS shipment<br />
data show continued lower banana shipments in November through early<br />
December, likely driving up retail banana prices for the rest of the year.<br />
4<br />
<strong>Fruit</strong> <strong>and</strong> <strong>Tree</strong> <strong>Nuts</strong> <strong>Outlook</strong>/FTS-354/December 18, 2012<br />
<strong>Economic</strong> <strong>Research</strong> <strong>Service</strong>, <strong>US</strong>DA
Figure 3<br />
Consumer Price Index for fresh fruit<br />
1982-84=100<br />
350.0<br />
340.0<br />
330.0<br />
320.0<br />
310.0<br />
300.0<br />
2011<br />
Average 2005-09<br />
2012<br />
2010<br />
Jan. Mar. May July Sep. Nov.<br />
Source: U.S. Department of Labor, Bureau of Labor Statistics, http://www.bls.gov/data/home.htm.<br />
Table 2--U.S. monthly retail prices for selected fruit, 2011-12<br />
2011 2012 2011-12 change<br />
Commodity Unit September October September October September October<br />
--- Dollars --- --- Dollars --- --- Percent ---<br />
Fresh:<br />
Valencia oranges Pound -- -- -- -- -- --<br />
Navel oranges Pound 1.438 1.386 1.296 1.254 -9.9 -9.5<br />
Grapefruit Pound 1.100 1.094 1.263 1.270 14.8 16.1<br />
Lemons Pound 1.682 1.598 1.615 1.604 -4.0 0.4<br />
Red Delicious apples Pound 1.505 1.409 1.524 1.435 1.3 1.8<br />
Bananas Pound 0.607 0.607 0.597 0.602 -1.6 -0.8<br />
Peaches Pound 1.657 -- 1.683 -- 1.6 --<br />
Anjou pears Pound -- -- -- -- -- --<br />
Strawberries 1/ 12-oz. pint 1.983 2.060 1.936 2.015 -2.4 -2.2<br />
Thompson seedless grapes Pound 1.849 2.079 1.988 2.340 7.5 12.6<br />
Processed:<br />
Orange juice, concentrate 2/ 16-fl. oz. 2.720 2.749 2.610 2.652 -4.0 -3.5<br />
Wine liter 9.233 11.278 9.006 11.796 -2.5 4.6<br />
-- Insufficient marketing to establish price.<br />
1/ Dry pint.<br />
2/ Data converted from 12-fl-oz containers.<br />
Source: U.S. Department of Labor, Bureau of Labor Statistics, http://www.bls.gov/data/home.htm.<br />
5<br />
<strong>Fruit</strong> <strong>and</strong> <strong>Tree</strong> <strong>Nuts</strong> <strong>Outlook</strong>/FTS-354/December 18, 2012<br />
<strong>Economic</strong> <strong>Research</strong> <strong>Service</strong>, <strong>US</strong>DA
<strong>Fruit</strong> <strong>and</strong> <strong>Tree</strong> <strong>Nuts</strong> <strong>Outlook</strong><br />
U.S. Citrus Production 2012/13 Forecast Steady from Last Season<br />
<strong>US</strong>DA’s National Agricultural Statistics <strong>Service</strong> (NASS) released its revised citrus<br />
production forecast for the 2012/13 marketing year in its December Crop<br />
Production report. Total U.S. citrus production is forecast at 11.75 million tons in<br />
2012/13, down 4 percent from the initial October forecast, but relatively unchanged<br />
from the final 2011/12 estimate of 11.74 million tons (table 3). The revised total<br />
reflects downward adjustments to Florida’s production of oranges, grapefruit,<br />
tangerines, <strong>and</strong> tangelos. Total citrus production in Arizona, California <strong>and</strong> Texas<br />
are all anticipated above 2011/12 levels while Florida’s overall crop is projected<br />
down 1 percent, reflecting declines in orange, grapefruit, tangerine, <strong>and</strong> tangelo<br />
production. The smaller <strong>and</strong> lower yielding Florida orange crop is anticipated to<br />
reduce domestic orange juice production this season. The forecasted decline in<br />
grapefruit <strong>and</strong> Valencia production in California was negated by higher supplies of<br />
navel oranges <strong>and</strong> m<strong>and</strong>arins with stable lemon production. Texas total citrus is<br />
estimated at 271,000 tons, up 8 percent from 2011/12’s final citrus estimate of<br />
252,000 tons. Arizona’s citrus crop is forecast to double this year, with lemons<br />
rebounding from the 2011/12 freeze damaged crop to 68,000 tons, but not returning<br />
to 2006/07-2010/11 production average of 90,000 tons.<br />
Table 3--Citrus: Utilized production, 2010/11, 2011/12 <strong>and</strong> forecast for 2012/13 1/<br />
Forecast for Forecast for<br />
Crop <strong>and</strong> State Utilized 2012/13 Utilized 2012/13<br />
2010/11 2011/12 as of 12-2012 2010/11 2011/12 as of 12-2012<br />
---- 1,000 boxes 2/ ---- ----1,000 tons ----<br />
Oranges:<br />
Early/mid-season <strong>and</strong> navel:<br />
California 48,000 45,500 46,500<br />
1,920 1,820 1,860<br />
Florida 3/ 70,300 74,200 67,000<br />
3,164 3,339 3,015<br />
Texas 1,700 1,108 1,130<br />
72<br />
47<br />
48<br />
Total 4/ 120,000 120,808 114,630<br />
5,156 5,206 4,923<br />
Valencia:<br />
California 13,500<br />
Florida 70,000<br />
Texas 249<br />
Total 83,749<br />
All oranges 203,749<br />
Grapefruit:<br />
California 4,100<br />
Florida 19,750<br />
Texas 6,300<br />
All grapefruit 30,150<br />
Tangerines <strong>and</strong> m<strong>and</strong>arins:<br />
Arizona 300<br />
California 9,900<br />
Florida 4,650<br />
All tangerines <strong>and</strong> m<strong>and</strong>arins 14,850<br />
Lemons:<br />
Arizona 2,500<br />
California 21,000<br />
All lemons 23,500<br />
Tangelos<br />
Florida 1,150<br />
13,500<br />
72,400<br />
311<br />
86,211<br />
207,019<br />
4,400<br />
18,850<br />
4,800<br />
28,050<br />
200<br />
10,900<br />
4,290<br />
15,390<br />
750<br />
20,500<br />
21,250<br />
1,150<br />
13,000<br />
79,000<br />
286<br />
92,286<br />
206,916<br />
4,000<br />
18,000<br />
5,280<br />
27,280<br />
200<br />
11,800<br />
3,800<br />
15,800<br />
1,700<br />
20,500<br />
22,200<br />
540<br />
540<br />
520<br />
3,150 3,258 3,555<br />
11<br />
13<br />
12<br />
3,701 3,811 4,087<br />
All citrus 273,399 272,859 273,296<br />
11,734 11,737<br />
1/ The crop year begins with bloom of the first year shown <strong>and</strong> ends with completion of the harvest following year.<br />
2/ Net pounds per box: oranges in California (CA)-80 (75 prior to the 2010-2011 crop year), Florida (FL)-90,<br />
Texas (TX)-85; grapefruit in CA-80 (67 prior to the 2010-11 crop year), FL-85, TX-80; lemons-80 (76 prior to the<br />
2010-11 crop year); tangelos-90; tangerines <strong>and</strong> m<strong>and</strong>arins in AZ <strong>and</strong> CA-80 (75 prior to the 2010-11 crop year), FL-95.<br />
3/ Includes Temples. 4/ Totals may not be equivalent to the sum of the categories due to rounding.<br />
Source: <strong>US</strong>DA, National Agricultural Statistics <strong>Service</strong>, Crop Production, various issues.<br />
1,100<br />
8,857<br />
164<br />
840<br />
252<br />
1,256<br />
12<br />
396<br />
221<br />
629<br />
100<br />
840<br />
940<br />
52<br />
9,017<br />
176<br />
802<br />
192<br />
1,170<br />
8<br />
436<br />
204<br />
9,010<br />
160<br />
766<br />
211<br />
1,137<br />
8<br />
472<br />
181<br />
6<br />
<strong>Fruit</strong> <strong>and</strong> <strong>Tree</strong> <strong>Nuts</strong> <strong>Outlook</strong>/FTS-354/December 18, 2012<br />
<strong>Economic</strong> <strong>Research</strong> <strong>Service</strong>, <strong>US</strong>DA<br />
648<br />
30<br />
820<br />
850<br />
52<br />
661<br />
68<br />
820<br />
888<br />
50<br />
11,746
California’s Orange Crop Fractionally Larger in 2012/13<br />
The NASS forecast has California’s 2012/13 all-orange crop up less than 1 percent<br />
from last seasons’ 2.36 million tons (table 4). The 2-percent increase in navel<br />
production will just offset the nearly 4-percent decline in Valencia production, to<br />
total 2.38 million tons. Valencia harvest is estimated at 520,000 tons, down from<br />
540,000 tons <strong>and</strong> representing 22 percent of California’s total orange harvest.<br />
Despite a decline in acreage <strong>and</strong> smaller fruit size, the navel crop is larger due to a<br />
larger average fruit set per tree of 344. Estimated bearing acreage in 2012/13, at<br />
131,000 acres, was slightly less than in 2011/12. The average fruit size is also<br />
smaller at 2.195 inches in diameter, down 3 percent as estimated in the California’s<br />
Navel Orange Objective Measurement Report released in September.<br />
The navel harvest began in late October, an earlier start than the previous season.<br />
The more timely harvest is evident with the 13-percent increase in shipments<br />
reported by AMS through late November, over the same period last year. Harvest<br />
volumes have picked up through November <strong>and</strong> the cooler temperatures have<br />
brought about better external color, increasing quality. Total orange imports have<br />
tapered off in November, with only Spain sending shipments in the last week of<br />
November. Overall imports are up 3 percent this season through the end of<br />
November but recent imports should not interfere with domestic orange production<br />
as major importers (Australia, Chile, <strong>and</strong> South Africa) have finished shipments for<br />
the season.<br />
Three more Asian citrus psyllids (ACP) were found in California, at separate groves<br />
within Tulare County in November <strong>and</strong> December. This is the insect capable of<br />
spreading the huanglongbing bacteria (HLB) or citrus greening disease, which was<br />
found earlier in the year in the Hacienda Heights suburb of Los Angeles.<br />
Quarantine of citrus movement has been evoked in Hacienda Heights <strong>and</strong> 163square<br />
mile quarantine in Tulare, which is the top citrus-producing county in<br />
California. It is unknown if any of the ACP carried HLB <strong>and</strong> there is no sign of<br />
infected trees, but as HLB has no known cure, it is considered a major threat which<br />
requires aggressive preventative action.<br />
Table 4--Oranges: Utilized production, 2009/10-2011/12 <strong>and</strong> forecast for 2012/13 1/<br />
Crop <strong>and</strong> State Forecast Forecast<br />
Utilized 2012/13 Utilized 2012/13<br />
2009/10 2010/11 2011/12 as of 12-2012 2009/10 2010/11 2011/12 as of 12-2012<br />
--1,000 boxes 2/ -- --1,000 short tons --<br />
Oranges:<br />
Early/mid-season <strong>and</strong> navel 3/:<br />
Arizona -- -- -- -- -- -- -- --<br />
California 42,500 48,000 45,500 46,500 1,594 1,920 1,820 1,860<br />
Florida 68,600 70,300 74,200 67,000 3,087 3,164 3,339 3,015<br />
Texas 1,360 1,700 1,108 1,130<br />
58 72 47 48<br />
Total 112,460 120,000 120,808 114,630 4,739 5,156 5,206 4,923<br />
Valencia:<br />
Arizona -- -- -- -- -- -- -- --<br />
California 15,000 14,500 13,500 13,000<br />
562 540 540 520<br />
Florida 65,100 70,200 72,400 79,000 2,930 3,150 3,258 3,555<br />
Texas 275 249 311 286<br />
12 11 13 12<br />
Total 80,375 84,949 86,211 92,286 3,504 3,701 3,811 4,087<br />
All oranges 192,835 204,949 207,019 206,916 8,243 8,857 9,017 9,010<br />
-- = Data not available.<br />
1/ The crop year begins with bloom of the first year shown <strong>and</strong> ends with completion of harvest the following year.<br />
2/ Net pounds per box: Arizona <strong>and</strong> California--75 prior to 2010/11, 80 thereafter, Florida--90, <strong>and</strong> Texas--85.<br />
3/ Navel <strong>and</strong> miscellaneous varieties in California <strong>and</strong> Arizona, <strong>and</strong> early- <strong>and</strong> mid-season (including navel) varieties<br />
in Florida <strong>and</strong> Texas. A small quantity of tangerines is also included in Texas' data.<br />
Source: <strong>US</strong>DA, National Agricultural Statistics <strong>Service</strong>, Crop Production Report.<br />
7<br />
<strong>Fruit</strong> <strong>and</strong> <strong>Tree</strong> <strong>Nuts</strong> <strong>Outlook</strong>/FTS-354/December 18, 2012<br />
<strong>Economic</strong> <strong>Research</strong> <strong>Service</strong>, <strong>US</strong>DA
Slight Increase in California Orange Production Should Keep<br />
Prices Stable<br />
The 2-percent increase in production of California navel oranges <strong>and</strong> the smaller<br />
sizes reported by NASS suggest a leveling off to slightly lower grower prices in<br />
2012/13. Prior to the start of the 2012/13 navel season, California Valencia prices<br />
were receiving higher prices due to tight end-of-season supplies. When the navel<br />
season started in November, California grower prices started to dip below last<br />
season’s price by 2 percent. These lower prices are also being felt at the retail level,<br />
with AMS data showing advertised retail prices in November for navel oranges<br />
down 6 percent per fruit from a year ago.<br />
Florida Orange Harvest Fractionally Smaller in 2012/13<br />
The 2012/13 Florida all-orange crop is down less than 1 percent from last season to<br />
6.57 million tons. Production of early, midseason <strong>and</strong> navel varieties is forecast<br />
down 10 percent to 3.02 million tons, from 3.34 million tons last season, while the<br />
Valencia crop is forecast 9 percent larger to total 3.56 million tons. The citrus<br />
growing region is just beginning to experience some drought with ongoing harvest<br />
of navels, early, midseason, <strong>and</strong> temples through early December. The Florida<br />
NASS Field Office reported that some trees are struggling to maintain healthy,<br />
growing fruit sets this season which explains the decline in forecast production.<br />
The Florida Citrus Administrative Committee (FCAC) reports that less than 45<br />
percent of navels have been harvested <strong>and</strong> only 4 percent of early, midseason, <strong>and</strong><br />
temples have been harvested through November. Both are slightly behind last<br />
season’s harvest rate over the same period. Navel oranges are running smaller than<br />
the previous season with 10 percent sizing 125’s, compared to only 3 percent last<br />
season, <strong>and</strong> 7 percent sizing 163’s or greater compared to just 1 percent last year.<br />
The non-Valencia crop is also smaller with 48 percent sizing 163 or more per<br />
bushel, compared to just 20 percent in 2011/12. The Florida Department of Citrus<br />
(FDOC) in the annual Florida Citrus <strong>Outlook</strong> 2012-13 Season report, estimates that<br />
prices will decline this year for non-Valencia <strong>and</strong> Valencia oranges, due to smaller<br />
fruit sizes. FDOC projects average processed on-tree prices at $6.04 per box for<br />
early <strong>and</strong> midseason varieties <strong>and</strong> $6.93 per box for Valencias, compared to $6.90<br />
<strong>and</strong> $8.80, respectively in 2011/12.<br />
U.S. Orange Juice Production Forecast to Decline<br />
ERS forecast U.S. orange juice production in 2012/13 at 949 million single-strength<br />
equivalent (sse) gallons, down 1percent from last season (table 5). This decline is<br />
attributed to the forecast reduced crop in Florida <strong>and</strong> the projected 1 percent decline<br />
in juice yield to 1.61 gallons per box. Imports are forecast to increase slightly to<br />
225 million sse gallons but growth will be limited by a decline in Brazilian orange<br />
juice production this year. In 2011/12, orange juice stocks rose 11 percent higher<br />
than the previous season to end at 449 million sse gallons. With the higher<br />
beginning stocks in 2012/13, total supplies are projected 2 percent larger at 1.62<br />
billion sse gallons. Exports are projected to rise only slightly (up 2 percent) to 155<br />
million sse gallons, as the slightly larger U.S. orange juice supply is used to meet<br />
domestic dem<strong>and</strong> <strong>and</strong> maintain stock levels. Nielsen retail sales data from the<br />
FDOC shows a 3-percent decline in sales through the first month of the marketing<br />
8<br />
<strong>Fruit</strong> <strong>and</strong> <strong>Tree</strong> <strong>Nuts</strong> <strong>Outlook</strong>/FTS-354/December 18, 2012<br />
<strong>Economic</strong> <strong>Research</strong> <strong>Service</strong>, <strong>US</strong>DA
Table 5--United States: Orange juice supply <strong>and</strong> utilization, 1990/91 to date<br />
Beginning Domestic Ending Per capita<br />
Season 1/ stocks Production Imports Supply Exports consumption stocks 2/ consumption<br />
-------------------------------------Million sse gallons 3/ -------------------------------------------------<br />
Gallons<br />
1990/91 225 876 320 1,422 94 1,170<br />
1991/92 158 930 286 1,374 107 1,096<br />
1992/93 170 1,207 324 1,701 114 1,337<br />
1993/94 249 1,133 405 1,787 107 1,320<br />
1994/95 360 1,257 198 1,815 117 1,264<br />
1995/96 434 1,271 261 1,967 119 1,431<br />
1996/97 417 1,437 256 2,110 148 1,398<br />
1997/98 564 1,555 281 2,400 150 1,571<br />
1998/99 679 1,236 350 2,265 147 1,585<br />
1999/00 534 1,493 339 2,366 146 1,575<br />
2000/01 645 1,387 258 2,291 123 1,470<br />
2001/02 698 1,433 189 2,321 181 1,447<br />
2002/03 692 1,250 291 2,233 103 1,426<br />
2003/04 705 1,467 222 2,393 123 1,448<br />
2004/05 822 974 358 2,153 119 1,411<br />
2005/06 623 986 299 1,909 138 1,312<br />
2006/07 459 889 399 1,747 123 1,248<br />
2007/08 376 1,156 406 1,938 136 1,155<br />
2008/09 647 1,060 317 2,025 125 1,206<br />
2009/10 694 840 328 1,862 147 1,158<br />
2010/11 558 919 265 1,742 210 1,128<br />
2011/12 404 959 223 1,586 152 985<br />
2012/13 f/<br />
f = forecast.<br />
449 949 225 1,622 155 1,017<br />
1/ Season begins in December of the first year shown. As of 1998/99, season begins the first week of October.<br />
2/ Data may not add due to rounding. Beginning with 1994/95, stock data include chilled as well as canned <strong>and</strong><br />
frozen concentrate juice. 3/ SSE = single-strength equivalent.<br />
Source: <strong>US</strong>DA, <strong>Economic</strong> <strong>Research</strong> <strong>Service</strong>.<br />
158 4.6<br />
170 4.3<br />
249 5.2<br />
360 5.0<br />
434 4.8<br />
417 5.3<br />
564 5.2<br />
679 5.7<br />
534 5.7<br />
645 5.6<br />
698 5.2<br />
692 5.0<br />
705 4.9<br />
822 5.0<br />
623 4.8<br />
459 4.4<br />
376 4.2<br />
647 3.8<br />
694 3.9<br />
558 3.7<br />
404 3.6<br />
449 3.1<br />
450 3.2<br />
season, compared to the same period last year. However, with the anticipated<br />
increased supply <strong>and</strong> little growth in exports, domestic consumption is projected at<br />
1.02 billion gallons, up 3 percent from 2011/12’s low.<br />
Brazilian Orange Juice Production Buffered by Higher Inventories<br />
According to <strong>US</strong>DA Foreign Agricultural <strong>Service</strong> (FAS) Production, Supply <strong>and</strong><br />
Distribution database, the combined U.S. <strong>and</strong> Brazilian orange juice production<br />
accounts for 88 percent of total global supplies. Brazil accounts for 57 percent of<br />
global production <strong>and</strong> exports 80 percent of the world’s orange juice. The United<br />
States produces a third of the world’s orange juice but only accounts for 7 percent<br />
of total exports.<br />
Brazil’s orange juice production is expected to decline 15 percent to 1.8 billion sse<br />
gallons in 2012/13, according to FAS (table 6). The decline in production is<br />
buffered by the large beginning stocks, bringing total supply less than 1 percent<br />
above 2011/12’s levels. Beginning stocks in 2011/12 were nearly depleted but<br />
higher production <strong>and</strong> lower exports allowed for inventories to be rebuilt by the end<br />
of the season. The drop in 2012/13 production in the Sao Paulo <strong>and</strong> Minas Gerais<br />
areas is most likely due to the off-year cycle for some orange varieties. With the<br />
decline in production, the FDOC forecast a 3-percent increase in juice yields to 1.38<br />
per box from Sao Paulo citrus. Exports are expected to be 2 percent stronger this<br />
season as Brazil can pull from higher stocks. However, FDOC projects a decrease<br />
9<br />
<strong>Fruit</strong> <strong>and</strong> <strong>Tree</strong> <strong>Nuts</strong> <strong>Outlook</strong>/FTS-354/December 18, 2012<br />
<strong>Economic</strong> <strong>Research</strong> <strong>Service</strong>, <strong>US</strong>DA
Table 6--Brazilian orange juice production <strong>and</strong> utilization, 1991 to date.<br />
Season 1/ Beginning Domestic Ending<br />
stocks Production consumption Exports stocks 2/<br />
--Million sse gallons 3/ --<br />
1991 177 1,334<br />
25<br />
1,390<br />
1992 96 1,610<br />
25<br />
1,532<br />
1993 148 1,572<br />
25<br />
1,546<br />
1994 148 1,583<br />
31<br />
1,482<br />
1995 218 1,525<br />
25<br />
1,476<br />
1996 242 1,620<br />
24<br />
1,660<br />
1997 177 1,954<br />
22<br />
1,778<br />
1998 331 1,712<br />
26<br />
1,600<br />
1999 418 1,912<br />
22<br />
1,821<br />
2000 486 1,683<br />
21<br />
1,778<br />
2001 370 1,375<br />
21<br />
1,511<br />
2002 212 1,904<br />
21<br />
1,757<br />
2003 337 1,618<br />
25<br />
1,852<br />
2004 79 2,084<br />
28<br />
1,992<br />
2005 142 1,807<br />
32<br />
1,891<br />
2006 25 2,024<br />
39<br />
1,989<br />
2007 21 2,061<br />
43<br />
1,808<br />
2008 231 1,831<br />
47<br />
1,776<br />
2009 240 1,773<br />
47<br />
1,787<br />
2010 178 1,525<br />
49<br />
1,634<br />
2011 21 2,054<br />
56<br />
1,685<br />
2012 334 1,755<br />
58<br />
1,713<br />
f = forecast. 1/ Season begins in July. 2/ Data may not add due to rounding.<br />
3/ sse = single-strength equivalent. To convert to metric tons at 65 degrees brix,<br />
divide by 1.40588. Beginning in 2007, divide by 1.3926.<br />
Source: <strong>US</strong>DA, Foreign Agricultural <strong>Service</strong>, Brazil Citrus Semi Annual reports.<br />
in Brazil’s shipments to North American Free Trade Agreement (NAFTA)<br />
countries. This projection has weighed in ERS’s forecasted change in imports<br />
for 2012/13.<br />
U.S. Grapefruit Production Forecast To Decrease in 2012/13<br />
The U.S. grapefruit crop is forecast at 1.14 million tons, down 3 percent from last<br />
season’s total of 1.17 million tons (table 7). Florida is projected to reduce<br />
production by 5 percent to 766,000 tons, accounting for 70 percent of all grapefruit<br />
production. Texas is expected to rebound back from 2011/12’s drought reduced<br />
harvest of 192,000 tons increasing 10 percent to 211,000 tons. California is forecast<br />
to reduce production by 9 percent this season to 160,000 tons. Overall, Texas <strong>and</strong><br />
California account for 17 percent <strong>and</strong> 13 percent of total production, respectively.<br />
Florida’s grapefruit crop is down this season due to a decline in acreage (down 2<br />
percent from 2011/12) <strong>and</strong> smaller fruit size. <strong>Fruit</strong> sizes are expected smaller (more<br />
grapefruit falling in the 63’s or more per bushel size range) this season due to a<br />
larger fruit set. Colored grapefruit production is down 4 percent this year <strong>and</strong> white<br />
grapefruit down 7 percent. Combined, this could be the smallest grapefruit harvest<br />
since 2004/05. Harvest is ongoing since it started in mid-September, a little later<br />
start than last season <strong>and</strong> shipments through late November are down 1 percent,<br />
96<br />
148<br />
148<br />
218<br />
242<br />
177<br />
331<br />
418<br />
486<br />
370<br />
212<br />
337<br />
79<br />
142<br />
25<br />
21<br />
231<br />
240<br />
178<br />
21<br />
334<br />
318<br />
10<br />
<strong>Fruit</strong> <strong>and</strong> <strong>Tree</strong> <strong>Nuts</strong> <strong>Outlook</strong>/FTS-354/December 18, 2012<br />
<strong>Economic</strong> <strong>Research</strong> <strong>Service</strong>, <strong>US</strong>DA
Table 7--Grapefruit: Utilized production, 2009/10-2011/12 <strong>and</strong> forecasted 2012/13 1/<br />
Forecast for Forecast for<br />
Crop <strong>and</strong> Utilized 2012/13 as Utilized 2012/13 as<br />
State 2009/10 2010/11 2011/12 of 10-2012 2009/10 2010/11 2011/12 of 10-2012<br />
--1,000 boxes 2/-- --1,000 short tons--<br />
Florida, all 20,300<br />
Colored 14,300<br />
White 6,000<br />
19,750<br />
13,900<br />
5,850<br />
18,850<br />
13,500<br />
5,350<br />
18,000<br />
13,000<br />
5,000<br />
Arizona 3/ 3/ 3/ 3/ 3/ 3/ 3/ 3/<br />
California 4,500 4,310 4,400 4,000 151 172 176 160<br />
Texas 5,600 6,300 4,800 5,280 224 252 192 211<br />
Total 30,400 30,360 28,050 27,280 1,238 1,264 1,170<br />
1/ The crop year begins with bloom of the first year shown <strong>and</strong> ends with completion of harvest the following year.<br />
2/ Net pounds per box: California <strong>and</strong> Arizona-67 prior to 2010/11, 80 thereafter, Florida-85, <strong>and</strong> Texas-80.<br />
3/ Estimtes discontinued beginning with the 2009/10 crop year.<br />
Source: <strong>US</strong>DA, National Agricultural Statistics <strong>Service</strong>, Crop Production Report.<br />
according to AMS. Harvest so far is lagging behind last season, with 89 percent of<br />
all grapefruits still left to be harvested, compared to 84 percent in 2011/12. White<br />
grapefruit exports are above last season by 9 percent while colored grapefruit<br />
exports are down 15 percent through late November. Domestic shipments<br />
(including Canada) are showing the opposite, with white grapefruit shipments<br />
lagging <strong>and</strong> colored grapefruit shipments up 19 percent.<br />
With supplies of grapefruit slightly behind last year, the FCAC reports free-onboard<br />
(f.o.b.) prices for both white <strong>and</strong> red seedless grapefruit up from last year.<br />
Through November 25, prices are averaging $15.36 per 4/5 bushel box for white<br />
seedless grapefruit, compared to $12.57 per 4/5 bushel last season. Even red<br />
seedless is experiencing stronger prices this season with an average through late<br />
November of $13.72 per 4/5 bushel, 21 percent above f.o.b. prices for the same<br />
period last year. Prices should remain above last season due to tighter supplies<br />
across all grapefruit markets.<br />
Grapefruit production in Texas has gained ground with production at 211,000 tons,<br />
a 10-percent increase from last season’s drought stricken crop. Although crop size<br />
has improved, the harvest remains 6 percent below the previous 5-year average.<br />
The expected larger crop is evident in the increased shipping volumes through late<br />
November, up 7 percent, according to AMS. Overall quality is excellent, with less<br />
cosmetic deficiencies, but sizes are smaller due to the dry conditions during crop<br />
development. Recent rains have aided in increasing fruit size, so late-season fruit<br />
should size up better than fruit harvested earlier this season.<br />
Grapefruit Juice Supply Expected To Strengthen in 2012/13<br />
Total U.S. production of grapefruit juice in 2012/13 is forecast almost unchanged<br />
from last season to 76.4 million sse gallons. More grapefruit is projected to be<br />
destined for the processing sector this season due to the smaller fruit size in Florida<br />
<strong>and</strong> increased production in Texas (table 8). An anticipated 60 percent of Florida<br />
grapefruits <strong>and</strong> 44 percent of Texas fruits will enter the processing market, a slight<br />
increase for both markets compared with the previous season.<br />
863<br />
608<br />
255<br />
840<br />
591<br />
249<br />
802<br />
574<br />
228<br />
766<br />
553<br />
213<br />
1,137<br />
11<br />
<strong>Fruit</strong> <strong>and</strong> <strong>Tree</strong> <strong>Nuts</strong> <strong>Outlook</strong>/FTS-354/December 18, 2012<br />
<strong>Economic</strong> <strong>Research</strong> <strong>Service</strong>, <strong>US</strong>DA
Table 8--U.S. grapefruit juice: Supply <strong>and</strong> utilization, 1990/91 to date<br />
Supply Utilization<br />
Season 1/ Beginning Ending Consumption<br />
Production Imports stocks 2/ Total supply stocks Exports 3/ Total Per capita<br />
-- Million gallons, single-strength equivalent -- Gallons<br />
1990/91 129.0 1.5 62.6 193.1 45.1 16.4 131.6 0.52<br />
1991/92 119.5 4.2 45.1 168.9 42.1 23.2 103.6 0.40<br />
1992/93 186.3 1.9 42.1 230.4 74.3 22.0 134.0 0.52<br />
1993/94 168.5 0.9 74.3 243.7 63.6 17.4 162.7 0.62<br />
1994/95 190.8 0.9 63.6 255.2 76.2 22.1 157.0 0.59<br />
1995/96 171.5 0.5 76.2 248.2 69.4 26.8 152.0 0.56<br />
1996/97 192.0 0.2 69.4 261.5 89.6 21.3 150.7 0.55<br />
1997/98 166.0 0.2 89.6 255.8 67.8 18.1 166.7 0.60<br />
1998/99 170.9 1.3 67.8 240.0 54.3 25.3 160.3 0.57<br />
1999/2000 203.4 4.1 54.3 262.7 81.9 32.6 147.8 0.52<br />
2000/01 184.9 0.9 81.9 267.7 74.8 39.0 153.9 0.54<br />
2001/02 180.4 0.3 74.8 255.5 83.6 36.3 135.7 0.47<br />
2002/03 141.6 0.4 83.6 225.6 71.7 38.3 115.6 0.40<br />
2003/04 147.8 0.5 71.7 220.0 65.5 42.3 112.2 0.38<br />
2004/05 50.7 11.5 65.5 127.6 35.5 23.9 68.2 0.23<br />
2005/06 80.8 5.6 35.5 121.9 42.0 18.7 61.2 0.20<br />
2006/07 121.4 0.9 42.0 164.4 57.9 20.2 86.3 0.29<br />
2007/08 109.2 0.3 57.9 167.4 59.8 16.1 91.6 0.30<br />
2008/09 83.6 0.5 59.8 143.9 47.8 15.6 80.5 0.26<br />
2009/10 77.1 0.6 47.8 125.5 44.7 12.8 68.0 0.22<br />
2010/11 83.9 0.4 44.7 128.9 36.5 15.8 76.6 0.25<br />
2011/12 76.9 0.5 36.6 114.1 39.9 15.0 59.2 0.19<br />
2012/13 f/ 76.4 0.6 39.9 116.9 38.0 15.1 63.8 0.20<br />
1/ As of 1998/99, season begins in October. Previously, it began in December.<br />
2/ Stock data were adjusted beginning with 1989/90 ending stock data to more accurately reflect<br />
Florida inventories. 3/ Exports include shipments to territories until 1986/87. f/ = forecast.<br />
Source: <strong>US</strong>DA, <strong>Economic</strong> <strong>Research</strong> <strong>Service</strong> calculations.<br />
With domestic grapefruit juice production flat, larger beginning stocks will boost<br />
total supply by 2 percent to 116.8 million sse gallons—still lower than average.<br />
Imports are expected to increase this season, while exports will remain steady,<br />
similar to the past 2 seasons. Both supply <strong>and</strong> domestic use experienced record<br />
lows in 2011/12. Ending stocks are anticipated to decline 5 percent in 2012/13,<br />
drawn down to supplement increased domestic use. ERS forecasts per capita<br />
domestic use to increase slightly from the record-low 0.19 gallons per person in<br />
2011/12 to 0.201 gallons per person.<br />
U.S. Lemon Production 4 percent Above Last Season<br />
The 2012/13 lemon harvest is forecast to increase over last year’s freeze-damaged<br />
crop to 888,000 tons (table 9). The increase in production represents a 4-percent<br />
increase over last season <strong>and</strong> is 6 percent higher than the 2007/08-2011/12 average<br />
of 837,000 tons. The Arizona lemon crop has more than doubled from the 2011/12<br />
harvest of 30,000 tons to a forecast 68,000 tons in 2012/13. Overall, the upcoming<br />
harvest is 12 percent under the previous 5-year average of 77,000 tons. Harvest of<br />
lemons in central <strong>and</strong> western Arizona began in mid-November with reported<br />
shipment volumes matching the larger crop, according to AMS data. So far through<br />
mid-November, Arizona lemon shipments are up threefold compared to the same<br />
time last season. While Arizona is anticipating a larger lemon crop, California’s<br />
lemon crop is expected to remain unchanged at 820,000 tons. Nonetheless,<br />
California’s current crop estimate is 8 percent stronger than the most recent 5-year<br />
12<br />
<strong>Fruit</strong> <strong>and</strong> <strong>Tree</strong> <strong>Nuts</strong> <strong>Outlook</strong>/FTS-354/December 18, 2012<br />
<strong>Economic</strong> <strong>Research</strong> <strong>Service</strong>, <strong>US</strong>DA
Table 9--Lemons: Utilized production, 2009/10-2011/12 <strong>and</strong> forecast for 2012/13 1/<br />
Forecast for Forecast for<br />
Utilized 2012/13 as Utilized 2011/12 as<br />
State 2009/10 2010/11 2011/12 of 12-2012 2/ 2008/09 2009/10 2010/11 of 12-2012<br />
---1,000 boxes 2/--- ---1,000 short tons---<br />
Arizona 2,200 2,500 750 1,700 84 100 30 68<br />
California 21,000 20,500 20,500 20,500 798 820 820 820<br />
Total 23,200 23,500 21,250 22,200 882 920 850 888<br />
1/ The crop year begins with bloom of the first year shown <strong>and</strong> ends with completion of harvest the following year.<br />
2/ 76 pound boxes prior to 2010/11, 80 pounds thereafter.<br />
Source: <strong>US</strong>DA, National Agricultural Statistics <strong>Service</strong>, Crop Production Report.<br />
average. Lemon harvest began in California in mid-July, along the southern coast,<br />
with harvest continuing through November. AMS shipments report an 11-percent<br />
lower quantity shipped through mid-November compared to the same time period<br />
in 2011.<br />
Total lemon shipments (California <strong>and</strong> Arizona) are down 4 percent through mid-<br />
November but as the season progresses shipments should pick up. Imports for the<br />
season through the second week of November are down by 15 percent, according to<br />
AMS data. Imports based on U.S. Census Bureau data are also down this season<br />
through September. Over the past 5 years, an average of 46 percent of lemon<br />
imports occurred in the first 2 months of the marketing year. Overall lemon imports<br />
this season are expected to be lower, based on data from the first 2 months <strong>and</strong> on<br />
trade being 21 percent lower this season through September. These declining<br />
shipments have had a mixed effect on retail prices, with the Bureau of Labor<br />
Statistics U.S. city average price weakening since August but remaining above last<br />
year’s October retail price. Should the U.S. lemon supply continue to arrive at<br />
higher market volumes than last season, prices will likely be below 2011/12<br />
monthly prices.<br />
2012/13 Production of M<strong>and</strong>arins/Tangerines Forecast at a Record High<br />
Production of m<strong>and</strong>arins/tangerines continue to increase, setting a record high<br />
harvest, if realized. Production is slated at 661,000 tons, up 2 percent from 2011/12<br />
final harvest total of 648,000 tons <strong>and</strong> 15 percent above the 2007/08-2011/12<br />
average of 574,000 tons (table 10). California is the largest producer of m<strong>and</strong>arins<br />
averaging 64 percent of total production during 2008/09-2012/13.<br />
The largest year-over-year gains are expected in California, with production<br />
forecast up 8 percent to 472,000 tons. Florida’s production is estimated to decline<br />
by 11 percent to 181,000 tons <strong>and</strong> remains below the previous 5-year average of<br />
216,000 tons. Arizona’s m<strong>and</strong>arin production will remain at 8,000 tons, a third<br />
below the 5-year average of 12,000 tons.<br />
Florida’s NASS field office reports continuing declines in tangerine acreage in<br />
2012, down 5 percent from 2011 to 18,384 acres, <strong>and</strong> down 64 percent since 2000.<br />
Difficulty with diseases has been a major cause of the substantial decrease in<br />
acreage. Competition from international growers <strong>and</strong> l<strong>and</strong> conversion to<br />
development, have also contributed to the decrease. Tangelo production is forecast<br />
4 percent below last season with 50,000 tons.<br />
13<br />
<strong>Fruit</strong> <strong>and</strong> <strong>Tree</strong> <strong>Nuts</strong> <strong>Outlook</strong>/FTS-354/December 18, 2012<br />
<strong>Economic</strong> <strong>Research</strong> <strong>Service</strong>, <strong>US</strong>DA
Table 10--Other citrus: Utilized production, 2009/10-2011/12 <strong>and</strong> forecast for 2012/13 1/<br />
Forecast for Forecast for<br />
Crop <strong>and</strong> State Utilized 2012/13 as Utilized 2012/13 as<br />
2009/10 2010/11 2011/12 of 12-2012 2009/10 2010/11 2011/12 of 12-2012<br />
------------------------1,000 boxes 2/------------------------- -----------------------1,000 short tons-------------------<br />
Tangelos:<br />
Florida 900 1,150 1,150 1,100<br />
41 52 52 50<br />
Tangerines:<br />
Arizona 350 300 200<br />
200<br />
13 12 8 8<br />
California 9,900 10,600 10,900 11,800<br />
371 396 436 472<br />
Florida 4,450 4,650 4,290 3,800<br />
211 221 204 181<br />
Total 14,700 15,550 15,390 15,800 595 629 648 661<br />
1/ The crop year begins with bloom of the first year shown <strong>and</strong> ends with completion of harvest the following year.<br />
2/ Net pound per box: tangerines--California <strong>and</strong> Arizona--75 prior to 2010/11, 80 thereafter; Florida--95; tangelos--90;<br />
Source: <strong>US</strong>DA, National Agricultural Statistics <strong>Service</strong>, Crop Production Report .<br />
Favorable weather conditions have led to harvest starting in late September for<br />
Fallglo tangerine varieties, with 100 percent of the fruit harvested by mid-<br />
November, according to the FCAC. Sunburst harvest started around mid-October, a<br />
week ahead of last season’s harvest start, but that production has resulted in<br />
identical harvest quantities through mid-November. The FDOC is reporting a 5percent<br />
increase in shipments so far this season through November 4. FDOC is also<br />
forecasting another year of declined revenues for specialty citrus, earning a total of<br />
$35.8 million compared to last season’s $38.6 million. Although the crop is of<br />
high-quality, lower revenues may be partly reflective of the smaller crop.<br />
According to some industry sources, the early <strong>and</strong> strong start to the tangerine<br />
season is causing concern about a possible supply gap between the end of Sunburst<br />
harvest <strong>and</strong> the beginning of late-season honey tangerines.<br />
California production of m<strong>and</strong>arin/tangerines continues to rise, with production<br />
estimated at 472,000 tons, 8 percent above last season’s total. A 13-percent<br />
increase in bearing acreage since 2010 has led to higher production levels. There<br />
are currently over 4,000 acres coming into production in 2012. While bearing<br />
acreage has increased, nonbearing acreage in 2012 has dipped substantially below<br />
last year’s 2,022 nonbearing acres to just 602 acres planted. As of mid-November,<br />
harvest was ongoing in tangerine/m<strong>and</strong>arin orchards.<br />
Ample Avocado Supplies Likely To Repeat in 2012/13<br />
Despite a larger than average crop in 2011/12, initial indications from industry<br />
sources suggest California avocado production will be another big one in 2012/13.<br />
While there will be fruit on the trees this fall, harvest will not take off until the<br />
spring, reaching peak volumes over the summer. Therefore, given that the 2011/12<br />
harvest in California ended in late October, domestic dem<strong>and</strong> during the remainder<br />
of this fall <strong>and</strong> winter will be fulfilled mainly by imports.<br />
With Mexico’s growing presence in the U.S. avocado market, Chilean market share<br />
has declined significantly in the past 5 to 7 years. Since 2007, about two-tenths of<br />
all avocados exported to the United States have come from Chile each year.<br />
Chilean avocado producers have broadened their market instead in Europe <strong>and</strong><br />
South America. According to industry sources, Chile’s exports to the United States<br />
are likely to be reduced in 2012/13, influenced by drought conditions there during<br />
14<br />
<strong>Fruit</strong> <strong>and</strong> <strong>Tree</strong> <strong>Nuts</strong> <strong>Outlook</strong>/FTS-354/December 18, 2012<br />
<strong>Economic</strong> <strong>Research</strong> <strong>Service</strong>, <strong>US</strong>DA
the growing season <strong>and</strong> by more favorable exchange rates in Europe. AMS<br />
shipment data indicate new-season shipments from Chile began arriving in the<br />
United States in early September <strong>and</strong> by late November, season-to-date volumes<br />
were down nearly 80 percent from the same period a year ago. Meanwhile, the<br />
Avocado Producers <strong>and</strong> Exporting Packers Association of Michoacan (APEAM),<br />
Mexico, indicated a bumper harvest for the 2012/13 season, with exports to the<br />
United States projected up by 20 percent in volume from last season. Mexico’s<br />
large off-bloom crop in 2011/12 provided ample late-season supplies to the U.S.<br />
market which coincided with plentiful supplies from California’s larger than<br />
average crop last season. These occurrences allowed growers in Mexico to hold off<br />
harvesting of early fruit from the new crop until around early October. Both the<br />
quality <strong>and</strong> fruit size of Mexico’s 2012/13 crop improved as a result because fruit<br />
were allowed to stay longer on the trees.<br />
Avocado dem<strong>and</strong> in the United States continues on a rising path with ERS initial<br />
2011/12 estimates for fresh avocado per capita use at a record-high 4.6 pounds, up<br />
from 4.1 in 2010/11 <strong>and</strong> more than double the 2000/01 estimate. At this current<br />
estimate, fresh avocado domestic per-capita dem<strong>and</strong> has surpassed dem<strong>and</strong> for fresh<br />
pears, matched that for fresh peaches (including nectarines), <strong>and</strong> is closing in on<br />
that for fresh grapes, three more traditionally produced <strong>and</strong> consumed fruits in the<br />
United States (fig. 4).<br />
ERS preliminary estimates show overall avocado supplies in the United States<br />
during the 2011/12 season at a record 1.5 billion pounds, up 14 percent from the<br />
previous season. Domestic production in 2011 increased 21 percent from the<br />
previous year, reaching 442 million pounds (includes California, Florida, <strong>and</strong><br />
Hawaii) <strong>and</strong>, imports are projected to total a record 1.05 billion pounds, up 14<br />
percent. Cumulative imports through October show volumes up 34 percent from<br />
Mexico, which accounts for over 80 percent of total year-to-date imports, while<br />
volumes from Chile are down 42 percent. A large jump in imports is also reported<br />
from Peru, with year-to-date volume up 74 percent. Peruvian imports make up 4<br />
percent of the total to date <strong>and</strong> have already reached half the level of imports from<br />
Chile, the second largest source for U.S. avocado imports.<br />
Barring any weather abnormalities, this year’s ample supplies in California <strong>and</strong><br />
Mexico will likely enable retailers to aggressively promote avocados in 2012/13,<br />
likely putting downward pressure on avocado prices. Based on AMS data, free-onboard<br />
(f.o.b.) shipping-point prices for South District California Hass avocados, all<br />
sizes except 84s, averaged around $25-$26 per 2-layer carton in October. There<br />
were no prices quoted for California Hass in October 2011 as the smaller harvest<br />
resulted in an earlier finish to the 2010/11 season. F.o.b. price quotes for Mexican<br />
Hass avocados (all sizes except 84s) this October ranged from $20-$22 per two<br />
layer carton, compared with $28-$30 last year. Priced relatively lower than other<br />
fruit size, in general, in October, smallest sized avocados (size 84s) ranged from<br />
$19-$20 per 2-layer carton for South District California Hass <strong>and</strong> $18-$19 for<br />
Mexican Hass. As of early November, Chilean Hass f.o.b. prices ranged from $20-<br />
$23 per 2-layer carton (size 60s <strong>and</strong> 70s) <strong>and</strong> Mexican Hass at $19-$20 (all sizes,<br />
except 84s which were slightly lower). Same time last year, prices averaged higher<br />
at $26-$27 <strong>and</strong> $28-$29, respectively.<br />
15<br />
<strong>Fruit</strong> <strong>and</strong> <strong>Tree</strong> <strong>Nuts</strong> <strong>Outlook</strong>/FTS-354/December 18, 2012<br />
<strong>Economic</strong> <strong>Research</strong> <strong>Service</strong>, <strong>US</strong>DA
Figure 4<br />
U.S. fresh avocado per capita use gaining ground<br />
Pounds per person<br />
10.00<br />
9.00<br />
8.00<br />
7.00<br />
6.00<br />
5.00<br />
4.00<br />
3.00<br />
2.00<br />
1.00<br />
0.00<br />
Pears<br />
Grapes<br />
Avocados<br />
Peaches<br />
Source: <strong>US</strong>DA, <strong>Economic</strong> <strong>Research</strong> <strong>Service</strong> calculations.<br />
At the retail level, monthly AMS U.S. retail advertised prices data report Hass<br />
avocados averaging $1.08 in October <strong>and</strong> $1.15 in November 2012, compared with<br />
$1.16 <strong>and</strong> $1.19, respectively, the same time last year.<br />
Lighter Supplies Help Strengthen Kiwifruit Prices<br />
Coming off of a bigger than average crop, a combination of a light fruit set <strong>and</strong><br />
some weather problems during the early part of the growing season signal a decline<br />
in California’s kiwifruit production in 2012/13. California’s Southern growing<br />
areas were affected by frost <strong>and</strong> hail <strong>and</strong>, while some growers suffered severe<br />
losses, overall damage was not widespread. Other production areas benefitted from<br />
a relatively mild spring, resulting in an overall good quality crop. Initial estimates<br />
from the Kiwifruit Administrative Committee (KAC) indicated crop size during the<br />
2012/13 season will be down by about 30 percent from 2011/12. In the Noncitrus<br />
<strong>Fruit</strong> <strong>and</strong> <strong>Nuts</strong> 2011 Summary report released in July 2012, NASS estimated the<br />
2011/12 California kiwifruit crop at 42,000 tons, 53 percent above the previous 10year<br />
average. If initial projections from KAC hold true, production in California<br />
would drop to around 29,000 tons, still slightly higher than the previous<br />
10-year average.<br />
While typically a low point during the entire marketing season (October-<br />
September), early 2012/13 supplies of California kiwifruit are up, with cumulative<br />
shipment volume from October through late November up 71 percent from the same<br />
period last season, based on AMS data. Although potential crop size is projected to<br />
fall short of the previous season, the warmer than normal temperatures this spring<br />
<strong>and</strong> summer advanced crop maturity. Despite increased early-season supplies,<br />
reduced imports in this market have avoided downward pressure on domestic<br />
kiwifruit prices. Overall import volume in October was down over 40 percent from<br />
the same time last year due to much lower supplies from New Zeal<strong>and</strong>. Nearly all<br />
imported kiwifruit in the United States has historically come from Chile, New<br />
16<br />
<strong>Fruit</strong> <strong>and</strong> <strong>Tree</strong> <strong>Nuts</strong> <strong>Outlook</strong>/FTS-354/December 18, 2012<br />
<strong>Economic</strong> <strong>Research</strong> <strong>Service</strong>, <strong>US</strong>DA
Zeal<strong>and</strong>, <strong>and</strong> Italy. Though greatly diminished from peak levels during the<br />
summer, lingering supplies from Chile in October were up more than threefold from<br />
the same time last year while imports from Italy remained relatively unchanged.<br />
Harvest in California had gone in full swing in November <strong>and</strong> therefore, shipment<br />
volumes are expected to rise seasonally for the remainder of the year.<br />
November f.o.b. shipping-point prices for 2012/13 California kiwifruit of the<br />
Hayward variety in the Central <strong>and</strong> Northern San Joaquin Valley through midmonth<br />
averaged in the range of $16-$17 per 9-kilogram (or 19.8 pounds) container<br />
loose for those in the size 27 category, compared with $13-$15 the same time last<br />
year. For the same period, prices for size 30s <strong>and</strong> 33s ranged from $15-$16, up<br />
from $13-14 a year ago. As California supplies increase seasonally through the<br />
remainder of the year, prices are likely to move down from earlier in the season but<br />
remain above a year ago. The higher f.o.b. prices so far already indicate stronger<br />
grower prices for kiwifruit during the 2012/13 season.<br />
California’s kiwifruit bearing area appears to have stabilized to 4,200 acres over the<br />
last 4 years after trending down from over 7,000 acres in the late 1980s <strong>and</strong> early<br />
1990s. Increased availability, particularly for counter seasonal imports, <strong>and</strong> an ever<br />
growing population hungry for health-promoting diets, helped regain some of the<br />
lost growth in U.S. kiwifruit dem<strong>and</strong> experienced in the initial years of the 21 st<br />
century. Following significant declines in 2001/02 through 2003/04, U.S. kiwifruit<br />
per capita use began to trend up again, though remaining below the highs of the late<br />
1990s. Domestic kiwifruit dem<strong>and</strong> continued strong into 2011/12, as with export<br />
dem<strong>and</strong>, aided in part by increased imports <strong>and</strong> the large, good-quality California<br />
crop last season. ERS’s preliminary estimate for U.S. kiwifruit per capita use is at<br />
an all-time high of 0.61 pounds in 2011/12, up from 0.50 pounds the previous<br />
season <strong>and</strong> the previous 10-year average estimate of 0.44 pounds.<br />
U.S. kiwifruit exports reached near-record volume in 2011/12 at 22.5 million<br />
pounds (or 11,253 tons), valued at $17.0 million—the highest so far on record.<br />
Among the country’s top international markets for kiwifruit, export volume rose<br />
significantly to Mexico <strong>and</strong> more than doubled to Japan but was down to more than<br />
10 percent to Canada. Export shipments were also up significantly to a few<br />
relatively smaller markets, which included Sweden, Taiwan, Peru, Chile, <strong>and</strong> the<br />
Dominican Republic. Due to strong overall dem<strong>and</strong>, grower prices for California<br />
kiwifruit in 2011/12 still increased fractionally from the previous season to $771 per<br />
ton despite a 28-percent increase in production, resulting to a record-high crop<br />
value of $31.4 million, up from the previous 10-year average of $20.8 million.<br />
Import volume during the 2011/12 season, October through September, increased to<br />
a record 135.9 million pounds (or 67,963 tons), up 20 percent from the previous<br />
season. Import growth was attributed to significantly higher volumes received from<br />
Chile (up 36 percent) <strong>and</strong> Italy (up 77 percent). Kiwifruit producers in New<br />
Zeal<strong>and</strong> continue to battle problems with bacterial canker, dampening the country’s<br />
exports to the United States. U.S. kiwifruit imports from New Zeal<strong>and</strong> declined 9<br />
percent in 2010/11 from the previous season <strong>and</strong> again declined in 2011/12 by as<br />
much as 31 percent. Shipping the largest kiwifruit volume to the United States over<br />
the last 4 years, top-ranked Chile supplied nearly half the total import volume in<br />
2011/12. Most imports from Chile <strong>and</strong> New Zeal<strong>and</strong> are counter seasonal with<br />
California supplies, arriving during the spring <strong>and</strong> summer time, while those from<br />
Italy provide more direct competition with domestic production.<br />
17<br />
<strong>Fruit</strong> <strong>and</strong> <strong>Tree</strong> <strong>Nuts</strong> <strong>Outlook</strong>/FTS-354/December 18, 2012<br />
<strong>Economic</strong> <strong>Research</strong> <strong>Service</strong>, <strong>US</strong>DA
Blueberry Supplies Remain Ample This Winter<br />
The U.S. fresh blueberry market transitions from domestic production to Southern<br />
Hemisphere supplies this fall with imports from Chile—the United States’ No. 1<br />
supplier of imported blueberries—likely to be near the record high achieved last<br />
season. Favorable weather this growing season has benefitted the Chilean blueberry<br />
crop, potentially boosting exports this season. Based on data from the Chilean<br />
Blueberry Committee, an affiliate of the Chilean Fresh <strong>Fruit</strong> Exporters Association,<br />
Chile is projected to export close to 85,000 tons of fresh blueberries during the<br />
2012/13 season, up 21 percent from last season. Of this volume, projections are<br />
that over 75 percent will likely be destined for the U.S. market. If realized, Chile’s<br />
shipments to the United States potentially could set a new record, providing U.S.<br />
retailers ample promotional supplies through the winter months.<br />
Based on AMS shipment data, cumulative import volume from Argentina—another<br />
Southern Hemisphere source—was up by as much as 31 percent in October<br />
compared with the same time last year but fell significantly below a year ago in<br />
November. Early import volume from Chile was also up in October from the same<br />
time last year <strong>and</strong> had also fallen short of last year in November. As Argentine<br />
supplies wind down for the season, Chilean supplies are expected to increase<br />
seasonally, likely surpassing year-ago volumes this fall <strong>and</strong> winter, which could put<br />
downward pressure on blueberry prices. Volumes from Chile typically start light in<br />
early November, <strong>and</strong> then gain momentum, peaking in January <strong>and</strong> winding down<br />
in late spring.<br />
F.o.b. shipping-point prices for Argentine blueberries entering through Miami<br />
International Airport from October through early November ranged from $23-$26<br />
per flat of 12 (4.4-oz) cups with lids (medium-large) <strong>and</strong> $27-31 per flat of 12 (6-<br />
0z.) cups with lids (medium-large), compared with $24-$28 <strong>and</strong> $23-$30,<br />
respectively, from the same time last year. At the retail level, fresh blueberry<br />
advertised prices in October averaged around $3.00 per 4.4-ounce <strong>and</strong> 6-ounce<br />
package, down 20-23 cents from average quotes the same time last year, based on<br />
AMS data. However, below year-ago shipments in November drove average<br />
advertised retail prices higher by as much as 13 cents for the 4.4-ounce package <strong>and</strong><br />
6 cents for the 6-ounce package, respectively, compared with their corresponding<br />
averages in November 2011.<br />
California Olive Production Forecast Bigger Than Previous<br />
5-Year Average<br />
Olive yields <strong>and</strong> production are highly variable from year to year, partly due to the<br />
alternate-bearing nature of the olive tree. Since 1990, production has ranged from a<br />
low of 23,500 tons in 2006 to a high of 206,000 tons in 2010. The most recent<br />
estimate for California’s 2012 olive crop was forecast by NASS California Field<br />
Office in August at 180,000 tons, up more than double last year’s crop of 71,200<br />
tons. If realized, this year’s crop is 72 percent bigger than the previous 5-year<br />
average but smaller than the record set in 2010.<br />
As historically shown, olive prices tends to be higher during small-crop years <strong>and</strong><br />
lower during years with large crop (fig. 5). The record-low harvest in 2006 led to<br />
the highest historical season-average grower price for olives during the 2006/07<br />
18<br />
<strong>Fruit</strong> <strong>and</strong> <strong>Tree</strong> <strong>Nuts</strong> <strong>Outlook</strong>/FTS-354/December 18, 2012<br />
<strong>Economic</strong> <strong>Research</strong> <strong>Service</strong>, <strong>US</strong>DA
Figure 5<br />
Fluctuating production <strong>and</strong> average grower prices for California olives<br />
Short tons<br />
250,000<br />
200,000<br />
150,000<br />
100,000<br />
50,000<br />
0<br />
1990<br />
1991<br />
1992<br />
1993<br />
1994<br />
1995<br />
1996<br />
1997<br />
1998<br />
1999<br />
2000<br />
2001<br />
2002<br />
2003<br />
2004<br />
2005<br />
2006<br />
2007<br />
2008<br />
2009<br />
2010<br />
2011<br />
Source: <strong>US</strong>DA, National Agricultural Statistics <strong>Service</strong>, Noncitrus<br />
<strong>Fruit</strong> <strong>and</strong> <strong>Nuts</strong> Summary, various issues.<br />
$/ton<br />
season at $771 per ton. Since the 1990s, grower prices bottomed at $387 per ton in<br />
1999/2000, when production was up by nearly 60 percent from the previous season.<br />
In 2011/12, crop size declined 65 percent from the record-large 2010/11 crop,<br />
boosting last season’s average price to a near-record $755 per ton. Although prices<br />
averaged high last season, the huge decline in production more than offset the price<br />
increase, driving down the 2011/12 crop value to $53.8 million, from $136.8<br />
million in 2010/11 <strong>and</strong> nearly 20 percent below the previous 5-year average.<br />
All commercial U.S. olive acreage is located in California. After declining in the<br />
1980s, olive bearing acreage reversed its trend during the 1990s until stabilizing for<br />
a few years at 36,000 acres from 2000-03. Since then, acreage declined gradually<br />
to 30,000 in 2007 <strong>and</strong> 2008 before climbing again over the last few years, reaching<br />
a peak of 41,500 acres in 2011 <strong>and</strong> to a new record of 44,000 acres estimated for<br />
2012. Recent increases in bearing acreage are attributed to new plantings coming<br />
into production, mostly geared toward the growing premium-quality olive-oil niche<br />
market in California.<br />
As virtually all California olives are processed, canned olives continue to dominate<br />
total production (fig. 6). Production for crushed oil, however, has risen in recent<br />
years to the detriment of canned olives, whose share of total output has significantly<br />
diminished from an average of almost 90 percent from 1980-2008 to slightly less<br />
than 60 percent from 2009-11. At the same time, production crushed for oil has<br />
made only up less than 10 percent of total output throughout most of 1980s, 1990s,<br />
<strong>and</strong> from 2000-03 but has since ascended to an average of 23 percent over the last 8<br />
years, reaching a high of 59 percent in 2011. This year, the NASS California Field<br />
Office forecast 94,000 tons will be destined for canning, 52 percent of total<br />
production, while 86,000 tons will be crushed for oil, or 48 percent of the total.<br />
The domestic market serves as the primary outlet for California canned olives,<br />
although imports have surpassed domestic production in fulfilling U.S. dem<strong>and</strong><br />
throughout most of the past decade. Exports, on the other h<strong>and</strong>, continue to account<br />
900<br />
800<br />
700<br />
600<br />
500<br />
400<br />
300<br />
200<br />
100<br />
19<br />
<strong>Fruit</strong> <strong>and</strong> <strong>Tree</strong> <strong>Nuts</strong> <strong>Outlook</strong>/FTS-354/December 18, 2012<br />
<strong>Economic</strong> <strong>Research</strong> <strong>Service</strong>, <strong>US</strong>DA<br />
0
Figure 6<br />
Olive utilization for canning dominates processed production but share is diminishing<br />
Short tons<br />
250000<br />
200000<br />
150000<br />
100000<br />
50000<br />
0<br />
1990<br />
1991<br />
Canned Crushed for oil Other<br />
1992<br />
1993<br />
1994<br />
1995<br />
1996<br />
1997<br />
1998<br />
1999<br />
for a small share of the California canned olive market (except during the fairly<br />
small production years of 2006/07, 2009/10, <strong>and</strong> 2001/12, when shares were<br />
between 10-20 percent). Annual average volumes have increased from around 4<br />
million pounds (or 2,000 tons) in the 1980s to 6 million pounds (or 3,000 tons) over<br />
the past decade. The bulk of the exports go to neighboring countries—Canada <strong>and</strong><br />
Mexico—with the former taking up more than half of total export volume.<br />
In the past 10 years, U.S. canned olive imports averaged over 220 million pounds,<br />
product weight basis, or nearly 60 percent of total domestic use. Although no data<br />
are available for canned olive inventories, two consecutive years of declining<br />
production beginning in 2008/09 likely tightened inventories, lowering overall<br />
domestic supplies <strong>and</strong> boosting import dem<strong>and</strong> in the United States to a record-high<br />
260 million pounds in 2009/10 or 84 percent of total domestic use. Spain remains<br />
the No. 1 source of imported canned olive in the United States, accounting for<br />
slightly over 60 percent of total import volume in the last 5 years. This share is<br />
down from over 80 percent during 2000/01-2002/03, with Morocco, Greece, <strong>and</strong><br />
Argentina increasing market share.<br />
Pecan Production Rebounds in 2012/13<br />
2000<br />
2001<br />
2002<br />
2003<br />
2004<br />
2005<br />
2006<br />
2007<br />
2008<br />
2009<br />
Source: <strong>US</strong>DA, National Agricultural Statistics <strong>Service</strong>, Noncitrus <strong>Fruit</strong> <strong>and</strong> <strong>Nuts</strong> Summary,<br />
various issues.<br />
2010<br />
2011<br />
In October, NASS released the first official estimate for the upcoming pecan<br />
harvest, pinning it at 14 percent above the 2011/12s 308.6 million pounds (inshell<br />
basis). If realized, this crop would be the largest harvested since the 387.3 million<br />
pounds (inshell basis) harvested in 2007. The 2012/13 pecan harvest is an off-year<br />
harvest but is a strong off-year harvest, 45 percent above the previous 5-year offyear<br />
average. Texas pecans have somewhat recovered from the 2011 drought, with<br />
production increasing by 75 percent in 2012 to 55 million inshell pounds.<br />
Georgia’s crop is marginally smaller this year, declining from 102 million inshell<br />
pounds to 100 million inshell pounds. The harvest season started around 2 weeks<br />
earlier than usual in some regions, promoting the possibility for harvest to be<br />
finished by early December. AMS is reporting a slowing of imports via Mexico (no<br />
country of origin specified, just trade entering from Mexico), with inshell shipments<br />
20<br />
<strong>Fruit</strong> <strong>and</strong> <strong>Tree</strong> <strong>Nuts</strong> <strong>Outlook</strong>/FTS-354/December 18, 2012<br />
<strong>Economic</strong> <strong>Research</strong> <strong>Service</strong>, <strong>US</strong>DA
down 50 percent from August through mid-November, while shelled shipments are<br />
up by 12 percent.<br />
The 2011/12 pecan season experienced strong exports totaling 88.5 million pounds<br />
inshell, just 3 percent below the record in 2007/08. Hong Kong remains the leading<br />
export destination with 45.5 million pounds of inshell pecans, up 39 percent from<br />
2010/11. Hong Kong acquired 52 percent of all U.S. inshell pecan exports.<br />
Vietnam was the second largest in-shell pecan market with 22.9 million pounds,<br />
more than triple the shipments from the previous season. While exports grew<br />
substantially to Vietnam, U.S. inshell pecan shipments to Mexico dropped 36<br />
percent to 14.3 million pounds. As for shelled pecan exports, Canada remains the<br />
top market for the United States with 10.3 million pounds, stepping up shipment<br />
levels from 2010/11 by 22 percent. Mexico advanced to second place in the shelled<br />
pecan market at 7.4 million pounds, followed by the Netherl<strong>and</strong>s with 5.1<br />
million pounds.<br />
21<br />
<strong>Fruit</strong> <strong>and</strong> <strong>Tree</strong> <strong>Nuts</strong> <strong>Outlook</strong>/FTS-354/December 18, 2012<br />
<strong>Economic</strong> <strong>Research</strong> <strong>Service</strong>, <strong>US</strong>DA
<strong>Fruit</strong> <strong>and</strong> <strong>Tree</strong> <strong>Nuts</strong> Trade <strong>Outlook</strong><br />
Exports Decline for Oranges <strong>and</strong> Juice, Rise for Most Noncitrus <strong>Fruit</strong><br />
With the 2011/12 orange marketing season winding down, exports are down nearly<br />
6 percent from November through September, compared with the same period the<br />
previous season (table 11). Despite above-average production of U.S. fresh oranges<br />
in 2011/12, strong domestic dem<strong>and</strong> kept supplies within this market for use in<br />
processing <strong>and</strong> in the fresh market. South Korea received the bulk of U.S. orange<br />
exports, with 400 million pounds through September, a 30-percent increase over the<br />
same period in 2010/11. Even with ample processing orange production in<br />
2011/12, U.S. exports of frozen concentrate orange juice (FCOJ) declined 50<br />
percent from the record volume in 2010/11. Low orange juice stocks at the<br />
beginning of the season <strong>and</strong> reduced imports drove down overall domestic supplies,<br />
limiting exportable supplies. Fresh grapefruit saw a 48-percent decline in 2012/13<br />
exports to date, after last season’s strong start to the marketing year. Volumes<br />
should increase as the season continues, but will likely remain close to last year’s<br />
volumes due to decreases in Texas <strong>and</strong> Florida grapefruit production. U.S. fresh<br />
grapefruit shipment volumes to Canada has more than doubled this season through<br />
September, while those to South Korea has declined to 168,000 pounds, from 3.2<br />
million pounds last year.<br />
U.S. fresh apples are experiencing strong dem<strong>and</strong> in the international market,<br />
receiving around a 23 percent increase in 2012/13 export volume through<br />
September compared with the same period last season. Although weather problems<br />
during the growing season has largely contributed to thin crops in the Eastern <strong>and</strong><br />
Table 11--U.S. exports of selected fruit <strong>and</strong> tree nut products<br />
Season-to-date (through September) Year-to-date<br />
Commodity Marketing season 2011 2012 change<br />
---------- 1,000 pounds ---------- Percent<br />
Fresh market:<br />
Oranges November-October 1,636,602 1,541,303 -5.8<br />
Grapefruit September-August 8,746 4,545 -48.0<br />
Lemons August-July 12,932 14,339 10.9<br />
Apples August-July 136,592 168,505 23.4<br />
Grapes May-April 328,098 399,457 21.7<br />
Pears July-June 62,673 78,152 24.7<br />
Peaches (including nectarines) January-December 199,057 188,309 -5.4<br />
Strawberries January-December 241,836 260,720 7.8<br />
Cherries January-December 156,224 222,239 42.3<br />
------ 1,000 sse gallons 1/ -------<br />
Processed:<br />
Orange juice, frozen concentrate October-September 118,551 58,787 -50.4<br />
Orange juice, not-from-concentrate October-September 82,432 86,089 4.4<br />
Grapefruit juice October-September 15,800 15,194 -3.8<br />
Apple juice <strong>and</strong> cider August-July 1,648 1,309 -20.5<br />
Wine January-December 82,152 76,913 -6.4<br />
---------- 1,000 pounds ----------<br />
Raisins August-July 56,966 54,858 -3.7<br />
Canned pears June-May 4,662 5,770 23.8<br />
Canned peaches June-May 18,780 18,826 0.2<br />
Frozen strawberries January-December 34,382 39,700 15.5<br />
---------- 1,000 pounds ----------<br />
<strong>Tree</strong> nuts:<br />
Almonds (shelled basis) August-July 176,062 197,265 12.0<br />
Walnuts (shelled basis) September-August 6,720 6,824 1.5<br />
Pecans (shelled basis) October-September 61,355 76,561 24.8<br />
Pistachios (shelled basis)<br />
1/ Single-strength equivalent.<br />
September-August 12,659 6,314 -50.1<br />
Source: U.S. trade data provided by the U.S. Department of Commerce, U.S. Census Bureau.<br />
22<br />
<strong>Fruit</strong> <strong>and</strong> <strong>Tree</strong> <strong>Nuts</strong> <strong>Outlook</strong>/FTS-354/December 18, 2012<br />
<strong>Economic</strong> <strong>Research</strong> <strong>Service</strong>, <strong>US</strong>DA
Central U.S. apple-growing regions, the large harvest <strong>and</strong> good quality of the crop<br />
in Washington State has helped keep export shipments flowing at a faster pace than<br />
last season to date. As of November 1, the U.S. Apple Association reported fresh<br />
apple holdings up 4 percent from the same time a year ago, supporting increased<br />
availability for fresh use. Prospects of reduced production in some of the leading<br />
export markets for U.S. apples, particularly Canada <strong>and</strong> Mexico, will potentially<br />
keep U.S. export dem<strong>and</strong> strong in 2012/13. Over the first 2 months of 2012/13,<br />
export volume to Canada rose 4 percent from the same 2 months in 2011/12 <strong>and</strong> up<br />
79 percent to Mexico. Among other leading export markets for U.S. apples, gains<br />
were moderate to Hong Kong <strong>and</strong> steep to Taiwan, Malaysia, <strong>and</strong> the Dominican<br />
Republic. Initial projections from <strong>US</strong>DA peg U.S. fresh apple exports in 2012/13 at<br />
1.93 million pounds or 875,000 metric tons (mt). If realized, this will be a new<br />
record high, up 4 percent from the previous record in 2011/12, which also reached<br />
an all-time-high value of $997 million.<br />
This season’s fresh pear exports, July through September, totaled 78.1 million<br />
pounds, 25 percent above last year the same time. Exports are showing strong gains<br />
to Mexico (up 30 percent), Canada (up 35 percent), United Arab Emirates (up 63<br />
percent), Taiwan (up 63 percent), <strong>and</strong> India (up 18 percent) for a combined total<br />
representing 86 percent of total volume to date. Another 5 percent went to Brazil<br />
<strong>and</strong> Russia where volumes were down 27 percent <strong>and</strong> 2 percent, respectively.<br />
Mexico is the United States’ leading export market for fresh pears <strong>and</strong> strong export<br />
performance to that market so far in 2012/13 has been abetted by the lifting of the<br />
retaliatory import tariff related to the cross-border trucking dispute. Lighter crops<br />
in Canada <strong>and</strong> Russia will continue to stimulate dem<strong>and</strong> for U.S. fresh pears in<br />
those markets but reduced production in the United States will likely limit the<br />
industry’s overall export potential in 2012/13. Moreover, with bigger crops<br />
expected in Argentina <strong>and</strong> China, U.S. fresh pears will likely face increased<br />
competition from these two countries in some of its important markets such as<br />
Brazil, Russia, India, <strong>and</strong> other Asian markets. <strong>US</strong>DA forecast 2012/13 U.S. fresh<br />
pear exports at 375 million pounds (or 170,000 mt), down 11 percent from 2011/12.<br />
U.S. fresh grape exports for the 2012/13 season are up 22 percent, May through<br />
September, relative to the same time the previous season. Season-to-date exports<br />
were up to top market, Canada, <strong>and</strong> other important markets, including Mexico,<br />
Indonesia, Australia, Taiwan, <strong>and</strong> the Philippines. Although the 2012 U.S. grape<br />
crop is down slightly from the previous year, California’s table grape crop<br />
benefitted from favorable weather this spring <strong>and</strong> summer, with crop quality <strong>and</strong><br />
availability working together to attract export dem<strong>and</strong>. For the 2012/13 season<br />
overall, U.S. fresh grape exports are forecast by <strong>US</strong>DA to reach 838 million pounds<br />
(or 380,000 mt), 10 percent higher than in 2011/12.<br />
Ample production of U.S. sweet cherries in 2012 contributed to strong U.S. cherry<br />
exports, with season-to date volumes up 42 percent from the same period a year<br />
ago. Season-to-date exports already broke all-time records for both volume (222<br />
million pounds) <strong>and</strong> value ($506.1 million). Export volume is up 22 percent to<br />
Canada, the top export market for U.S. cherries. Export value to Canada amounted<br />
to $148 million on 78.7 million pounds—both achieving record-high levels.<br />
Completing the top five export markets for U.S. cherries are Hong Kong, South<br />
Korea, Taiwan, <strong>and</strong> Japan. Shipments volumes to Hong Kong <strong>and</strong> South Korea<br />
doubled from last year while those to Taiwan <strong>and</strong> Japan also rose.<br />
23<br />
<strong>Fruit</strong> <strong>and</strong> <strong>Tree</strong> <strong>Nuts</strong> <strong>Outlook</strong>/FTS-354/December 18, 2012<br />
<strong>Economic</strong> <strong>Research</strong> <strong>Service</strong>, <strong>US</strong>DA
Almonds are performing strong with a 12-percent increase in exports through<br />
September, aided by the anticipated record breaking harvest in 2012/13. Harvest<br />
began in August <strong>and</strong> ended in early November. As an average 70 percent of total<br />
harvest is typically exported annually, exports are expected to at least match last<br />
season’s record-high levels. Walnut export shipments are off to a slightly better<br />
start than last season in September. Despite a smaller crop, the 2011/12 pecan<br />
marketing year ended with record-high exports, up 25 percent from the previous<br />
season’s volume. Early pistachio exports are lagging in 2012/13 compared to last<br />
season. Pistachio supplies typically start to pick up in November <strong>and</strong> continue<br />
through late spring, increasing export availability.<br />
Domestic Dem<strong>and</strong> Pushes Orange, Apples, <strong>and</strong> Pear Imports Up<br />
As the domestic orange crop closes in on the end of the marketing season, imports<br />
are up 40 percent from the same period last season (table 12). While domestic<br />
production remains relatively flat from the previous season, U.S. processor dem<strong>and</strong><br />
increased for U.S. processing oranges, triggered by the fungicide contamination of<br />
imported orange juice, forcing them to source more from domestic growers. In fact,<br />
fresh orange imports from July through September have been substantially larger<br />
than the previous season. Chile has supplied 104.5 million pounds season to date, a<br />
50 percent increase from 2010/11.<br />
FCOJ imports fell nearly 17 percent during the 2011/12 marketing season from the<br />
previous season. Imports of orange juice started very strong, but declined<br />
substantially following the January announcement of fungicide contamination in<br />
Table 12--U.S. imports of selected fruit <strong>and</strong> tree nut products<br />
Season-to-date (through September) Year-to-date<br />
Commodity Marketing season 2011 2012 change<br />
---------- 1,000 pounds ---------- Percent<br />
Fresh market:<br />
Oranges November-October 174,437<br />
240,384 37.8<br />
Tangerines (including clementines) October-September 328,963<br />
316,572 -3.8<br />
Lemons August-July 68,038<br />
53,771 -21.0<br />
Limes January-December 599,031<br />
722,409 20.6<br />
Apples August-July 49,397<br />
72,704 47.2<br />
Grapes May-April 308,132<br />
362,275 17.6<br />
Pears July-June 5,312<br />
7,646 44.0<br />
Peaches (including nectarines) January-December 94,913<br />
80,628 -15.1<br />
Bananas January-December 7,409,221<br />
7,712,403 4.1<br />
Mangoes January-December 753,889<br />
723,426 -4.0<br />
------ 1,000 sse gallons 1/ -------<br />
Processed:<br />
Orange juice, frozen concentrate October-September 198,397<br />
165,272 -16.7<br />
Apple juice <strong>and</strong> cider August-July 96,728<br />
73,308 -24.2<br />
Wine January-December 184,646<br />
222,709 20.6<br />
---------- 1,000 pounds ----------<br />
Canned pears June-May 11,029<br />
13,680 24.0<br />
Canned peaches (including nectarines) June-May 36,959<br />
44,305 19.9<br />
Canned pineapple January-December 571,165<br />
549,586 -3.8<br />
Frozen strawberries January-December 165,650<br />
190,813 15.2<br />
---------- 1,000 pounds ----------<br />
<strong>Tree</strong> nuts:<br />
Brazil nuts (shelled basis) January-December 12,165<br />
10,645 -12.5<br />
Cashews (shelled basis) January-December 180,844<br />
183,682 1.6<br />
Pine nuts (shelled basis) January-December 1,227<br />
348 -71.7<br />
Pecans (shelled basis)<br />
1/ Single-strength equivalent.<br />
October-September 70,669<br />
73,009 3.3<br />
Source: U.S. trade data provided by the U.S. Department of Commerce, U.S. Census Bureau.<br />
24<br />
<strong>Fruit</strong> <strong>and</strong> <strong>Tree</strong> <strong>Nuts</strong> <strong>Outlook</strong>/FTS-354/December 18, 2012<br />
<strong>Economic</strong> <strong>Research</strong> <strong>Service</strong>, <strong>US</strong>DA
Brazilian orange juice, the largest global supplier of orange juice. The reduction<br />
pushed up prices, also tempting domestic processors to keep product in the country<br />
to capture the higher price levels. Imports from Brazil fell 20 percent in 2011/12.<br />
U.S. lemon imports are down 20 percent in 2012/13, August through September.<br />
The rebound in domestic production, after the 2011/12s large weather-induced<br />
declines, has reduced the dependency on imports. As domestic dem<strong>and</strong> declines<br />
seasonally, lemon imports should remain below the 2011/12s levels which were the<br />
highest imports since 2007/08.<br />
With the lack of growth in domestic production, import volume for U.S. fresh<br />
apples <strong>and</strong> pears in 2012/13 through September advanced over the same period in<br />
2011/12, helping to fulfill domestic dem<strong>and</strong> especially as some regional markets in<br />
the country face tight supplies <strong>and</strong> the export market remains bullish. Year-to-year<br />
increases in import volumes for both were up by over 40 percent. Fresh apple<br />
shipments to the United States rose significantly from Chile <strong>and</strong> New Zeal<strong>and</strong> <strong>and</strong><br />
doubled from Canada, for a combined volume representing almost all of total<br />
imports to date. Southern Hemisphere shipments of fresh pears to this market also<br />
rose significantly, mostly from Chile, Argentina <strong>and</strong> the Republic of South Africa<br />
while pear shipments were up 7 percent from South Korea.<br />
Fresh grape imports, May through September, increased 18 percent in volume from<br />
the same time last season, totaling 362.3 million pounds. Most of this growth is<br />
attributed to increased shipments from Mexico which supplied 90 percent of this<br />
volume. Imports also rose from Chile, Canada, Italy, <strong>and</strong> Brazil, which accounted<br />
for most of the remaining volume. Projected increased exports from Chile signal<br />
the potential for higher U.S. fresh grape imports during the upcoming winter <strong>and</strong><br />
early spring—the off-season for domestic production. <strong>US</strong>DA forecast U.S. fresh<br />
grape imports in 2012/13 to increase 3 percent from last season to 1.26 billion<br />
pounds (or 570,000 mt).<br />
25<br />
<strong>Fruit</strong> <strong>and</strong> <strong>Tree</strong> <strong>Nuts</strong> <strong>Outlook</strong>/FTS-354/December 18, 2012<br />
<strong>Economic</strong> <strong>Research</strong> <strong>Service</strong>, <strong>US</strong>DA
Special Article<br />
A Dietary Assessment of <strong>Fruit</strong> Consumption 1<br />
Americans have increased their consumption of fruits since 1970, but the average<br />
American diet still falls short of the daily recommendations for fruits. This shortfall<br />
is troublesome given that a diet rich in fruits is relatively low in calories, high in<br />
several nutrients, <strong>and</strong> lowers the risks of many chronic illnesses, including certain<br />
types of cancer (Dietary Guidelines of Americans, 2010).<br />
Increasing the consumption of fruits has been a mainstay of the Dietary Guidelines<br />
for Americans, which is published jointly by the U.S. Department of Agriculture<br />
<strong>and</strong> the U.S. Department of Health <strong>and</strong> Human <strong>Service</strong>s. Since 1980, the<br />
Guidelines have targeted dietary recommendations based on the most current<br />
scientific evidence for Americans over 2 years old. Core dietary messages are<br />
consistent, even as subsequent editions change slightly to reflect the latest scientific<br />
<strong>and</strong> medical information on nutrition <strong>and</strong> health. The 2010 Dietary Guidelines<br />
stress the importance of increasing the amount of vegetables, fruit, whole grains,<br />
low-fat dairy, <strong>and</strong> seafood in order to close nutrient gaps <strong>and</strong> move toward healthier<br />
eating patterns.<br />
This article updates the fruit section of an earlier <strong>Economic</strong> <strong>Research</strong> <strong>Service</strong> (ERS)<br />
report (Wells <strong>and</strong> Buzby, 2008) by: (1) examining the amount <strong>and</strong> variety of fruits<br />
available for consumption in the United States between 1970 <strong>and</strong> 2010; <strong>and</strong> (2)<br />
comparing the amount of fruits consumed by the average American in 2010 with<br />
the amount recommended in <strong>US</strong>DA’s Food Patterns, as listed in Appendix 7 of the<br />
2010 Dietary Guidelines for Americans.<br />
<strong>Fruit</strong>s Available for Consumption<br />
Eating patterns shift over time in response to changes in food prices <strong>and</strong> income<br />
levels, availability of food through domestic production <strong>and</strong> trade, product<br />
convenience, exposure to new cuisines, <strong>and</strong> evolving dietary guidelines. According<br />
to ERS’s Food Availability data series, the total amount of fruits (fresh <strong>and</strong><br />
processed in fresh-weight equivalent) available for consumption in the U.S. food<br />
supply increased 9 percent, from 237.5 pounds per person in 1970 to 258.3 pounds<br />
per person in 2010 (table 1A). This 9-percent increase was not distributed equally<br />
among the 60-plus fruit products covered in the ERS data. Much of the rise came<br />
mainly from the noncitrus group in the fresh <strong>and</strong> juice segments. Canned <strong>and</strong> dried<br />
fruits declined during this period by 32 percent while frozen fruits rose steadily (due<br />
to berries) from 3.9 pounds per person in 1970 to 5 pounds in 2010.<br />
The growth in fresh noncitrus—from 71.7 pounds per person in 1970 to 106.4<br />
pounds in 2010—was mainly contributed by bananas, strawberries, grapes,<br />
pineapples, cantaloupes, <strong>and</strong> avocados, among others, while apples, cranberries,<br />
peaches, <strong>and</strong> plums faced a decline. Similarly, the per capita availability of<br />
noncitrus juices rose 152 percent during this period, from 14.4 pounds in 1970 to<br />
36.2 pounds in 2010. Apple juice particularly quadrupled since 1970. Grape <strong>and</strong><br />
cranberry juice also rose during this period, while pineapple <strong>and</strong> prune juice<br />
decreased 20 percent <strong>and</strong> 75 percent, respectively.<br />
26<br />
<strong>Fruit</strong> <strong>and</strong> <strong>Tree</strong> <strong>Nuts</strong>/FTS-354/December 18, 2012<br />
<strong>Economic</strong> <strong>Research</strong> <strong>Service</strong>, <strong>US</strong>DA<br />
1 Hodan Farah Wells, Crops<br />
Branch, Market <strong>and</strong> Trade<br />
<strong>Economic</strong>s Division, ERS,<br />
<strong>US</strong>DA.
Table 1A— Per capita availability of fruits, 1970 <strong>and</strong> 2010<br />
Change, 2010 Loss-<br />
Per capita availability 1/<br />
1970 adjusted food<br />
Item 1970 2010 to 2010 availability 2/<br />
Pounds, fresh-weight equivalent<br />
Percent Cups/day<br />
<strong>Fruit</strong>s by market category:<br />
Fresh fruits 100.6 127.9 27 0.40<br />
Processed fruits 3/ 136.9 130.3 -5 0.39<br />
Canned 25.9 14.8 -43 0.05<br />
Frozen 3.9 5.0 29 0.03<br />
Dried 9.9 9.4 -4 0.03<br />
Juice 96.6 100.5 4 0.28<br />
<strong>Fruit</strong>s by commodity:<br />
Fresh apples 17.0 15.5 -9 0.11<br />
Fresh bananas 17.4 25.6 47 0.08<br />
Fresh oranges 16.2 9.7 -40 0.02<br />
Fresh strawberries 1.7 7.3 320 0.03<br />
Fresh watermelons 13.5 15.5 15 0.04<br />
Apple juice 6.4 26.6 318 0.08<br />
Orange juice 68.6 54.4 -21 0.15<br />
Grape juice 2.4 4.0 71 0.01<br />
Canned applesauce 5.6 3.8 -32 0.01<br />
Canned peaches 6.7 3.0 -55 0.01<br />
Raisins 5.7 6.2 8 0.02<br />
Total fruits 4/ 237.5 258.3 9 0.79<br />
1/ Aggregate data, unadjusted for cooking losses, plate w aste, <strong>and</strong> other losses.<br />
2/ Adjusted for cooking losses, plate w aste, <strong>and</strong> other losses. The <strong>US</strong>DA Food Pattern, 1 cup of<br />
fruit or 100% juice, or 1/2 cups of dried fruit can be considered as 1 cup from the fruit group.<br />
3/ Includes other apples.<br />
4/ Includes fresh <strong>and</strong> processed vegetables.<br />
Source: <strong>US</strong>DA, <strong>Economic</strong> <strong>Research</strong> <strong>Service</strong>.<br />
Per capita availability of citrus fruit, on the other h<strong>and</strong>, faced a sharp decline.<br />
Between 1970 <strong>and</strong> 2010, fresh citrus <strong>and</strong> juice fell 25 percent <strong>and</strong> 22 percent,<br />
respectively. Oranges <strong>and</strong> grapefruits were mainly responsible for this drop in part<br />
due to weather’s impact on production <strong>and</strong> disease problems, especially with<br />
regards to citrus canker <strong>and</strong> citrus greening, of which eradication efforts have<br />
resulted in reduced citrus acreage, particularly in Florida, in recent years. Oranges<br />
<strong>and</strong> grapefruits, which accounted for most fresh citrus (58 percent), decreased<br />
nearly by a half, from 24.4 pounds per person in 1970 to 12.5 pounds in 2010.<br />
Likewise, orange <strong>and</strong> grapefruit juice availability dropped by one-quarter during<br />
this period, from 79.9 pounds person in 1970 to 59.2 pounds in 2010.<br />
But not all citrus fruits faced a decline; per capita availability of fresh tangerines/<br />
m<strong>and</strong>arins, tangelos, lemons, <strong>and</strong> limes more than doubled, from 4.5 pounds in<br />
1970 to 9.1 pounds in 2010. Similarly, lemon <strong>and</strong> lime juice more than doubled<br />
during this period, although each only account for a relatively small share of total<br />
citrus juice per capita use. The increased availability of these fruits was a result of<br />
increased production for tangerines/m<strong>and</strong>arins <strong>and</strong> increased imports for fresh<br />
lemon, lime, <strong>and</strong> tangerines. In particular, changing consumer preference for easypeel<br />
seedless fruits has led to more production in California.<br />
27<br />
<strong>Fruit</strong> <strong>and</strong> <strong>Tree</strong> <strong>Nuts</strong>/FTS-354/December 18, 2012<br />
<strong>Economic</strong> <strong>Research</strong> <strong>Service</strong>, <strong>US</strong>DA
Dietary Assessment of <strong>Fruit</strong>s<br />
Per capita availability of fruits in the U.S. food supply has increased since 1970.<br />
But how does this upward trend compare with recommendations in the 2010<br />
Dietary Guidelines? According to Loss-Adjusted Food Availability data, the<br />
average American consumed 0.8 cup of fruits per day in 2010. The Loss-Adjusted<br />
Food Availability data adjusts the Food Availability data for losses from farm to<br />
fork <strong>and</strong> then converts volume in pounds per year into cup-equivalents per day.<br />
While 0.8 cup of fruits per day is 23 percent above the 1970s amount of 0.6 cup, it<br />
is still well below the current Guidelines recommendation of 2 cups per person<br />
based on a 2,000-calorie-per-day diet. 2<br />
Although Americans have, on average, increased their overall consumption of fruits<br />
<strong>and</strong> have increased their variety of intake, they are still short of the current Dietary<br />
Guidelines. Intake would need to increase by 61 percent (1.2 cups per person per<br />
day) in order to meet the current requirement. In terms of variety, Americans are<br />
not varying their fruit intake. For instance, 5 products out of the 60-plus fruit<br />
products, accounted for 58 percent of total fruit consumption in 2010—orange juice<br />
(19 percent), fresh apples (13 percent), apple juice (10 percent), bananas (10<br />
percent), <strong>and</strong> watermelon (5 percent).<br />
ERS Food Availability (Per Capita) Data System<br />
The ERS Food Availability (Per Capita) Data System consists of three data<br />
series—the Food Availability data, the Loss-Adjusted Food Availability data, <strong>and</strong><br />
the Nutrient Availability data. The system provides unique <strong>and</strong> detailed estimates<br />
for the amount of food <strong>and</strong> nutrients available for human consumption in the<br />
United States.<br />
The first series, the Food Availability data, is a commonly used proxy for food<br />
intake <strong>and</strong> its components are collected directly from producers <strong>and</strong> distributors<br />
using techniques that vary by commodity. In general, the data are calculated as the<br />
sum of annual production, beginning stocks, <strong>and</strong> imports minus exports, ending<br />
stocks, <strong>and</strong> nonfood uses. Results depict the amount of food available for human<br />
consumption on an annual basis <strong>and</strong> are the only source of time-series data on food<br />
availability in the country. Although the Food Availability data series does not<br />
directly measure actual consumption or quantities ingested, it provides an<br />
indication of whether Americans, on average, are consuming more or less of<br />
various foods over time.<br />
The second series, the Loss-Adjusted Food Availability data (derived from Food<br />
Availability data) subtracts the estimated amount of food lost due to spoilage <strong>and</strong><br />
other losses at three stages in the marketing system (farm, retail, <strong>and</strong> consumer<br />
level). The loss-adjusted data are converted from pounds per capita per year into<br />
daily per capita food intake in two forms—food pattern equivalents <strong>and</strong> calories<br />
per person per day. For each food supply commodity, a food pattern equivalent<br />
2 The 2010 Dietary Guidelines for Americans break down daily recommendations into 12 calorie levels<br />
ranging from 1,000 to 3,200 calories per day. In this article, the 2,000-calorie-per-day reference level<br />
is used for consistency with the 2008 Wells <strong>and</strong> Buzby report.<br />
28<br />
<strong>Fruit</strong> <strong>and</strong> <strong>Tree</strong> <strong>Nuts</strong>/FTS-354/December 18, 2012<br />
<strong>Economic</strong> <strong>Research</strong> <strong>Service</strong>, <strong>US</strong>DA
was defined, with size based on <strong>US</strong>DA’s MyPyramid Equivalents Database<br />
(MPED) <strong>and</strong> weight based on <strong>US</strong>DA’s Nutrient Database for St<strong>and</strong>ard Reference<br />
(NDB). Food pattern equivalent weights for individual commodities are<br />
aggregated to total daily amounts for the five major <strong>US</strong>DA food groups, plus the<br />
amounts for added sugars <strong>and</strong> sweeteners <strong>and</strong> for added fats <strong>and</strong> oils. Aggregated<br />
amounts for each food group are then compared with the amount recommended in<br />
the <strong>US</strong>DA's Food Patterns, as listed in Appendix 7 of the 2010 Dietary Guidelines<br />
for Americans.<br />
The third series, the Nutrient Availability data, is compiled by <strong>US</strong>DA’s Center for<br />
Nutrition Policy <strong>and</strong> Promotion (CNPP), using the Food Availability data to<br />
calculate the nutrient content of the U.S. food supply. This historical data series<br />
estimates the amounts per capita per day of food energy (calories) <strong>and</strong> 27 nutrients<br />
<strong>and</strong> dietary components (i.e. protein, carbohydrates, fats, vitamins, <strong>and</strong> minerals)<br />
in the Nation’s food supply.<br />
The discussion in this article is drawn from the ERS Loss-Adjusted Food<br />
Availability Data (http://www.ers.usda.gov/data-products/food-availability-(percapita)-data-system.aspx),<br />
August 2012.<br />
References<br />
Finkelstein, E.A., J.G.Trogdon, J.W. Cohen <strong>and</strong> W. Dietz. “Annual Medical<br />
Spending Attributable To Obesity: Payer- <strong>and</strong> <strong>Service</strong>-Specific Estimates,” Health<br />
Affairs, 28, No. 5 (2009):w822-w831.<br />
Pollack, S. “Consumer Dem<strong>and</strong> for <strong>Fruit</strong> <strong>and</strong> Vegetables: The U.S. Example,”<br />
Changing Structure of Global Food Consumption <strong>and</strong> Trade, Agriculture <strong>and</strong><br />
Trade Report, WRS-01-1, <strong>US</strong>DA, <strong>Economic</strong> <strong>Research</strong> <strong>Service</strong>, May 2001,<br />
pp. 49-54,<br />
http://www.ers.usda.gov/media/293645/wrs011_1_.pdf<br />
Ogden, C. L., M. D. Carroll, B. K. Kit, <strong>and</strong> K. M. Flegal. “Prevalence of Obesity in<br />
the United States, 2009–2010,” National Center for Health Statistics, NCHS data<br />
brief, No. 82, January 2012, http://www.cdc.gov/nchs/data/databriefs/db82.pdf<br />
U.S. Department of Agriculture, <strong>Economic</strong> <strong>Research</strong> <strong>Service</strong>, ERS Food<br />
Availability (Per Capita) Data System, August 2012, http://www.ers.usda.gov/dataproducts/food-availability-(per-capita)-data-system.aspx.<br />
U.S. Department of Agriculture <strong>and</strong> U.S. Department of Health <strong>and</strong> Human<br />
<strong>Service</strong>s. Dietary Guidelines for Americans, 2010, 7th edition,<br />
http://www.cnpp.usda.gov/DGAs2010-PolicyDocument.htm<br />
U.S. Department of Health <strong>and</strong> Human <strong>Service</strong>s, Centers for Disease Control <strong>and</strong><br />
Prevention. “Behavioral Risk Factor Surveillance System Prevalence Data,” August<br />
2012, http://apps.nccd.cdc.gov/brfss/<br />
Wells, H.F., <strong>and</strong> J.C. Buzby. Dietary Assessment of Major Trends in U.S. Food<br />
Consumption, 1970-2005, EIB-33, <strong>US</strong>DA, <strong>Economic</strong> <strong>Research</strong> <strong>Service</strong>, March<br />
2008, http://www.ers.usda.gov/media/210681/eib33_1_.pdf<br />
29<br />
<strong>Fruit</strong> <strong>and</strong> <strong>Tree</strong> <strong>Nuts</strong>/FTS-354/December 18, 2012<br />
<strong>Economic</strong> <strong>Research</strong> <strong>Service</strong>, <strong>US</strong>DA
Special Article<br />
Trans-Pacific Partnership: New Trade Opportunities<br />
for Horticulture 1<br />
On November 12, 2011, the leaders of the nine Trans-Pacific Partnership<br />
countries—Australia, Brunei, Chile, Malaysia, New Zeal<strong>and</strong>, Peru, Singapore,<br />
Vietnam, <strong>and</strong> the United States—announced broad outlines for an ambitious, 21 st<br />
Century Trans-Pacific Partnership (TPP) agreement (Office of U.S. Trade<br />
Representative; Fergusson <strong>and</strong> Vaughn). TPP is a plurilateral free trade agreement<br />
that has the objective of enhancing trade <strong>and</strong> investment among the TPP partner<br />
countries, thus promoting innovation, economic growth <strong>and</strong> development, <strong>and</strong><br />
supporting the creation <strong>and</strong> retention of jobs. The framework includes improved<br />
market access <strong>and</strong> the elimination of trade barriers. In addition to the nine core TPP<br />
countries, Canada <strong>and</strong> Mexico have recently joined the negotiations <strong>and</strong> Japan is<br />
considering joining. 2 Participating countries took part in the 15th round of<br />
discussions in New Zeal<strong>and</strong> this December. While TPP has far-reaching<br />
implications for all sectors of the economy, underst<strong>and</strong>ing the value of the<br />
agreement is particularly important to the food <strong>and</strong> agricultural sector.<br />
The U.S. horticultural sector shares a strong interest in the outcome of TPP<br />
negotiations, as fruit <strong>and</strong> vegetable trade patterns continue to be influenced by a<br />
range of trade-distorting policies. 3 The horticultural sector faces a large number of<br />
high tariff rates as well as tariff-rate quotas, some of which are characterized by<br />
cumbersome administrative procedures <strong>and</strong> over-quota tariff rates at towering<br />
levels. Moreover, phytosanitary <strong>and</strong> technical measures have affected trade by<br />
limiting or blocking select horticultural products from world markets.<br />
This article examines the possible impacts that the TPP agreement might have on<br />
U.S. horticultural trade. The 11 TPP partners of the United States, including Japan,<br />
have a population of 475 million people, <strong>and</strong> a combined gross domestic product<br />
(GDP) estimated at over $11.5 trillion in 2011. They are a growing market for U.S.<br />
horticultural exports; hence the interest in how this agreement might impact the<br />
United States. The objective of this article is to identify <strong>and</strong> discuss issues affecting<br />
U.S. trade in produce, with an emphasis on fruit <strong>and</strong> nuts, which are likely to be<br />
considered during the TPP negotiations. By way of providing context for this<br />
review, a brief overview of global trade patterns <strong>and</strong> the role of U.S. horticultural<br />
trade are examined in the subsequent section.<br />
Growth in U.S. <strong>and</strong> Global Horticultural Trade<br />
Over the past decade, growth in global horticultural trade has been substantial.<br />
According to United Nations’ Comtrade database, fruit <strong>and</strong> vegetable trade rose<br />
from over $90 billion in 2000 to nearly $218 billion in 2010 (<strong>and</strong> comprises almost<br />
21 percent of global food <strong>and</strong> animal product trade. From a U.S. perspective,<br />
similar trends are observed. <strong>Fruit</strong> <strong>and</strong> vegetable imports <strong>and</strong> exports more than<br />
2 The Philippines, South Korea, <strong>and</strong> Taiwan have also expressed interest in becoming members, but<br />
would likely have to await the conclusion of the current negotiations before being considered for<br />
accession. While not yet a negotiating partner, we include Japan in our analysis.<br />
3 For the purpose of this article, the general terms, “fruit <strong>and</strong> vegetable” <strong>and</strong> “horticulture” refer to all<br />
vegetable, fruit <strong>and</strong> nut products, both fresh <strong>and</strong> processed.<br />
30<br />
<strong>Fruit</strong> <strong>and</strong> <strong>Tree</strong> <strong>Nuts</strong> <strong>Outlook</strong>/FTS-354/December 18, 2012<br />
<strong>Economic</strong> <strong>Research</strong> <strong>Service</strong>, <strong>US</strong>DA<br />
1 Barry Krissoff <strong>and</strong> John<br />
Wainio, International<br />
Competition <strong>and</strong> Dem<strong>and</strong><br />
Branch, Market <strong>and</strong> Trade<br />
<strong>Economic</strong>s Division (MTED),<br />
ERS, <strong>US</strong>DA.
doubled in value, reaching $22.9 billion <strong>and</strong> $15.7 billion, respectively, or about 26<br />
percent of U.S. food <strong>and</strong> agricultural imports <strong>and</strong> 13 percent of exports<br />
in 2010 (fig. 1B).<br />
The 11 countries (including Japan) that would partner with the United States to<br />
form the TPP have been a growing market for U.S. horticultural trade, with U.S.<br />
exports to these countries increasing from almost $4.5 billion in 2000 to $8.1 billion<br />
in 2010. U.S. horticultural imports from these countries during this period<br />
increased even faster, from $5.2 billion to $13.5 billion. Canada was the United<br />
States’ largest export market in 2010 (at $4.9 billion) <strong>and</strong> Mexico the largest source<br />
of imports (at $7.7 billion). Despite this growth, the TPP region’s importance as a<br />
destination for U.S. exports has declined relative to other countries in recent years.<br />
In 2000, the United States sent 60 percent of its horticultural exports to TPP<br />
countries. This share has since declined to 52 percent in 2010. On the import side,<br />
however, these TPP countries have been a growing source of horticultural imports,<br />
with their share of the U.S. import market increasing from 50 percent in 1996 to 59<br />
percent in 2010. As a result, the United States has gone from being a small net<br />
exporter of horticultural products to a large net importer in the North American<br />
region. In 2010, the United States had a negative trade balance (over $5.6 billion)<br />
in the horticultural sector with TPP countries. With respect to TPP countries<br />
overall, Mexico, Chile, Peru, Vietnam, <strong>and</strong> New Zeal<strong>and</strong> ran a trade surplus with<br />
the United States while the remaining six countries served as net importers.<br />
There are at least four key long-term factors underlying the increase in fruit <strong>and</strong><br />
vegetable trade patterns. First, the integration of millions of consumers from<br />
emerging markets into the global economy has substantially contributed to the<br />
expansion of horticultural trade. Wealthier consumers in these countries have<br />
expressed strong interest in product quality, variety, convenience, <strong>and</strong> the benefits<br />
of healthy <strong>and</strong> nutritious fruit <strong>and</strong> vegetables. Second, technological innovations,<br />
most notably in communication <strong>and</strong> transportation, have lowered the transaction<br />
cost of international trade. For example, retailer Ahold adapted Google Apps<br />
Premier Edition to provide a single web-based communication system among its<br />
global employees that includes a messaging platform, sharing of calendars, video<br />
Figure 1B<br />
U.S. horticultural trade value, 2000-10<br />
Billion dollars<br />
25.0<br />
23.0<br />
21.0<br />
19.0<br />
17.0<br />
15.0<br />
13.0<br />
11.0<br />
9.0<br />
7.0<br />
5.0<br />
2000 2001 2002 2003 2004 2005 2006 2007 2008 2009 2010<br />
Source: United Nations, Comtrade database.<br />
Exports<br />
Imports<br />
31<br />
<strong>Fruit</strong> <strong>and</strong> <strong>Tree</strong> <strong>Nuts</strong> <strong>Outlook</strong>/FTS-354/December 18, 2012<br />
<strong>Economic</strong> <strong>Research</strong> <strong>Service</strong>, <strong>US</strong>DA
capability, <strong>and</strong> automatic language translation. 4 Third, the global consolidation of<br />
the grocery industry has encouraged increased coordination <strong>and</strong> integration of<br />
grower/shipper operations <strong>and</strong> improved supply chain efficiency. Retail chains like<br />
Wal-Mart <strong>and</strong> Carrefour have opened hundreds of stores in developing country<br />
markets <strong>and</strong> source globally year round. Fourth, the 1995 World Trade<br />
Organization (WTO) Agreement on Agriculture <strong>and</strong> regional preferential trading<br />
arrangement have reduced barriers to horticultural trade. The North American Free<br />
Trade Agreement (NAFTA) has helped provide a liberalized trading environment<br />
within North America <strong>and</strong> can partially explain the large increase in fruit <strong>and</strong><br />
vegetable trade among the United States, Canada <strong>and</strong> Mexico.<br />
For horticultural products, the harmonized commodity coding system (HS) is<br />
divided into three subcategories: edible vegetables (HS 07 – fresh or chilled), edible<br />
fruits <strong>and</strong> nuts (HS 08 – fresh chilled, or dried), <strong>and</strong> preparations of vegetables,<br />
fruits, nuts, or other parts of plants (HS 20). U.S. horticultural exports comprised<br />
approximately 44 percent edible fruit <strong>and</strong> nuts, 26 percent edible vegetables, <strong>and</strong> 30<br />
percent processed fruits <strong>and</strong> vegetables in 2010. Here, the focus is on the U.S.<br />
industry’s competitiveness in edible <strong>and</strong> processed fruits <strong>and</strong> nuts, both in foreign<br />
markets <strong>and</strong> in the United States where there is increasing competition from<br />
foreign suppliers.<br />
Key Sectors for U. S. <strong>Fruit</strong> <strong>and</strong> Nut Trade<br />
Exports play an important <strong>and</strong> sometimes critical role for U.S. growers of select<br />
fruits <strong>and</strong> nuts. Several individual U.S. fruit <strong>and</strong> nut exports account for a<br />
significant percentage of the total volume of U.S. supply (fig. 2B). For example,<br />
exports of pistachios, almonds, <strong>and</strong> walnuts each make up over 50 percent of the<br />
volume of U.S. supply. Select fresh, canned, <strong>and</strong> dried fruit are also highly<br />
dependent on exports—grapefruit, canned cherry, <strong>and</strong> raisin exports for example<br />
comprise between 35 to nearly 50 percent of U.S. supply.<br />
While the United States is one of the largest world producers of fruits <strong>and</strong> nuts,<br />
there are several reasons why the United States imports many of these products as<br />
well. Some imports are tropical products that are in dem<strong>and</strong> by U.S. consumers but<br />
cannot be produced in sufficient quantities domestically (fig. 3B). Bananas,<br />
pineapples, mangoes, <strong>and</strong> limes are clear cut examples. Other products are<br />
purchased to complement the U.S. seasonal pattern of production, such as grapes,<br />
plums, <strong>and</strong> blueberries. Still other imports compete directly with U.S. production.<br />
Spanish clementines, for example, are marketed mainly in the U.S. winter months,<br />
vying for consumer attention with California oranges <strong>and</strong> m<strong>and</strong>arins.<br />
U.S. <strong>Fruit</strong> <strong>and</strong> Nut Exports – The United States exports a wide variety of edible<br />
fruit (HS 08) (table 1B). However, the leading five products account for a<br />
significant portion of this trade, approximately 28 percent. In the 2008-2010<br />
period, apples <strong>and</strong> grapes topped the list of fresh fruit exports, with global sales<br />
4 CBR Enterprise Applications. “Global Food Retailer Moves 55,000 Employees to Google Apps.”<br />
Enterprise Application News, September 17, 2010.<br />
http://enterpriseapplications.cbronline.com/news/global-food-retailer-moves-55000-employees-togoogle-apps-<br />
32<br />
<strong>Fruit</strong> <strong>and</strong> <strong>Tree</strong> <strong>Nuts</strong> <strong>Outlook</strong>/FTS-354/December 18, 2012<br />
<strong>Economic</strong> <strong>Research</strong> <strong>Service</strong>, <strong>US</strong>DA
Figure 2B<br />
Exports as a share of U.S. supply, selected products, 2010<br />
Pistachios<br />
Almonds<br />
Walnuts<br />
Sweet cherries: canned<br />
Raisins<br />
Grapefruit: fresh<br />
Oranges: fresh<br />
Prunes<br />
Pears: fresh<br />
Apples: fresh<br />
Tart cherries: canned<br />
Grapes: fresh<br />
Lemon: fresh<br />
Peaches: fresh<br />
Strawberries: fresh<br />
0 0.1 0.2 0.3 0.4 0.5 0.6 0.7<br />
Source: <strong>US</strong>DA, <strong>Economic</strong> <strong>Research</strong> <strong>Service</strong>, <strong>Fruit</strong> <strong>and</strong> <strong>Tree</strong> <strong>Nuts</strong> Yearbook, 2010.<br />
Figure 3B<br />
Imports as a share of U.S. consumption, selected products, 2010<br />
Mangos<br />
Limes<br />
Pineapples<br />
Bananas<br />
Apple juice<br />
Olives: canned<br />
Kiwifruit<br />
Avocadoes<br />
Prune juice<br />
Grapes: fresh<br />
Blueberries<br />
Tangerines & clemetines<br />
Plums<br />
Raspberries<br />
0 0.2 0.4 0.6 0.8 1 1.2<br />
Source: <strong>US</strong>DA, <strong>Economic</strong> <strong>Research</strong> <strong>Service</strong>, <strong>Fruit</strong> <strong>and</strong> <strong>Tree</strong> <strong>Nuts</strong> Yearbook, 2010.<br />
averaging $772 million <strong>and</strong> $609 million, respectively, followed by oranges ($463<br />
million), strawberries ($328 million), <strong>and</strong> cherries ($294 million). Sales to Canada,<br />
Japan, <strong>and</strong> Mexico account for almost forty percent of all fresh fruit <strong>and</strong> nut<br />
exports, although their share of U.S. exports has declined in recent years. Sales to<br />
other TPP countries account for an additional 3 to 4 percent. Combined exports to<br />
33<br />
<strong>Fruit</strong> <strong>and</strong> <strong>Tree</strong> <strong>Nuts</strong> <strong>Outlook</strong>/FTS-354/December 18, 2012<br />
<strong>Economic</strong> <strong>Research</strong> <strong>Service</strong>, <strong>US</strong>DA
Table 1B: Select fruit <strong>and</strong> nut exports, 2008-10 average<br />
Description HS6 Exports<br />
Fresh/chilled<br />
Apples 080810 772<br />
Grapes 080610 609<br />
Oranges 080510 463<br />
Strawberries 081010 328<br />
Cherries 080920 295<br />
Grapefruit<br />
Dried fruit <strong>and</strong> juices<br />
080540 193<br />
Raisins 080620 304<br />
Other orange juice 200919 244<br />
Frozen orange juice<br />
<strong>Nuts</strong><br />
200911 139<br />
Almonds, shelled <strong>and</strong> inshell 080212, 080211 2,000<br />
Walnuts, shelled <strong>and</strong> inshell 080231, 080232 659<br />
Pistachios, shelled <strong>and</strong> inshell 080250 572<br />
Source: United Nations, Comtrade database.<br />
$ million<br />
Hong Kong, Korea, <strong>and</strong> China make up 17 percent, which reflects a four-fold<br />
increase in the value of exports to these countries from 2000 to 2010. Much of the<br />
Hong Kong sales may be transshipped to China. The increase in middle class<br />
consumers <strong>and</strong> the reduction of trade barriers resulting from the Korean<br />
liberalization under the Uruguay Round <strong>and</strong> China’s accession to the WTO explains<br />
the dramatic rise in U.S. exports to these two heavily populated Asian countries.<br />
Processed fruit, including juices <strong>and</strong> dried, account for the remainder of fruit export<br />
revenues. Major exports include frozen <strong>and</strong> other orange juice ($383 million) <strong>and</strong><br />
raisins ($304 million). Orange juice exports increased about 50 percent in value<br />
between 2000 <strong>and</strong> 2010. Canada imports nearly 58 percent of U.S. orange juice <strong>and</strong><br />
the other TPP countries an additional 4 percent. Australia <strong>and</strong> Malaysia purchases<br />
exp<strong>and</strong>ed rapidly from nearly zero to $6 million. As for raisins, exports more than<br />
doubled between 2000 <strong>and</strong> 2010 with Japan, Canada, <strong>and</strong> Australia accounting for<br />
over 25 percent of the trade.<br />
<strong>Tree</strong> nuts are 40 percent of the total value of U.S. edible fruit <strong>and</strong> nut exports. The<br />
United States trails only China in world production of tree nuts but is the world’s<br />
largest exporter, trading nearly a third of the world’s tree nuts. Almonds are<br />
especially important to the United States. By value, almonds are the leading U.S.<br />
horticultural export commodity ($2.0 billion 2008-2010). Over the past 10 years,<br />
U.S. almond exports grew by 270 percent in value, with the United States currently<br />
accounting for nearly 75 percent of world almond exports in 2010. Other important<br />
tree nut exports include walnuts ($659 million 2008-2010) <strong>and</strong> pistachios ($572<br />
million 2008-2010). Hong Kong <strong>and</strong> China import 17 percent of U.S. tree nut<br />
exports, followed by Canada (5 percent) <strong>and</strong> Korea (3 percent).<br />
34<br />
<strong>Fruit</strong> <strong>and</strong> <strong>Tree</strong> <strong>Nuts</strong> <strong>Outlook</strong>/FTS-354/December 18, 2012<br />
<strong>Economic</strong> <strong>Research</strong> <strong>Service</strong>, <strong>US</strong>DA
U.S. <strong>Fruit</strong> <strong>and</strong> Nut Imports – Over the past decade, U.S. edible fruit <strong>and</strong> nut (HS<br />
08) imports rose dramatically in value to $10.0 billion in 2010. This trend is due, in<br />
part, to the growing dem<strong>and</strong> for offseason fruit, much of which enters at lower<br />
tariffs; the exp<strong>and</strong>ing ethnic population <strong>and</strong> curiosity about ethnic foods; <strong>and</strong> the<br />
interest among many Americans to sample new temperate <strong>and</strong> tropical fruits.<br />
Bananas <strong>and</strong> grapes are the two most important imports, valued at $1.9 billion <strong>and</strong><br />
$1.3 billion, respectively, followed by avocados ($671 million), pineapples ($548<br />
million) <strong>and</strong> cranberries/blueberries ($379 million, 85 percent blueberries) (table<br />
2B). U.S. consumer dem<strong>and</strong> <strong>and</strong> the progressive relaxation of U.S. phytosanitary<br />
measures between 2001 <strong>and</strong> 2007 explain the over 2200 percent increase in avocado<br />
imports from Mexico. Similarly, U.S. imports of Chilean blueberries exp<strong>and</strong>ed by<br />
over 2,100 percent over the last decade, as Chilean growers have continued to<br />
respond to U.S. market opportunities.<br />
Edible fruit <strong>and</strong> nuts from Mexico (grapes, avocados, mangos, strawberries <strong>and</strong><br />
other berries, <strong>and</strong> watermelon) <strong>and</strong> Chile (grapes, blueberries, apples, <strong>and</strong> stone<br />
fruit) dominate U.S. fruit imports, with a combined share just shy of 50 percent of<br />
the total import value in 2010. The two countries, both of which have regional<br />
trade agreements with the United States, increased their imports in dollar value<br />
from $1.8 billion in 2000 to $4.7 billion in 2010). Mexico also captured a larger<br />
market share—28 percent in 2010 compared with 19 percent in 2000. U.S. imports<br />
from Vietnam, mainly cashews, increased approximately 575 percent allowing<br />
Vietnam’s share of the U.S. edible fruit <strong>and</strong> nut market to exp<strong>and</strong> to nearly 4<br />
percent ($353 million).<br />
Table 2B: Select fruit <strong>and</strong> nut imports, 2008-10 average<br />
Description HS6 Imports<br />
Fresh/chilled<br />
Bananas 080300 1,903<br />
Grapes 080610 1,282<br />
Avocados 080440 671<br />
Pineapples 080430 548<br />
Cranberries/blueberries 081040 379<br />
Other Melons 080719 285<br />
Watermelons 080711 240<br />
Lemons <strong>and</strong> Limes 080530 213<br />
Strawberries<br />
Prepared fruit, juices, <strong>and</strong> nuts<br />
081010 169<br />
Cashews 080132 692<br />
Apple juice 200970 499<br />
Frozen orange juice 200911 352<br />
Prepared pineapples 200820 344<br />
Source: United Nations, Comtrade database.<br />
$ million<br />
35<br />
<strong>Fruit</strong> <strong>and</strong> <strong>Tree</strong> <strong>Nuts</strong> <strong>Outlook</strong>/FTS-354/December 18, 2012<br />
<strong>Economic</strong> <strong>Research</strong> <strong>Service</strong>, <strong>US</strong>DA
Fresh fruit imports may compete with frozen or canned U.S. produced fruit.<br />
However, availability of high-quality perishable products, such as grapes <strong>and</strong><br />
blueberries, in the offseason may increase the dem<strong>and</strong> for U.S. produced fresh fruit<br />
or vegetables in season. According to the theory of habit formation, consumers<br />
may develop eating patterns dependent on consumption in a previous period. In<br />
their research, Ferrier <strong>and</strong> Zhen find that U.S. consumers do form habits consuming<br />
asparagus—eating asparagus in the fall months encourages consumers to purchase<br />
more in the spring months when U.S. production occurs. Stanton finds similar<br />
results in her study on U.S. consumption of U.S. grown grapes <strong>and</strong> offseason<br />
imports of Chilean grapes. The imports contribute to an increase in per capita sales<br />
of U.S. grapes. Another example may be blueberries, which in recent years the U.S.<br />
imports most heavily from December through February, mainly from Chile. U.S.<br />
per capita consumption of domestically produced blueberries has increased by<br />
around a half a pound over the last decade. Awareness of health benefits associated<br />
with blueberries <strong>and</strong> price likely are the primary motives for increased<br />
consumption, but year-round habit formation may be a contributing factor.<br />
Improving Market Access Within the Trans-Pacific Partnership Region<br />
For the United States, the TPP provides a framework for increasing market access<br />
in Brunei, Japan, Malaysia, New Zeal<strong>and</strong>, <strong>and</strong> Vietnam, countries with which it<br />
does not currently have existing bilateral free trade agreements (table 3B). U.S.<br />
exports are levied the most-favored-nation (MFN) duty in these five countries <strong>and</strong><br />
face a disadvantage against competitors that have already signed free trade<br />
agreements (FTAs) with these countries. The other six TPP countries (Australia,<br />
Canada, Chile, Mexico, Peru, <strong>and</strong> Singapore) already have FTAs with the United<br />
States, <strong>and</strong>, at this point, it is not clear whether the TPP negotiations would result in<br />
any increased market access between already existing FTA partners. In these<br />
countries the United States is likely to face increased competition from countries<br />
that would gain preferential access as a result of a TPP agreement.<br />
Table 3B: Already existing free trade agreements (FTAs) between TPP countries<br />
TPP Country TPP Partners with which an FTA already exists<br />
Australia Brunei, Chile, Malaysia, New Zeal<strong>and</strong>, Singapore, U.S., Vietnam<br />
Brunei Australia, Chile, Japan, Malaysia, New Zeal<strong>and</strong>, Singapore, Vietnam<br />
Canada Chile, Mexico, Peru, U.S.<br />
Chile Australia, Brunei, Canada, Japan, Mexico, New Zeal<strong>and</strong>, Peru, Singapore, U.S.<br />
Japan Brunei, Chile, Malaysia, Mexico, Peru,Singapore, Vietnam<br />
Malaysia Australia, Brunei, Japan, New Zeal<strong>and</strong>, Singapore, Vietnam<br />
Mexico Canada, Chile, Japan, Peru, U.S.<br />
New Zeal<strong>and</strong> Australia, Brunei, Chile, Malaysia, Singapore, Vietnam<br />
Peru Canada, Chile, Japan, Mexico, Singapore, U.S.<br />
Singapore Australia, Brunei, Chile, Japan, Malaysia, New Zeal<strong>and</strong>, Peru, U.S., Vietnam<br />
United States Australia, Canada, Chile, Mexico, Peru, Singapore<br />
Vietnam Australia, Brunei, Japan, Malaysia, New Zeal<strong>and</strong>, Singapore<br />
TPP = Trans-Pacific Partnership.<br />
Source: World Trade Organization regional trade agreements <strong>and</strong> preferntial trade agreements<br />
(http://w w w .w to.org/english/tratop_e/region_e/rta_pta_e.htm)<br />
36<br />
<strong>Fruit</strong> <strong>and</strong> <strong>Tree</strong> <strong>Nuts</strong> <strong>Outlook</strong>/FTS-354/December 18, 2012<br />
<strong>Economic</strong> <strong>Research</strong> <strong>Service</strong>, <strong>US</strong>DA
<strong>Fruit</strong> <strong>and</strong> <strong>Nuts</strong> Markets with Greatest Expansion Potential – Thirty-two HS 06<br />
level products were identified as holding the greatest export potential, based on the<br />
size of the overall market, the height of the MFN tariff, <strong>and</strong> the competitive position<br />
of the United States in our currently non-partnered TPP countries—Japan,<br />
Malaysia, New Zeal<strong>and</strong>, <strong>and</strong> Vietnam 5 (table 4B). Together these 32 products<br />
accounted for 62 percent of U.S. fruit <strong>and</strong> nut exports to these countries during<br />
2008-10. The bulk of the remaining U.S. exports to these countries were levied low<br />
or zero tariffs so a TPP agreement would not be expected to result in much<br />
additional market access.<br />
Total imports in each market is subdivided into four categories: (1) those from the<br />
United States; (2) from countries, including TPP countries, that already have an<br />
FTA with the importer; (3) from TPP countries that do not currently have an FTA<br />
with the importer; <strong>and</strong> (4) all other countries. The last three categories give an idea<br />
of the current <strong>and</strong> potential post-TPP competitive position of the United States. The<br />
larger the market share of current FTA partners plus non-TPP MFN partners <strong>and</strong> the<br />
larger the MFN tariff, the greater the potential of increased U.S. exports. The<br />
United States would be expected to gain market share from competitors now facing<br />
preferential rates as the United States began facing these lower rates. The United<br />
States would also be expected to gain market share from non-TPP countries that<br />
would continue to face the higher MFN rates. However, those gains would be<br />
shared with other TPP countries that do not currently have an FTA with the<br />
importer. The larger the market share of this group of countries, the less the<br />
potential gain in market share by U.S. exporters.<br />
The United States is already the dominant supplier in many of these markets,<br />
including the Japanese markets for grapefruit, fresh cherries, fresh oranges, shelled<br />
walnuts, fresh strawberries, fresh raspberries, blackberries, <strong>and</strong> mulberries, <strong>and</strong><br />
m<strong>and</strong>arins. The United States could be expected to maintain this position, but<br />
would probably not significantly increase market share. In these cases, gains would<br />
result from overall growth in trade rather than in trade diversion from one country<br />
to another. The larger the MFN tariff the greater potential for trade expansion,<br />
which bodes well for fresh citrus exports to Japan.<br />
At the other end of the spectrum are the Japanese markets for grape juice;<br />
prepared/preserved cherries, strawberries, nuts, <strong>and</strong> citrus; frozen orange juice; <strong>and</strong><br />
apple juice. The U.S. market share is currently small, the import market is<br />
dominated by FTA partners or other MFN countries, <strong>and</strong> average tariffs are in the<br />
double digits. The fresh apple market in Vietnam also shares these characteristics.<br />
Reducing or eliminating the margin of preference that FTA partners currently<br />
receive in these markets while exporting at preferential rates should allow U.S.<br />
exporters to grab market share from the competitors.<br />
Other fairly large markets with double-digit MFN tariffs where the United States<br />
could also see export gains include those for grapefruit <strong>and</strong> other single fruit juices<br />
<strong>and</strong> mixtures, other berries, <strong>and</strong> fresh grapes in Japan <strong>and</strong> dried <strong>and</strong> fresh grapes in<br />
Vietnam. Whether the United States experiences future trade gains also depends on<br />
any changes or limitations related to sanitary <strong>and</strong> phytosanitary measures <strong>and</strong> other<br />
st<strong>and</strong>ards that trading partners may impose.<br />
5<br />
Import data for Brunei were not available.<br />
37<br />
<strong>Fruit</strong> <strong>and</strong> <strong>Tree</strong> <strong>Nuts</strong> <strong>Outlook</strong>/FTS-354/December 18, 2012<br />
<strong>Economic</strong> <strong>Research</strong> <strong>Service</strong>, <strong>US</strong>DA
Table 4B: Fresh <strong>and</strong> processed fruit <strong>and</strong> nut markets with the largest export potential in the TPP, 2008-10 totals<br />
United States All FTA partners TPP MFN partners Other MFN partners<br />
Product Importer<br />
Avg.<br />
applied<br />
tariff<br />
Total<br />
imports<br />
$1,000<br />
Market<br />
share<br />
$1,000<br />
Market<br />
share<br />
$1,000<br />
Market<br />
share<br />
$1,000<br />
Market<br />
share<br />
Grapefruit Japan 10.0 547,010 401,949 73.5% 265 0.0% 109 0.0% 144,686 26.5%<br />
Cherries, fresh Japan 8.5 245,472 241,998 98.6% 1,168 0.5% 2,306 0.9% 0 0.0%<br />
Oranges, fresh/dried Japan 24.0 323,410 224,218 69.3% 7,668 2.4% 73,857 22.8% 17,666 5.5%<br />
Juice of any other single fruit or vegetable,<br />
including pear, prune, <strong>and</strong> tomato<br />
Japan<br />
Vietnam<br />
17.0<br />
25.0<br />
472,048<br />
11,372<br />
175,861<br />
6,004<br />
37.3%<br />
52.8%<br />
25,406<br />
3,102<br />
5.4%<br />
27.3%<br />
117,938<br />
5<br />
25.0%<br />
0.0%<br />
152,844<br />
2,262<br />
32.4%<br />
19.9%<br />
New Zeal<strong>and</strong> 6.1 20,405 3,505 17.2% 8,313 40.7% 1,114 5.5% 7,473 36.6%<br />
Walnuts, shelled Japan 10.0 194,913 182,062 93.4% 125 0.1% 14 0.0% 12,713 6.5%<br />
Straw berries, fresh/chilled Japan 6.0 91,043 80,832 88.8% 5 0.0% 0 0.0% 10,206 11.2%<br />
All others, including berries, apples, grapes,<br />
mangoes, citrus, prep/pres<br />
Japan 14.3 595,238 76,889 12.9% 187,364 31.5% 3,198 0.5% 327,788 55.1%<br />
Grape juice (including grape must) Japan 24.4 289,009 69,937 24.2% 44,424 15.4% 12,248 4.2% 162,399 56.2%<br />
Fresh grapes<br />
Mixtures of juices<br />
Japan 12.4 61,063 27,401 44.9% 32,778 53.7% 725 1.2% 158 0.3%<br />
Vietnam 10.0 72,161 22,378 31.0% 39,959 55.4% 6,761 9.4% 3,062 4.2%<br />
Malaysia 5.0 44,201 14,159 32.0% 12,578 28.5% 6,510 14.7% 10,953 24.8%<br />
New Zeal<strong>and</strong> 6.3 42,684 26,554 62.2% 15,311 35.9% 26 0.1% 792 1.9%<br />
Malaysia 5.0 30,092 15,848 52.7% 7,993 26.6% 13 0.0% 6,238 20.7%<br />
Japan 18.5 56,842 15,102 26.6% 7,332 12.9% 5,878 10.3% 28,531 50.2%<br />
Other berries, steamed/frozen Japan 12.2 304,293 56,259 18.5% 56,305 18.5% 94,724 31.1% 97,006 31.9%<br />
Grapefruit juice Japan 24.4 127,443 51,933 40.7% 6,297 4.9% 3,653 2.9% 65,561 51.4%<br />
Straw berries, steamed/frozen<br />
Raspberries, blackberries, mulberries,<br />
Japan 10.8 134,086 42,416 31.6% 11,030 8.2% 93 0.1% 80,547 60.1%<br />
fresh/chilled Japan 6.0 34,019 32,777 96.4% 1,218 3.6% 18 0.1% 6 0.0%<br />
M<strong>and</strong>arins (including tangerines <strong>and</strong><br />
clementines)<br />
Japan 17.0 43,585 32,441 74.4% 1,019 2.3% 9,244 21.2% 881 2.0%<br />
Apples, fresh<br />
Malaysia 5.0 146,814 17,548 12.0% 67,723 46.1% 514 0.3% 61,030 41.6%<br />
Vietnam 10.0 75,827 12,581 16.6% 61,872 81.6% 1,039 1.4% 335 0.4%<br />
<strong>Nuts</strong> <strong>and</strong> other seeds, prep/pres Japan 10.8 335,283 29,250 8.7% 23,966 7.1% 10,594 3.2% 271,473 81.0%<br />
Frozen orange juice<br />
Japan 25.5 249,889 21,037 8.4% 25,895 10.4% 0 0.0% 202,957 81.2%<br />
Cranberries, bilberries <strong>and</strong> other fruits of the<br />
New Zeal<strong>and</strong> 6.1 32,932 3,185 9.7% 5,093 15.5% 0 0.0% 24,653 74.9%<br />
genus Vaccinium, fresh/chilled Japan 6.0 51,226 19,708 38.5% 18,243 35.6% 10,250 20.0% 3,025 5.9%<br />
Other melons Japan 6.0 94,036 18,247 19.4% 68,050 72.4% 1,453 1.5% 6,286 6.7%<br />
Dried grapes<br />
Malaysia 5.0 17,950 9,887 55.1% 2,680 14.9% 0 0.0% 5,383 30.0%<br />
Vietnam 13.0 7,022 4,532 64.5% 2,353 33.5% 55 0.8% 82 1.2%<br />
Apple juice Japan 26.5 428,352 9,962 2.3% 22,356 5.2% 14,802 3.5% 381,232 89.0%<br />
Citrus fruit, prep/pres Japan 23.0 175,676 8,942 5.1% 3,124 1.8% 20 0.0% 163,589 93.1%<br />
Other, including mixtures, prep/pres<br />
New Zeal<strong>and</strong> 7.0 26,082 3,946 15.1% 18,562 71.2% 0 0.0% 3,574 13.7%<br />
Japan 17.3 64,682 3,727 5.8% 20,662 31.9% 3,073 4.8% 37,221 57.5%<br />
Cherries, prep/pres Japan 13.5 26,981 7,316 27.1% 3,679 13.6% 0 0.0% 15,987 59.3%<br />
Straw berries, prep/pres Japan 14.8 30,535 6,461 21.2% 839 2.7% 55 0.2% 23,181 75.9%<br />
Figs Japan 6.0 19,098 5,994 31.4% 117 0.6% 0 0.0% 12,988 68.0%<br />
Apricots, dried Japan 9.0 12,437 5,687 45.7% 20 0.2% 0 0.0% 6,729 54.1%<br />
Other nuts, fresh/dried<br />
Raspberries, blackberries, mulberries,<br />
Japan 5.4 89,137 5,265 5.9% 5 0.0% 39,779 44.6% 44,087 49.5%<br />
steamed/frozen Japan 7.8 27,742 5,250 18.9% 6,001 21.6% 3,198 11.5% 13,293 47.9%<br />
Juice of any other single citrus fruit Japan 19.2 159,155 4,312 2.7% 873 0.5% 0 0.0% 153,970 96.7%<br />
Tamarinds, other berries, fresh/chilled Japan 5.5 17,425 4,005 23.0% 5,769 33.1% 902 5.2% 6,749 38.7%<br />
All products <strong>and</strong> countries 12.3 5,828,669 2,007,362 34.4% 827,544 14.2% 424,167 7.3% 2,569,596 44.1%<br />
prep/pres = Prepared or preserved.<br />
Grape must = Freshly pressed grape juice, including skin, seeds, <strong>and</strong> stem.<br />
Source: United Nations, Comtrade database.<br />
38<br />
<strong>Fruit</strong> <strong>and</strong> <strong>Tree</strong> <strong>Nuts</strong> <strong>Outlook</strong>/FTS-354/December 18, 2012<br />
<strong>Economic</strong> <strong>Research</strong> <strong>Service</strong>, <strong>US</strong>DA
Where Might U.S. Exporters Lose Market Share in FTA Partner Markets? – With<br />
the successful completion of a TPP agreement, the United States could begin facing<br />
increased competition in some product markets in those TPP countries where the<br />
United States currently enjoys a competitive advantage due to an FTA. This<br />
competition would come from other TPP countries that currently face higher MFN<br />
rates on their exports. In determining which markets may be most vulnerable to<br />
increased competition, this analysis is limited to only those U.S. products that<br />
competed with products from at least one non-FTA TPP country <strong>and</strong> those products<br />
where the MFN rate was greater than zero (table 5B). <strong>Fruit</strong> <strong>and</strong> nut exports to the<br />
six TPP countries with which the U.S. already has an FTA totaled $10.0 billion<br />
during the 2008-10 period. About 35 percent of this trade was in products where<br />
the MFN tariff was duty free, so the United States did not enjoy a competitive<br />
advantage. Another 22 percent was in products that did not compete with TPP<br />
countries facing MFN rates <strong>and</strong> the MFN rates were relatively low<br />
(below 4 percent).<br />
Singapore was excluded from the listing of six TPP countries with which the United<br />
States has an FTA because all of their fruit <strong>and</strong> nut imports enter duty free. Peru is<br />
also not found because they did not import fruits <strong>and</strong> nuts from any TPP countries<br />
that are not already FTA partners. Peru fruit <strong>and</strong> nut MFN tariffs are fairly high,<br />
averaging 20 percent, which might explain why no TPP countries were able to<br />
export at the MFN rate. Even among the four countries found in table 5B, very<br />
little was imported from TPP competitors at the MFN rate. With the signing of a<br />
TPP <strong>and</strong> the ability to export at preferential rates as the United States now does, this<br />
could change.<br />
The most vulnerable products are likely to be those facing the highest tariffs, which<br />
include 13 products that the U.S. exports to Mexico (table 5B). The average<br />
applied MFN tariffs range from 22 to 27.4 percent for these products. The largest<br />
of these markets are for fresh apples <strong>and</strong> processed/preserved nuts, two markets that<br />
the United States currently dominates in Mexico. However, New Zeal<strong>and</strong> has been<br />
able to export some apples <strong>and</strong> Vietnam some processed nuts, despite facing<br />
average tariffs of 23 percent. Should they acquire duty-free access in these markets,<br />
the United States could face more competition. U.S. exports of fresh kiwis to<br />
Mexico would also be vulnerable to increased competition from New Zeal<strong>and</strong>.<br />
Escalated competition from several Canadian products in the Australian market<br />
might also be expected. The most important being fruit juices, juice mixtures, <strong>and</strong><br />
processed/preserved nuts. Australia <strong>and</strong> New Zeal<strong>and</strong> would become more<br />
competitive in the Canadian market, with the most vulnerable U.S. exports being<br />
processed/preserved pears, apricots, <strong>and</strong> peaches; apple juice; fruit jams, jellies, <strong>and</strong><br />
pastes; fresh plums, apricots, peaches, <strong>and</strong> cherries; frozen berries, <strong>and</strong> dried apples.<br />
The United States could also face increased competition from Malaysia <strong>and</strong><br />
Vietnam in a few Chilean markets, although the export value is small.<br />
Conclusion<br />
The Trans-Pacific Partner countries imported nearly $47 billion of horticultural<br />
products <strong>and</strong> exported $40 billion in 2010. The United States comprises a major<br />
portion of that trade, 49 <strong>and</strong> 39 percent respectively. These numbers reflect at least<br />
a doubling of trade from a decade earlier. The United States signing of free trade<br />
39<br />
<strong>Fruit</strong> <strong>and</strong> <strong>Tree</strong> <strong>Nuts</strong> <strong>Outlook</strong>/FTS-354/December 18, 2012<br />
<strong>Economic</strong> <strong>Research</strong> <strong>Service</strong>, <strong>US</strong>DA
Table 5B: Fresh <strong>and</strong> processed fruit <strong>and</strong> nut markets vulnerable to increased competition in the TPP, 2008-10 totals<br />
Total<br />
imports<br />
United States TPP MFN partners<br />
Importer Product<br />
Avg.<br />
applied<br />
tariff<br />
$1,000 $1,000<br />
Market<br />
share<br />
$1,000<br />
Market<br />
share<br />
Main competitor(s)<br />
Mixtures of juices 5.0 58,165.0 44,075.6 75.8% 963.9 1.7% Japan, Mexico<br />
All others, including berries, apples, grapes, mangoes, citrus, etc. 5.0 107,370.8 23,818.5 22.2% 7,378.3 6.9% Canada, Japan, Mexico, Peru<br />
<strong>Nuts</strong> <strong>and</strong> other seeds, prep/pres 5.0 45,372.7 22,901.6 50.5% 190.1 0.4% Japan<br />
Juice of any other single fruit or vegetable 5.0 86,260.8 17,723.0 20.5% 2,534.6 2.9% Canada,Mexico, Peru<br />
Frozen orange juice 5.0 136,646.7 10,167.3 7.4% 342.7 0.3% Mexico<br />
Cherries, prep/pres 5.0 10,540.6 5,312.3 50.4% 218.5 2.1% Canada<br />
Australia<br />
Other fruit, dried 5.0 19,120.5 4,607.9 24.1% 336.9 1.8% Canada<br />
Other fruit jams, jellies, pastes 5.0 117,794.7 3,768.2 3.2% 1,049.8 0.9% Canada, Mexico<br />
Other orange juice 5.0 2,649.5 910.7 34.4% 49.1 1.9% Canada<br />
Grape juice (including grape must) 5.0 13,097.4 781.4 6.0% 97.3 0.7% Canada<br />
Apple juice 5.0 132,377.0 359.9 0.3% 13.2 0.0% Canada<br />
Mixtures of nuts or dried fruits, dried 5.0 9,890.7 346.6 3.5% 5.8 0.1% Canada<br />
Straw berries, steamed/frozen 4.0 18,320.7 342.2 1.9% 738.5 4.0% Mexico, Peru<br />
Juice of any other single citrus fruit 2.5 27,446.3 1,461.2 5.3% 4,467.8 16.3% Mexico<br />
Citrus fruit jams, pastes, marmalades 8.5 7,289.9 2,580.6 35.4% 4.4 0.1% Japan<br />
Pears, prep/pres 7.8 31,842.4 15,159.4 47.6% 2,269.6 7.1% Australia, Japan, New Zeal<strong>and</strong><br />
Apricots, prep/pres 7.8 5,415.0 2,592.2 47.9% 45.1 0.8% Australia<br />
Apple juice 7.0 214,523.4 51,081.4 23.8% 158.2 0.1% New Zeal<strong>and</strong><br />
Other fruit jams, jellies, pastes 7.0 106,581.8 43,887.9 41.2% 2,057.4 1.9% Australia, New Zeal<strong>and</strong><br />
Peaches, prep/pres 7.0 88,831.2 20,509.6 23.1% 1,087.3 1.2% Australia<br />
Plums <strong>and</strong> sloes, fresh 6.3 112,448.9 76,750.0 68.3% 181.2 0.2% Australia, New Zeal<strong>and</strong><br />
Canada<br />
Apricots, fresh 6.2 28,808.1 25,188.7 87.4% 138.4 0.5% Australia, New Zeal<strong>and</strong><br />
Raspberries, blackberries, mulberries, steamed/frozen 6.0 84,540.9 30,009.7 35.5% 19.1 0.0% New Zeal<strong>and</strong><br />
Apples, dried 6.0 27,056.7 22,227.1 82.1% 18.6 0.1% Australia<br />
Straw berries, fresh/chilled 5.7 800,052.1 747,962.2 93.5% 574.4 0.1% New Zeal<strong>and</strong><br />
Peaches, including nectarines, fresh 5.4 241,724.1 193,432.0 80.0% 572.6 0.2% Australia<br />
Cherries, fresh 5.1 363,407.8 313,062.8 86.1% 231.3 0.1% Australia, New Zeal<strong>and</strong><br />
Grape juice (including grape must) 4.8 212,310.9 107,971.1 50.9% 3,058.3 1.4% Australia, New Zeal<strong>and</strong><br />
Pears <strong>and</strong> quinces 4.6 235,704.2 123,573.9 52.4% 8,565.3 3.6% Australia, New Zeal<strong>and</strong><br />
Apples, fresh 4.3 531,464.5 399,308.3 75.1% 30,987.7 5.8% New Zeal<strong>and</strong><br />
Other berries, steamed/frozen 6.0 12,999.9 2,196.1 16.9% 128.1 1.0% Vietnam<br />
Chile<br />
Juice of any other single fruit or vegetable 6.0 7,302.4 1,819.4 24.9% 45.6 0.6% Malaysia<br />
All others, including berries, apples, grapes, mangoes, citrus, etc. 6.0 5,462.4 1,258.4 23.0% 43.6 0.8% Malaysia<br />
Other fruit jams, jellies, pastes 6.0 14,015.0 393.5 2.8% 22.5 0.2% Malaysia<br />
Other fruit jams, jellies, pastes 27.4 45,504.0 12,116.7 26.6% 42.5 0.1% New Zeal<strong>and</strong><br />
Apples, fresh 23.0 666,903.7 630,095.2 94.5% 1,197.1 0.2% New Zeal<strong>and</strong><br />
<strong>Nuts</strong> <strong>and</strong> other seeds, prep/pres 23.0 156,116.2 146,767.7 94.0% 94.9 0.1% Vietnam<br />
Peaches, prep/pres 23.0 171,739.5 33,911.4 19.7% 28.2 0.0% Australia<br />
All others, including berries, apples, grapes, mangoes, citrus, etc. 23.0 61,719.2 33,551.4 54.4% 13.8 0.0% New Zeal<strong>and</strong>, Vietnam<br />
Juice of any other single fruit or vegetable 23.0 32,675.4 20,863.6 63.9% 208.6 0.6% Australia, Malaysia<br />
Mexico Other nuts, fresh/dried 23.0 19,427.1 16,286.3 83.8% 3.8 0.0% Australia<br />
Other, including mixtures, prep/pres 23.0 32,443.0 9,088.3 28.0% 51.8 0.2% Australia, Vietnam<br />
Pineapples, prep/pres 23.0 44,812.4 3,036.0 6.8% 340.4 0.8% Vietnam<br />
Apricots, prep/pres 23.0 3,905.3 2,071.9 53.1% 10.2 0.3% Australia<br />
Cashew nuts, shelled 23.0 9,793.3 551.1 5.6% 176.2 1.8% Vietnam<br />
Citrus fruit, prep/pres 23.0 1,959.3 467.1 23.8% 21.5 1.1% Vietnam<br />
Kiw ifruit, fresh/chilled 22.0 45,871.9 20,712.9 45.2% 9,769.4 21.3% New Zeal<strong>and</strong><br />
All countries <strong>and</strong> products<br />
prep/pres = Prepared or preserved.<br />
Grape must = Freshly pressed grape juice, including skin, seeds, <strong>and</strong> stem.<br />
Source: United Nations, Comtrade database.<br />
10.5 5,210,705.3 3,248,060.6 62.3% 81,553.2 1.6%<br />
40<br />
<strong>Fruit</strong> <strong>and</strong> <strong>Tree</strong> <strong>Nuts</strong> <strong>Outlook</strong>/FTS-354/December 18, 2012<br />
<strong>Economic</strong> <strong>Research</strong> <strong>Service</strong>, <strong>US</strong>DA
agreements with Canada, Mexico, Australia, Chile, Peru, <strong>and</strong> Singapore signified<br />
major progress in reducing barriers <strong>and</strong> spurring horticultural trade. However,<br />
average tariffs on fruits <strong>and</strong> vegetables remain quite high within several Trans-<br />
Pacific Partner countries. Simple applied average rates facing U.S. horticultural<br />
exporters are 20 percent to Japan, 13 percent to Malaysia, <strong>and</strong> 25 percent to<br />
Vietnam. Japan levies tariffs of 10 percent or more on oranges, grapefruits, grapes,<br />
walnuts, <strong>and</strong> various juices, most notably orange <strong>and</strong> grapefruit juices. Fresh <strong>and</strong><br />
preserved cherries have tariffs of 8.5 <strong>and</strong> 13.5 percent. Phytosanitary restrictions<br />
add to the difficulties of entering some of these foreign markets.<br />
The goals of TPP extend well beyond the agricultural sector. Reducing the<br />
economic distortions caused by tariff <strong>and</strong> nontariff barriers in many sectors help<br />
nations focus on producing the products that they have a comparative advantage.<br />
According to the Peterson Institute for <strong>Economic</strong>s, TPP can generate annual global<br />
income gains of $295 billion including a significant portion to the United States<br />
(Petri <strong>and</strong> Plummer). Increases in income combined with reductions in horticultural<br />
tariffs <strong>and</strong> more openness <strong>and</strong> transparent procedures for sanitary, phytosanitary,<br />
<strong>and</strong> other technical st<strong>and</strong>ards can generate increased dem<strong>and</strong> <strong>and</strong> trade for U.S. fruit<br />
<strong>and</strong> vegetables.<br />
References<br />
Fergusson, Ian F. <strong>and</strong> Bruce Vaughn. “The Trans-Pacific Partnership Agreement.”<br />
Congressional <strong>Research</strong> <strong>Service</strong>, December 12, 2011.<br />
Ferrier, P., <strong>and</strong> C. Zhen. “Habit Effects <strong>and</strong> Producer Welfare in the Fresh<br />
Vegetable Trade,” Paper presented at 2011 Annual Meeting of the Agricultural <strong>and</strong><br />
Applied <strong>Economic</strong>s Association, Pittsburgh, PA, August 24-26, 2011.<br />
Office of the United States Trade Representative. Report on Technical Barriers to<br />
Trade (TBT Report), March 2012.<br />
Office of the United States Trade Representative. Report on Sanitary <strong>and</strong><br />
Phytosanitary Measures, March 2012.<br />
Office of the United States Trade Representative. “Outlines of the Trans-Pacific<br />
Partnership Agreement,” fact sheet http://www.ustr.gov/about-us/press-office/factsheets/2011/november/outlines-trans-pacific-partnership-agreement,<br />
November 2011.<br />
Petri, Peter A. <strong>and</strong> Michael G. Plummer. The Trans-Pacific Partnership <strong>and</strong> Asia-<br />
Pacific Integration: Policy Implications, Peterson Institute for <strong>Economic</strong>s Policy<br />
Brief No. PB12-16, June 2012.<br />
Stanton, J. 2007. “Habits in Fresh Produce Consumption,” Journal of Food<br />
Products Marketing 13(1):1-18.<br />
41<br />
<strong>Fruit</strong> <strong>and</strong> <strong>Tree</strong> <strong>Nuts</strong> <strong>Outlook</strong>/FTS-354/December 18, 2012<br />
<strong>Economic</strong> <strong>Research</strong> <strong>Service</strong>, <strong>US</strong>DA
February 21-22, 2013<br />
Crystal Gateway Marriott Hotel<br />
Arlington, Virginia<br />
www.usda.gov/oce/forum<br />
<strong>US</strong>DA is an equal opportunity provider <strong>and</strong> employer.
Contacts <strong>and</strong> Links<br />
Contact Information<br />
Agnes Perez (Noncitrus <strong>and</strong> tropical fruit; melons), (202) 694-5255,<br />
acperez@ers.usda.gov<br />
Kristy Plattner (Citrus <strong>and</strong> tree nuts), (202) 694-5190, kplattner@ers.usda.gov<br />
Subscription Information<br />
Subscribe to ERS’ e-mail notification service at http://www.ers.usda.gov/updates/ to<br />
receive timely notification of newsletter availability. Printed copies can be purchased<br />
from the National Technical Information <strong>Service</strong> by calling 1-800-999-6779 (specify<br />
the issue number or series SUB-FTS-4036).<br />
Data<br />
The <strong>Fruit</strong> <strong>and</strong> <strong>Tree</strong> <strong>Nuts</strong> Situation <strong>and</strong> <strong>Outlook</strong> Yearbook has over 130 tables of<br />
annual or monthly time-series data on specific fruit commodities. Data include<br />
bearing acreage, production, prices, trade, per capita use, <strong>and</strong> more. To order a<br />
copy, call 1-800-999-6779.<br />
Related Websites<br />
<strong>Fruit</strong> <strong>and</strong> <strong>Tree</strong> <strong>Nuts</strong> <strong>Outlook</strong><br />
http://usda.mannlib.cornell.edu/MannUsda/viewDocumentInfo.do?documentID=13<br />
78<br />
<strong>Fruit</strong> <strong>and</strong> <strong>Tree</strong> <strong>Nuts</strong> Topic Page<br />
http://www.ers.usda.gov/topics/crops/fruit-tree-nuts.aspx<br />
Organic Farming Topic Page<br />
http://www.ers.usda.gov/topics/natural-resources-environment/organicagriculture.asp<br />
Vegetable <strong>and</strong> Pulses Topic Page<br />
http://www.ers.usda.gov/topics/crops/vegetables-pulses.aspx<br />
The U.S. Department of Agriculture (<strong>US</strong>DA) prohibits discrimination in all its programs <strong>and</strong><br />
activities on the basis of race, color, national origin, age, disability, <strong>and</strong>, where applicable, sex,<br />
marital status, familial status, parental status, religion, sexual orientation, genetic information,<br />
political beliefs, reprisal, or because all or a part of an individual’s income is derived from any<br />
public assistance program. (Not all prohibited bases apply to all programs.) Persons with disabilities<br />
who require alternative means for communication of program information (Braille, large print,<br />
audiotape, etc.) should contact <strong>US</strong>DA’s TARGET Center at (202) 720-2600 (voice <strong>and</strong> TDD). To<br />
file a complaint of discrimination write to <strong>US</strong>DA, Director, Office of Civil Rights, 1400<br />
Independence Avenue, S.W., Washington, D.C. 20250-9410 or call (800) 795-3272 (voice) or (202)<br />
720-6382 (TDD). <strong>US</strong>DA is an equal opportunity provider <strong>and</strong> employer.<br />
43<br />
<strong>Fruit</strong> <strong>and</strong> <strong>Tree</strong> <strong>Nuts</strong> <strong>Outlook</strong>/FTS-354/December 18, 2012<br />
<strong>Economic</strong> <strong>Research</strong> <strong>Service</strong>, <strong>US</strong>DA<br />
E-mail Notification<br />
Readers of ERS outlook reports<br />
have two ways they can receive an<br />
e-mail notice about release of<br />
reports <strong>and</strong> associated data.<br />
• Receive timely notification (soon<br />
after the report is posted on the web)<br />
via <strong>US</strong>DA’s <strong>Economic</strong>s, Statistics<br />
<strong>and</strong> Market Information System<br />
(which is housed at Cornell<br />
University’s Mann Library). Go to<br />
http://usda.mannlib.cornell.edu/Man<br />
nUsda/aboutEmail<strong>Service</strong>.do <strong>and</strong><br />
follow the instructions to receive email<br />
notices about ERS,<br />
Agricultural Marketing <strong>Service</strong>,<br />
National Agricultural Statistics<br />
<strong>Service</strong>, <strong>and</strong> World Agricultural<br />
<strong>Outlook</strong> Board products.<br />
• Receive weekly notification (on<br />
Friday afternoon) via the ERS<br />
website. Go to<br />
http://www.ers.usda.gov/Updates/<br />
<strong>and</strong> follow the instructions to<br />
receive notices about ERS outlook<br />
reports, Amber Waves magazine,<br />
<strong>and</strong> other reports <strong>and</strong> data products<br />
on specific topics. ERS also offers<br />
RSS (really simple syndication)<br />
feeds for all ERS products. Go to<br />
http://www.ers.usda.gov/rss/ to get<br />
started.