Entire report - Economic Research Service - US Department of ...
Entire report - Economic Research Service - US Department of ...
Entire report - Economic Research Service - US Department of ...

Create successful ePaper yourself
Turn your PDF publications into a flip-book with our unique Google optimized e-Paper software.
<strong>Economic</strong><br />
<strong>Research</strong><br />
<strong>Service</strong><br />
Sugar and<br />
Sweeteners<br />
Outlook<br />
SSS-M-295<br />
March 14, 2013<br />
Contents<br />
Summary<br />
North American Free<br />
Trade Area<br />
Contacts and Links<br />
Special Article:<br />
FY 2013 Sugar<br />
Outlook – A Method<br />
for Analyzing<br />
Excess Supply<br />
Websites<br />
WASDE<br />
Sugar Topic Room<br />
--------------<br />
The next release is<br />
April 16, 2013<br />
--------------<br />
Approved by the World<br />
Agricultural Outlook<br />
Board.<br />
Sugar and Sweeteners Outlook<br />
Stephen Haley<br />
shaley@ers.usda.gov<br />
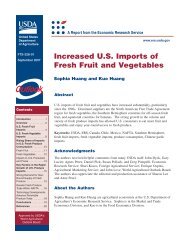
U.S. Sugar March 2013<br />
On March 8, 2013, the U.S. <strong>Department</strong> <strong>of</strong> Agriculture (<strong>US</strong>DA) published in the World<br />
Agricultural Supply and Demand Estimates (WASDE) its latest sugar supply and use<br />
estimates/projections for Mexico and the United States for fiscal years (FYs) 2012 and<br />
2013. Also on March 8, but after the release <strong>of</strong> the March 2013 WASDE, the Comite<br />
Nacional Para El Desarrollo Sustentable de la Caña de Azucar (Conadesuca) updated its<br />
estimate <strong>of</strong> the 2012/13 Mexico supply and use balance.<br />
Conadesuca projects 2012/13 sugar production at 6.247 million metric tons (mt), an<br />
increase <strong>of</strong> 578,682 mt over its initial forecast. Details behind the forecast were not<br />
immediately available. The <strong>US</strong>DA had increased its forecast by 221,938 mt to 5.890 million<br />
mt. Conadesuca increased its forecast <strong>of</strong> deliveries for human consumption by 203,100 mt<br />
to 4.403 million mt. The <strong>US</strong>DA forecast, based on publicly available delivery data, is 4.200<br />
million mt. Conadesuca projects ending stocks at 1.189 million mt. The stocks-toconsumption<br />
ratio is 27.0 percent, about 5 percentage points above the optimum 22.0percent<br />
level. Conadesuca projects exports at 1.527 million mt, while the <strong>US</strong>DA projects<br />
exports at 1.370 million mt – lower than Conadesuca by 157,000 mt.<br />
The <strong>US</strong>DA decreased its projection <strong>of</strong> FY 2013 U.S. sugar production from last month by<br />
60,000 short tons, raw value (STRV) to 9.160 million STRV, due to lower expected<br />
production in Florida. Based on reliable information conveyed to <strong>US</strong>DA’s Foreign<br />
Agricultural <strong>Service</strong> (FAS), the <strong>US</strong>DA increased its projection <strong>of</strong> the sugar tariff-rate quota<br />
(TRQ) shortfall by 50,000 STRV to 400,000 STRV. The <strong>US</strong>DA increased its forecast <strong>of</strong><br />
sugar from Mexico to 1.589 million STRV, an increase <strong>of</strong> about 200,000 STRV. Total sugar<br />
imports are projected at 2.978 million STRV. The <strong>US</strong>DA made no WASDE changes for<br />
sugar use. Ending sugar stocks are projected at 2.358 million STRV. The implied ending<br />
stocks-to-use ratio is 20.0 percent.
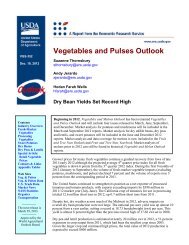
Sugar and Sweeteners in the North American Free Trade Area<br />
On March 8, 2013, the U.S. <strong>Department</strong> <strong>of</strong> Agriculture (<strong>US</strong>DA) published in the World Agricultural Supply and<br />
Demand Estimates (WASDE) its latest sugar supply and use estimates/projections for Mexico and the United States<br />
for fiscal years (FYs) 2012 and 2013. Also on March 8, but after the release <strong>of</strong> the March 2013 WASDE, the Comite<br />
Nacional Para El Desarrollo Sustentable de la Caña de Azucar (Conadesuca) updated its estimate <strong>of</strong> the 2012/13<br />
Mexico supply and use balance.<br />
Sugar and Sweeteners in Mexico<br />
Conadesuca projects 2012/13 sugar production at 6.247 million metric tons (mt), an increase <strong>of</strong> 578,682 mt over its<br />
initial forecast. Details behind the forecast were not immediately available. The <strong>US</strong>DA had increased its forecast by<br />
221,938 mt to 5.890 million mt. The <strong>US</strong>DA had based its forecast on the original parameter estimates maintained by<br />
Conadesuca but had incorporated upward variation in those parameter estimates based on its analysis <strong>of</strong> harvest data<br />
through March 2. The upper limit <strong>of</strong> the <strong>US</strong>DA analysis had indicated production possibly as high as 6.342<br />
million mt.<br />
Conadesuca increased its forecast <strong>of</strong> deliveries for human consumption by 203,100 mt to 4.403 million mt. As with<br />
production, no details were available. The latest monthly delivery data are available only through December 2012,<br />
the same as data that were publicly available last month. Conadesuca projects high fructose corn syrup (HFCS)<br />
consumption at 1.541 million mt, dry weight. This forecast is 94,000 mt lower than the <strong>US</strong>DA forecast.<br />
Conadesuca projects ending stocks at 1.189 million mt. The stocks-to-consumption ratio is 27.0 percent, about 5<br />
percentage points above the optimum 22.0 percent level. The <strong>US</strong>DA had increased its stocks-to-consumption ratio to<br />
25.0 percent. Conadesuca projects exports at 1.527 million mt, while the <strong>US</strong>DA projects exports at 1.370 million mt<br />
– lower than Conadesuca by 157,000 mt.<br />
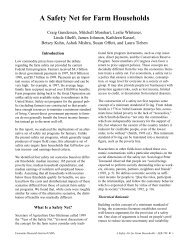
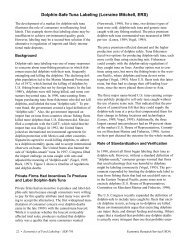
The sugarcane harvest in Mexico continued its strong performance through the first week <strong>of</strong> March. Through March<br />
2, 2013, a total <strong>of</strong> 365,073 hectares had been harvested, producing 31.620 million mt <strong>of</strong> sugarcane and 3.481 million<br />
mt <strong>of</strong> sugar. Sugar production is about 23 percent higher than the average for the same period for the previous 5<br />
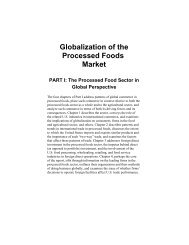
years. Figure 1 shows weekly sugar production levels compared with corresponding period estimates for 2010/11<br />
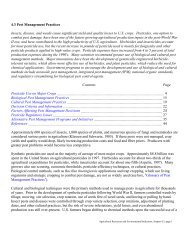
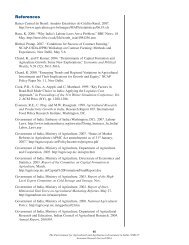
and 2011/12. Figure 2 shows interim sugar yields and highlights the high realized levels for 2012/13. Figure 3<br />
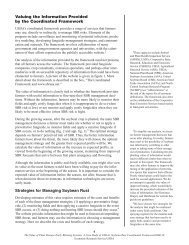
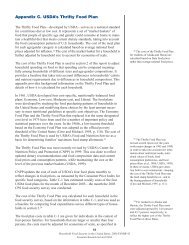
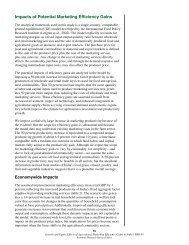
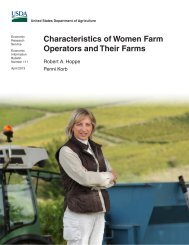
shows cumulative sucrose recovery rates for 2012/13 and the two previous harvest seasons. Figure 4 shows regional<br />
sugar production through March 2. Production in the Northeast is 37.8 percent higher than its 5-year average, 27.7<br />
percent higher in the South, and 25.7 percent higher in the Gulf region (the largest producing area in Mexico). The<br />
Pacific region (western area) is only 10.8 percent higher than the 5-year average.<br />
2<br />
Sugar and Sweeteners Outlook/SSS-M-295/March 14, 2013<br />
<strong>Economic</strong> <strong>Research</strong> <strong>Service</strong>, <strong>US</strong>DA
Table 1 -- Mexico: 2012/13 sugar production and supply, and sugar and High Fructose Corn Syrup (HFCS) utilization<br />
2012/13 Market year (Oct/Sept) 1/ March 2013 WASDE March 2013 Conadesuca<br />
1,000 metric tons, actual weight<br />
Beginning stocks 958 966<br />
Production 5,890 6,247<br />
Imports 112 14<br />
Imports for consumption 23 14<br />
Imports for sugar-containing product exports (IMMEX) 2/ 90 NA<br />
Total supply 6,960 7,227<br />
Disappearance<br />
Human consumption 4,200 4,403<br />
For sugar-containing product exports (IMMEX) 340<br />
Domestic production for IMMEX 3/ 108<br />
Total 4,540 4,511<br />
Exports 1,370 1,527<br />
Exports to the United States & Puerto Rico 1,360 NA<br />
Exports to other countries 10 NA<br />
Total use 5,910 6,038<br />
Ending stocks 1,050 1,189<br />
1,000 metric tons, raw value<br />
Beginning stocks 1,015 1,024<br />
Production 6,243 6,622<br />
Imports 210 15<br />
Imports for consumption 24 15<br />
Imports for sugar-containing product exports (IMMEX) 95 NA<br />
Total supply 7,469 7,660<br />
Disappearance<br />
Human consumption 4,452 4,667<br />
For sugar-containing product exports (IMMEX) 360<br />
Domestic production for IMMEX 114<br />
Total 4,812 4,782<br />
Exports 1,452 1,619<br />
Exports to the United States & Puerto Rico 1,442 NA<br />
Exports to other countries 11 NA<br />
Total use 6,265 6,400<br />
Ending stocks 1,113 1,260<br />
Stocks-to-Human Consumption (percent) 25.0 27.0<br />
Stocks-to-Use (percent) 17.8 19.7<br />
High Fructose Corn Syrup (HFCS) Consumption (dry weight) 1,635 1,541<br />
Source: <strong>US</strong>DA, WASDE and ERS, Sugar and Sweeteners Outlook ; Conadesuca.<br />
1/ Forecast.<br />
2/ IMMEX = Industria Manufacturera, Maquiladora y de Servicios de Exportación; Conadesuca does not<br />
incorporate IMMEX sugar supply-use balance in its national sugar supply-use balance.<br />
3/ Conadesuca classifies IMMEX deliveries from domestic production as an export. In the table, the Sugar and Sweeteners<br />
Outlook classifies these under disappearance, following the <strong>US</strong>DA practice.<br />
3<br />
Sugar and Sweeteners Outlook/SSS-M-295/March 14, 2013<br />
<strong>Economic</strong> <strong>Research</strong> <strong>Service</strong>, <strong>US</strong>DA
Figure 1<br />
Sugar production, by week <strong>of</strong> harvest, 2010/11-2012/13<br />
Metric tons<br />
300,000<br />
250,000<br />
200,000<br />
150,000<br />
100,000<br />
50,000<br />
0<br />
Source: Conadesuca.<br />
2010/11 = 5,183,500 mt<br />
2011/12 = 5,048,469 mt<br />
2012/13 = 5,890,715 mt (forecast)<br />
7 8 9 10 11 12 13 14 15 16 17 18 19 20 21 22 23 24 25 26 27 28 29 30 31 32 33 34 35 36 37 38 39 40<br />
Harvest week<br />
4<br />
Sugar and Sweeteners Outlook/SSS-M-295/March 14, 2013<br />
<strong>Economic</strong> <strong>Research</strong> <strong>Service</strong>, <strong>US</strong>DA
Figure 2-- Cumulative sugarcane yield in metric tons (mt) per hectare (ha) during harvest season<br />
Sugar mt per hectare<br />
100.000<br />
95.000<br />
90.000<br />
85.000<br />
80.000<br />
75.000<br />
70.000<br />
65.000<br />
60.000<br />
55.000<br />
50.000<br />
Source: Conadesuca.<br />
2010/11 = 65.53 mt/ha 2011/12 = 65.69 mt/ha 2012/13<br />
12 13 14 15 16 17 18 19 20 21 22 23 24 25 26 27 28 29 30 31 32 33 34 35 36 37 39<br />
Campaign week<br />
5<br />
Sugar and Sweeteners Outlook/SSS-M-295/March 14, 2013<br />
<strong>Economic</strong> <strong>Research</strong> <strong>Service</strong>, <strong>US</strong>DA
Figure 3<br />
Intra-seasonal, cumulative sugar recovery rates in Mexico, recent crop years<br />
Percentage<br />
13.00<br />
12.00<br />
11.00<br />
10.00<br />
9.00<br />
8.00<br />
7.00<br />
6.00<br />
5.00<br />
4.00<br />
7 8 9 10 11 12 13 14 15 16 17 18 19 20 21 22 23 24 25 26 27 28 29 30 31 32 33 34 35 36 37<br />
Source: Conadesuca.<br />
2010/11= 11.75 percent 2011/12 = 10.92 percent 2012/13 = 11.37 percent (forecast)<br />
Harvest week<br />
6<br />
Sugar and Sweeteners Outlook/SSS-M-295/March 14, 2013<br />
<strong>Economic</strong> <strong>Research</strong> <strong>Service</strong>, <strong>US</strong>DA
Figure 4<br />
Mexico sugar production through March 2, 2013, by region, compared with previous 5-years<br />
Metric tons<br />
1,400,000<br />
1,200,000<br />
1,000,000<br />
800,000<br />
600,000<br />
400,000<br />
200,000<br />
0<br />
Source: Conadesuca.<br />
Sugar 2012/13 Sugar Previous 5-yr average<br />
Central Gulf Northeast Northwest Pacific South<br />
7<br />
Sugar and Sweeteners Outlook/SSS-M-295/March 14, 2013<br />
<strong>Economic</strong> <strong>Research</strong> <strong>Service</strong>, <strong>US</strong>DA
U.S. Sugar<br />
The <strong>US</strong>DA decreased its projection <strong>of</strong> FY 2013 sugar production from last month by 60,000 short tons, raw value<br />
(STRV) to 9.160 million STRV (table 2). Cane sugar processors in Florida decreased their forecast <strong>of</strong> sugar<br />
production to 1.830 million STRV. The National Agricultural Statistics <strong>Service</strong> (NASS) reduced its estimate <strong>of</strong><br />
Florida sugarcane for sugar area harvested by 3,600 acres to 390,000 acres and sugarcane yield 0.9 tons per acre to<br />
36.9 tons per acre.<br />
Based on reliable information conveyed to <strong>US</strong>DA’s Foreign Agricultural <strong>Service</strong> (FAS), the <strong>US</strong>DA increased its<br />
projection <strong>of</strong> the sugar tariff-rate quota (TRQ) shortfall by 50,000 STRV to 400,000 STRV. This expected increase<br />
in shortfall is not surprising given the narrow gap <strong>of</strong> less than 3 cents per pound between the U.S. raw sugar price<br />
(Intercontinental Exchange (ICE) nearby No. 16 contract) and the world raw sugar price (ICE nearby No. 11<br />
contract). Total TRQ sugar imports are now projected at 1.154 million STRV. The <strong>US</strong>DA increased its forecast <strong>of</strong><br />
sugar from Mexico to 1.589 million STRV, an increase <strong>of</strong> about 200,000 STRV. Total sugar imports are projected at<br />
2.978 million STRV.<br />
FAS estimates sugar imports from Mexico during the first 5 months <strong>of</strong> the fiscal year at 510,308 STRV. These<br />
entries constitute 32.1 percent <strong>of</strong> expected total-year imports from Mexico.<br />
The <strong>US</strong>DA made no WASDE changes for sugar use. Ending sugar stocks are projected as the difference between<br />
total supply (14.123 million STRV) and total use (11,765 million STRV) at 2.358 million STRV. The implied<br />
ending stocks-to-use ratio is 20.0 percent, the highest projected level since FY 2000 (21.9 percent) and FY 2001<br />
(21.0 percent). Both <strong>of</strong> these earlier years had significant amounts <strong>of</strong> sugar inventory owned by <strong>US</strong>DA due to sugar<br />
loan forfeitures by processors.<br />
8<br />
Sugar and Sweeteners Outlook/SSS-M-295/March 14, 2013<br />
<strong>Economic</strong> <strong>Research</strong> <strong>Service</strong>, <strong>US</strong>DA
Table 2 -- U.S. sugar: supply and use, by fiscal year (Oct./Sept.)<br />
Items 2010/11 2011/12 2012/13 2010/11 2011/12 2012/13<br />
1,000 short tons, raw value 1,000 metric tons, raw value<br />
Beginning stocks 1,498 1,378 1,985 1,359 1,250 1,800<br />
Total production 7,831 8,488 9,160 7,104 7,700 8,310<br />
Beet sugar 4,659 4,900 5,300 4,227 4,446 4,808<br />
Cane sugar 3,172 3,588 3,860 2,877 3,255 3,502<br />
Florida 1,433 1,828 1,830 1,300 1,658 1,660<br />
Louisiana 1,411 1,438 1,700 1,280 1,305 1,542<br />
Texas 146 150 150 132 136 136<br />
Hawaii 182 172 180 165 156 163<br />
Puerto Rico<br />
Total imports 3,738 3,632 2,978 3,391 3,295 2,702<br />
Tariff-rate quota imports 1,721 1,883 1,154 1,561 1,709 1,047<br />
Other program Imports 291 664 225 264 602 204<br />
Non-program imports 1,726 1,085 1,599 1,566 984 1,451<br />
Mexico 1,708 1,071 1,589 1,549 972 1,442<br />
Total supply 13,067 13,498 14,123 11,854 12,245 12,812<br />
Total exports 248 269 175 225 244 159<br />
Miscellaneous 19 -69 0 17 -63 0<br />
Deliveries for domestic use 11,422 11,313 11,590 10,362 10,263 10,514<br />
Transfer to sugar-containing products<br />
for export under reexport program 196 140 180 178 127 163<br />
Transfer to polyhydric alcohol, feed 33 33 30 30 30 27<br />
Deliveries for domestic food and beverage use 11,193 11,141 11,380 10,154 10,107 10,324<br />
Total use 11,689 11,513 11,765 10,604 10,445 10,673<br />
Ending stocks 1,378 1,985 2,358 1,250 1,800 2,139<br />
Stocks-to-use ratio 11.79 17.238 20.04 11.79 17.238 20.04<br />
NOTE: Numbers may not add due to rounding.<br />
Source: <strong>US</strong>DA, WASDE, and ERS, Sugar and Sweeteners Outlook.<br />
9<br />
Sugar and Sweeteners Outlook/SSS-M-295/March 14, 2013<br />
<strong>Economic</strong> <strong>Research</strong> <strong>Service</strong>, <strong>US</strong>DA
Contacts and Links<br />
Contact Information<br />
Stephen Haley, (202) 694-5247, shaley@ers.usda.gov (coordinator)<br />
Erma J. McCray, (202) 694-5306, ejmccray@ers.usda.gov (web publishing)<br />
Subscription Information<br />
Subscribe to ERS’ e-mail notification service at http://www.ers.usda.gov/updates/ to receive timely notification <strong>of</strong><br />
newsletter availability. Printed copies can be purchased from the <strong>US</strong>DA Order Desk by calling 1-800-363-2068 (specify<br />
the issue number).<br />
Data<br />
Tables from the Sugar and Sweeteners Yearbook are available in the Sugar and Sweeteners Topics at<br />
http://www.ers.usda.gov/topics/sugar/. They contain the latest data and historical information on the production,<br />
use, prices, imports, and exports <strong>of</strong> sugar and sweeteners.<br />
Related Websites<br />
Sugar and Sweeteners Outlook http://www.ers.usda.gov/Publications/SSS/<br />
WASDE http://usda.mannlib.cornell.edu/MannUsda/viewDocumentInfo.do?documented=1194<br />
Sugar Topics http://www.ers.usda.gov/topics/Sugar/<br />
E-mail Notification<br />
Readers <strong>of</strong> ERS outlook <strong>report</strong>s have two ways they can receive an e-mail notice about release <strong>of</strong> <strong>report</strong>s and<br />
associated data.<br />
• Receive timely notification (soon after the <strong>report</strong> is posted on the web) via <strong>US</strong>DA’s <strong>Economic</strong>s, Statistics and<br />
Market Information System (which is housed at Cornell University’s Mann Library). Go to<br />
http://usda.mannlib.cornell.edu/MannUsda/aboutEmail<strong>Service</strong>.do and follow the instructions to receive e-mail<br />
notices about ERS, Agricultural Marketing <strong>Service</strong>, National Agricultural Statistics <strong>Service</strong>, and World Agricultural<br />
Outlook Board products.<br />
• Receive weekly notification (on Friday afternoon) via the ERS website. Go to http://www.ers.usda.gov/Updates/<br />
and follow the instructions to receive notices about ERS outlook <strong>report</strong>s, Amber Waves magazine, and other <strong>report</strong>s<br />
and data products on specific topics. ERS also <strong>of</strong>fers RSS (really simple syndication) feeds for all ERS products. Go<br />
to http://www.ers.usda.gov/rss/ to get started.<br />
The U.S. <strong>Department</strong> <strong>of</strong> Agriculture (<strong>US</strong>DA) prohibits discrimination in all its programs and activities on the ba sis <strong>of</strong> race, col or, national<br />
origin, age, disabilit y, and, wh ere applicable, sex, marital status, familial status, parental status, religion, sexual orienta tion, genetic<br />
information, political beliefs, reprisal, or because all or a part <strong>of</strong> an individual’s income is derived from any public assistance program. (Not all<br />
prohibited bases apply to all programs.) Persons with disabilities who require alternative means for communication <strong>of</strong> program information<br />
(Braille, large print, audiotape, et c.) should contact <strong>US</strong>DA’s TARGET Center at (202) 720-2600 (voice and TDD). To file a co mplaint <strong>of</strong><br />
discrimination write to <strong>US</strong>DA, Director, Office <strong>of</strong> Civil Rights, 1400 Independence Avenue, S.W., Washington, D.C. 20250-9410 or call (800)<br />
795-3272 (voice) or (202) 720-6382 (TDD). <strong>US</strong>DA is an equal opportunity provider and employer.<br />
10<br />
Sugar and Sweeteners Outlook/SSS-M-295/March 14, 2013<br />
<strong>Economic</strong> <strong>Research</strong> <strong>Service</strong>
<strong>Economic</strong><br />
<strong>Research</strong><br />
<strong>Service</strong><br />
Situation and<br />
Outlook<br />
SSS-M-295SA<br />
March 14, 2013<br />
Approved by the<br />
World Agricultural<br />
Outlook Board.<br />
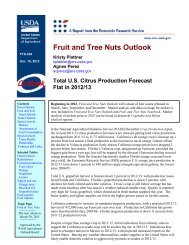
Sugar and Sweeteners Outlook: Special Article<br />
FY 2013 Sugar Outlook—A Method for<br />
Analyzing Excess Supply<br />
Stephen Haley<br />
shaley@ers.usda.gov<br />
This chapter describes a stochastic modeling approach for quantitatively analyzing possible<br />
outcomes resulting from a higher than average U.S. sugar supply this fiscal year. The first<br />
two sections give policy and outlook background. The modeling approach is then described<br />
through a scenario that captures some <strong>of</strong> the characteristics <strong>of</strong> the current sugar situation.<br />
Although the scenario is hypothetical, it shows how more detailed analysis could be used to<br />
analyze policy outcomes for agricultural economists, both within and outside the U.S.<br />
<strong>Department</strong> <strong>of</strong> Agriculture (<strong>US</strong>DA).<br />
Background: Sugar in the 2008 Farm Act<br />
The 2008 Farm Act provides for the <strong>US</strong>DA to make loans available to processors <strong>of</strong><br />
domestically grown sugarcane and domestic processors <strong>of</strong> sugarbeets at set loan-rate levels<br />
for fiscal years (FY) 2009-13. Loans are taken for a maximum term <strong>of</strong> 9 months and must<br />
be liquidated, along with interest charges and other expenses, by the end <strong>of</strong> the fiscal year in<br />
which the loan was made. The loans are nonrecourse. When a loan matures, the <strong>US</strong>DA’s<br />
Commodity Credit Corporation (CCC) must accept sugar pledged as collateral as payment<br />
in full in lieu <strong>of</strong> cash repayment <strong>of</strong> the loan, at the discretion <strong>of</strong> the processor. The processor<br />
is not required to notify the <strong>US</strong>DA <strong>of</strong> the intention to forfeit the sugar under loan.<br />
The loan rates for raw cane and beet sugar are set in the 2008 Farm Act. The FY 2013 loan<br />
rate for raw cane sugar is 18.75 cents per pound (lb), and the loan rate for refined beet sugar<br />
is 128.5 percent <strong>of</strong> the loan rate for raw cane sugar, or 24.09 cents per lb. Table A-1 shows<br />
loan rates for both raw cane and refined beet sugar for the regions where these products are<br />
processed, along with loan costs that must be repaid. If market sale prices are below these<br />
amounts at the time <strong>of</strong> loan repayment, then processors have the incentive to forfeiture the<br />
sugar pledged as collateral in repayment <strong>of</strong> the loan.<br />
The 2008 Farm Act established the Feedstock Flexibility Program. This program operates to<br />
avoid sugar loan forfeitures by requiring the diversion <strong>of</strong> sugar from food use to ethanol<br />
production. On September 1 (1 month before the end <strong>of</strong> the marketing year), the Secretary<br />
<strong>of</strong> Agriculture announces the amount <strong>of</strong> sugar (if any) for the CCC to purchase and to be
Table A-1 -- Calculation <strong>of</strong> minimum sugar prices to avoid forfeiture for fiscal year 2013<br />
Calculation <strong>of</strong> minimum raw sugar price to discourage forfeiture<br />
If the borrower redeems the loan, would have to pay the following costs:<br />
Item Florida Hawaii Louisiana<br />
Cents per pound<br />
Texas<br />
Regional loan rates 18.13 17.57 19.46 18.88<br />
Transportation costs 2.66 2.95 1.06 1.47<br />
Location discounts 0.00 0.27 0.25 0.43<br />
Interest expense 0.15 0.15 0.16 0.16<br />
Minimum price to avoid forfeiture 20.94 20.94 20.94 20.94<br />
Calculation <strong>of</strong> minimum beet sugar price to discourage forfeiture<br />
If the borrower redeems the loan, would have to pay the following costs:<br />
State<br />
Item Michigan Minnesota and Colorado, Nebraska, W. North Dakota, Oregon & Idaho California<br />
E. North Dakota & SE Wyoming Montana, & NW<br />
Wyoming<br />
Cents per pound<br />
Regional loan rates 25.57 23.93 24.44 24.01 23.30 24.84<br />
Cost <strong>of</strong> loan redemption and marketing:<br />
Interest expense 0.22 0.20 0.21 0.20 0.20 0.55<br />
Cash Discount (2%) 0.53 0.49 0.50 0.49 0.48 0.52<br />
Minimum price to avoid forfeiture 26.32 24.62 25.15 24.70 23.98 25.91<br />
Source: <strong>US</strong>DA, Farm <strong>Service</strong> Agency, Dairy and Sweeteners Analysis Branch.<br />
Region<br />
2<br />
Sugar and Sweeteners Outlook Special Article/SSS-M-295/March 14, 2013<br />
<strong>Economic</strong> <strong>Research</strong> <strong>Service</strong>, <strong>US</strong>DA
e made available for sale to ethanol producers. Raw, refined, and in-process sugars are eligible for purchase. Such<br />
sugar can be purchased from any marketer located in the United States. Sugar purchased from a sugarcane or<br />
sugarbeet processor is counted against that processor's marketing allotment.<br />
The 2008 Farm Act established the Feedstock Flexibility Program. This program operates to avoid sugar loan<br />
forfeitures by requiring the diversion <strong>of</strong> sugar from food use to ethanol production. On September 1 (1 month before<br />
the end <strong>of</strong> the marketing year), the Secretary <strong>of</strong> Agriculture announces the amount <strong>of</strong> sugar (if any) for the CCC to<br />
purchase and to be made available for sale to ethanol producers. Raw, refined, and in-process sugars are eligible for<br />
purchase. Such sugar can be purchased from any marketer located in the United States. Sugar purchased from a<br />
sugarcane or sugarbeet processor is counted against that processor's marketing allotment.<br />
Background: FY 2013 Sugar Outlook<br />
Table A-2 shows estimates from <strong>US</strong>DA’s World Agricultural Supply and Demand Estimates (WASDE) <strong>of</strong> the U.S.<br />
sugar supply and use balance since FY 2008. FY 2013 stands out because <strong>of</strong> the high estimate <strong>of</strong> sugar supplies.<br />
This results from high beginning stocks, record beet sugar production, strong cane sugar production in Louisiana,<br />
and strong imports expected from Mexico. The ending-year sugar stocks-to-use ratio for FY 2013 is 19.3 percent,<br />
well above the corresponding ratios for the earlier years. Although there is no fixed rule, a stocks-to-use ratio above<br />
18 percent generally merits attention to the possibility <strong>of</strong> sugar-loan forfeitures to the CCC in loan repayment.<br />
3<br />
Sugar and Sweeteners Outlook Special Article/SSS-M-295/March 14, 2013<br />
<strong>Economic</strong> <strong>Research</strong> <strong>Service</strong>, <strong>US</strong>DA
Table A-2 -- U.S. sugar: supply and use, by fiscal year<br />
Items 2007/08 2008/09 2009/10 2010/11 2011/12 2012/13<br />
Beginning stocks 1,799 1,664 1,534 1,498 1,378 1,985<br />
Total production 8,152 7,531 7,963 7,831 8,488 9,220<br />
Beet sugar 4,721 4,214 4,575 4,659 4,900 5,300<br />
Cane sugar 3,431 3,317 3,387 3,172 3,588 3,920<br />
Florida 1,645 1,577 1,646 1,433 1,828 1,890<br />
Louisiana 1,446 1,397 1,469 1,411 1,438 1,700<br />
Texas 158 152 112 146 150 150<br />
Hawaii 182 192 161 182 172 180<br />
Puerto Rico 0 0 0<br />
Total imports 2,620 3,082 3,320 3,738 3,632 2,827<br />
Tariff-rate quota imports 1,354 1,370 1,854 1,721 1,883 1,204<br />
Other program Imports 565 308 448 291 664 225<br />
Non-program imports 701 1,404 1,017 1,726 1,085 1,398<br />
Mexico 694 1,402 807 1,708 1,071 1,388<br />
Total supply 12,571 12,277 12,817 13,067 13,498 14,032<br />
Total exports 203 136 211 248 269 175<br />
Quota-exempt for reexport 203 136 211 248 269 175<br />
Other exports<br />
CCC disposal, for export<br />
Miscellaneous 0 0 -45 19 -69 0<br />
CCC disposal, for domestic non food use 0 0 0 0 0 0<br />
Refining loss adjustment 0 0 0 0 0 0<br />
Statistical adjustment 0 0 -45 19 -69 0<br />
Deliveries for domestic use 10,704 10,607 11,152 11,422 11,313 11,590<br />
Transfer to sugar-containing products<br />
for exports under reexport program 141 120 201 196 140 180<br />
Transfer to polyhydric alcohol, feed 61 46 35 33 33 30<br />
Deliveries for domestic food and beverage use 1/ 10,501 10,441 10,917 11,193 11,141 11,380<br />
Total use 10,907 10,743 11,319 11,689 11,513 11,765<br />
Ending stocks 1,664 1,534 1,498 1,378 1,985 2,267<br />
Stocks-to-use ratio 15.26 14.28 13.24 11.79 17.24 19.27<br />
1/For FY 2008-09, combines Sweetener Market Data (SMD) deliveries for domestic human use, SMD miscellaneous uses,<br />
and the difference between SMD imports and WASDE imports.<br />
Source: <strong>US</strong>DA, WAOB, WASDE; ERS, Sugar and Sweetener Outlook .<br />
4<br />
Sugar and Sweeteners Outlook Special Article/SSS-M-295/March 14, 2013<br />
<strong>Economic</strong> <strong>Research</strong> <strong>Service</strong>, <strong>US</strong>DA
Compounding the outlook are world sugar prices estimated at 18.3 cents per lb in February 2013, down about 30<br />
percent from a year earlier. Prior to FY 2013, world prices were above minimum forfeiture prices, which made the<br />
possibility <strong>of</strong> forfeiture seem remote. The outlook for the remainder <strong>of</strong> the fiscal year is for steady to lower world<br />
prices, probably averaging less than 18 cents per lb.<br />
Figure A-1 shows weekly FY 2013 U.S. raw sugar and refined beet sugar prices through the end <strong>of</strong> February, along<br />
with the corresponding minimum prices to avoid forfeiture. The raw sugar price is below the minimum at the end <strong>of</strong><br />
the month, while the refined beet sugar price is approaching it.<br />
Outline <strong>of</strong> the Modeling Procedure<br />
The procedure starts with a review <strong>of</strong> the supply-use situation in Mexico to derive a framework for projecting sugar<br />
exports into the U.S. sugar market. The U.S. sugar supply-use balance incorporates these inflows into its own<br />
described supply-use framework. In both countries, a range <strong>of</strong> values is specified around current projections from<br />
the February WASDE. For a basic set <strong>of</strong> variables, there are hypothesized upper and lower bounds. The WASDE<br />
projections are interpreted as the most likely estimates for the end <strong>of</strong> the fiscal year, but these estimates could vary<br />
between the bounds.<br />
An important element <strong>of</strong> the approach is an estimated inverse relationship between ending stocks-to-use and the raw<br />
sugar price. A minimum price-to-avoid forfeiture implies a maximum privately owned stocks-to-use ratio. A<br />
positive difference between a total stocks ratio and a privately held ratio implies a fraction <strong>of</strong> total stocks potentially<br />
forfeitable to the CCC.<br />
In the framework, sugar that is otherwise projected to be forfeited is assumed to be purchased by the CCC at the<br />
minimum raw sugar price-to-avoid-forfeiture. The framework currently does not distinguish between raw cane and<br />
refined beet sugar, although this distinction is likely to be important. As per the 2008 Farm Act, the CCC sells its<br />
sugar to ethanol producers at a price these producers are willing to pay. The difference between the CCC acquisition<br />
price and the sale price is a unit outlay. The framework uses an estimate <strong>of</strong> the unit outlay to calculate a range <strong>of</strong><br />
CCC expenditure amounts to comply with the disposition <strong>of</strong> the excess sugar supply.<br />
Analytical Framework – Imminent Forfeitures<br />
Table A-3 shows framework equations for Mexico and the United States. Variables that are coded red are those<br />
whose values can range between lower and upper bounds, with the WASDE values being most likely. Probabilities<br />
that certain values will be realized are obtained from what is called a triangular probability density function,<br />
illustrated below. (Triangular probability distributions are used <strong>of</strong>ten in business decision making, particularly in<br />
simulations, where there is limited sample data.)<br />
Value ranges for the Mexican variables are shown in table A-4. For production, the most likely production estimate<br />
is 5.668 million metric tons (mt). Many observers outside <strong>US</strong>DA expect a higher final production level, and few<br />
expect a lower value. In the framework, a lower bound 100,000 mt less than the WASDE projection is specified. The<br />
upper bound is specified at 5.968 million mt – 300,000 mt higher. Although the most likely outcome (the mode) is<br />
the WASDE value, the mean <strong>of</strong> the distribution is the average <strong>of</strong> mode, the upper bound, and the lower bound; i.e,.<br />
5.735 million mt. (In the case where upper and lower bounds are equidistant from the most likely value, the mean<br />
and the mode are the same.)<br />
The corresponding triangular probability distribution <strong>of</strong> Mexican sugar production is illustrated in figure A-2.<br />
Simulated values fall along the edge <strong>of</strong> the distribution. The area <strong>of</strong> the triangle is used to measure the probability <strong>of</strong><br />
the outcome for a particular value. (Note that total area is equal to one.) In the figure, 5 percent <strong>of</strong> the triangle area is<br />
to the left <strong>of</strong> 5.613 million mt – meaning that there is a 5-percent chance that production will be no greater than<br />
5.613 million mt. On the other side <strong>of</strong> the figure, a vertical line at 5.891 million mt cuts 95 percent <strong>of</strong> the triangle’s<br />
5<br />
Sugar and Sweeteners Outlook Special Article/SSS-M-295/March 14, 2013<br />
<strong>Economic</strong> <strong>Research</strong> <strong>Service</strong>, <strong>US</strong>DA
Figure A-1<br />
U.S. sugar prices, Oct. 2012-Feb. 2013, and minimum prices-to-avoid forfeiture<br />
Cents per lb<br />
40.00<br />
35.00<br />
30.00<br />
25.00<br />
20.00<br />
15.00<br />
10.00<br />
5.00<br />
0.00<br />
Raw sugar price<br />
Minimum raw sugar price-to-avoid forfeiture<br />
Refined beet sugar price - midwest<br />
Minimum refined beet sugar price-to-avoid forfeiture<br />
Source: Intercontinental No. 16, nearby futures average, Milling and Baking News, and <strong>US</strong>DA, FSA, Dairy and Sweeteners Analysis Branch.<br />
6<br />
Sugar and Sweeteners Outlook Special Article/SSS-M-295/March 14, 2013<br />
<strong>Economic</strong> <strong>Research</strong> <strong>Service</strong>, <strong>US</strong>DA
Table A-3 -- Scenario analysis framework<br />
Stochastic variables coded red:<br />
Mexico<br />
Supply = Beginning stocks + Production + Imports<br />
Total deliveries = Deliveries for human consumption + Deliveries for sugar-containing exports<br />
Ending stocks = [Stocks-to-human consumption deliveries ratio]*Deliveries for human consumption<br />
Total exports = Supply - [Total deliveries + Ending stocks]<br />
Exports to United States = Total exports - 10,000 metric tons<br />
United States<br />
Total production = Beet sugar production + Cane sugar production [Florida+Louisiana+Texas+Hawaii]<br />
Imports from Mexico (short tons, raw value) = Mexico exports to the United States *conversion factor<br />
Non-program imports = Imports from Mexico + High-tier tariff imports<br />
Total imports = Tariff-rate quota imports + Other program imports + Non-program imports<br />
Supply = Beginning stocks + Production + Total imports<br />
Total deliveries = Deliveries for human consumption + Deliveries for product re-export + Miscellaneous deliveries<br />
Total use = Exports + Total deliveries<br />
Ending stocks = Supply - Total use<br />
Ending stocks-to-use ratio = 100*Ending stocks/Total use<br />
Maximum private stocks-to-use ratio = [Minimum price to avoid forfeiture -29.194]/(-0.456)<br />
Private stocks-to-use ratio = [IF raw sugar price ≥ minimum price to avoid forfeiture, then Ending stocks-to-use ratio, else maximum private stocks-to-use ratio]<br />
CCC-owned stocks = [Ending stocks-to-use ratio -- Private stocks-to-use ratio] *Ending stocks<br />
CCC-outlay for sale to ethanol producers = CCC-owned stocks*Unit outlay<br />
Source: ERS, Sugar and Sweetener Outlook .<br />
7<br />
Sugar and Sweeteners Outlook Special Article/SSS-M-295/March 14, 2013<br />
<strong>Economic</strong> <strong>Research</strong> <strong>Service</strong>, <strong>US</strong>DA
Table A-4 -- Mexico: 2012/13 sugar production and supply- base and stochastic properties for analysis<br />
Supply/Use components Base Low-range adjustment High-range adjustment Statistical mean<br />
Stochastic components coded red<br />
1,000 metric tons, raw value<br />
Beginning stocks 958 958 958 958<br />
Production 5,668 5,568 5,968 5,735<br />
Imports 112 112 112 112<br />
Imports for consumption 23 23 23 23<br />
Imports for sugar-containing product exports (IMMEX) 1/ 90 90 90 90<br />
Total supply 6,738 6,638 7,038 6,805<br />
Disappearance<br />
Human consumption 4,200 4,100 4,300 4,200<br />
For sugar-containing product exports (IMMEX) 340 320 360 340<br />
Miscellaneous<br />
Total 4,540 4,420 4,660 4,540<br />
Exports (residual) 1,198 903 1,798 1,301<br />
Exports to the United States & Puerto Rico 1,188 893 1,788 1,291<br />
Exports to other countries 10 10 10 10<br />
Total use 5,738 5,323 6,458 5,841<br />
Ending stocks 1,000 820 1075 963<br />
Stocks-to-consumption ratio (percent) 23.81 20.00 25.00 22.94<br />
1/ IMMEX = Industria Manufacturera, Maquiladora y de Servicios de Exportación.<br />
Source: ERS, Sugar and Sweeteners Outlook.<br />
8<br />
Sugar and Sweeteners Outlook Special Article/SSS-M-295/March 14, 2013<br />
<strong>Economic</strong> <strong>Research</strong> <strong>Service</strong>, <strong>US</strong>DA
Figure A‐2<br />
Triangle probability distribution: example <strong>of</strong> Mexico sugar production<br />
Scale factor<br />
0.006<br />
0.005<br />
0.004<br />
0.003<br />
0.002<br />
0.001<br />
0.000<br />
5,550<br />
5.0% 90.0% 5.0%<br />
5,612.8 5,890.6<br />
5,600<br />
5,650<br />
Source: ERS, Sugar and Sweetener Outlook.<br />
5,700<br />
5,750<br />
Upper bound = 5,968<br />
Most likely = 5,668<br />
Lower bound = 5,568<br />
Mean = 5,735<br />
Standard deviation = 85.0<br />
5,800<br />
1,000 metric tons<br />
9<br />
Sugar and Sweeteners Outlook Special Article/SSS-M-295/March 14, 2013<br />
<strong>Economic</strong> <strong>Research</strong> <strong>Service</strong>, <strong>US</strong>DA<br />
5,850<br />
Probability implications:<br />
below 5612.8 ‐ 5%<br />
between 5612.8‐5890.6 ‐ 90%<br />
above 5890.6 ‐ 5%<br />
5,900<br />
5,950<br />
6,000
area to its left – meaning that there is 95-percent probability that production will not be greater than 5.891 million<br />
mt. In between, there is a 90-percent probability that production will be between 5.613 million and 5.891 million mt.<br />
Mexican deliveries for human consumption are specified to vary 100,000 mt above and below 4.200 million mt. The<br />
range for the ending stocks-to-human consumption ratio is between 20.0 and 25.0 percent, with 23.8 percent the<br />
most likely. In the framework, exports are residually calculated as the difference between total supply and the sum<br />
<strong>of</strong> total deliveries and ending stocks. Exports to the United States are equal to total exports less 10,000 mt that<br />
Mexico is assumed to export to third countries.<br />
Table A-5 shows value ranges for the U.S. supply-use variables. Beet sugar production projections range between<br />
5.100 and 5.500 million short tons, raw value (STRV), with 5.300 million STRV the most likely to be realized. The<br />
other red-coded variables have similar interpretations. As with the Mexican ranges, the lower and upper bounds are<br />
specified by the ERS Sugar and Outlook as reasonable departures from WASDE projections. (In other words,<br />
deviations from WASDE values do not derive from any consensus within <strong>US</strong>DA. This underlines the limited,<br />
hypothetical nature <strong>of</strong> this modeling approach.)<br />
Ending stocks are the difference between total supply and total use. Table A-6 shows an estimated relationship<br />
between the third-quarter raw sugar price and the ending fiscal year stocks-to-use ratio. This equation can be used to<br />
map model values <strong>of</strong> the stocks-to-use ratio into a corresponding raw sugar price. The equation’s standard error is<br />
used to provide a value that fits the price into a normally distributed probability function.<br />
A raw sugar price above the minimum price-to-avoid forfeiture indicates that there are no implied forfeitures to the<br />
CCC or need for the CCC to purchase sugar for resale to ethanol producers. If the raw sugar price is at or below the<br />
minimum, then forfeitures are imminent.<br />
The equation from table A-6 is used to map the minimum price into a maximum stocks-to-use ratio for private sugar<br />
stock holdings. Table A-5 shows this value at 18.11 percent, with 1 standard deviation below at 17.89 percent and<br />
above at 18.33 percent. A positive difference between the total and private stocks-to-use is multiplied by total ending<br />
stocks to yield the amount <strong>of</strong> sugar that is highly probable to be forfeited.<br />
Analytical Framework – Resale to Ethanol Producers<br />
As mentioned, the CCC is assumed to purchase sugar that would otherwise be forfeited at the minimum price-toavoid<br />
forfeiture. This sugar is intended for resale to ethanol producers at a price that makes ethanol producers<br />
indifferent to using sugar relative to other feedstocks, primarily corn.<br />
Table A-7 shows a threefold method adopted from the FSA’s Dairy and Sweeteners Analysis Branch to derive a unit<br />
outlay amount. The first step is to calculate equivalent amounts <strong>of</strong> raw cane sugar and corn needed to produce the<br />
same amount <strong>of</strong> ethanol. One gallon <strong>of</strong> ethanol can be produced from 14.771 lb <strong>of</strong> raw sugar or 20.3636 pounds <strong>of</strong><br />
corn. The corn-to-sugar ratio is 1.3786.<br />
The second step uses raw sugar and corn price projections corresponding to the forfeiture period to compare<br />
feedstock purchase costs for the ethanol producer. A projected corn price <strong>of</strong> $5.40 per bushel from <strong>US</strong>DA long-term<br />
projections is adjusted by subtracting out Dried Distillers Grains (DDG) and corn oil byproduct credits and then<br />
converting to a dollar per pound basis that compares to the purchase cost <strong>of</strong> a pound <strong>of</strong> sugar to produce the same<br />
amount <strong>of</strong> ethanol. The sugar cost is 20.94 cents and the corn cost is 9.31 cents – the difference is 11.63 cents.<br />
The third step adds in a further amount that is needed to motivate ethanol producers to switch to sugar. This is<br />
compensation for additional costs likely to be incurred by using sugar in place <strong>of</strong> corn, estimated at 40 percent <strong>of</strong> the<br />
net corn costs, or 3.72 cents per lb. A possible <strong>of</strong>fset, used in this analysis, is the advantage <strong>of</strong> raw cane sugar in in<br />
qualifying as an advanced-fuel ethanol source relative to corn as a conventional source. As computed, this would<br />
provide a raw sugar cost advantage <strong>of</strong> 1.69 cents per pound. (It is important to note that beet sugar does not yet<br />
qualify for the advanced-fuel source designation but may qualify by September 2013.)<br />
10<br />
Sugar and Sweeteners Outlook Special Article/SSS-M-295/March 14, 2013<br />
<strong>Economic</strong> <strong>Research</strong> <strong>Service</strong>, <strong>US</strong>DA
Table A-5 -- U.S. 2012/13 sugar production and supply--base and stochastic properties for analysis<br />
Supply/Use components Base Low-range adjustment High-range adjustment Statistical mean<br />
Stochastic components coded red<br />
1,000 short tons, raw value<br />
Beginning stocks 1,985 1,985 1,985 1,985<br />
Total production 9,220 8,910 9,500 9,210<br />
Beet sugar 5,300 5,100 5,500 5,300<br />
Cane sugar 3,920 3,810 4,000 3,910<br />
Florida 1,890 1,850 1,930 1,890<br />
Louisiana 1,700 1,650 1,710 1,687<br />
Texas 150 140 170 153<br />
Hawaii 180 170 190 180<br />
Total imports 2,827 2,373 3,639 2,960<br />
Tariff-rate quota imports 1,204 1,104 1,304 1,204<br />
Other program Imports 225 215 235 225<br />
Non-program imports 1,398 1,054 2,100 1,531<br />
Mexico 1,388 1,044 2,090 1,521<br />
Total supply 14,032 13,267 15,123 14,155<br />
Total exports 175 165 200 180<br />
Miscellaneous 0<br />
Deliveries for domestic use 11,590 11,368 11,712 11,577<br />
Transfer to sugar-containing products<br />
for export under reexport program 180 160 200 200<br />
Transfer to polyhydric alcohol, feed 30 28 32 30<br />
Deliveries for domestic food and beverage use 11,380 11,180 11,480 11,347<br />
Total use 11,765 11,533 11,912 11,757<br />
Ending stocks 2,267 1,734 3,211 2,398<br />
Stocks-to-use ratio 19.27 15.04 26.96 20.40<br />
Minimum price to avoid forfeiture 20.94 20.84 21.04 20.94<br />
Maximum private stocks-to-use 18.11 18.33 17.89 18.11<br />
Source: ERS, Sugar and Sweeteners Outlook .<br />
11<br />
Sugar and Sweeteners Outlook Special Article/SSS-M-295/March 14, 2013<br />
<strong>Economic</strong> <strong>Research</strong> <strong>Service</strong>, <strong>US</strong>DA
Table A-6 -- Estimated relationship between third-quarter average U.S. raw sugar price and ending stocks-to-use<br />
and the third-quarter world raw sugar price<br />
Dependent Variable: PRICE_3Q 1/<br />
Method: Least Squares<br />
Date: 02/20/13 Time: 09:12<br />
Sample: 1982 2012<br />
Included observations: 31<br />
Variable Coefficient Std. Error t-Statistic<br />
Constant 29.194 1.479 19.739<br />
D2009 2/ 3.355 1.182 2.839<br />
D2010TO2012*(WP_3QFY) 3/ 4/ 0.497 0.031 16.154<br />
STKS<strong>US</strong>E 5/ -0.456 0.089 -5.111<br />
R-squared 0.933 Mean dependent var 23.090<br />
Adjusted R-squared 0.926 S.D. dependent var 4.205<br />
S.E. <strong>of</strong> regression 1.146 Akaike info criterion 3.230<br />
Sum squared residual 35.438 Schwarz criterion 3.415<br />
Log likelihood -46.061 Hannan-Quinn criter. 3.290<br />
F-statistic 125.700 Durbin-Watson stat 1.725<br />
Prob(F-statistic) 0.000<br />
1/ Intercontinental Exchange (ICE) no.14/16 nearby futures averaged over July-September.<br />
2/ Indicator variable whose value equals 1 in 2009 and 0 all other years.<br />
3/ D2010TO2012 is an indicator variable whose value equals 1 in 2010, 2011, and 2012 and<br />
0 in all other years. U.S. raw sugar price is hypothesized as receiving support from the world price<br />
in this period.<br />
4/ WP_3Q is ICE no. 11 nearby futures averaged over July-September.<br />
5/ Ending fiscal year sugar stocks divided by sugar use.<br />
Source: ERS, Sugar and Sweeteners Outlook.<br />
12<br />
Sugar and Sweeteners Outlook Special Article/SSS-M-295/March 14, 2013<br />
<strong>Economic</strong> <strong>Research</strong> <strong>Service</strong>, <strong>US</strong>DA
Table A-7 -- Calculation <strong>of</strong> CCC energy title outlay<br />
Technical Relationships: How much <strong>of</strong> each feedstock to produce<br />
equivalent amount <strong>of</strong> ethanol<br />
Raw sugar Corn<br />
Gallons <strong>of</strong> ethanol produced per unit <strong>of</strong> feedstock 1/<br />
ton (sugar) 135.4 A1<br />
bushel (corn) 2.75 A2<br />
pound 0.0677 B1=A1/2000 0.0491 B2=A2/56<br />
Pounds <strong>of</strong> feedstock to produce 1 gallon ethanol 14.7710 C1=1/B1 20.3636 C2=1/B2<br />
Ratio <strong>of</strong> corn-to-sugar to produce same<br />
amount <strong>of</strong> ethanol 1.3786 D=C2/C1<br />
Pricing relationships and feedstock cost comparison<br />
Projected dollar corn price per bushel 2/ 5.40<br />
- byproduct credit for DDG and corn oil 1.62<br />
Net 3.78 E2<br />
Dollar price per pound 3/ 0.2094 F1 0.0675 F2=E2/56<br />
Feedstock cost per pound to produce 0.0677 0.2094 G1=F1 0.0931 G2=F2*D<br />
gallon <strong>of</strong> ethanol<br />
Difference in unit cost = implied pre-adjustment unit outlay 0.1163 H=G1-G2<br />
Adjustments to implied outlay<br />
Projected unit outlay to compensate for additional<br />
costs <strong>of</strong> using sugar in corn-based ethanol plant 4/ 0.0372 I<br />
RIN analysis 5/ 6/<br />
Estimated value <strong>of</strong> advanced fuel RIN per gallon 0.40 J1 0.15 J2<br />
Estimated value <strong>of</strong> conventional fuel RIN per gallon<br />
Value per 0.0677 gal <strong>of</strong> ethanol 0.0271 K1=J1*B1 0.0102 K2=J2*B2*D<br />
Net RIN advantage <strong>of</strong> sugar 0.0169 L=K1-K2<br />
Adjusted unit outlay per pound <strong>of</strong> raw sugar 0.1366 M=H+I-L<br />
1/ <strong>US</strong>DA, Office <strong>of</strong> the Chief Economist, The <strong>Economic</strong> Feasibility <strong>of</strong> Ethanol<br />
Production from Sugar in the United States, July 2006 .<br />
2/ <strong>US</strong>DA, Agricultural Long-term Projections to 2022.<br />
3/ <strong>US</strong>DA, FSA, Dairy and Sweeteners Analysis Branch - minimum price to avoid forfeiture.<br />
4/ <strong>US</strong>DA, FSA, Dairy and Sweeteners Analysis Branch - 40 percent <strong>of</strong> net corn cost<br />
5/ For RIN analysis, see: McPhail, Lihong, Paul Westcott, Heather Lutman. The Renewable Identification Number (RIN) System and U.S. Bi<strong>of</strong>uel<br />
Mandates. <strong>US</strong>DA-ERS, BIO-3, Nov. 2011 .<br />
6/ Values <strong>report</strong>ed to FSA's Dairy and Sweeteners Analysis Branch.<br />
Source: ERS, Sugar and Sweeteners Outlook .<br />
13<br />
Sugar and Sweeteners Outlook Special Article/SSS-M-295/March 14, 2013<br />
<strong>Economic</strong> <strong>Research</strong> <strong>Service</strong>, <strong>US</strong>DA
The final adjusted unit outlay is calculated at 13.66 cents per lb. This is multiplied by the amount <strong>of</strong> sugar that the<br />
CCC purchases at 20.94 cents per lb to derive the hypothetical total cost. This produces a probability distribution <strong>of</strong><br />
CCC outlay expenditure.<br />
Experimental Outlay Implications<br />
Simulation results are shown in table A-8. These results derive from the assumptions made and described earlier; a<br />
change in assumptions due to additional knowledge changes the forecast.<br />
Imports from Mexico are projected to vary between 1.14 million and 1.92 million but with a 50-percent probability<br />
<strong>of</strong> 1.51 million STRV. The standard deviation <strong>of</strong> 128,000 STRV implies about a 66-percent chance <strong>of</strong> imports in the<br />
range <strong>of</strong> 1.381 million to 1.638 million STRV, an interval that contains the WASDE projection <strong>of</strong> 1.388<br />
million STRV.<br />
Ending stocks vary between a low <strong>of</strong> 1.76 million and high <strong>of</strong> 3.07 million STRV but with a mean value <strong>of</strong> 2.41<br />
million STRV. CCC purchases vary between zero and an (unlikely) maximum <strong>of</strong> 959,000 STRV. The mean value is<br />
247,300 STRV, with a large standard deviation <strong>of</strong> 195,000 STRV. In terms <strong>of</strong> CCC outlay expenditure, the average<br />
result is $66.2 million.<br />
The graphical presentation in figure A-3 produces a better interpretation <strong>of</strong> the results, especially for CCC costs.<br />
This is a bimodal distribution with the “most likely” outcome between zero and $ 5 million, but it does not seem<br />
particularly useful. Disaggregated analysis suggests a 23.1-percent probability <strong>of</strong> zero expenditure. The probability<br />
<strong>of</strong> expenditure greater than zero but at or below $65 million is 26.1 percent. The probability <strong>of</strong> expenditure over $65<br />
is 50.9 percent. Other ranges can be <strong>report</strong>ed. The most important feature is the asymmetrical nature <strong>of</strong><br />
the distribution.<br />
Figure A-4 shows the sensitivity <strong>of</strong> the expenditure estimates to changes in the red-coded supply-use components in<br />
Mexico (table A-4) and the United States (table A-5). The results are ordered from the largest to smallest effects for<br />
the supply-use components. To correct for scale effects, results show the change in outlays when there is a positive<br />
1-standard deviation change in the supply-use component.<br />
The strongest effect on outlays is attributable to sugar production in Mexico. An increase <strong>of</strong> 84,980 mt can increase<br />
average outlay by $21.4 million. The raw sugar price is the next important influence, given all other values, but with<br />
effects in the opposite direction. The framework could conceivably be modified to gauge the implications <strong>of</strong> a<br />
positive change in the world raw sugar price through its effect on the domestic price. The next influences on outlays<br />
are aggregate beet sugar production and so on, as indicated in the chart.<br />
This chapter has described an application <strong>of</strong> stochastic analysis in simple form to estimating CCC outlays for the<br />
sale <strong>of</strong> sugar to ethanol producers. It integrates WASDE assumptions, along with reasonable departures, in<br />
producing a range <strong>of</strong> probabilities for outlays. Combining this approach with more supply-use and policy detail has<br />
the potential to improve <strong>US</strong>DA performance in U.S. sugar program management.<br />
24<br />
Sugar and Sweeteners Outlook Special Article/SSS-M-295/March 14, 2013<br />
<strong>Economic</strong> <strong>Research</strong> <strong>Service</strong>, <strong>US</strong>DA
Table A-8 -- Target output results for analysis<br />
Variable Minimum value Maximum value Mean Standard deviation<br />
1,000 short tons, raw value<br />
Imports from Mexico 1,142.4 1,921.8 1,509.2 128.3<br />
Ending stocks 1,763.9 3,073.4 2,406.2 171.0<br />
Privately held stocks 1,763.9 2,731.6 2,158.9 96.3<br />
Stocks owned by CCC 1/ 0.0 959.0 247.3 195.0<br />
Millions <strong>of</strong> dollars<br />
Energy title unit outlay for sale<br />
to ethanol producers 0 256.69 66.2 52.18<br />
1/ CCC = <strong>US</strong>DA's Commodity Credit Corporation.<br />
Source: ERS, Sugar and Sweeteners Outlook .<br />
25<br />
Sugar and Sweeteners Outlook Special Article/SSS-M-295/March 14, 2013<br />
<strong>Economic</strong> <strong>Research</strong> <strong>Service</strong>, <strong>US</strong>DA
Figure A‐3<br />
Probability distribution <strong>of</strong> projected CCC energy title outlay<br />
scale factor<br />
0.040<br />
0.035<br />
0.030<br />
0.025<br />
0.020<br />
0.015<br />
0.010<br />
0.005<br />
0.000<br />
-50<br />
23.1% 26.1% 50.9%<br />
0.0 65.0<br />
0<br />
Source: ERS, Sugar and Sweetener Outlook.<br />
50<br />
100<br />
16<br />
Sugar and Sweeteners Outlook Special Article/SSS-M-295/March 14, 2013<br />
<strong>Economic</strong> <strong>Research</strong> <strong>Service</strong>, <strong>US</strong>DA<br />
150<br />
Million dollars<br />
Probability <strong>of</strong> zero outlay = 23.1%<br />
Probability <strong>of</strong> outlay between $ 0‐65 million = 26.1%<br />
Probability <strong>of</strong> outlay over $65 million = 50.9%<br />
200<br />
250<br />
300
Figure A‐4<br />
Sensitivity <strong>of</strong> projected CCC energy title outlay due to changes in sugar supply‐use components<br />
Change <strong>of</strong> 1 standard dev. (sd):<br />
Mexico sugar prod. (sd=84.98)<br />
Raw sugar price (sd=1.146)<br />
U.S. beet sugar prod. (81.7)<br />
U.S. deliveries for consumption (sd=62.4)<br />
Mexico: human consumption (40.8)<br />
Mexico ending stocks (sd=54.0)<br />
TRQ imports (sd=40.8)<br />
Florida prod. (sd=16.3)<br />
Louisiana prod. (sd=13.1)<br />
Mexico sugar product exports (sd=8.2)<br />
U.S.sugar product re‐exports (sd=8.2)<br />
U.S. exports (sd=7.4)<br />
Texas prod. (sd=6.2)<br />
Hawaii prod. (sd=4.1)<br />
‐20<br />
Source: ERS, Sugar and Sweeteners Outlook.<br />
‐16.72<br />
‐15<br />
‐15.24<br />
‐12.10<br />
‐11.40<br />
‐10<br />
‐5<br />
‐1.95<br />
‐1.90<br />
‐1.69<br />
17<br />
Sugar and Sweeteners Outlook Special Article/SSS-M-295/March 14, 2013<br />
<strong>Economic</strong> <strong>Research</strong> <strong>Service</strong>, <strong>US</strong>DA<br />
0<br />
1.50<br />
1.03<br />
2.41<br />
3.30<br />
5<br />
Change in million dollars<br />
8.40<br />
10<br />
16.56<br />
15<br />
21.40<br />
20<br />
25