Characteristics of Women Farm Operators and Their Farms
Characteristics of Women Farm Operators and Their Farms
Characteristics of Women Farm Operators and Their Farms

You also want an ePaper? Increase the reach of your titles
YUMPU automatically turns print PDFs into web optimized ePapers that Google loves.
Economic Research Service, USDA <strong>Characteristics</strong> <strong>of</strong> <strong>Women</strong> <strong>Farm</strong> <strong>Operators</strong> <strong>and</strong> <strong>Their</strong> <strong>Farm</strong>s, EIB-111 7<br />
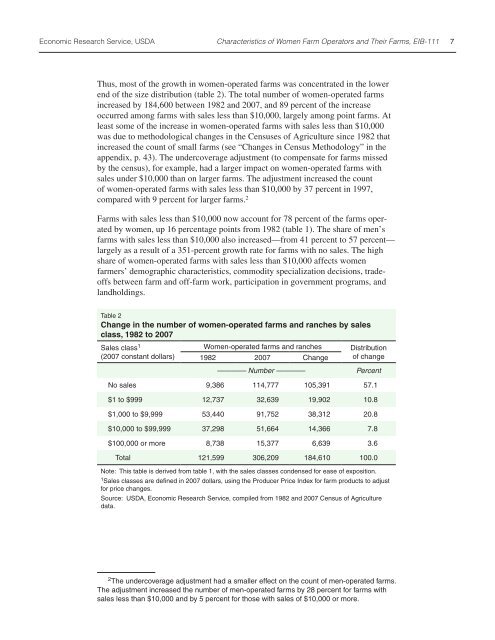
Thus, most <strong>of</strong> the growth in women-operated farms was concentrated in the lower<br />
end <strong>of</strong> the size distribution (table 2). The total number <strong>of</strong> women-operated farms<br />
increased by 184,600 between 1982 <strong>and</strong> 2007, <strong>and</strong> 89 percent <strong>of</strong> the increase<br />
occurred among farms with sales less than $10,000, largely among point farms. At<br />
least some <strong>of</strong> the increase in women-operated farms with sales less than $10,000<br />
was due to methodological changes in the Censuses <strong>of</strong> Agriculture since 1982 that<br />
increased the count <strong>of</strong> small farms (see “Changes in Census Methodology” in the<br />
appendix, p. 43). The undercoverage adjustment (to compensate for farms missed<br />
by the census), for example, had a larger impact on women-operated farms with<br />
sales under $10,000 than on larger farms. The adjustment increased the count<br />
<strong>of</strong> women-operated farms with sales less than $10,000 by 37 percent in 1997,<br />
compared with 9 percent for larger farms. 2<br />
<strong>Farm</strong>s with sales less than $10,000 now account for 78 percent <strong>of</strong> the farms operated<br />
by women, up 16 percentage points from 1982 (table 1). The share <strong>of</strong> men’s<br />
farms with sales less than $10,000 also increased—from 41 percent to 57 percent—<br />
largely as a result <strong>of</strong> a 351-percent growth rate for farms with no sales. The high<br />
share <strong>of</strong> women-operated farms with sales less than $10,000 affects women<br />
farmers’ demographic characteristics, commodity specialization decisions, trade<strong>of</strong>fs<br />
between farm <strong>and</strong> <strong>of</strong>f-farm work, participation in government programs, <strong>and</strong><br />
l<strong>and</strong>holdings.<br />
Table 2<br />
Change in the number <strong>of</strong> women-operated farms <strong>and</strong> ranches by sales<br />
class, 1982 to 2007<br />
Sales class 1<br />
(2007 constant dollars)<br />
<strong>Women</strong>-operated farms <strong>and</strong> ranches Distribution<br />
<strong>of</strong> change<br />
1982 2007 Change<br />
———— Number ———— Percent<br />
No sales 9,386 114,777 105,391 57.1<br />
$1 to $999 12,737 32,639 19,902 10.8<br />
$1,000 to $9,999 53,440 91,752 38,312 20.8<br />
$10,000 to $99,999 37,298 51,664 14,366 7.8<br />
$100,000 or more 8,738 15,377 6,639 3.6<br />
Total 121,599 306,209 184,610 100.0<br />
Note: This table is derived from table 1, with the sales classes condensed for ease <strong>of</strong> exposition.<br />
1Sales classes are defined in 2007 dollars, using the Producer Price Index for farm products to adjust<br />
for price changes.<br />
Source: USDA, Economic Research Service, compiled from 1982 <strong>and</strong> 2007 Census <strong>of</strong> Agriculture<br />
data.<br />
2 The undercoverage adjustment had a smaller effect on the count <strong>of</strong> men-operated farms.<br />
The adjustment increased the number <strong>of</strong> men-operated farms by 28 percent for farms with<br />
sales less than $10,000 <strong>and</strong> by 5 percent for those with sales <strong>of</strong> $10,000 or more.