FODITS - Institut für Astronomische und Physikalische Geodäsie ...
FODITS - Institut für Astronomische und Physikalische Geodäsie ...
FODITS - Institut für Astronomische und Physikalische Geodäsie ...
Create successful ePaper yourself
Turn your PDF publications into a flip-book with our unique Google optimized e-Paper software.
Additional periodic parameters–yearly, half-yearly,<br />
monthly, and half-monthly–were considered in this<br />
<strong>FODITS</strong> analysis.<br />
Table 1 reports the summary of the results of the<br />
<strong>FODITS</strong> analysis. The number of detected discontinuities<br />
and outliers in all 238 analyzed stations points<br />
out how important is the automated analysis of the<br />
time series.<br />
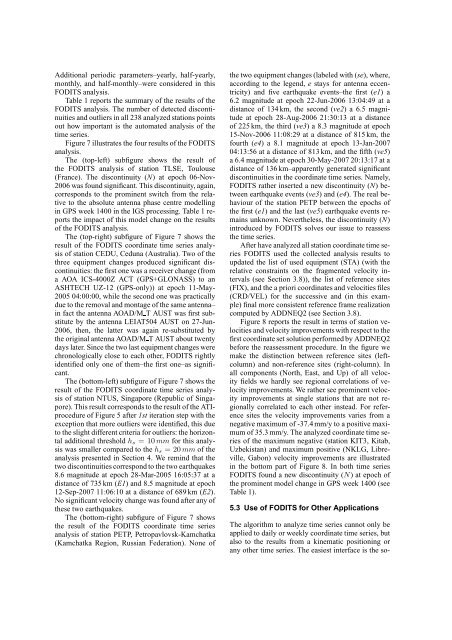
Figure 7 illustrates the four results of the <strong>FODITS</strong><br />
analysis.<br />
The (top-left) subfigure shows the result of<br />
the <strong>FODITS</strong> analysis of station TLSE, Toulouse<br />
(France). The discontinuity (N) at epoch 06-Nov-<br />
2006 was fo<strong>und</strong> significant. This discontinuity, again,<br />
corresponds to the prominent switch from the relative<br />
to the absolute antenna phase centre modelling<br />
in GPS week 1400 in the IGS processing. Table 1 reports<br />
the impact of this model change on the results<br />
of the <strong>FODITS</strong> analysis.<br />
The (top-right) subfigure of Figure 7 shows the<br />
result of the <strong>FODITS</strong> coordinate time series analysis<br />
of station CEDU, Ceduna (Australia). Two of the<br />
three equipment changes produced significant discontinuities:<br />
the first one was a receiver change (from<br />
a AOA ICS-4000Z ACT (GPS+GLONASS) to an<br />
ASHTECH UZ-12 (GPS-only)) at epoch 11-May-<br />
2005 04:00:00, while the second one was practically<br />
due to the removal and montage of the same antenna–<br />
in fact the antenna AOAD/M T AUST was first substitute<br />
by the antenna LEIAT504 AUST on 27-Jun-<br />
2006, then, the latter was again re-substituted by<br />
the original antenna AOAD/M T AUST about twenty<br />
days later. Since the two last equipment changes were<br />
chronologically close to each other, <strong>FODITS</strong> rightly<br />
identified only one of them–the first one–as significant.<br />
The (bottom-left) subfigure of Figure 7 shows the<br />
result of the <strong>FODITS</strong> coordinate time series analysis<br />
of station NTUS, Singapore (Republic of Singapore).<br />
This result corresponds to the result of the ATIprocedure<br />
of Figure 5 after 1st iteration step with the<br />
exception that more outliers were identified, this due<br />
to the slight different criteria for outliers: the horizontal<br />
additional threshold hs = 10 mm for this analysis<br />
was smaller compared to the hs = 20 mm of the<br />
analysis presented in Section 4. We remind that the<br />
two discontinuities correspond to the two earthquakes<br />
8.6 magnitude at epoch 28-Mar-2005 16:05:37 at a<br />
distance of 735 km (E1) and 8.5 magnitude at epoch<br />
12-Sep-2007 11:06:10 at a distance of 689 km (E2).<br />
No significant velocity change was fo<strong>und</strong> after any of<br />
these two earthquakes.<br />
The (bottom-right) subfigure of Figure 7 shows<br />
the result of the <strong>FODITS</strong> coordinate time series<br />
analysis of station PETP, Petropavlovsk-Kamchatka<br />
(Kamchatka Region, Russian Federation). None of<br />
the two equipment changes (labeled with (se), where,<br />
according to the legend, e stays for antenna eccentricity)<br />
and five earthquake events–the first (e1) a<br />
6.2 magnitude at epoch 22-Jun-2006 13:04:49 at a<br />
distance of 134 km, the second (ve2) a 6.5 magnitude<br />
at epoch 28-Aug-2006 21:30:13 at a distance<br />
of 225 km, the third (ve3) a 8.3 magnitude at epoch<br />
15-Nov-2006 11:08:29 at a distance of 815 km, the<br />
fourth (e4) a 8.1 magnitude at epoch 13-Jan-2007<br />
04:13:56 at a distance of 813 km, and the fifth (ve5)<br />
a 6.4 magnitude at epoch 30-May-2007 20:13:17 at a<br />
distance of 136 km–apparently generated significant<br />
discontinuities in the coordinate time series. Namely,<br />
<strong>FODITS</strong> rather inserted a new discontinuity (N) between<br />
earthquake events (ve3) and (e4). The real behaviour<br />
of the station PETP between the epochs of<br />
the first (e1) and the last (ve5) earthquake events remains<br />
unknown. Nevertheless, the discontinuity (N)<br />
introduced by <strong>FODITS</strong> solves our issue to reassess<br />
the time series.<br />
After have analyzed all station coordinate time series<br />
<strong>FODITS</strong> used the collected analysis results to<br />
updated the list of used equipment (STA) (with the<br />
relative constraints on the fragmented velocity intervals<br />
(see Section 3.8)), the list of reference sites<br />
(FIX), and the a priori coordinates and velocities files<br />
(CRD/VEL) for the successive and (in this example)<br />
final more consistent reference frame realization<br />
computed by ADDNEQ2 (see Section 3.8).<br />
Figure 8 reports the result in terms of station velocities<br />
and velocity improvements with respect to the<br />
first coordinate set solution performed by ADDNEQ2<br />
before the reassessment procedure. In the figure we<br />
make the distinction between reference sites (leftcolumn)<br />
and non-reference sites (right-column). In<br />
all components (North, East, and Up) of all velocity<br />
fields we hardly see regional correlations of velocity<br />
improvements. We rather see prominent velocity<br />
improvements at single stations that are not regionally<br />
correlated to each other instead. For reference<br />
sites the velocity improvements varies from a<br />
negative maximum of -37.4 mm/y to a positive maximum<br />
of 35.3 mm/y. The analyzed coordinate time series<br />
of the maximum negative (station KIT3, Kitab,<br />
Uzbekistan) and maximum positive (NKLG, Libreville,<br />
Gabon) velocity improvements are illustrated<br />
in the bottom part of Figure 8. In both time series<br />
<strong>FODITS</strong> fo<strong>und</strong> a new discontinuity (N) at epoch of<br />
the prominent model change in GPS week 1400 (see<br />
Table 1).<br />
5.3 Use of <strong>FODITS</strong> for Other Applications<br />
The algorithm to analyze time series cannot only be<br />
applied to daily or weekly coordinate time series, but<br />
also to the results from a kinematic positioning or<br />
any other time series. The easiest interface is the so-


