MODELING CHAR OXIDATION AS A FUNCTION OF PRESSURE ...
MODELING CHAR OXIDATION AS A FUNCTION OF PRESSURE ...
MODELING CHAR OXIDATION AS A FUNCTION OF PRESSURE ...

Create successful ePaper yourself
Turn your PDF publications into a flip-book with our unique Google optimized e-Paper software.
List of Figures<br />
Figure 2.1. Rate-controlling zones for heterogeneous char oxidation………………….6<br />
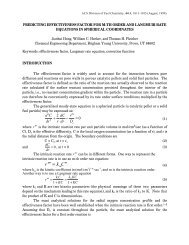
Figure 2.2. The effectiveness factor curves for first order and zeroth order reactions<br />
in Cartesian Coordinates..………………………………………………. 19<br />
Figure 4.1. The effectiveness factor curves for first order and zeroth order reactions<br />
in Cartesian Coordinates………………………………………………… 28<br />
Figure 4.2. Effectiveness factor curves for first order and zeroth order reactions in<br />
spherical coordinates……………………………………………………..34<br />
Figure 4.3. The correction function f c plotted as a function of both the general<br />
modulus (M T ) and the observed reaction order in Zone I (m obs )………….38<br />
Figure 5.1. The relationship between KC s and the observed reaction order (n obs ) as<br />
predicted by Eq. (5.13)………..…………………………………………50<br />
Figure 5.2. Illustration of how internal combustion can decrease the particle<br />
diameter………………..……………………………………………….. 60<br />
Figure 7.1. Comparison of predictions of carbon reactivity with graphite flake data<br />
(Ranish and Walker, 1993) obtained as a function of P O2 and T p ………..89<br />
Figure 7.2. Schematic of a pore connected to the surface of a char particle…………..93<br />
Figure 7.3. Schematic of High Pressure Controlled-Profile (HPCP) drop-tube<br />
reactor…………………………………………………………………… 97<br />
Figure 7.4. Comparison of the HP-CBK predictions of reaction rate with large<br />
coal char particle data (Mathias, 1992) as a function of a) V g, b) P O2<br />
(P tot = 0.85 atm), c) P tot (x O2 = 21%), d) P tot (P O2 = 0.18 atm), e) d p,<br />
f) T g…………..…………………………………………………………103<br />
Figure 7.5. The gas temperature profiles for different total pressures……………….108<br />
Figure 7.6. Comparison of HP-CBK predictions of carbon burnouts with<br />
pulverized coal char data (Monson, 1992) at total pressures of 1, 5,<br />
and 10 atm………………………………………………………………110<br />
Figure 7.7. Comparison of HP-CBK predictions of carbon burnouts with<br />
pulverized coal char data (Monson, 1992) at a total pressure of 15 atm.. 110<br />
Figure A.1. Schematic of the flat-flame burner and the particle collection and<br />
separation system……………….………………………………………144<br />
xi