A Transferable Force Field To Predict Phase Equilibria and Surface ...
A Transferable Force Field To Predict Phase Equilibria and Surface ...
A Transferable Force Field To Predict Phase Equilibria and Surface ...

You also want an ePaper? Increase the reach of your titles
YUMPU automatically turns print PDFs into web optimized ePapers that Google loves.
The Journal of Physical Chemistry B ARTICLE<br />
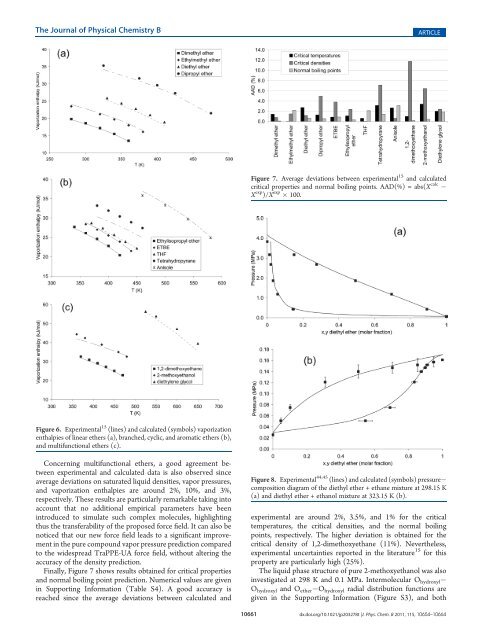
Figure 6. Experimental 15 (lines) <strong>and</strong> calculated (symbols) vaporization<br />
enthalpies of linear ethers (a), branched, cyclic, <strong>and</strong> aromatic ethers (b),<br />
<strong>and</strong> multifunctional ethers (c).<br />
Concerning multifunctional ethers, a good agreement between<br />
experimental <strong>and</strong> calculated data is also observed since<br />
average deviations on saturated liquid densities, vapor pressures,<br />
<strong>and</strong> vaporization enthalpies are around 2%, 10%, <strong>and</strong> 3%,<br />
respectively. These results are particularly remarkable taking into<br />
account that no additional empirical parameters have been<br />
introduced to simulate such complex molecules, highlighting<br />
thus the transferability of the proposed force field. It can also be<br />
noticed that our new force field leads to a significant improvement<br />
in the pure compound vapor pressure prediction compared<br />
to the widespread TraPPE-UA force field, without altering the<br />
accuracy of the density prediction.<br />
Finally, Figure 7 shows results obtained for critical properties<br />
<strong>and</strong> normal boiling point prediction. Numerical values are given<br />
in Supporting Information (Table S4). A good accuracy is<br />
reached since the average deviations between calculated <strong>and</strong><br />
Figure 7. Average deviations between experimental 15 <strong>and</strong> calculated<br />
critical properties <strong>and</strong> normal boiling points. AAD(%) = abs(X calc<br />
X exp )/X exp<br />
100.<br />
Figure 8. Experimental 44,45 (lines) <strong>and</strong> calculated (symbols) pressure<br />
composition diagram of the diethyl ether + ethane mixture at 298.15 K<br />
(a) <strong>and</strong> diethyl ether + ethanol mixture at 323.15 K (b).<br />
experimental are around 2%, 3.5%, <strong>and</strong> 1% for the critical<br />
temperatures, the critical densities, <strong>and</strong> the normal boiling<br />
points, respectively. The higher deviation is obtained for the<br />
critical density of 1,2-dimethoxyethane (11%). Nevertheless,<br />
experimental uncertainties reported in the literature 15 for this<br />
property are particularly high (25%).<br />
The liquid phase structure of pure 2-methoxyethanol was also<br />
investigated at 298 K <strong>and</strong> 0.1 MPa. Intermolecular O hydroxyl<br />
Ohydroxyl <strong>and</strong> Oether Ohydroxyl radial distribution functions are<br />
given in the Supporting Information (Figure S3), <strong>and</strong> both<br />
10661 dx.doi.org/10.1021/jp203278t |J. Phys. Chem. B 2011, 115, 10654–10664