EUCLIPSE First Period Report
EUCLIPSE First Period Report
EUCLIPSE First Period Report

Create successful ePaper yourself
Turn your PDF publications into a flip-book with our unique Google optimized e-Paper software.
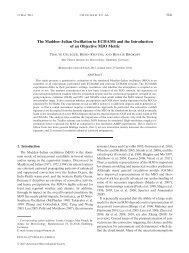
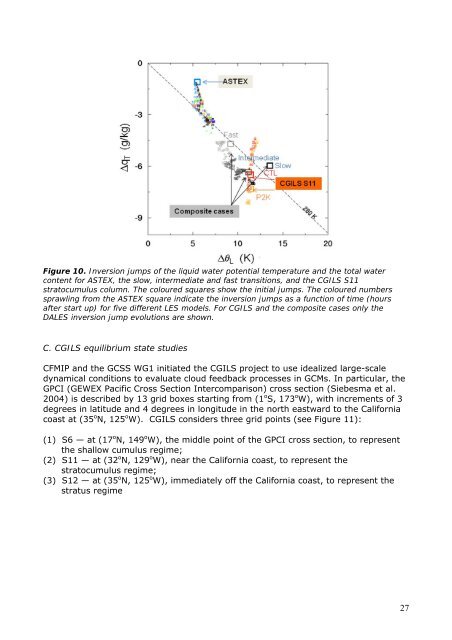
Figure 10. Inversion jumps of the liquid water potential temperature and the total water<br />
content for ASTEX, the slow, intermediate and fast transitions, and the CGILS S11<br />
stratocumulus column. The coloured squares show the initial jumps. The coloured numbers<br />
sprawling from the ASTEX square indicate the inversion jumps as a function of time (hours<br />
after start up) for five different LES models. For CGILS and the composite cases only the<br />
DALES inversion jump evolutions are shown.<br />
C. CGILS equilibrium state studies<br />
CFMIP and the GCSS WG1 initiated the CGILS project to use idealized large-scale<br />
dynamical conditions to evaluate cloud feedback processes in GCMs. In particular, the<br />
GPCI (GEWEX Pacific Cross Section Intercomparison) cross section (Siebesma et al.<br />
2004) is described by 13 grid boxes starting from (1 o S, 173 o W), with increments of 3<br />
degrees in latitude and 4 degrees in longitude in the north eastward to the California<br />
coast at (35 o N, 125 o W). CGILS considers three grid points (see Figure 11):<br />
(1) S6 — at (17 o N, 149 o W), the middle point of the GPCI cross section, to represent<br />
the shallow cumulus regime;<br />
(2) S11 — at (32 o N, 129 o W), near the California coast, to represent the<br />
stratocumulus regime;<br />
(3) S12 — at (35 o N, 125 o W), immediately off the California coast, to represent the<br />
stratus regime<br />
27