EUCLIPSE First Period Report
EUCLIPSE First Period Report
EUCLIPSE First Period Report

Create successful ePaper yourself
Turn your PDF publications into a flip-book with our unique Google optimized e-Paper software.
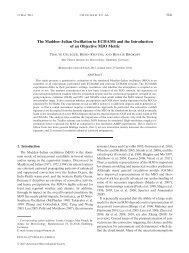
Figure 18 : time series of<br />
incoming short-wave flux at the<br />
surface in 2006 at selected point<br />
along the West African<br />
climatological gradient, from a<br />
wet Soudanian site (Djougou,<br />
bottom) to the Southern<br />
(Niamey, middle) and Northern<br />
Sahel (Bamba, top). A 15-day<br />
running mean has been applied.<br />
Note that the cloud radiative<br />
impact increases and extends in<br />
time from the northern to<br />
southern locations and is the<br />
largest during the monsoon<br />
period, from June to September.<br />
Figure 18. shows a comparison of the annual cycle of the incoming solar radiation in models<br />
and observations at selected locations. It illustrates the structure of the observed meridional<br />
gradient of the cloud radiative impact (reaching more than 50 W/m2 within 7° of latitude<br />
during the monsoon). This feature is at best qualitatively captured by NWPs, indeed, the<br />
gradient is largely underestimated by the ECMWF models and much too strong in ARPEGE.<br />
<strong>First</strong> examination of ARPEGE results show that these biases involve a too approximate<br />
modelling of different cloud types, and notably mid-level clouds in the Sahel. These<br />
clouds develop within an atmosphere characterized by a relatively weak stability up to<br />
4 km (above the top of the boundary layer) – Fig.19 (left). The significance of such a<br />
thermodynamic-cloud coupling was pointed out by Johnson (JAS 1999) albeit in the<br />
very distinct moister climate of the Pacific warm pool and involved congestus clouds.<br />
As illustrated in Fig. 19 (left), the model reproduces reasonably well the low-level<br />
atmospheric structures, including the diurnal cycle of the boundary layer which is only<br />
somewhat too cold. However, it fails to capture the weak stability layer above.<br />
Similarly, it is able to capture the seasonal changes of the cloud cover vertical<br />
structure, with an increase of the low cloud cover during the monsoon (Fig. 19 right).<br />
Simulated mid-level clouds remains too few though.<br />
37