Forecasting Large Datasets with Reduced Rank Multivariate Models
Forecasting Large Datasets with Reduced Rank Multivariate Models
Forecasting Large Datasets with Reduced Rank Multivariate Models
You also want an ePaper? Increase the reach of your titles
YUMPU automatically turns print PDFs into web optimized ePapers that Google loves.
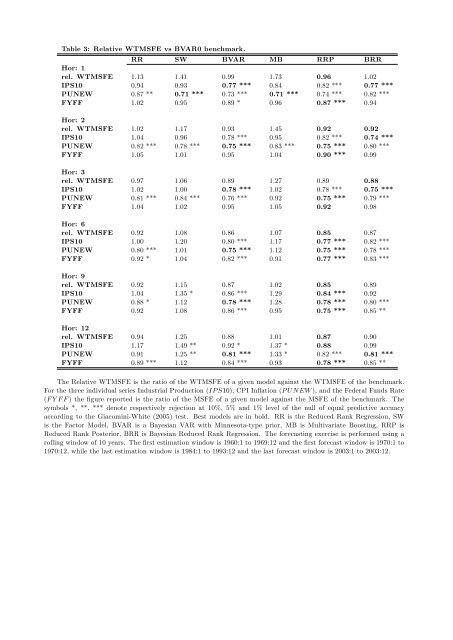
Table 3: Relative WTMSFE vs BVAR0 benchmark.<br />
RR SW BVAR MB RRP BRR<br />
Hor: 1<br />
rel. WTMSFE 1.13 1.41 0.99 1.73 0.96 1.02<br />
IPS10 0.94 0.93 0.77 *** 0.84 0.82 *** 0.77 ***<br />
PUNEW 0.87 ** 0.71 *** 0.73 *** 0.71 *** 0.74 *** 0.82 ***<br />
FYFF 1.02 0.95 0.89 * 0.96 0.87 *** 0.94<br />
Hor: 2<br />
rel. WTMSFE 1.02 1.17 0.93 1.45 0.92 0.92<br />
IPS10 1.04 0.96 0.78 *** 0.95 0.82 *** 0.74 ***<br />
PUNEW 0.82 *** 0.78 *** 0.75 *** 0.83 *** 0.75 *** 0.80 ***<br />
FYFF 1.05 1.01 0.95 1.04 0.90 *** 0.99<br />
Hor: 3<br />
rel. WTMSFE 0.97 1.06 0.89 1.27 0.89 0.88<br />
IPS10 1.02 1.00 0.78 *** 1.02 0.78 *** 0.75 ***<br />
PUNEW 0.81 *** 0.84 *** 0.76 *** 0.92 0.75 *** 0.79 ***<br />
FYFF 1.04 1.02 0.95 1.05 0.92 0.98<br />
Hor: 6<br />
rel. WTMSFE 0.92 1.08 0.86 1.07 0.85 0.87<br />
IPS10 1.00 1.20 0.80 *** 1.17 0.77 *** 0.82 ***<br />
PUNEW 0.80 *** 1.01 0.75 *** 1.12 0.75 *** 0.78 ***<br />
FYFF 0.92 * 1.04 0.82 *** 0.91 0.77 *** 0.83 ***<br />
Hor: 9<br />
rel. WTMSFE 0.92 1.15 0.87 1.02 0.85 0.89<br />
IPS10 1.04 1.35 * 0.86 *** 1.29 0.84 *** 0.92<br />
PUNEW 0.88 * 1.12 0.78 *** 1.28 0.78 *** 0.80 ***<br />
FYFF 0.92 1.08 0.86 *** 0.95 0.75 *** 0.85 **<br />
Hor: 12<br />
rel. WTMSFE 0.94 1.25 0.88 1.01 0.87 0.90<br />
IPS10 1.17 1.49 ** 0.92 * 1.37 * 0.88 0.99<br />
PUNEW 0.91 1.25 ** 0.81 *** 1.33 * 0.82 *** 0.81 ***<br />
FYFF 0.89 *** 1.12 0.84 *** 0.93 0.78 *** 0.85 **<br />
The Relative WTMSFE is the ratio of the WTMSFE of a given model against the WTMSFE of the benchmark.<br />
For the three individual series Industrial Production (IP S10), CPI In‡ation (P UNEW ), and the Federal Funds Rate<br />
(F Y F F ) the …gure reported is the ratio of the MSFE of a given model against the MSFE of the benchmark. The<br />
symbols *, **, *** denote respectively rejection at 10%, 5% and 1% level of the null of equal predictive accuacy<br />
according to the Giacomini-White (2005) test. Best models are in bold. RR is the <strong>Reduced</strong> <strong>Rank</strong> Regression, SW<br />
is the Factor Model, BVAR is a Bayesian VAR <strong>with</strong> Minnesota-type prior, MB is <strong>Multivariate</strong> Boosting, RRP is<br />
<strong>Reduced</strong> <strong>Rank</strong> Posterior, BRR is Bayesian <strong>Reduced</strong> <strong>Rank</strong> Regression. The forecasting exercise is performed using a<br />
rolling window of 10 years. The …rst estimation window is 1960:1 to 1969:12 and the …rst forecast window is 1970:1 to<br />
1970:12, while the last estimation window is 1984:1 to 1993:12 and the last forecast window is 2003:1 to 2003:12.


