Special Eurobarometer 'European social reality'
Special Eurobarometer 'European social reality'
Special Eurobarometer 'European social reality'

Create successful ePaper yourself
Turn your PDF publications into a flip-book with our unique Google optimized e-Paper software.
<strong>Special</strong> <strong>Eurobarometer</strong> 273 / Wave 66.3 – TNS Opinion & Social<br />
Report<br />
<strong>Special</strong> <strong>Eurobarometer</strong><br />
European Social Reality<br />
Fieldwork November – December 2006<br />
Publication February 2007<br />
This survey was requested and coordinated by Directorate General COMMUNICATION<br />
This document does not represent the point of view of the European Commission.<br />
The interpretations and opinions contained in it are solely those of the authors.<br />
European<br />
Commission
<strong>Special</strong> EUROBAROMETER 273 “European Social Reality” Report<br />
Table of contents<br />
INTRODUCTION ...........................................................................................3<br />
1. Living in the European Union today...............................................5<br />
1.1 Are Europeans happy?....................................................................... 5<br />
1.2 Life satisfaction ................................................................................ 7<br />
1.3 What do European consider important ............................................... 14<br />
1.4 Family life ..................................................................................... 16<br />
1.4.1 The family as a support network ....................................................... 16<br />
1.4.2 The division of labour ...................................................................... 17<br />
1.4.3 Satisfaction with the facilities for children in the local area.................... 19<br />
1.5 Work ............................................................................................ 21<br />
1.5.1 Job satisfaction .............................................................................. 21<br />
1.5.2 Learning new things at work ............................................................ 23<br />
1.5.3 Work stress ................................................................................... 25<br />
1.5.4 Staying in work .............................................................................. 27<br />
1.5.5 Career progression ......................................................................... 29<br />
1.5.6 Finding a new job ........................................................................... 30<br />
1.6 Leisure time activities and voluntary work .......................................... 34<br />
1.7 Trust in political institutions ............................................................. 37<br />
2. Different personal and collective futures? ...................................40<br />
2.1 People’s assessment of their personal situation ................................... 40<br />
2.2 The issues of concern for Europeans.................................................. 43<br />
2.3 Future expectations ........................................................................ 47<br />
2.4 Life in the European Union for the next generation .............................. 49<br />
2.5 The concerns for the next generation................................................. 52<br />
2.6 Getting ahead in life........................................................................ 57<br />
3. Other <strong>social</strong> realities ...................................................................60<br />
3.1 Poverty and <strong>social</strong> exclusion............................................................. 60<br />
3.2 Immigration................................................................................... 68<br />
- 1 -
<strong>Special</strong> EUROBAROMETER 273 “European Social Reality” Report<br />
4. Choices and solutions .................................................................72<br />
4.1 Pensions........................................................................................ 72<br />
4.2 The <strong>social</strong> welfare system ................................................................ 76<br />
4.3 Education ...................................................................................... 80<br />
CONCLUSION.............................................................................................83<br />
ANNEXES<br />
Tables<br />
Technical note<br />
Questionnaire<br />
- 2 -
<strong>Special</strong> EUROBAROMETER 273 “European Social Reality” Report<br />
INTRODUCTION<br />
In order to better understand the <strong>social</strong> realities of European Union citizens, the<br />
European Commission launched a special <strong>Eurobarometer</strong> survey that gauges many<br />
dimensions of <strong>social</strong> life in the European Union.<br />
Between the 17 th of November and the 19 th of December 2006, 26.755 EU citizens<br />
aged 15 and over living in the Member States and the two countries that were at<br />
that time about to join the EU: Bulgaria and Romania were interviewed. The survey<br />
was commissioned by the Directorate-General Communication of the European<br />
Commission and was carried out by TNS Opinion & Social, a consortium formed by<br />
TNS and EOS Gallup Europe. The methodology used is that of the Standard<br />
<strong>Eurobarometer</strong> surveys of the Directorate-General Communication (“Public Opinion<br />
and Media Monitoring” Unit). A technical note concerning the interviews, carried out<br />
by the institutes of the TNS Opinion & Social network, is annexed to this report. This<br />
note specifies the interview method used, as well as the confidence intervals 1 .<br />
The survey covers opinions and feelings about a vast array of the dimensions of<br />
<strong>social</strong>, economical, political and everyday life of the European citizens offering a<br />
great deal of information about life in the European Union at the end of 2006.<br />
This report studies successively the various dimensions covered by the survey.<br />
♦ First of all, we shall focus on life in the European Union as perceived by<br />
European Union citizens, looking at personal happiness, life satisfaction,<br />
family life, work, leisure time, voluntary work and politics, issues that<br />
together form the cornerstone of European society.<br />
♦ In the second part of this report we examine the relationship between<br />
people’s personal future and the collective future. The survey shows that<br />
these two futures are perceived very differently by citizens. We also look at<br />
life in the European Union for future generations.<br />
♦ The third part of this report focuses on two important <strong>social</strong> realities of the<br />
European Union: firstly poverty and <strong>social</strong> exclusion and secondly,<br />
immigration.<br />
♦ Lastly, we focus on some choices and solutions: what should be done to<br />
guarantee the financing of pensions, how the <strong>social</strong> welfare system is<br />
evaluated in each country and can it serve as a model for other countries and<br />
should all students have equal access to higher education?<br />
1 The results tables are included in the annex. The totals indicated may show a one point difference with<br />
the sum of the individual units. It should also be noted that the total of the percentages in the tables of<br />
this report may exceed 100% when the respondent has the possibility to give several answers to the same<br />
question.<br />
- 3 -
<strong>Special</strong> EUROBAROMETER 273 “European Social Reality” Report<br />
As this study has been conducted before the accession of Romania and Bulgaria to<br />
the EU, we base our global and socio-demographic analysis on the EU25 average.<br />
EU27 results are presented in the tables handed as an annex but they are purely<br />
indicative as we could not anticipate the impact of the accession of these countries<br />
on the results to questions dealing with “<strong>social</strong> realities”. The reader should also be<br />
aware of the fact that the weight of the Romanian and Bulgarian results in the EU27<br />
average is about 6.3% and that almost three quarters of these 6.3% are coming<br />
from the Romanian results only. In other words, the difference between EU25<br />
average and EU27 is statistically and logically limited.<br />
The abbreviations used in this report correspond to:<br />
EU25<br />
ABBREVIATIONS<br />
European Union - 25 Member States<br />
EU15 European Union - 15 Member States<br />
before the enlargement of the 1 st of May 2004<br />
NMS New Member States – 10 Member States which<br />
joined the EU on the 1 st of May 2004<br />
DK Don’t know<br />
BE Belgium<br />
CZ Czech Republic<br />
DK Denmark<br />
D-E East Germany<br />
DE Germany<br />
D-W West Germany<br />
EE Estonia<br />
EL Greece<br />
ES Spain<br />
FR France<br />
IE Ireland<br />
IT Italy<br />
CY Republic of Cyprus ∗<br />
LT Lithuania<br />
LV Latvia<br />
LU Luxembourg<br />
HU Hungary<br />
MT Malta<br />
NL The Netherlands<br />
AT Austria<br />
PL Poland<br />
PT Portugal<br />
SI Slovenia<br />
SK Slovakia<br />
FI Finland<br />
SE Sweden<br />
UK The United Kingdom<br />
BG Bulgaria<br />
RO Romania<br />
TEA:<br />
Terminal Education Age: the age at which the<br />
respondent left full-time education<br />
∗ Cyprus as a whole is one of the 25 European Union Member States. However, the "acquis<br />
communautaire" is suspended in the part of the country that is not controlled by the government of the<br />
Republic of Cyprus. Interviews were conducted only in the part of the country controlled by the<br />
government of the Republic of Cyprus; they are recorded in the category "CY"<br />
and are included in the EU25 average.<br />
- 4 -
<strong>Special</strong> EUROBAROMETER 273 “European Social Reality” Report<br />
1. Living in the European Union today<br />
We begin this report with an examination of life in the European Union today. But<br />
first a caveat: it is important to note that this survey measures people’s perceptions<br />
which are influenced by many factors, some of which we can analyse on the basis of<br />
this survey and others which are more difficult to measure as they relate to the<br />
personal well-being and situation of the respondent. Hence, when interpreting the<br />
results of this study, it must be borne in mind that <strong>social</strong> realities are always relative.<br />
1.1 Are Europeans happy?<br />
Overall, when taking all things together, most European Union citizens are happy. On<br />
average, 87% of the EU25 respondents say they are happy 2 .<br />
2 QA1. Taking all things together would you say you are very happy, quite happy, not very happy or not<br />
at all happy?<br />
- 5 -
<strong>Special</strong> EUROBAROMETER 273 “European Social Reality” Report<br />
However, the extent and intensity of happiness is not the same throughout the<br />
European Union. People in the former EU15 countries tend to feel happier than those<br />
living in the new Member States (28% vs. 17% are very happy). There are three<br />
countries where over two-fifths of respondents say they are very happy: Denmark<br />
(49%), Ireland (46%) and the Netherlands (43%). Conversely, in the two newest<br />
Member States, Bulgaria and Romania, less than one respondent out of ten feels<br />
very happy. In fact, in Bulgaria, over half of the interviewees say they do not feel<br />
happy (55%).<br />
- 6 -
<strong>Special</strong> EUROBAROMETER 273 “European Social Reality” Report<br />
1.2 Life satisfaction<br />
The survey includes 14 items that capture how satisfied people are with their life, of<br />
which happiness is one 3 . Country fluctuations in the level of reported happiness thus<br />
relate to these other aspects such as people’s perceived standard of living, their<br />
quality of life, facilities in their local area, feeling safe and confidence in one’s job<br />
and one’s pension.<br />
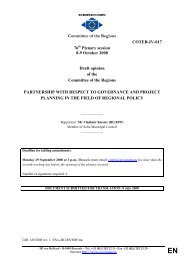
On average, over 9 out of 10 Europeans rate their house or flat as satisfactory<br />
(92%) and the wide majority of countries is generally satisfied. When it comes to<br />
pensions and job opportunities in the local area, satisfaction levels are far lower.<br />
Satisfaction with house or flat<br />
The life satisfaction items*<br />
% positive and negative responses - EU25<br />
Happiness<br />
Satisfaction with quality of life<br />
Confidence in keeping job**<br />
Satisfaction with state of health<br />
Satisfaction with standard of living<br />
Satisfaction with local travel facilities<br />
Satisfaction with local shopping facilities<br />
Satisfaction with local medical services<br />
Satisfaction with available time<br />
Feeling safe<br />
Satisfaction with leisure facilities<br />
Confidence about pensions<br />
Satisfaction with local job opportunities<br />
Negative responses Positive responses DK<br />
- 7 -<br />
8<br />
13<br />
13<br />
13<br />
16<br />
16<br />
20<br />
21<br />
20<br />
26<br />
29<br />
35<br />
52<br />
48<br />
92<br />
87<br />
86<br />
85<br />
84<br />
83<br />
78<br />
78<br />
77<br />
74<br />
70<br />
60<br />
42<br />
38<br />
* Negative responses=unhappy, not satisfactory, not confident, unsafe; positive responses=happy, satisfactory,<br />
confident, safe. ** Asked only of respondents currently in work.<br />
We next focus in more detail on the perceived standard of living, quality of life,<br />
feeling safe and confidence about pensions.<br />
3<br />
The concept of life satisfaction is measured by 14 items - QA1, QA3-1 to Q3A-9, QA3-12, QA10a, QA15<br />
and QA21. The graph below shows the results for each of the items.<br />
14<br />
1<br />
2<br />
1<br />
2<br />
3<br />
5<br />
6<br />
1<br />
1
<strong>Special</strong> EUROBAROMETER 273 “European Social Reality” Report<br />
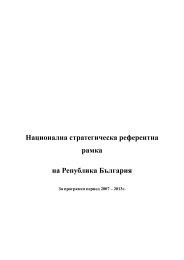
Levels of satisfaction with the quality of life and the standard of living are not the<br />
same throughout the European Union. In the Northern European countries the<br />
highest levels are found in the Benelux, Scandinavia, the United Kingdom and<br />
Ireland. It is least widespread in Bulgaria, where less than half of the citizens<br />
express satisfaction with these two important components of their life satisfaction 4 .<br />
LU<br />
DK<br />
SE<br />
NL<br />
UK<br />
IE<br />
BE<br />
FI<br />
MT<br />
IT<br />
DE<br />
AT<br />
CY<br />
ES<br />
EL<br />
SI<br />
EU25<br />
CZ<br />
PL<br />
FR<br />
PT<br />
SK<br />
EE<br />
HU<br />
LV<br />
LT<br />
RO<br />
BG<br />
Standard of living<br />
% satisfied by country<br />
31%<br />
53%<br />
59%<br />
64%<br />
63%<br />
70%<br />
68%<br />
76%<br />
76%<br />
75%<br />
85%<br />
85%<br />
84%<br />
84%<br />
84%<br />
84%<br />
83%<br />
83%<br />
82%<br />
90%<br />
88%<br />
87%<br />
95%<br />
95%<br />
94%<br />
94%<br />
93%<br />
92%<br />
- 8 -<br />
Quality of life<br />
% satisfied by country<br />
The Baltic States, Hungary and Slovakia also score below average, particularly in<br />
terms of satisfaction with the standard of living. We see that in Portugal and France,<br />
the level of satisfaction with the standard of living is the lowest among the former<br />
EU15 countries.<br />
4 QA3-2 and QA3-3. I am going to read out different aspects of everyday life. For each, could you tell me<br />
if this aspect of your life is very satisfactory, fairly satisfactory, not very satisfactory or not at all<br />
satisfactory? °The quality of life in the areas where you live; °Your standard of living.<br />
LU<br />
FI<br />
IE<br />
MT<br />
DK<br />
SE<br />
NL<br />
BE<br />
AT<br />
SI<br />
ES<br />
UK<br />
DE<br />
FR<br />
EU25<br />
IT<br />
CY<br />
CZ<br />
PT<br />
PL<br />
EE<br />
EL<br />
LT<br />
SK<br />
HU<br />
LV<br />
RO<br />
BG<br />
42%<br />
73%<br />
70%<br />
70%<br />
79%<br />
78%<br />
77%<br />
77%<br />
75%<br />
85%<br />
85%<br />
83%<br />
81%<br />
90%<br />
90%<br />
89%<br />
88%<br />
88%<br />
88%<br />
86%<br />
95%<br />
95%<br />
94%<br />
94%<br />
93%<br />
93%<br />
92%<br />
92%
<strong>Special</strong> EUROBAROMETER 273 “European Social Reality” Report<br />
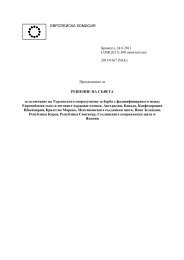
Large variations between the Member States also exist in the extent to which<br />
European Union citizens are confident about the future of their pensions 5 . However,<br />
the rank order of the countries is somewhat different from what we have seen<br />
above.<br />
DK<br />
FI<br />
NL<br />
AT<br />
IE<br />
SE<br />
BE<br />
ES<br />
UK<br />
CY<br />
IT<br />
EE<br />
LT<br />
MT<br />
LV<br />
EU25<br />
SK<br />
LU<br />
EL<br />
SI<br />
PT<br />
CZ<br />
FR<br />
PL<br />
HU<br />
DE<br />
RO<br />
BG<br />
Confidence about the future of one's pension<br />
% confident (EU25)<br />
74%<br />
67%<br />
66%<br />
61%<br />
56%<br />
53%<br />
53%<br />
51%<br />
50%<br />
50%<br />
46%<br />
45%<br />
43%<br />
42%<br />
42%<br />
42%<br />
41%<br />
41%<br />
38%<br />
35%<br />
34%<br />
34%<br />
32%<br />
31%<br />
29%<br />
25%<br />
25%<br />
47%<br />
Germany, Hungary, Poland and France are the countries where confidence in the<br />
future of pensions is particularly low. In Germany, only a quarter of the respondents<br />
express confidence.<br />
5 QA15. At the moment, when you think of the future of your pension, would you say that you are very<br />
confident, rather confident, rather not confident or not at all confident?<br />
- 9 -
<strong>Special</strong> EUROBAROMETER 273 “European Social Reality” Report<br />
In terms of people’s characteristics, confidence levels vary significantly depending on<br />
their occupational status and age. Variations are also noted but less extreme for<br />
education and gender.<br />
Retired respondents and those who are 55 and over are most confident (55% and<br />
55%, respectively, whereas unemployed people, manual workers and those aged 25<br />
to 39 most express a lack of confidence (66%, 63% and 62%, respectively) 6 .<br />
EU25<br />
Retired<br />
Managers<br />
Other white collars<br />
House persons<br />
Students<br />
Self-employed<br />
Manual workers<br />
Unemployed<br />
Aged 55+<br />
Aged 40-54<br />
Aged 15-24<br />
Aged 25-39<br />
Tea: 15-<br />
Tea: 20+<br />
Tea: 16-19<br />
Male<br />
Female<br />
Confidence in the future of one's pension<br />
(By SD's - EU25)<br />
% Not confident % Confident<br />
52<br />
39<br />
50<br />
57<br />
52<br />
46<br />
60<br />
63<br />
66<br />
40<br />
60<br />
50<br />
62<br />
47<br />
53<br />
58<br />
50<br />
54<br />
- 10 -<br />
42<br />
55<br />
47<br />
40<br />
39<br />
37<br />
36<br />
33<br />
27<br />
6<br />
In the first section of chapter 4, a question analysing solutions for guaranteeing the financing of the<br />
pension system is analysed.<br />
37<br />
35<br />
33<br />
54<br />
47<br />
43<br />
37<br />
44<br />
39
<strong>Special</strong> EUROBAROMETER 273 “European Social Reality” Report<br />
The perception of safety in the local area after dark also differs strongly from country<br />
to country 7 . Over 8 out of 10 respondents in the Netherlands (88%), Denmark<br />
(85%) and Sweden (83%) feel safe, compared to only 45% of people in Lithuania<br />
and 46% of people in Bulgaria.<br />
NL<br />
DK<br />
SE<br />
FR<br />
LU<br />
BE<br />
AT<br />
DE<br />
MT<br />
CY<br />
PT<br />
EU25<br />
HU<br />
IE<br />
ES<br />
UK<br />
PL<br />
EE<br />
IT<br />
LV<br />
CZ<br />
SK<br />
EL<br />
LT<br />
RO<br />
BG<br />
Feeling safe walking alone in one's area after dark<br />
% feeling safe (EU25)<br />
45%<br />
88%<br />
85%<br />
83%<br />
79%<br />
76%<br />
76%<br />
74%<br />
73%<br />
72%<br />
72%<br />
71%<br />
70%<br />
69%<br />
68%<br />
68%<br />
65%<br />
65%<br />
65%<br />
64%<br />
63%<br />
62%<br />
60%<br />
59%<br />
69%<br />
46%<br />
7 QA21. How safe do you feel walking alone in the area where you live after dark? Do you feel very safe,<br />
fairly safe, a bit unsafe or very unsafe?<br />
- 11 -
<strong>Special</strong> EUROBAROMETER 273 “European Social Reality” Report<br />
In order to provide an overview of the extent of life satisfaction in the Member<br />
States, a scale was constructed with 11 items from the life satisfaction factor that<br />
relate to the living environment 8 . The scale runs from 1 to 5 and the closer the figure<br />
is to 5 the better the living environment is perceived to be. The mean score for the<br />
European Union as a whole is 3.78, meaning that on average European Union<br />
citizens tend to be relatively satisfied with their living environment. The table below<br />
shows the mean score for each Member State.<br />
Living environment scale Mean<br />
EU25 3.78<br />
NL 4.18<br />
DK 4.13<br />
LU 4.08<br />
BE 4.05<br />
IE 4.02<br />
AT 3.98<br />
UK 3.98<br />
SE 3.91<br />
FI 3.89<br />
MT 3.84<br />
DE 3.82<br />
ES 3.80<br />
FR 3.75<br />
SL 3.73<br />
CZ 3.68<br />
CY 3.63<br />
IT 3.62<br />
EL 3.57<br />
PL 3.53<br />
EE 3.52<br />
HU 3.49<br />
PT 3.47<br />
SK 3.40<br />
LT 3.35<br />
LV 3.33<br />
RO 3.30<br />
BG 2.89<br />
8<br />
The scale consists of 11 of 14 of the life satisfaction items that measure the living environment (items<br />
QA3-1 to QA3_9 and QA3-12). The happiness item (QA1) is also included.<br />
- 12 -
<strong>Special</strong> EUROBAROMETER 273 “European Social Reality” Report<br />
Overall then, people in the Netherlands, Denmark, Luxembourg, Belgium and Ireland<br />
best rate their living environment, while people in Bulgaria are by far the least<br />
satisfied.<br />
Looking at the extent to which socio-demographic factors influence how people rate<br />
their living environment shows that unemployed have the lowest mean score on the<br />
living environment scale while managers and students have the highest mean score.<br />
However, the differences in mean scores between the various socio-demographic<br />
groups are far smaller than the differences found between the Member States 9 .<br />
9 The mean scores are for the EU25 total.<br />
Living environment scale scores for SD's Mean<br />
Occupation<br />
Managers 3.90<br />
House person 3.80<br />
Self-employed 3.79<br />
Other white collar employees 3.79<br />
Retired 3.76<br />
Manual workers 3.74<br />
Unemployed 3.53<br />
Education<br />
Still Studying 3.88<br />
20+ 3.86<br />
16-19 3.76<br />
15- 3.69<br />
Age<br />
15-24 3.81<br />
55+ 3.81<br />
25-39 3.77<br />
40-54 3.72<br />
Gender<br />
Male 3.79<br />
Female 3.76<br />
Marital status<br />
R has partner 3.80<br />
R is divorced 3.70<br />
R is widowed 3.69<br />
- 13 -
<strong>Special</strong> EUROBAROMETER 273 “European Social Reality” Report<br />
1.3 What do European consider important<br />
The survey reveals an interesting set of realities in terms of what Europeans consider<br />
important in their life 10 . Apart from the obvious, namely health, family and friends<br />
are considered important by nearly everyone, leisure time is ranked above work and<br />
religion is ranked above politics.<br />
Health<br />
Your Family<br />
Friends and<br />
acquaintances<br />
Leisure time<br />
Work<br />
Helping others or<br />
voluntary work<br />
Religion<br />
Politics<br />
What do Europeans consider important in their life?<br />
EU25 (%) (Don't know not represented)<br />
57<br />
47<br />
1<br />
3<br />
5<br />
10<br />
14<br />
19<br />
- 14 -<br />
Not important Important<br />
The pattern at the country level is relatively similar with health, family and friends<br />
and acquaintances named as the three most important aspects of life in most<br />
countries. When it comes to the other aspects of life, larger country variations are<br />
noted. Work is considered important by considerably fewer people than average in<br />
the United Kingdom (66%) and Ireland (69%) whereas in France, Slovenia,<br />
Luxembourg and Italy around 9 out of 10 respondents find it important. The<br />
importance of religion varies extensively: in Malta (88%), Poland (87%) and Cyprus<br />
(86%) nearly 9 out of 10 respondents consider it important in their life whereas in<br />
the Czech Republic (28%), Estonia (29%) and Sweden (30%) this is true for just<br />
about 3 out of 10 respondents. Overall, Leisure time is even more widely seen as<br />
being important than work (90%) is. Politics is particularly widely seen as important<br />
in the Netherlands (68%) with Sweden (56%), Denmark and Germany (both 53%)<br />
being the only other Member States where more than half of the respondents share<br />
this view. France and Luxembourg are the other two countries where politics is seen<br />
as being important by significantly more people than religion is. The two newest<br />
Member States further stand out in being far less inclined to consider politics<br />
important (21%). Religion is most widely seen as being important in Malta (88%),<br />
Poland (87%) and Cyprus (86%). This contrasts starkly with views in the Czech<br />
Republic (28%), Denmark and Sweden (both 30%). The feeling that helping others<br />
or doing voluntary work is important is somewhat less broad in Latvia (65%),<br />
Ireland, Romania (both 63%) and Bulgaria (62%).<br />
10 QA2. Please say for each of the following how important it is in your life?<br />
43<br />
52<br />
84<br />
79<br />
99<br />
97<br />
95<br />
90
<strong>Special</strong> EUROBAROMETER 273 “European Social Reality” Report<br />
QA2 - Please say for each of the following how important it is in your life?<br />
Work Family Friends<br />
Leisure<br />
time<br />
- 15 -<br />
Politics Religion<br />
Helping<br />
others<br />
or<br />
voluntary<br />
work<br />
Health<br />
EU25 84% 97% 95% 90% 43% 52% 79% 99%<br />
BE 84% 96% 93% 88% 42% 41% 80% 98%<br />
CZ 84% 99% 96% 90% 26% 28% 82% 100%<br />
DK 80% 98% 97% 91% 53% 30% 74% 95%<br />
DE 85% 97% 95% 89% 53% 48% 76% 99%<br />
EE 84% 96% 92% 89% 31% 29% 79% 98%<br />
EL 79% 100% 94% 91% 36% 82% 86% 100%<br />
ES 87% 99% 96% 93% 26% 34% 74% 100%<br />
FR 92% 98% 95% 86% 48% 38% 82% 99%<br />
IE 69% 99% 98% 88% 32% 61% 63% 99%<br />
IT 90% 97% 95% 92% 50% 78% 88% 99%<br />
CY 88% 100% 96% 94% 28% 86% 89% 100%<br />
LV 88% 97% 88% 86% 28% 37% 65% 97%<br />
LT 85% 97% 87% 82% 31% 56% 82% 98%<br />
LU 91% 99% 93% 90% 47% 42% 85% 99%<br />
HU 83% 98% 96% 88% 30% 43% 79% 99%<br />
MT 88% 100% 82% 90% 28% 88% 86% 99%<br />
NL 81% 89% 96% 95% 68% 40% 85% 99%<br />
AT 76% 94% 94% 87% 38% 44% 69% 98%<br />
PL 82% 98% 94% 90% 36% 87% 79% 99%<br />
PT 85% 99% 91% 88% 26% 57% 81% 99%<br />
SI 92% 99% 99% 95% 27% 51% 88% 100%<br />
SK 86% 100% 93% 89% 25% 56% 79% 99%<br />
FI 87% 97% 98% 95% 27% 47% 76% 100%<br />
SE 88% 97% 97% 94% 56% 30% 83% 99%<br />
UK 66% 97% 95% 91% 43% 45% 74% 98%<br />
BG 74% 98% 90% 70% 21% 42% 62% 97%<br />
RO 87% 99% 83% 75% 21% 82% 63% 97%
<strong>Special</strong> EUROBAROMETER 273 “European Social Reality” Report<br />
1.4 Family life<br />
In this section we examine family life in the European Union in more detail. Firstly<br />
some contextual demographic information 11 about our respondents:<br />
The majority of the respondents live with a partner: 6 out of 10 respondents<br />
are either married (50%), remarried (1%) or living with a partner (9%).<br />
Most adult respondents have (had) children (68%) 12 .<br />
The majority of those who have not had any children would like to have (had)<br />
them (73%) 13 .<br />
Only 22% of respondents live alone in a single person household.<br />
1.4.1 The family as a support network<br />
The importance of the family is clearly evident from the results of the question that<br />
measures to whom people turn when they need help. Overall, the most likely person<br />
to provide support when needed is one’s partner 14 , and if there is no partner it is<br />
another family member who provides the support 15 . Friends, work colleagues,<br />
neighbours or other people are much less frequently called upon for help.<br />
From whom do you<br />
get support in each<br />
of the following<br />
situations?<br />
If you needed help around the<br />
house when ill<br />
If you needed advice about a<br />
serious personal or family<br />
member<br />
No partner Partner Total No partner Partner Total No partner Partner Total No partner Partner Total<br />
Your partner 6% 70% 45% 6% 60% 38% 8% 57% 37% 3% 22% 14%<br />
Family member 69% 25% 43% 58% 28% 40% 41% 21% 29% 64% 49% 55%<br />
Work colleague 1% 1% 1% 1% 1% 1% 2% 2% 2% 1% 1% 1%<br />
Friend 11% 1% 5% 25% 7% 14% 37% 15% 24% 9% 4% 6%<br />
Neighbour 4% 1% 2% 2% 0% 1% 3% 1% 2% 1% 0% 1%<br />
Someone else 4% 1% 2% 3% 2% 3% 3% 2% 2% 7% 10% 9%<br />
Nobody 4% 1% 2% 3% 1% 2% 5% 3% 3% 12% 9% 10%<br />
DK 1% 0% 1% 1% 1% 1% 1% 1% 1% 4% 4% 4%<br />
- 16 -<br />
If you were feeling a bit<br />
depressed and wanting<br />
someone to talk to<br />
If you needed to urgently raise<br />
an important sum of money to<br />
face an emergency<br />
The behaviour of men and women clearly differs when they seek support. Men are<br />
far more likely to turn to their partner except when the issue involves money<br />
whereas women are far more likely to turn to another family member. When women<br />
feel a bit depressed they are more likely than men are to turn to a friend.<br />
11<br />
The figures for the socio-demographic analysis are based on the EU25 data.<br />
12<br />
QA7a. Have you had any children? (IF YES) How many?<br />
13<br />
QA8b. Would you like/have liked to have had children?<br />
14<br />
A respondent has a partner if he or she is married, remarried or unmarried but currently living with a<br />
partner.<br />
15<br />
QA4. From whom would you get support in each of the following situations? For each situation, choose<br />
the most important person.
<strong>Special</strong> EUROBAROMETER 273 “European Social Reality” Report<br />
From whom do you<br />
get support in each<br />
of the following<br />
situations?<br />
If you needed help around the<br />
house when ill<br />
If you needed advice about a<br />
serious personal or family<br />
member<br />
Male Female Total Male Female Total Male Female Total Male Female Total<br />
Your partner 50% 39% 45% 43% 34% 38% 44% 30% 37% 12% 17% 14%<br />
Family member 38% 47% 43% 35% 44% 40% 24% 33% 29% 54% 56% 55%<br />
Work colleague 1% 1% 1% 2% 1% 1% 2% 2% 2% 2% 1% 1%<br />
Friend 5% 5% 5% 14% 14% 14% 22% 26% 24% 7% 5% 6%<br />
Neighbour 1% 2% 2% 1% 1% 1% 1% 2% 2% 0% 0% 1%<br />
Someone else 2% 3% 2% 2% 3% 3% 2% 3% 2% 10% 7% 9%<br />
Nobody 2% 2% 2% 2% 2% 2% 4% 3% 3% 11% 10% 10%<br />
DK 1% 1% 1% 1% 1% 1% 1% 1% 1% 4% 4% 4%<br />
- 17 -<br />
If you were feeling a bit<br />
depressed and wanting<br />
someone to talk to<br />
If you needed to urgently raise<br />
an important sum of money to<br />
face an emergency<br />
The patterns observed for the European Union as a whole deviate slightly at the<br />
country level. The most notable differences are:<br />
In Germany and the Scandinavian countries, people are most inclined to turn<br />
to their partner and less so to ask another family member for help when they<br />
need help around the house when ill.<br />
In the Baltic States, people are somewhat less inclined to turn to their partner<br />
and more frequently turn to another family member when they need support<br />
concerning personal or family matters.<br />
Compared to people in other Member States, people in Cyprus, Austria and<br />
Ireland more frequently turn to their partner when they need to raise a large<br />
sum of money.<br />
People in Slovakia and the Mediterranean countries are far more likely to turn<br />
to another family member when they need to raise a large sum of money<br />
than people in the other Member States are.<br />
1.4.2 The division of labour<br />
A <strong>social</strong> reality about family life in the European Union at the end of 2006 is that on<br />
average, the woman is still the person mainly responsible for doing the domestic<br />
chores in the household. Over 8 out of 10 female respondents with a partner<br />
indicate that they are the person mainly responsible for doing the ironing (85%), the<br />
cooking (82%) and the cleaning (81%) 16 . The responses of the male respondents<br />
confirm this finding, although they are somewhat more likely than their female<br />
counterparts to say that the domestic chores are done together in their household.<br />
In the household<br />
who is mainly<br />
responsible for…<br />
Cleaning the house \<br />
appartment<br />
Cooking<br />
Doing the ironing<br />
Male Female Total Male Female Total Male Female Total<br />
You 9% 81% 45% 13% 82% 48% 8% 85% 47%<br />
Your partner 66% 4% 36% 67% 6% 36% 78% 4% 41%<br />
Someone else 7% 4% 6% 4% 3% 3% 7% 5% 6%<br />
Together/both (SP) 18% 11% 14% 16% 9% 13% 6% 5% 5%<br />
DK 0% 0% 0% 0% 0% 0% 1% 1% 1%<br />
16<br />
(IF “MARRIED”, REMARRIED” or “LIVING WITH PARTNER in QD7) QA6. Could you indicate who in your<br />
household is mainly responsible for…?
<strong>Special</strong> EUROBAROMETER 273 “European Social Reality” Report<br />
This <strong>social</strong> reality that household chores are still primarily carried out by women is<br />
found to exist in all Member States, although in Sweden, Denmark and Finland the<br />
division of labour appears to be slightly more in balance. In Sweden, Denmark and<br />
Finland, the female respondents least frequently indicate that they are responsible<br />
for the household chores. In fact, in these countries respondents – male and female<br />
alike – most frequently indicate that they both are responsible for cleaning the<br />
house, cooking and doing the ironing.<br />
Respondent is responsible for….<br />
Cleaning the house Cooking Doing the ironing<br />
Male Female<br />
Total<br />
Answers<br />
“You”<br />
Male Female<br />
- 18 -<br />
Total<br />
Answers<br />
“You”<br />
Male Female<br />
Total<br />
Answers<br />
“You”<br />
EL 3% 91% 48% 3% 93% 49% 1% 95% 49%<br />
LT 14% 90% 51% 14% 88% 50% 13% 89% 49%<br />
DE 11% 87% 50% 18% 87% 54% 10% 90% 52%<br />
SK 10% 87% 49% 8% 89% 49% 5% 94% 50%<br />
MT 8% 87% 48% 10% 88% 50% 11% 92% 52%<br />
CZ 6% 86% 47% 6% 89% 48% 2% 93% 48%<br />
CY 10% 86% 46% 9% 90% 48% 9% 88% 47%<br />
HU 7% 85% 44% 8% 86% 45% 7% 89% 46%<br />
IT 11% 85% 47% 12% 87% 48% 6% 85% 44%<br />
UK 11% 83% 45% 18% 77% 46% 10% 79% 43%<br />
PT 6% 81% 44% 8% 85% 47% 8% 88% 48%<br />
EE 10% 81% 47% 10% 81% 47% 4% 88% 48%<br />
IE 11% 80% 46% 13% 81% 47% 6% 85% 46%<br />
PL 9% 80% 44% 11% 81% 46% 9% 85% 46%<br />
LV 11% 79% 44% 11% 78% 44% 8% 85% 46%<br />
FR 11% 77% 44% 17% 77% 47% 9% 87% 48%<br />
BE 9% 77% 42% 16% 83% 48% 8% 87% 46%<br />
ES 3% 77% 41% 5% 81% 45% 7% 87% 49%<br />
AT 5% 76% 39% 5% 84% 43% 3% 89% 44%<br />
NL 6% 76% 40% 14% 72% 42% 10% 79% 43%<br />
LU 17% 72% 44% 25% 82% 53% 10% 81% 45%<br />
SL 7% 71% 39% 9% 77% 44% 7% 87% 48%<br />
FI 14% 70% 41% 16% 68% 41% 12% 79% 44%<br />
DK 13% 69% 39% 21% 69% 44% 14% 69% 40%<br />
SE 19% 62% 40% 21% 66% 43% 12% 71% 41%<br />
BG 8% 83% 45% 7% 85% 45% 7% 88% 47%<br />
RO 5% 79% 41% 4% 85% 44% 3% 90% 46%
<strong>Special</strong> EUROBAROMETER 273 “European Social Reality” Report<br />
1.4.3 Satisfaction with the facilities for children in the local area<br />
Next we briefly look at the extent to which European Union citizens are satisfied with<br />
the schools and childcare facilities in their local area 17 . Overall, the judgement of<br />
European Union citizens is fairly positive.<br />
Looking at the views of respondents with young children provides a more correct and<br />
detailed picture 18 . It shows that while there is widespread satisfaction with the<br />
schools in the local area, people are much more critical when it comes to childcare<br />
facilities in the local area.<br />
Schools (EU25)<br />
Schools (respondents<br />
with children under 15)<br />
Childcare facilities<br />
(EU25)<br />
Childcare facilities<br />
(respondents with<br />
children under 10)<br />
Satisfaction with local facilities for children<br />
(in %)<br />
Not satisfactory Satisfactory DK<br />
27<br />
14<br />
17<br />
21<br />
17 QA3-10 and QA3-11. I am going to read out different aspects of everyday life. For each, could you tell<br />
me if this aspect of your life is very satisfactory, fairly satisfactory, not very satisfactory or not at all<br />
satisfactory? °The childcare facilities in your local area; °The schools in your local area.<br />
18 The sample contains 20% of respondents with children under the age of 10 and 14% of respondents<br />
with children under the age of 15. Adding both age groups, then 28% of the sample has children under<br />
the age of 15.<br />
- 19 -<br />
55<br />
71<br />
67<br />
79<br />
24<br />
15<br />
3<br />
6
<strong>Special</strong> EUROBAROMETER 273 “European Social Reality” Report<br />
Throughout the European Union, more citizens give a satisfactory judgement about<br />
schools than about childcare facilities in the local area. The level of satisfaction with<br />
childcare facilities is low in some countries, notably Malta (28%), the United Kingdom<br />
(30%) and Romania (35%).<br />
Facilities for children in the local area<br />
% saying the facilities are satisfactory, by country<br />
CY<br />
SI<br />
CZ<br />
AT<br />
DK<br />
BE<br />
FI<br />
FR<br />
LU<br />
SK<br />
HU<br />
DE<br />
EE<br />
ES<br />
PT<br />
IT<br />
PL<br />
EU25<br />
EL<br />
LV<br />
LT<br />
SE<br />
IE<br />
NL<br />
UK<br />
MT<br />
BG<br />
RO<br />
Childcare facilities<br />
30%<br />
28%<br />
35%<br />
43%<br />
42%<br />
42%<br />
47%<br />
46%<br />
46%<br />
53%<br />
58%<br />
56%<br />
56%<br />
55%<br />
55%<br />
62%<br />
62%<br />
61%<br />
61%<br />
59%<br />
66%<br />
65%<br />
65%<br />
63%<br />
72%<br />
72%<br />
71%<br />
78%<br />
- 20 -<br />
CY<br />
BE<br />
SI<br />
FI<br />
PL<br />
IE<br />
FR<br />
CZ<br />
AT<br />
HU<br />
LU<br />
SK<br />
PT<br />
EL<br />
ES<br />
EU25<br />
IT<br />
EE<br />
DK<br />
LV<br />
NL<br />
MT<br />
DE<br />
UK<br />
LT<br />
SE<br />
RO<br />
BG<br />
Schools<br />
51%<br />
57%<br />
62%<br />
62%<br />
62%<br />
69%<br />
68%<br />
67%<br />
66%<br />
66%<br />
73%<br />
73%<br />
72%<br />
71%<br />
71%<br />
70%<br />
70%<br />
77%<br />
76%<br />
74%<br />
74%<br />
78%<br />
78%<br />
78%<br />
78%<br />
82%<br />
90%<br />
88%
<strong>Special</strong> EUROBAROMETER 273 “European Social Reality” Report<br />
1.5 Work<br />
In this section we examine the <strong>social</strong> realities of work in more detail. Firstly some<br />
contextual demographic information 19 about the surveyed population:<br />
Half of the respondents claim to be in work. The working half of the sample<br />
consists of manual workers (42%), other employees (24%) managers (18%)<br />
and self-employed people (15%).<br />
A quarter of the interviewees is retired (25%), one in ten looks after the<br />
home (10%) the same proportion is a student (10%) and 6% is unemployed.<br />
1.5.1 Job satisfaction<br />
We firstly look at how satisfied European Union citizens are with their job 20 . Overall,<br />
European Union workers are happy with the people they work with (80%) and over<br />
three in four of them find that their job allows them to use their knowledge and skills<br />
(77%). There is also widespread agreement that people are required to keep<br />
learning new things in their job (71%). Furthermore, around two in three workers do<br />
not find their job dull or boring (68%) and are of the view that their job allows them<br />
to take part in making decisions that affect their work (65%). When it comes to pay<br />
and prospects for career advancement, European Union citizens are less satisfied.<br />
How much do you agree or disagree with the following statements<br />
describing positive and negative aspects of your job? EU25 (%)<br />
I work with people I like<br />
My job allows me to use my knowledge and<br />
skills<br />
My job requires me to keep learning new things<br />
My work is dull and boring*<br />
My job allows me to take part in making<br />
decisions that affect my work<br />
I am well paid<br />
My job offers good prospects for career<br />
advancement<br />
*% positive answers = people who disagree that their work is dull and boring<br />
% negative % positive Neither/DK<br />
19 The figures for the demographic analysis are based on the EU25 data.<br />
20 The concept of job satisfaction is measured by 7 items that are all part of QA9 “How much do you<br />
agree or disagree with the following statements describing positive and negative aspects of your job?”<br />
The item “my work is dull and boring” is asked in the opposite direction from the other items meaning that<br />
people who disagree tend to be more satisfied with their job and vice-versa.<br />
- 21 -<br />
37<br />
20<br />
31<br />
5<br />
11<br />
14<br />
15<br />
43<br />
40<br />
80<br />
77<br />
71<br />
68<br />
65<br />
15<br />
12<br />
15<br />
17<br />
15<br />
26<br />
23
<strong>Special</strong> EUROBAROMETER 273 “European Social Reality” Report<br />
Overall, the level of job satisfaction is<br />
relatively high in the European Union. In fact,<br />
on a scale of 1 to 5 the mean job satisfaction scale<br />
score is 3.6 21 . However, the average job<br />
satisfaction level varies significantly from country<br />
to country. Workers in Northern Europe tend to be<br />
most satisfied with their job, whereas people in the<br />
new Member States, particularly people in<br />
Romania and Bulgaria, are least satisfied with their<br />
job. Malta is somewhat of an exception, as its<br />
score is more similar to that of many Western<br />
European countries. Conversely, it should be noted<br />
that job satisfaction levels in the Mediterranean<br />
countries are similar to those found in Eastern<br />
Europe.<br />
Job satisfaction scale scores<br />
by Socio-demographics<br />
Mean<br />
Occupation<br />
Managers 4.00<br />
Self-employed 3.88<br />
Other white collars 3.60<br />
Manual workers 3.42<br />
Education<br />
20+ 3.77<br />
16-19 3.57<br />
15- 3.42<br />
Gender<br />
Male 3.71<br />
Female 3.54<br />
21 The higher the score, the higher the job satisfaction<br />
level is.<br />
- 22 -<br />
Job satisfaction<br />
scale – country<br />
scores<br />
Mean<br />
LU 3.93<br />
SE 3.91<br />
NL 3.90<br />
DK 3.89<br />
DE 3.83<br />
UK 3.79<br />
AT 3.77<br />
FI 3.76<br />
MT 3.74<br />
BE 3.73<br />
IE 3.64<br />
FR 3.59<br />
EE 3.58<br />
CY 3.57<br />
LV 3.56<br />
SL 3.54<br />
IT 3.53<br />
EL 3.51<br />
ES 3.47<br />
PT 3.45<br />
PL 3.41<br />
CZ 3.36<br />
LT 3.35<br />
HU 3.33<br />
SK 3.32<br />
BG 3.30<br />
RO 3.25<br />
Occupation, education and<br />
gender also have an effect on<br />
people’s satisfaction with their<br />
job. Managers express the<br />
highest level of job satisfaction,<br />
while manual workers and<br />
people who left full-time<br />
education aged 15 or younger<br />
are least satisfied with their<br />
job 22 .<br />
22<br />
The mean scores are for the<br />
EU25 total.
<strong>Special</strong> EUROBAROMETER 273 “European Social Reality” Report<br />
1.5.2 Learning new things at work<br />
One aspect of job satisfaction is the extent to which people feel they are required to<br />
keep learning new things in their job. Overall, 71% of European Union workers indicate<br />
that their job requires them to do so 23 .<br />
Managers<br />
Self-employed<br />
Other white collars<br />
Manual workers<br />
TEA: 20+<br />
TEA:16-19<br />
TEA: 15-<br />
My job requires me to keep learning new things<br />
% Agree (EU25)<br />
Male<br />
Female<br />
- 23 -<br />
57%<br />
61%<br />
67%<br />
71%<br />
68%<br />
74%<br />
73%<br />
84%<br />
90%<br />
Continuous learning is extremely common among managers and workers that stayed<br />
in full-time education until the age of 20 or older. It appears to be a reality or at least<br />
an opportunity in most European countries. Particularly in the Nordic countries, people<br />
are widely satisfied with this aspect of their job. However, also in Malta (80%) and<br />
Latvia (76%), widespread satisfaction is noted in this regard. Learning new things<br />
seems a more distant reality in Hungary and Bulgaria, where only just over 4 out of 10<br />
workers agree that their job requires them to keep learning new things.<br />
23<br />
QA9-6. “How much do you agree or disagree with the following statements describing positive and<br />
negative aspects of your job?”
<strong>Special</strong> EUROBAROMETER 273 “European Social Reality” Report<br />
- 24 -
<strong>Special</strong> EUROBAROMETER 273 “European Social Reality” Report<br />
1.5.3 Work stress<br />
For a significant minority of European Union workers, their job has a bad side: 41% of<br />
the respondents find their job too demanding and stressful, 21% work in dangerous or<br />
unhealthy conditions and 14% do not find that their job allows them to balance their<br />
professional, family and private life 24 .<br />
How much do agree or disagree with the following statements<br />
describing positive and negative aspects of your job? EU25 (%)<br />
My work is too demanding and stressful<br />
I work in dangerous and unhealthy<br />
conditions<br />
My job allows me to balance my<br />
professional, family and private life<br />
% negative* % positive* Neither/DK<br />
*% positive answers = people who disagree that their work is too demanding and stressful and that they work in dangerous<br />
and unhealthy conditions.<br />
Work stress is a problem that managers (45%) and self-employed people (44%) tend<br />
to face slightly more often than other workers, whereas manual workers are<br />
considerably more likely to work in dangerous and unhealthy conditions (29%). The<br />
ability to balance one’s professional, family and private life is most often positively<br />
rated by the self-employed and by workers aged 55 or older (both 74%). Women tend<br />
to be slightly happier in this regard than men are (71% vs. 67%). People who left fulltime<br />
education at the age of 15 or younger more often negatively rate their work<br />
environment than people who stayed in school longer.<br />
At the country level, the feeling that one’s work is too demanding and stressful is most<br />
widely expressed in Lithuania (71%), Greece and Romania (both 70%). It is least<br />
widely perceived in the Netherlands (24%) and Finland (25%). In Sweden,<br />
remarkably, the workforce quite widely expresses job stress (54%), much more widely<br />
so than workers in the other Scandinavian countries do (35% in Denmark).<br />
24 The concept of work stress is measured by 3 items that are part of QA9 “How much do you agree or<br />
disagree with the following statements describing positive and negative aspects of your job?” The item “my<br />
job allows me to balance my professional, family and private” is asked in the opposite direction from the<br />
other two items meaning that people who disagree tend to feel more work-stress and vice-versa.<br />
- 25 -<br />
41<br />
21<br />
14<br />
34<br />
66<br />
69<br />
25<br />
13<br />
17
<strong>Special</strong> EUROBAROMETER 273 “European Social Reality” Report<br />
- 26 -
<strong>Special</strong> EUROBAROMETER 273 “European Social Reality” Report<br />
1.5.4 Staying in work<br />
Overall, the majority of the European Union workforce is confident that they are able<br />
to keep their job in the coming months 25 . Nearly all workers in Denmark (94%),<br />
Ireland, Luxembourg, Sweden (all 92%) and Belgium (91%) express confidence. At<br />
63%, confidence levels are lowest in Slovakia which has one of the highest<br />
unemployment rates in the European Union 26 .<br />
25<br />
Q10A. How confident would you say you are in your ability to keep your job in the coming months? Are<br />
you…?<br />
26<br />
The Eurostat unemployment figure for November 2006 is 12.3% in Slovakia, the highest after Poland<br />
(13.6%). See Euro-indicators News Release 4 /2007 at www.europa.eu/eurostat.<br />
- 27 -
<strong>Special</strong> EUROBAROMETER 273 “European Social Reality” Report<br />
Looking at people’s characteristics shows that confidence levels vary somewhat<br />
depending on their occupation (92% of managers are confident, compared to 82% of<br />
manual workers), and their education (89% of people who left full-time education aged<br />
20 or older feel confident compared to 82% who left school before the age of 16). At<br />
the personal level, we find that confidence levels are generally far broader among<br />
people who are generally happy than they are among those who do not feel happy with<br />
their life (87% vs. 69%). There are equally large differences between those feeling<br />
that their life has improved over the past five years and those who feel their life has<br />
gotten worse (92% vs. 71%).<br />
Factors to do with the economic climate and with globalisation only partially explain<br />
why people are worried about their ability to keep their job 27 . For nearly a quarter of<br />
the worried respondents their concerns are based on no particular reason (23%).<br />
Interestingly, most of the worried respondents spontaneously cited another reason<br />
why they were not confident about their ability to keep their job in the coming<br />
months 28 .<br />
QA10b Why are you not confident about your ability to keep<br />
your job in the coming months?<br />
(in %, EU25)<br />
Your company/this location is closing down<br />
Your company/this location is merging with<br />
another company<br />
The work you do will be automated<br />
Your company/this location is relocating<br />
abroad<br />
Other reason<br />
No reason<br />
Don't know<br />
27 The answer codes in question are: your company/this location is closing down (12%), your company/this<br />
locations is merging with another company (11%) and your company/this location is relocating abroad (3%).<br />
28 The most frequent ‘other reasons’ given by 37% of the respondents (n= 1469) are that they work in<br />
temporary jobs, do seasonal work or apprenticeships, that the company will reorganise and that they will<br />
become redundant. Personal reasons relating to health, family problems and age were also commonly cited.<br />
There were also respondents who cited a general sense of insecurity about their job as a reason.<br />
- 28 -<br />
3%<br />
6%<br />
8%<br />
12%<br />
11%<br />
23%<br />
37%
<strong>Special</strong> EUROBAROMETER 273 “European Social Reality” Report<br />
1.5.5 Career progression<br />
We saw earlier that 4 out of 10 European workers find that their job offers good<br />
prospects for career advancement. But in order to progress in their career do workers<br />
find that their education and training to date sufficient or do they feel they should<br />
follow more training 29 ?<br />
Close to half of the respondents currently working is of the view that in order to further<br />
progress in their careers they do not need further education or training (48%).<br />
However, nearly as many European workers feel that they need further specialised<br />
training: 21% intend on doing this but 25% can not currently follow a more specialised<br />
training.<br />
Views between those who find their job offers good prospects for career advancement<br />
and those who disagree only differ in what they intend to do: Those with good career<br />
prospects are more likely to intend to follow a more specialised training (26% vs.<br />
17%) whereas those who don’t feel their job offers good career prospects are more<br />
inclined to feel that even though they should follow a specialised training they<br />
currently cannot do so (28% vs. 22%).<br />
Concerning yourself, do you think that in order to<br />
progress in your career …?<br />
My job offers good prospects for career<br />
advancement EU25 average<br />
Disagree Agree<br />
Your education and training to date is sufficient 48% 48% 48%<br />
You should follow a more specialised training but you<br />
cannot currently do this<br />
You should follow a more specialised training and you<br />
intend doing this<br />
- 29 -<br />
28% 22% 25%<br />
17% 26% 21%<br />
DK 7% 4% 6%<br />
29<br />
(ASKED IF CURRENTLY IN WORK) Q16A. Concerning yourself, do you think that in order for you to<br />
advance in your career…?
<strong>Special</strong> EUROBAROMETER 273 “European Social Reality” Report<br />
1.5.6 Finding a new job<br />
If people were to be laid-off, their confidence to find a similar job is quite high. Yet,<br />
while 33% consider it very likely (points 8-10 on the scale), 24% consider it not very<br />
likely (1-3) that they would find a job requiring the same skills and experience in the<br />
next six months if they were to be laid-off 30 .<br />
The level of confidence varies greatly from country to country. In Denmark, nearly half<br />
of the respondents indicate that it is very likely – point 10 on the scale- that they<br />
would find a job requiring the same skills and experience in the next six months<br />
(47%). Conversely in Germany close to a quarter considers it extremely unlikely –<br />
point 1 on the scale – that they would be able to do this (22%).<br />
30 Readers should note that this question is only asked of people that are currently in work.<br />
- 30 -
<strong>Special</strong> EUROBAROMETER 273 “European Social Reality” Report<br />
DK<br />
IE<br />
LV<br />
EE<br />
SE<br />
FI<br />
UK<br />
LT<br />
NL<br />
BE<br />
SI<br />
ES<br />
CZ<br />
CY<br />
SK<br />
MT<br />
FR<br />
EU25<br />
LU<br />
AT<br />
PL<br />
IT<br />
PT<br />
EL<br />
HU<br />
DE<br />
RO<br />
BG<br />
Likelihood of finding a job requiring the same skills<br />
and experience: average country scale scores<br />
- 31 -<br />
5,0<br />
4,8<br />
5,4<br />
5,4<br />
5,3<br />
5,3<br />
5,4<br />
5,6<br />
5,9<br />
5,9<br />
5,9<br />
5,9<br />
5,8<br />
6,4<br />
6,2<br />
Two very contrasting situations emerge in Germany and Slovakia when the results for<br />
this question are compared with the extent to which citizens in these two Member<br />
States feel confident that they will keep their job.<br />
In Germany, workers are the least optimistic about their chances of finding a new job<br />
whilst there is widespread confidence among the labour force that they will stay in<br />
their job (86%).<br />
Conversely, while Slovakians are least confident that they will keep their job (63%)<br />
they are not nearly as pessimistic as their German counterparts about their chances of<br />
finding a new job.<br />
Clearly, a person’s perceived chance of finding a new job should he or she be laid-off<br />
varies depending on his or her socio-demographic demographics. The most telling<br />
factor is age, highlighting unfortunately, that age discrimination remains a <strong>social</strong><br />
reality for the European labour force.<br />
6,2<br />
6,4<br />
6,3<br />
6,8<br />
6,7<br />
6,6<br />
6,5<br />
6,9<br />
6,9<br />
7,5<br />
7,4<br />
7,3<br />
7,7
<strong>Special</strong> EUROBAROMETER 273 “European Social Reality” Report<br />
Likelihood of finding a job requiring the same skills<br />
and experience: average EU25 scale scores by SD's<br />
Age: 15-24<br />
Age: 25-39<br />
Age: 40-54<br />
Age: 55+<br />
Lives in large town<br />
Lives in small/mid-sized town<br />
Lives in rural village<br />
Managers<br />
Self-employed<br />
Manual workers<br />
Other white collars<br />
TEA: 20+<br />
TEA:16-19<br />
TEA: 15-<br />
What do people who are not working think they need to do in order to find a job<br />
soon 31 ? Views among this group of respondents about what they should do to find a<br />
job differ significantly depending on whether they are students, unemployed or looking<br />
after the home.<br />
Nearly half of the respondents who are looking after the home are not looking for a job<br />
(47%). Quite logically, the students are most likely to intend on following a more<br />
specialised training (42%). Unemployed respondents are more divided in their views:<br />
32% feel their education and training to date is sufficient and 33% feel they should<br />
follow a more specialised training but currently cannot do this. Only 20% intend to<br />
actually follow a course in order to find a job soon.<br />
Concerning yourself, do you think that in order to<br />
find a job soon …?<br />
- 32 -<br />
4,5<br />
5,2<br />
5,5<br />
5,8<br />
5,7<br />
5,8<br />
5,7<br />
5,7<br />
6,2<br />
6,1<br />
6,0<br />
6,4<br />
6,3<br />
6,6<br />
House person Unemployed Students<br />
Your education and training to date is sufficient 22% 32% 21% 25%<br />
You should follow a more specialised training but you<br />
cannot currently do this<br />
You should follow a more specialised training and you<br />
intend doing this<br />
Status of respondents<br />
19% 33% 14% 20%<br />
8% 20% 42% 23%<br />
You are not looking for a job (spontaneous) 47% 10% 20% 28%<br />
DK 4% 5% 3% 4%<br />
EU25<br />
N= 2402 1584 2341 6327<br />
31<br />
(Asked IF NOT CURRENTLY NOT WORKING and NOT RETIRED) QA16c. Concerning yourself, do you think<br />
that in order to find a job soon…?
<strong>Special</strong> EUROBAROMETER 273 “European Social Reality” Report<br />
Views about what this group of respondents should do to find a job also differ<br />
significantly depending on their age.<br />
Most older respondents are not looking for a job (64%) while quite logically the<br />
youngest group has the highest percentage of people intending to follow a more<br />
specialised training (38%).<br />
Concerning yourself, do you think that in order to<br />
find a job soon …?<br />
Age of respondents<br />
15-24 25-39 40-54 55+<br />
Your education and training to date is sufficient 22% 29% 29% 18% 25%<br />
You should follow a more specialised training but you<br />
cannot currently do this<br />
You should follow a more specialised training and you<br />
intend doing this<br />
18% 34% 23% 8% 20%<br />
38% 21% 13% 4% 23%<br />
You are not looking for a job (spontaneous) 18% 14% 31% 64% 28%<br />
DK 4% 2% 4% 6% 4%<br />
N= 2624 1391 1202 1110 6327<br />
- 33 -<br />
EU25
<strong>Special</strong> EUROBAROMETER 273 “European Social Reality” Report<br />
1.6 Leisure time activities and voluntary work<br />
Europeans value their leisure time. In fact, they tend to find it even more important<br />
than work. Equally, close to 8 out of 10 EU citizens consider helping others or<br />
voluntary work an important aspect of their life. What do Europeans do in their free<br />
time and in what kind of voluntary activities do they actively participate 32 ?<br />
QA19 Do you currently participate actively in or do voluntary<br />
work for one or more of the following organisations?<br />
(EU25)<br />
A sports club or club for outdoor activities<br />
Education, arts, music or cultural association<br />
Religious or church organisation<br />
A charity organisation or <strong>social</strong> aid organisation<br />
A trade union<br />
A leisure association for the elderly<br />
Other interest groups for specific causes<br />
Political party or organisation<br />
An environmental protection, animal rights<br />
organisation, etc.<br />
An international organisation<br />
A business or professional organisation<br />
Organisation defending the interest of patients<br />
and\ or disabled<br />
An organisation for the defence of elderly rights<br />
A consumer organisation<br />
None of these (Spontaneous)<br />
Don't know<br />
Most Europeans do not actively participate or do voluntary work, at least not in or for<br />
any of the organisations listed in the questionnaire (64%).<br />
The European average conceals large differences between the Member States and in<br />
some countries the percentage of citizens who declare to actively participate in or do<br />
voluntary work for an organisation is quite high. In fact, in Austria (60%), the<br />
Netherlands (55%) and Sweden (53%) over half of the respondents claim to be active.<br />
Participation levels are lowest in Lithuania (11%) and Portugal (12%) 33 .<br />
32<br />
QA19. Do you currently participate actively in or do voluntary work for one or more of the following<br />
organisations?<br />
33<br />
The participation rate is calculated by deducting the % saying ‘none of these’ and the % ‘DK’ replies from<br />
the total at QA19.<br />
- 34 -<br />
3%<br />
2%<br />
2%<br />
2%<br />
2%<br />
2%<br />
1%<br />
1%<br />
1%<br />
4%<br />
2%<br />
6%<br />
5%<br />
8%<br />
13%<br />
64%
<strong>Special</strong> EUROBAROMETER 273 “European Social Reality” Report<br />
AT<br />
NL<br />
DE<br />
SE<br />
FI<br />
DK<br />
LU<br />
IE<br />
BE<br />
FR<br />
SI<br />
EU25<br />
IT<br />
SK<br />
CZ<br />
EE<br />
UK<br />
MT<br />
CY<br />
LV<br />
EL<br />
ES<br />
HU<br />
PL<br />
PT<br />
LT<br />
RO<br />
BG<br />
Extent of active participation or voluntary work in the EU<br />
11%<br />
10%<br />
12%<br />
17%<br />
16%<br />
18%<br />
18%<br />
18%<br />
20%<br />
24%<br />
23%<br />
28%<br />
28%<br />
- 35 -<br />
33%<br />
33%<br />
36%<br />
35%<br />
34%<br />
34%<br />
37%<br />
40%<br />
45%<br />
50%<br />
49%<br />
52%<br />
53%<br />
55%<br />
60%
<strong>Special</strong> EUROBAROMETER 273 “European Social Reality” Report<br />
Two socio-demographic factors influencing people’s propensity to ‘be active’ are<br />
occupation and education. Nearly half of people classified as managers actively<br />
participate in or do voluntary work for the organisations listed (49%), compared to<br />
only 20% of unemployed people. With regards to education, the data shows that the<br />
longer people stayed in full-time education the more likely it is that they actively<br />
participate in or do voluntary work for the organisations listed.<br />
Extent of active participation or voluntary work in the EU<br />
(by SD's for EU25)<br />
Managers<br />
Self-employed<br />
Other white collars<br />
Retired people<br />
Manual workers<br />
People looking after the house<br />
Unemployed people<br />
TEA: 20+<br />
Still studying<br />
TEA:16-19<br />
TEA: 15-<br />
It is interesting to note that the degree to which people participate actively in<br />
organisations or do voluntary work does not depend on whether workers have jobs<br />
that allow them to balance their professional, family and private life or on whether<br />
they find their job stressful and demanding.<br />
- 36 -<br />
20%<br />
30%<br />
30%<br />
28%<br />
32%<br />
32%<br />
38%<br />
36%<br />
43%<br />
41%<br />
49%
<strong>Special</strong> EUROBAROMETER 273 “European Social Reality” Report<br />
1.7 Trust in political institutions<br />
As noted earlier in the report, politics is not something many European Union citizens<br />
consider important in their life (43%). Is this because Europeans convey relatively<br />
little trust in the political institutions that govern them? The survey measures whether<br />
respondents tend to or tend not to trust four political institutions 34 . The more distant<br />
the political entity, the less likely respondents are to trust it. On average, 49% of EU<br />
citizens trust the council of their city or village but only 20% trust political parties.<br />
The council of your city/village<br />
The (NATIONALITY) Parliament<br />
The (NATIONALITY) Government<br />
Political parties<br />
Trust in political institutions<br />
EU25 (%)<br />
Tend not to trust Tend to trust DK<br />
The low level of trust is exemplified if we look at how many of these institutions people<br />
on average tend to trust. Looking at all 4 institutions, we find that in the European<br />
Union as a whole, 41% of the public doesn’t trust any of them. If we exclude the local<br />
council, the figure increases to 62%. Only 15% of EU citizens tend to trust all three<br />
institutions 35 .<br />
34<br />
QA18. I would like to ask you a question about how much trust you have in certain institutions. For each<br />
of the following institutions, please tell me if you tend to trust it or tend not to trust it.<br />
35<br />
These figures are obtained by counting the number of times a respondent answers ‘tend to trust’ to the<br />
items measuring trust in the political institutions at QA18.<br />
- 37 -<br />
61<br />
62<br />
73<br />
42<br />
31<br />
31<br />
20<br />
49<br />
9<br />
8<br />
7<br />
7
<strong>Special</strong> EUROBAROMETER 273 “European Social Reality” Report<br />
The extent to which people tend to trust the political institutions varies greatly among<br />
the Member States. Generally trust levels tend to be higher in the Northern and<br />
Western European countries than in the Eastern and Southern European countries.<br />
Trust levels are lowest in Poland, where 81% of the interviewees do not trust any of<br />
the three political institutions in question.<br />
Number of political institutions people tend<br />
to trust (in %, by country)*<br />
Zero One Two Three<br />
DK 19% 15% 27% 39%<br />
FI 27% 7% 28% 38%<br />
NL 28% 17% 18% 38%<br />
LU 32% 13% 23% 32%<br />
BE 44% 8% 20% 28%<br />
IE 52% 8% 15% 25%<br />
AT 42% 14% 19% 24%<br />
SE 39% 13% 25% 23%<br />
CY 42% 12% 25% 21%<br />
ES 61% 9% 13% 18%<br />
MT 52% 13% 17% 18%<br />
EL 56% 12% 15% 17%<br />
EE 47% 17% 21% 15%<br />
SL 61% 11% 13% 15%<br />
DE 66% 8% 12% 14%<br />
PT 62% 11% 14% 13%<br />
UK 63% 11% 13% 13%<br />
IT 68% 9% 11% 13%<br />
SK 55% 14% 18% 12%<br />
RO 67% 11% 11% 11%<br />
HU 67% 12% 11% 10%<br />
FR 63% 13% 15% 9%<br />
CZ 74% 11% 7% 8%<br />
LV 67% 12% 14% 8%<br />
BG 72% 11% 10% 7%<br />
LT 76% 10% 8% 7%<br />
PL 81% 9% 6% 5%<br />
*3 institutions; council of city/village excluded<br />
- 38 -
<strong>Special</strong> EUROBAROMETER 273 “European Social Reality” Report<br />
Socio-demographically, we find significant differences in the number of political<br />
institutions people trust depending on their terminal education age, gender and<br />
occupation. Trust in institutions is particularly weak among unemployed people: 70%<br />
don’t trust any of the three political institutions.<br />
Number of political institutions people tend to<br />
trust (in %, by SD's - EU25)<br />
Zero One Two Three<br />
Terminal Education<br />
Age<br />
Still Studying 53% 13% 14% 20%<br />
TEA: 20+ 52% 13% 18% 18%<br />
TEA:15- 66% 9% 12% 14%<br />
TEA: 16-19 66% 10% 12% 13%<br />
Gender<br />
Male 59% 11% 14% 15%<br />
Female 64% 10% 12% 14%<br />
Occupational status<br />
House person 61% 10% 12% 17%<br />
Retired 61% 10% 13% 15%<br />
Self-employed 62% 11% 12% 15%<br />
Other white collars 61% 10% 14% 15%<br />
Managers 56% 13% 17% 14%<br />
Manual workers 67% 9% 11% 12%<br />
Unemployed 70% 8% 11% 11%<br />
The extent to which people convey their trust in the political institutions is further<br />
related to whether or not politics is considered important in their life, whether they are<br />
happy or not, whether they feel safe and particularly on whether they feel confident<br />
about the future of pensions. Nearly three out of four Europeans who don’t feel<br />
confident about the future of the pensions in their country lack trust in the political<br />
institutions (72%).<br />
Future of pensions<br />
Number of political institutions people tend to trust<br />
(in %, EU25)<br />
Zero One Two Three<br />
Confident 48% 12% 17% 23%<br />
Not confident 72% 9% 10% 8%<br />
Importance of politics<br />
Important 52% 13% 15% 20%<br />
Not important 69% 8% 11% 11%<br />
Happiness<br />
Happy 60% 11% 14% 16%<br />
Unhappy 70% 10% 10% 10%<br />
Feeling safe<br />
Safe 58% 11% 14% 17%<br />
Unsafe 69% 9% 11% 10%<br />
- 39 -
<strong>Special</strong> EUROBAROMETER 273 “European Social Reality” Report<br />
2. Different personal and collective futures?<br />
2.1 People’s assessment of their personal situation<br />
European Union citizens are generally positive when they compare their current<br />
personal situation with that of five years ago: 39% believe that it has improved, 35%<br />
that it has not changed and 25% that it has deteriorated 36 . There is a strong<br />
correlation between age and the way in which citizens perceive changes in their<br />
situation over the last five years: the younger they are the more European citizens<br />
have a positive view of the way their life has changed. 59% of people aged 15 to 24<br />
consider that their personal situation has improved, while only 19% of the 55 and over<br />
age group share that view. There are also large differences depending on the age at<br />
which people left full-time education: those who stayed in school until the age of 20 or<br />
older far more often feel that their life improved than is the case for people who left<br />
school aged 16 or younger (51% vs. 23%).<br />
EU25<br />
AGE<br />
15-24<br />
25-39<br />
40-54<br />
55 +<br />
EDUC ATION (END OF)<br />
15<br />
16-19<br />
20+<br />
Still Studying<br />
Comparison of the present situation with five years ago - % EU<br />
Improved Stayed about the same Got worse DK<br />
19%<br />
23%<br />
39%<br />
37%<br />
59%<br />
55%<br />
39%<br />
51%<br />
57%<br />
- 40 -<br />
46%<br />
42%<br />
35%<br />
34%<br />
34%<br />
27%<br />
26%<br />
29%<br />
31%<br />
25%<br />
1%<br />
12% 2%<br />
18% 1%<br />
28% 1%<br />
34%<br />
1%<br />
34% 1%<br />
26% 1%<br />
19% 1%<br />
9% 3%<br />
0% 100%<br />
In general, European citizens remain relatively optimistic about the next five years 37 :<br />
41% of the respondents believes that their personal situation will improve and 40%<br />
feel that it will remain the same. Only 14% fear that their personal situation will<br />
deteriorate over the next five years. The younger the respondent the more they tend<br />
to be optimistic: 72% of those aged 15 to 24 believe that their situation will improve,<br />
compared with 16% of the 55 and over age group. As for education, the longer people<br />
stayed in school the more they tend to be optimistic: 49% of those who stayed in fulltime<br />
education until the age of 20 or older believe their situation will improve,<br />
compared to 24% of those who left school aged 15 or younger.<br />
36<br />
QA13. If you compare your present situation with five years ago, would you say it has improved, stayed<br />
about the same or got worse?<br />
37<br />
QA14. In the course of the next five years, do you expect your personal situation to improve, to stay<br />
about the same or to get worse?
<strong>Special</strong> EUROBAROMETER 273 “European Social Reality” Report<br />
EU25<br />
AGE<br />
15-24<br />
25-39<br />
40-54<br />
55 +<br />
EDUCATION (end of)<br />
15<br />
16-19<br />
20+<br />
Still Studying<br />
Expectation for personal situation in the course of the next five years<br />
- % EU<br />
Improve Stay about the same Get worse DK<br />
16%<br />
24%<br />
41%<br />
38%<br />
40%<br />
49%<br />
72%<br />
59%<br />
73%<br />
- 41 -<br />
56%<br />
49%<br />
40%<br />
42%<br />
41%<br />
37%<br />
29%<br />
14%<br />
5%<br />
20% 5% 3%<br />
7% 5%<br />
15% 5%<br />
22% 6%<br />
21% 6%<br />
14% 5%<br />
10% 4%<br />
21% 4% 2%<br />
0% 100%<br />
At the country level, the mood is outright positive in Estonia, where 69% of<br />
respondents say their life has improved over the past five years and 60% believe it will<br />
further improve over the next five years. Apart from Estonia, the mood is next most<br />
positive in Latvia and Ireland (both 62%) 38 .<br />
Hungary stands out as being the only country where the mood is clearly negative. Not<br />
only is the majority view that things got worse over the past five years (46%), the fear<br />
that the personal situation will get worse over the next five years also dominates<br />
(38%).<br />
In Bulgaria, the mood is that things got worse over the past five years and although<br />
things will not get better they will also not get worse. In Greece, the mood has been<br />
negative but there are some reasons to be confident. In Germany, the majority view is<br />
that things will stay the same and only a quarter of the citizens have confidence in the<br />
future (26%).<br />
In Portugal, the past is viewed with mixed emotions but citizens broadly express faith<br />
in the future: 54% believe that their personal situation will improve over the next five<br />
years.<br />
38 In the graph below, each country’s position is determined as follows: on the horizontal axis the position is<br />
the difference between the % saying that things improved and the % saying that things got worse (QA13)<br />
and on the vertical axis the position is the difference between the % saying one’s personal situation will<br />
improve and the % saying that the personal situation will get worse (QA14).
<strong>Special</strong> EUROBAROMETER 273 “European Social Reality” Report<br />
Some reasons<br />
to be confident<br />
Differential « Personal situation will improve /<br />
will get worse in the next 5 years»<br />
60<br />
50<br />
40<br />
30<br />
20<br />
PT<br />
ES<br />
UK<br />
RO<br />
MT<br />
NL<br />
FR SK<br />
PL<br />
CY<br />
LU<br />
IT BE<br />
AT<br />
CZ<br />
SI<br />
10<br />
EL<br />
BG<br />
DE<br />
0<br />
-30 -20 -10 0 10 20 30 40 50 60 70<br />
« « Personal situation got worse worse<br />
« Personal situation improved<br />
in the last last 5 years years »<br />
HU<br />
It will be even<br />
-10<br />
in the last 5 years»<br />
worse<br />
-20<br />
- 42 -<br />
It will be even<br />
better<br />
SE<br />
LT<br />
FI<br />
DK<br />
LV<br />
IE<br />
EE
<strong>Special</strong> EUROBAROMETER 273 “European Social Reality” Report<br />
2.2 The issues of concern for Europeans<br />
While Europeans generally assess their personal situation as positive, they express<br />
widespread concern about certain national issues 39 . Unemployment is the most<br />
frequently voiced concern, mentioned by 36% of respondents. The cost of living is<br />
mentioned almost as frequently (35%) and 30% of respondents are concerned about<br />
pensions.<br />
Issues of concern for Europeans<br />
(EU25)<br />
Unemployment<br />
The cost of living<br />
Pensions<br />
Crime<br />
Health care<br />
Terrorism<br />
The gap between the rich and the poor<br />
Immigration<br />
The environment<br />
Education<br />
The care of the elderly<br />
Integration of foreigners<br />
Economic growth<br />
The willingness of people to help others<br />
Globalisation<br />
The care of disabled people<br />
Transport infrastructure<br />
None of these (SPONTANEOUS)<br />
DK<br />
2%<br />
1%<br />
1%<br />
4%<br />
4%<br />
39 QA26a. I am going to show you a card with a list of topics. Thinking of (OUR COUNTRY), please tell me<br />
which 3 topics from this list currently concern you the most. 1. Pensions 2. Immigration 3. Health care 4.<br />
Terrorism 5. Integration of foreigners 6. The willingness of people to help others 7. The cost of living 8.<br />
Economic growth 9. The care of the elderly 10. The care of the disabled 11. Unemployment 12. Crime 13.<br />
The gap between the rich and the poor 14. Transport infrastructure 15. Education 16. The environment 17.<br />
Globalisation.<br />
- 43 -<br />
8%<br />
7%<br />
7%<br />
14%<br />
13%<br />
13%<br />
13%<br />
17%<br />
26%<br />
26%<br />
25%<br />
30%<br />
36%<br />
35%
<strong>Special</strong> EUROBAROMETER 273 “European Social Reality” Report<br />
Quite logically, unemployed people are most concerned about unemployment (57%).<br />
Other groups in society that voice particular concern about this issue are the young<br />
(45%) and students (41%). However, a considerably proportion of people who<br />
themselves are not directly affected by unemployment nonetheless express concern:<br />
managers and people aged 55 and over are least concerned (29%).<br />
The cost of living most concerns the working classes: for around 4 out of 10 manual<br />
workers, white-collar employees as well as people aged 25 to 40 it is one of their top<br />
concerns. However, the cost of living is a concern held by a wide variety of people: at<br />
25%, managers are least likely to feel concerned about the cost of living.<br />
The likelihood that people worry about pensions increases, as to be expected, with<br />
age. Of all the subgroups in the population students least express concern (16%) while<br />
those who left education aged 15 or younger (38%) and people aged 55 and over<br />
(37%), and the retired (36%) most express concern.<br />
At the country level, concerns about unemployment are particularly widespread in<br />
Greece (58%), Poland (53%) and Portugal (52%). Conversely, in Denmark (3%) and<br />
the Netherlands (5%) very few citizens are concerned about unemployment.<br />
Concerns about the cost of living are highest in Cyprus (60%), followed by Hungary<br />
(59%), Portugal and Romania (both 56%). In Denmark (2%) and Sweden (8%) the<br />
cost of living is not a problem for most citizens.<br />
We noted earlier that only 25% of Germans are confident about the future of their<br />
pensions. This lack of confidence in pensions is further evident as this issue is also<br />
most frequently cited as a concern by German respondents (43%). People in Poland<br />
and Hungary next express most widespread concern (both 39%) about pensions while<br />
Danish citizens hardly voice concern (8%).<br />
Clearly then, these three issues are top concerns in many Member States. In some<br />
countries, however, people have a complete different set of main concerns. The top<br />
three concerns in each country are highlighted in the next table.<br />
- 44 -
<strong>Special</strong> EUROBAROMETER 273 “European Social Reality” Report<br />
Main three current concerns of Europeans (by country)<br />
Pensions Immigration Health care Terrorism<br />
Integration<br />
of<br />
foreigners<br />
- 45 -<br />
Help others<br />
The Cost of<br />
living<br />
Economic<br />
growth<br />
The care of<br />
elderly<br />
EU25 30% 14% 26% 25% 8% 7% 35% 7% 13%<br />
BE 26% 11% 27% 13% 14% 11% 35% 14% 14%<br />
CZ 35% 6% 39% 19% 3% 13% 33% 5% 7%<br />
DK 8% 15% 26% 42% 28% 22% 2% 3% 30%<br />
DE 43% 8% 30% 27% 8% 7% 19% 6% 14%<br />
EE 31% 1% 53% 3% 2% 12% 51% 10% 9%<br />
EL 27% 6% 19% 11% 8% 5% 50% 26% 4%<br />
ES 22% 33% 7% 42% 5% 2% 42% 7% 9%<br />
FR 31% 12% 14% 19% 9% 6% 44% 8% 11%<br />
IE 11% 6% 59% 9% 8% 9% 49% 7% 18%<br />
IT 29% 25% 18% 28% 11% 5% 45% 11% 6%<br />
CY 23% 4% 37% 11% 18% 10% 60% 12% 8%<br />
LV 31% 6% 42% 8% 2% 4% 53% 15% 9%<br />
LT 34% 5% 61% 4% 1% 7% 44% 22% 6%<br />
LU 22% 4% 16% 16% 12% 7% 24% 11% 11%<br />
HU 39% 2% 52% 4% 1% 5% 59% 17% 6%<br />
MT 34% 24% 27% 8% 5% 4% 53% 15% 12%<br />
NL 10% 8% 30% 24% 23% 28% 19% 3% 25%<br />
AT 31% 24% 22% 15% 17% 10% 25% 8% 17%<br />
PL 39% 5% 39% 16% 1% 3% 38% 4% 9%<br />
PT 35% 5% 46% 12% 3% 3% 56% 15% 7%<br />
SI 37% 5% 29% 7% 4% 10% 41% 7% 10%<br />
SK 21% 3% 39% 21% 2% 9% 43% 4% 10%<br />
FI 19% 5% 33% 13% 6% 19% 17% 4% 51%<br />
SE 12% 11% 30% 16% 17% 15% 8% 6% 35%<br />
UK 25% 20% 27% 34% 6% 9% 30% 3% 19%<br />
BG 34% 2% 57% 8% 1% 3% 51% 15% 9%<br />
RO 31% 6% 59% 7% 1% 4% 56% 24% 8%
<strong>Special</strong> EUROBAROMETER 273 “European Social Reality” Report<br />
The care of<br />
disabled<br />
Unemployment Crime<br />
Gap<br />
between<br />
the rich and<br />
the poor<br />
- 46 -<br />
Transport Education<br />
The<br />
environment Globalisation<br />
EU25 4% 36% 26% 17% 2% 13% 13% 4%<br />
BE 4% 34% 19% 16% 3% 19% 18% 6%<br />
CZ 5% 34% 32% 14% 5% 6% 13% 5%<br />
DK 6% 3% 37% 19% 4% 8% 26% 6%<br />
DE 2% 47% 20% 32% 0% 10% 8% 5%<br />
EE 6% 12% 17% 20% 6% 26% 15% 3%<br />
EL 3% 58% 33% 9% 0% 17% 11% 4%<br />
ES 2% 36% 21% 7% 0% 15% 13% 2%<br />
FR 7% 39% 12% 22% 1% 25% 23% 9%<br />
IE 7% 12% 50% 12% 8% 16% 10% 3%<br />
IT 2% 34% 27% 10% 1% 3% 10% 3%<br />
CY 5% 26% 33% 12% 2% 20% 8% 6%<br />
LV 4% 32% 20% 18% 4% 21% 10% 3%<br />
LT 4% 23% 30% 10% 2% 22% 4% 2%<br />
LU 5% 37% 27% 12% 6% 25% 23% 11%<br />
HU 2% 40% 7% 15% 3% 18% 9% 3%<br />
MT 4% 29% 19% 5% 1% 19% 18% 4%<br />
NL 6% 5% 31% 25% 4% 18% 24% 3%<br />
AT 5% 40% 19% 17% 3% 7% 9% 6%<br />
PL 4% 53% 32% 18% 2% 8% 3% 1%<br />
PT 3% 52% 19% 10% 1% 17% 6% 2%<br />
SI 3% 45% 24% 26% 3% 6% 11% 7%<br />
SK 4% 47% 37% 20% 4% 8% 10% 2%<br />
FI 6% 30% 26% 30% 1% 3% 15% 5%<br />
SE 2% 30% 37% 18% 2% 6% 45% 4%<br />
UK 8% 13% 41% 9% 5% 17% 17% 4%<br />
BG 5% 36% 28% 20% 1% 12% 3% 2%<br />
RO 3% 17% 8% 19% 4% 20% 9% 4%
<strong>Special</strong> EUROBAROMETER 273 “European Social Reality” Report<br />
2.3 Future expectations<br />
While people’s expectations about their life in general and their personal situation are<br />
positive, optimism about the employment and economic situation in their country is<br />
less widespread. It should be noted that there are large variations between the<br />
Member States 40 .<br />
Generally, European Union citizens are more optimistic than pessimistic about the<br />
future: 35% of respondents believe that life in general will improve over the next<br />
twelve months, while 52% do not expect any changes and only 10% believe that it will<br />
be worse.<br />
Europeans are also relatively optimistic about the financial situation of their household<br />
and their personal job situation. Nonetheless, around one citizen in seven (16%)<br />
believes that the financial situation of their household will worsen over the next twelve<br />
months.<br />
Your life in general<br />
The financial situation of your household<br />
Your personal job situation<br />
The employment situation<br />
The economic situation<br />
Expectations for the next twelve months - %EU<br />
Better Same Worse DK<br />
25%<br />
22%<br />
23%<br />
20%<br />
35%<br />
- 47 -<br />
38%<br />
39%<br />
56%<br />
52%<br />
62% 7%<br />
33%<br />
34%<br />
10%<br />
16%<br />
9%<br />
7%<br />
0% 100%<br />
Having noted that many Europeans worry about unemployment, the cost of living and<br />
pensions, it is not surprising to find that their expectations about the economic and<br />
employment situation in their country are quite critical. One citizen in three is afraid<br />
the national situation will deteriorate over the next twelve months (34% and 33%,<br />
respectively).<br />
While in most countries the feeling that the economic and employment situation will<br />
stay the same over the next twelve months dominates, there are a few notable<br />
exceptions. A strong sense of optimism is present in Estonia where the majority view is<br />
that both will improve over the next twelve months (48% and 46%, respectively). In<br />
the Netherlands, there is widespread optimism about the employment situation with<br />
52% of respondents saying it will be better. There is also widespread optimism that<br />
the employment situation will improve in Sweden (48%) and Lithuania (44%).<br />
Conversely, in Hungary, Greece, Portugal, Luxembourg, Belgium and Cyprus views<br />
about collective life are pessimistic. The pessimistic stance is most widely expressed in<br />
Hungary where 62% of respondents expect the economic situation to get worse and<br />
59% feel this way about the employment situation. The situation is not much better in<br />
Greece (55% and 59%, respectively).<br />
40<br />
QA12. What are your expectations for the next twelve months: will they be better, worse or the same,<br />
when it comes to…?<br />
1° your life in general 2° the economic situation in (OUR COUNTRY) 3° the financial situation of your<br />
household 4° the employment situation in (OUR COUNTRY) 5° your personal job situation
<strong>Special</strong> EUROBAROMETER 273 “European Social Reality” Report<br />
Expectations for the next twelve months (by country)<br />
Your life in general<br />
The financial situation of<br />
your household<br />
Your personal job<br />
situation<br />
- 48 -<br />
The economic situation<br />
in (our country)<br />
The employment situation<br />
in (our country)<br />
Better Worse Same Better Worse Same Better Worse Same Better Worse Same Better Worse Same<br />
EU25 35% 10% 52% 25% 16% 56% 22% 7% 62% 20% 34% 39% 22% 33% 38%<br />
BE 34% 7% 58% 21% 10% 68% 18% 7% 66% 12% 48% 39% 12% 58% 29%<br />
CZ 27% 12% 58% 21% 18% 59% 13% 7% 61% 18% 33% 45% 16% 30% 50%<br />
DK 41% 2% 55% 32% 6% 61% 24% 2% 68% 22% 12% 60% 26% 9% 61%<br />
DE 20% 16% 62% 13% 26% 60% 15% 9% 68% 23% 40% 35% 24% 37% 37%<br />
EE 52% 4% 41% 47% 5% 46% 31% 3% 50% 48% 6% 36% 46% 6% 35%<br />
EL 39% 16% 45% 24% 22% 54% 18% 8% 72% 10% 55% 34% 9% 59% 32%<br />
ES 39% 6% 52% 24% 8% 64% 23% 5% 68% 16% 21% 50% 17% 20% 49%<br />
FR 45% 7% 45% 30% 13% 54% 29% 5% 56% 18% 37% 37% 22% 37% 36%<br />
IE 44% 3% 49% 36% 6% 53% 26% 3% 54% 28% 15% 47% 25% 17% 46%<br />
IT 35% 11% 49% 28% 15% 54% 26% 11% 58% 24% 36% 34% 22% 34% 38%<br />
CY 35% 8% 48% 23% 21% 52% 13% 7% 63% 15% 46% 29% 11% 46% 27%<br />
LV 46% 6% 45% 38% 9% 50% 29% 3% 46% 28% 20% 45% 32% 10% 47%<br />
LT 43% 9% 44% 36% 11% 50% 31% 11% 41% 32% 18% 42% 44% 9% 37%<br />
LU 32% 5% 59% 21% 9% 67% 13% 5% 70% 14% 43% 33% 10% 58% 22%<br />
HU 17% 38% 42% 12% 51% 35% 6% 32% 52% 9% 62% 24% 5% 59% 32%<br />
MT 35% 10% 48% 14% 9% 70% 12% 4% 58% 25% 23% 25% 27% 25% 28%<br />
NL 34% 4% 60% 26% 12% 60% 25% 5% 51% 36% 16% 42% 52% 10% 30%<br />
AT 20% 10% 67% 21% 13% 63% 19% 8% 63% 28% 17% 51% 27% 21% 46%<br />
PL 37% 11% 48% 28% 15% 52% 20% 5% 64% 21% 27% 41% 29% 21% 42%<br />
PT 25% 16% 54% 18% 18% 59% 16% 11% 63% 12% 48% 32% 12% 52% 29%<br />
SI 29% 13% 56% 18% 16% 64% 12% 7% 76% 20% 32% 44% 18% 35% 43%<br />
SK 31% 11% 56% 24% 18% 56% 16% 7% 53% 28% 26% 42% 29% 22% 43%<br />
FI 34% 3% 62% 22% 6% 72% 14% 3% 79% 17% 15% 66% 28% 19% 52%<br />
SE 43% 3% 51% 34% 9% 54% 25% 3% 63% 32% 23% 34% 48% 17% 26%<br />
UK 48% 4% 45% 36% 9% 52% 29% 4% 55% 15% 37% 37% 15% 38% 33%<br />
BG 17% 29% 44% 13% 35% 42% 12% 12% 60% 14% 38% 29% 15% 25% 30%<br />
RO 44% 16% 34% 34% 19% 41% 23% 7% 38% 33% 27% 29% 31% 25% 27%
<strong>Special</strong> EUROBAROMETER 273 “European Social Reality” Report<br />
Differences between the various socio-demographic groups are not particularly<br />
noteworthy with the exception of young people. Compared to their older<br />
counterparts, those aged 15 to 24 are far less pessimistic about the economic and<br />
employment situation in their country.<br />
2.4 Life in the European Union for the next generation<br />
Being concerned about the collective future notably means that European citizens<br />
worry about life for the next generation. On average, less than one European in five<br />
believes that the life of those who are children today will be easier than the life of<br />
those from their own generation (17%) while around two-third of Europeans believe<br />
life will be more difficult for the next generation (64%) 41 .<br />
41 QA17. Generally speaking, do you think that the life of those who are children today will be easier, more<br />
difficult or neither easier nor more difficult than the life of those from your own generations?<br />
- 49 -
<strong>Special</strong> EUROBAROMETER 273 “European Social Reality” Report<br />
Baby-boomers, the generation born just after World-War II and until 1964, are most<br />
concerned about the future of today’s children: 70% of this generation believe that<br />
today’s children will have a more difficult life than they themselves did. The war<br />
generation, those born between 1933 and 1945, is nearly as pessimistic about the<br />
future of today’s children with 69% believing that the life of today’s children will be<br />
more difficult than their own life. In fact, even the youngest interviewees express a<br />
considerable degree of concern about the future: 40% of respondents aged 15 to 17<br />
believe that the life of children today will be more difficult. Yet, those who are<br />
children today are nonetheless more optimistic about their future than adults are.<br />
Will the life of those who are children today be easier, more difficult or neither<br />
easier nor more difficult than the life of those from your own generation?<br />
(By age/generation - EU25)<br />
Children<br />
aged 15-17<br />
Generation Y<br />
(1977-1988)<br />
Generation X<br />
(1965-1976)<br />
- 50 -<br />
Babyboomers<br />
(1946-1964)<br />
War<br />
generation<br />
(1933-1945)<br />
Pre-war<br />
generation<br />
(up to 1932)<br />
Easier 31% 19% 17% 14% 16% 19%<br />
More difficult<br />
Neither easier<br />
40% 57% 62% 70% 69% 65%<br />
nor more<br />
difficult<br />
24% 21% 18% 14% 13% 11%<br />
DK 6% 3% 3% 2% 3% 5%<br />
n= 851 4256 5347 8693 5200 2408
<strong>Special</strong> EUROBAROMETER 273 “European Social Reality” Report<br />
Views about life for future generations differ significantly from country to country<br />
and in some of the Member States they are somewhat in line with the overall outlook<br />
on life that prevails. Hence we find that in Portugal, where after difficult times<br />
citizens now express faith in the future, people are most inclined to feel that life for<br />
future generations will be easier than the life of those from their own generation<br />
(57%). Conversely, only 3% of German respondents believe the life of today’s<br />
children will be easier. As noted earlier, Germans are generally quite worried about<br />
their future, particularly when it comes to their pensions. However, this observation<br />
is certainly not applicable to all the Member States. Hungary, where the mood about<br />
people’s own future is most bleak, does not appear on the bottom of the rank order.<br />
Contrarily, Swedish respondents are pessimistic about life for future generations<br />
even if they are quite content with their own lives.<br />
Perhaps these diverse perceptions at the country level are influenced by what are<br />
considered to be the main challenges for the next generation in each country?<br />
- 51 -
<strong>Special</strong> EUROBAROMETER 273 “European Social Reality” Report<br />
2.5 The concerns for the next generation<br />
Unemployment tops the list of issues that concern European Union citizens for the<br />
next generation, followed by pensions and the cost of living 42 . Although overall<br />
people’s main three concerns for the next generation are the same as those that<br />
currently concerns them most, the intensity of concern differs. The extent to which<br />
unemployment is a concern for the next generation is even more widespread than<br />
the current level of concern is (40% vs. 36%) whereas concerns about the cost of<br />
living are less intense (26% vs. 35%). People also worry much more about the<br />
environment when it comes to the next generation (24% vs. 13%) and education is<br />
also more an issue of concern for future generations (18% vs. 13%).<br />
Issues of concern for the next generation<br />
(EU25)<br />
Unemployment<br />
Pensions<br />
The cost of living<br />
Crime<br />
The environment<br />
Terrorism<br />
Education<br />
Health care<br />
The gap between the rich and the poor<br />
The care of the elderly<br />
Economic growth<br />
Immigration<br />
The willingness of people to help others<br />
Integration of foreigners<br />
Globalisation<br />
The care of disabled people<br />
Transport infrastructure<br />
DK<br />
None of these (SPONTANEOUS)<br />
2%<br />
1%<br />
1%<br />
3%<br />
- 52 -<br />
7%<br />
7%<br />
6%<br />
10%<br />
10%<br />
10%<br />
17%<br />
16%<br />
18%<br />
42 QA26b. And which 3 topics concern you the most for the next generation?<br />
24%<br />
23%<br />
26%<br />
25%<br />
30%<br />
40%
<strong>Special</strong> EUROBAROMETER 273 “European Social Reality” Report<br />
At the country level, concerns about unemployment for the future generation are<br />
most widespread in Greece (66%), followed by France (53%), Hungary (52%) and<br />
Luxembourg (51%). In Denmark and the Netherlands unemployment is not only a<br />
non-issue for the current generation, very few citizens see it as a problem for the<br />
next generation (9% and 11%, respectively).<br />
In Germany, citizens not only worry about their own pensions, they are even more<br />
worried when it comes to the pensions of future generations (47% vs. 43%). In<br />
Austria, Malta and the Czech Republic there is also widespread concern over the<br />
pensions of the next generation (all 40%). In the three Baltic States, Denmark,<br />
Cyprus and Bulgaria only around one in ten people express concern about this issue<br />
for the next generation.<br />
When it comes to concerns about the cost of living for the next generation, the three<br />
countries topping the list are those that also currently most express concern,<br />
although the extent of it for the next generation is less intense: Hungary (48% vs.<br />
59%), Cyprus (38% vs. 60%) and Portugal (38% vs. 56%). In Denmark and<br />
Sweden, the cost of living is for neither the current generation nor the next<br />
generation a problem.<br />
In many countries, the set of main concerns for the next generation is different. The<br />
top three concerns in each country are highlighted in the next table.<br />
- 53 -
<strong>Special</strong> EUROBAROMETER 273 “European Social Reality” Report<br />
Main three concerns of Europeans for future generations(by country)<br />
Pensions Immigration Health care Terrorism<br />
Integration<br />
of<br />
foreigners<br />
- 54 -<br />
Help others<br />
The Cost of<br />
living<br />
Economic<br />
growth<br />
The care of<br />
elderly<br />
EU25 30% 10% 17% 23% 7% 7% 26% 10% 10%<br />
BE 32% 10% 18% 12% 10% 10% 32% 17% 10%<br />
CZ 40% 5% 21% 27% 4% 13% 23% 8% 8%<br />
DK 9% 14% 19% 39% 17% 23% 6% 8% 16%<br />
DE 47% 4% 20% 21% 5% 8% 12% 7% 13%<br />
EE 10% 6% 24% 14% 5% 8% 34% 8% 6%<br />
EL 21% 7% 8% 16% 8% 4% 31% 19% 2%<br />
ES 17% 22% 5% 29% 4% 2% 30% 6% 7%<br />
FR 36% 7% 13% 13% 6% 6% 30% 13% 7%<br />
IE 15% 10% 31% 15% 12% 8% 31% 11% 17%<br />
IT 30% 19% 11% 28% 12% 7% 32% 14% 5%<br />
CY 10% 3% 7% 14% 20% 9% 38% 15% 6%<br />
LV 8% 9% 23% 15% 2% 5% 28% 21% 5%<br />
LT 10% 11% 38% 8% 2% 7% 29% 29% 4%<br />
LU 32% 5% 12% 13% 7% 5% 19% 11% 6%<br />
HU 14% 3% 36% 6% 2% 4% 48% 25% 10%<br />
MT 40% 15% 15% 12% 10% 4% 31% 16% 6%<br />
NL 16% 4% 24% 23% 15% 28% 15% 5% 22%<br />
AT 40% 19% 21% 17% 15% 8% 21% 8% 16%<br />
PL 31% 6% 17% 24% 3% 4% 26% 4% 10%<br />
PT 28% 6% 27% 18% 5% 4% 38% 14% 7%<br />
SI 32% 4% 19% 12% 4% 8% 24% 6% 6%<br />
SK 24% 7% 18% 34% 3% 10% 24% 8% 9%<br />
FI 21% 6% 26% 19% 4% 14% 16% 7% 27%<br />
SE 17% 7% 17% 17% 10% 15% 10% 9% 14%<br />
UK 25% 13% 20% 30% 5% 6% 32% 7% 9%<br />
BG 7% 7% 28% 22% 5% 3% 37% 27% 7%<br />
RO 18% 12% 38% 18% 3% 4% 32% 31% 6%
<strong>Special</strong> EUROBAROMETER 273 “European Social Reality” Report<br />
The care of<br />
disabled<br />
Unemployment Crime<br />
Gap<br />
between<br />
the rich and<br />
the poor<br />
- 55 -<br />
Transport Education<br />
The<br />
environment Globalisation<br />
EU25 2% 40% 25% 16% 1% 18% 24% 6%<br />
BE 2% 44% 19% 15% 2% 15% 26% 7%<br />
CZ 3% 30% 26% 15% 2% 7% 24% 9%<br />
DK 3% 9% 33% 20% 2% 13% 40% 9%<br />
DE 2% 49% 20% 30% 1% 19% 17% 6%<br />
EE 4% 19% 31% 19% 2% 33% 25% 7%<br />
EL 2% 66% 38% 16% 0% 22% 23% 10%<br />
ES 1% 38% 19% 7% 1% 20% 27% 4%<br />
FR 2% 53% 11% 16% 1% 25% 35% 11%<br />
IE 4% 19% 35% 14% 9% 17% 23% 10%<br />
IT 2% 43% 29% 10% 1% 6% 17% 3%<br />
CY 1% 49% 46% 21% 1% 30% 12% 11%<br />
LV 2% 24% 30% 14% 1% 47% 22% 7%<br />
LT 2% 29% 32% 9% 2% 41% 10% 4%<br />
LU 3% 51% 22% 10% 2% 25% 29% 15%<br />
HU 1% 52% 8% 10% 2% 35% 13% 6%<br />
MT 4% 34% 18% 9% 1% 23% 21% 8%<br />
NL 3% 11% 26% 22% 3% 18% 41% 6%<br />
AT 4% 39% 20% 17% 2% 8% 14% 7%<br />
PL 3% 41% 33% 17% 1% 15% 12% 4%<br />
PT 3% 48% 22% 12% 2% 25% 21% 3%<br />
SI 2% 43% 29% 25% 2% 14% 22% 11%<br />
SK 3% 30% 34% 24% 2% 12% 27% 8%<br />
FI 3% 25% 29% 25% 1% 8% 35% 7%<br />
SE 1% 37% 29% 20% 2% 10% 63% 8%<br />
UK 3% 24% 38% 7% 3% 23% 28% 7%<br />
BG 2% 33% 28% 22% 2% 23% 12% 6%<br />
RO 3% 22% 12% 21% 3% 31% 14% 5%
<strong>Special</strong> EUROBAROMETER 273 “European Social Reality” Report<br />
The various age groups in the population are unanimous in the view that<br />
unemployment is the primary concern for the next generation. Concern for the other<br />
issues is somewhat more varied among the age groups. Younger respondents are<br />
more inclined to list the environment as a main concern, whereas older respondents<br />
more often list pensions as a concern for the next generation.<br />
Pensions<br />
Education<br />
Environment<br />
Aged: 15-24 Aged: 25-39<br />
Aged: 40-54 Aged: 55 +<br />
23%<br />
15%<br />
18%<br />
26%<br />
17%<br />
33%<br />
34%<br />
21%<br />
21%<br />
25%<br />
28%<br />
28%<br />
- 56 -<br />
Cost of living<br />
Crime<br />
Unemployment<br />
23%<br />
27%<br />
26%<br />
29%<br />
25%<br />
25%<br />
25%<br />
39%<br />
39%<br />
40%<br />
27%<br />
42%
<strong>Special</strong> EUROBAROMETER 273 “European Social Reality” Report<br />
2.6 Getting ahead in life<br />
One of the <strong>social</strong> realities that the survey has revealed is the schism of opinion that<br />
European Union citizens exhibit between their own personal future and the collective<br />
future, with unemployment being the main issue of concern. This <strong>social</strong> reality<br />
implies a sense of self-dependency: “the country may not be doing well, but I take<br />
good care of myself”. This motto of life is evident from the finding that European<br />
Union citizens widely consider getting a good education and working hard as the two<br />
most important things for getting ahead in life (62% and 45%, respectively) 43 .<br />
“In your opinion, out of the following, which are the 2 most important<br />
things for getting ahead in life” (EU25)<br />
Getting a good education<br />
Working hard<br />
Knowing the right people<br />
Being lucky<br />
Being smart<br />
Coming from a wealthy family<br />
Other (SPONTANEOUS)<br />
Being a man<br />
DK<br />
2%<br />
2%<br />
1%<br />
9%<br />
43<br />
QA5. In your opinion, out of the following, which are the 2 most important things for getting ahead in<br />
life?<br />
- 57 -<br />
17%<br />
26%<br />
24%<br />
45%<br />
62%
<strong>Special</strong> EUROBAROMETER 273 “European Social Reality” Report<br />
The belief that getting a good education and working hard are the two most<br />
important things for getting ahead in life is shared by all the various sociodemographic<br />
groups identified by the survey. There are however some differences in<br />
the intensity of this view and with regards to other factors that matter.<br />
A comparison between men and women shows that women consider getting a good<br />
education more important (65% vs. 60%) while men are more inclined to consider<br />
working hard important (47% vs. 43%). The idea that being a man is important for<br />
getting in life is rejected by both sexes.<br />
People who stayed in education until the age of 20 or older are considerably more<br />
likely to believe in getting a good education than are people who left school at an<br />
early age (67% vs. 56%). Conversely, the latter are more inclined to believe that<br />
luck plays a role in getting ahead in life (27% vs. 21%).<br />
Students and managers are most likely to view getting a good education as an<br />
important thing for getting ahead of life (73% and 72%, respectively). Unemployed<br />
people are most inclined to believe that knowing the right people is important<br />
(31%). Working hard is most seen as an important factor for getting ahead in life by<br />
self-employed people (53%).<br />
Getting a<br />
good<br />
education<br />
Working<br />
hard<br />
Knowing<br />
the right<br />
people<br />
- 58 -<br />
Being<br />
lucky<br />
Being<br />
smart<br />
Coming<br />
from a<br />
wealthy<br />
family<br />
Being a<br />
man<br />
EU25 62% 45% 26% 24% 17% 9% 2%<br />
Female 65% 43% 25% 26% 18% 9% 2%<br />
Male 60% 47% 27% 23% 17% 9% 3%<br />
Aged 15-24 65% 43% 27% 23% 20% 11% 2%<br />
Aged: 55+ 64% 48% 22% 24% 15% 9% 3%<br />
Aged: 40-54 61% 42% 29% 24% 17% 10% 2%<br />
Aged: 25-39 59% 45% 28% 26% 19% 9% 3%<br />
TEA: 20+ 67% 44% 27% 21% 19% 8% 2%<br />
TEA: 16-19 61% 45% 28% 26% 17% 9% 3%<br />
TEA: 15- 56% 47% 24% 27% 15% 11% 3%<br />
Students 73% 41% 26% 21% 19% 10% 1%<br />
Managers 72% 45% 26% 18% 22% 6% 2%<br />
Retired 64% 47% 23% 23% 15% 8% 3%<br />
House persons 60% 42% 24% 28% 18% 11% 2%<br />
Manual workers 59% 44% 28% 28% 18% 10% 3%<br />
Unemployed 58% 42% 31% 25% 17% 11% 3%<br />
Other white<br />
collars<br />
57% 44% 30% 26% 17% 9% 3%<br />
Self-employed 56% 53% 25% 22% 17% 8% 2%
<strong>Special</strong> EUROBAROMETER 273 “European Social Reality” Report<br />
A few exceptions withstanding, in rank order, getting a good education and working<br />
hard are seen as the two most important things for getting ahead in life throughout<br />
the European Union. In Greece and Hungary working hard comes before getting a<br />
good education while in Spain both factors are regarded as being important by equal<br />
proportions. Exceptions are noted in:<br />
Sweden, where knowing the right people is more important than working hard<br />
is.<br />
The Czech Republic, Bulgaria, Slovakia and the Netherlands, where being lucky<br />
is more important than working hard is.<br />
Latvia, where being lucky and knowing the right people is more important than<br />
working hard is.<br />
Lithuania and Malta, where being smart is more important than working hard is.<br />
Getting a<br />
good<br />
education<br />
Working<br />
hard<br />
Knowing<br />
the right<br />
people<br />
- 59 -<br />
Being<br />
lucky<br />
Being<br />
smart<br />
Coming<br />
from a<br />
wealthy<br />
family<br />
Being a<br />
man<br />
EU25 62% 45% 26% 24% 17% 9% 2%<br />
BE 63% 49% 20% 34% 18% 5% 2%<br />
CZ 47% 29% 31% 45% 19% 11% 3%<br />
DK 83% 43% 29% 18% 15% 2% 1%<br />
DE 81% 28% 28% 19% 23% 8% 2%<br />
EE 66% 41% 27% 20% 20% 4% 5%<br />
EL 54% 57% 29% 25% 17% 10% 1%<br />
ES 50% 50% 18% 36% 21% 9% 2%<br />
FR 58% 54% 20% 24% 26% 5% 3%<br />
IE 74% 60% 19% 15% 11% 5% 3%<br />
IT 46% 44% 32% 26% 7% 18% 4%<br />
CY 74% 46% 22% 15% 14% 11% 1%<br />
LV 69% 15% 36% 38% 23% 6% 1%<br />
LT 67% 23% 28% 16% 36% 8% 3%<br />
LU 75% 36% 23% 18% 26% 4% 1%<br />
HU 33% 40% 29% 31% 22% 31% 2%<br />
MT 75% 27% 18% 13% 34% 5% 11%<br />
NL 61% 36% 22% 38% 26% 2% 1%<br />
AT 58% 44% 31% 24% 10% 16% 5%<br />
PL 57% 36% 32% 27% 16% 12% 4%<br />
PT 67% 37% 20% 28% 24% 14% 3%<br />
SI 61% 42% 34% 29% 15% 4% 2%<br />
SK 49% 35% 35% 39% 26% 6% 2%<br />
FI 68% 54% 26% 26% 9% 5% 1%<br />
SE 67% 41% 54% 13% 14% 3% 2%<br />
UK 77% 70% 21% 10% 7% 4% 1%<br />
BG 48% 38% 21% 43% 15% 14% 2%<br />
RO 49% 40% 22% 36% 24% 18% 4%
<strong>Special</strong> EUROBAROMETER 273 “European Social Reality” Report<br />
3. Other <strong>social</strong> realities<br />
This chapter focuses on two further important <strong>social</strong> realities of the European Union:<br />
firstly, poverty and <strong>social</strong> exclusion, and secondly immigration.<br />
3.1 Poverty and <strong>social</strong> exclusion<br />
Poverty and <strong>social</strong> exclusion is a <strong>social</strong> reality faced by a considerable number of<br />
European Union citizens.<br />
Even if citizens are not necessarily personally affected, poverty is something that<br />
many feel could happen to them. Over 6 out of 10 Europeans believe that anyone is<br />
at risk of poverty at some time in their lives (62%), while only around 3 out of 10<br />
believe that the risk of poverty is confined to certain groups (29%) 44 .<br />
44 QA23. Which of these statements comes closest to your view?<br />
- 60 -
<strong>Special</strong> EUROBAROMETER 273 “European Social Reality” Report<br />
Support for the view that anyone is at risk of poverty at some time in their lives does<br />
not vary greatly depending on people’s socio-demographic profile. Manual workers<br />
are most likely to take this view (68%) while retired people (56%) are least likely to<br />
agree.<br />
EU25<br />
Female<br />
Male<br />
Aged 25-39<br />
Aged 40-54<br />
Aged 15-24<br />
Aged 55+<br />
Tea: 16-19<br />
Tea: 20+<br />
Tea: 15-<br />
Manual workers<br />
Unemployed<br />
Managers<br />
Other white collars<br />
House persons<br />
Students<br />
Self-employed<br />
Retired<br />
Small/mid size town<br />
Rural village<br />
Large town<br />
(1-4) Left<br />
(5-6) Centre<br />
(7-10) Right<br />
Which of these two statements comes closest to your view?<br />
(By Socio-demographics - EU25)<br />
The risk of poverty is confined to certain groups of people<br />
Anyone is at risk of poverty at some time in their lives<br />
29<br />
27<br />
31<br />
26<br />
27<br />
29<br />
33<br />
28<br />
30<br />
31<br />
24<br />
28<br />
29<br />
28<br />
26<br />
29<br />
30<br />
35<br />
29<br />
28<br />
31<br />
29<br />
28<br />
34<br />
- 61 -<br />
62<br />
64<br />
60<br />
65<br />
65<br />
63<br />
57<br />
64<br />
63<br />
59<br />
68<br />
66<br />
65<br />
63<br />
63<br />
62<br />
59<br />
56<br />
63<br />
62<br />
60<br />
64<br />
64<br />
58
<strong>Special</strong> EUROBAROMETER 273 “European Social Reality” Report<br />
Conversely, at the country level very large differences exist about the risk of<br />
poverty. In France, the view that anyone is at risk of poverty at some time in their<br />
lives receives by far most widespread support (86%) but also in Hungary,<br />
Luxembourg, Latvia (all 74%) and Portugal (73%) there is broad consensus. In<br />
Finland (48%) Sweden (47%) and Malta (45%), on the other hand, the majority<br />
view is that the risk of poverty is confined to certain groups.<br />
- 62 -
<strong>Special</strong> EUROBAROMETER 273 “European Social Reality” Report<br />
Poverty is thus perceived to be a realistic possibility in European society. In fact, one<br />
European in four feels that there is a risk that he or she could personally fall into<br />
poverty (25%) 45 .<br />
Europeans who feel that anyone is at risk of falling into poverty at some time in their<br />
lives, are more likely to estimate that they themselves might fall into poverty (28%)<br />
than are people who feel that the risk of poverty is confined to certain groups (21%).<br />
"I feel there is a risk that I<br />
could fall into poverty"<br />
EU25<br />
Anyone is at risk of<br />
poverty at some<br />
time in their<br />
- 63 -<br />
The risk of poverty<br />
is confined to<br />
certain groups<br />
Agree 25% 28% 21%<br />
Disagree 54% 49% 62%<br />
Neither or DK 21% 23% 16%<br />
Total 100% 100% 100%<br />
Who are the people that believe they are most at risk of falling into poverty, that is<br />
to say, who are the vulnerable groups in European society?<br />
Being unemployed appears to be the most important risk factor when it comes to<br />
poverty. Close to half of Europeans who are unemployed feel that there is a risk that<br />
they could fall into poverty (44%). Other groups with significantly higher than<br />
average numbers feeling at risk are those who left full-time education before turning<br />
16 and people in the ages of 40 to 54.<br />
These results further highlight why unemployment is the main concern of Europeans<br />
and why education is seen as the most important thing in order to get ahead in life.<br />
45 QA22-3. To what extent do you agree or disagree with the following statements?
<strong>Special</strong> EUROBAROMETER 273 “European Social Reality” Report<br />
I feel that there is a risk that I could fall into poverty<br />
(by Socio-demographics, EU25)<br />
Female<br />
Male<br />
Aged 40-54<br />
Aged 25-39<br />
Aged 55+<br />
Aged 15-24<br />
Tea: 15-<br />
Tea: 16-19<br />
Tea: 20+<br />
Unemployed<br />
House persons<br />
Manual workers<br />
Retired<br />
Self-employed<br />
Other white collars<br />
Students<br />
Managers<br />
Large town<br />
Small/mid size<br />
Rural village<br />
18%<br />
28%<br />
28%<br />
25%<br />
23%<br />
21%<br />
18%<br />
14%<br />
- 64 -<br />
26%<br />
24%<br />
25%<br />
23%<br />
21%<br />
30%<br />
27%<br />
27%<br />
25%<br />
24%<br />
However, it is to be noted that people who feel they are at risk of falling into poverty<br />
are far less likely to regard education as the key to success than are people who do<br />
not feel at risk. Conversely, they far more often believe that coming from a wealthy<br />
family matters most.<br />
"Most important things<br />
for getting ahead in life<br />
EU25<br />
Respondents<br />
agreeing that<br />
there is a risk that<br />
they could fall<br />
into poverty<br />
30%<br />
Respondents<br />
disagreeing that<br />
there is a risk that<br />
they could fall<br />
into poverty<br />
Education 62% 54% 68%<br />
Working hard 45% 42% 47%<br />
Knowing the right<br />
people<br />
26% 28% 25%<br />
Being lucky 24% 27% 23%<br />
Being smart 17% 16% 19%<br />
Coming from a wealthy<br />
family<br />
9% 13% 6%<br />
Being a man 2% 3% 2%<br />
44%
<strong>Special</strong> EUROBAROMETER 273 “European Social Reality” Report<br />
The extent to which the perceived risk of falling into poverty varies among the<br />
Member States provides further insight into why in some countries the mood is more<br />
pessimistic than in others.<br />
- 65 -
<strong>Special</strong> EUROBAROMETER 273 “European Social Reality” Report<br />
Furthermore, the survey shows that on average one European in ten feels left out of<br />
society (9%) and one European in seven feels looked down upon because of his or<br />
her income or job situation (15%) 46 .<br />
In socio-demographic terms, more than any other group, the unemployed are by far<br />
the most likely to feel <strong>social</strong>ly excluded.<br />
To what extent do you agree with the following statements? (by<br />
SD's, EU25)<br />
Unemployed<br />
Manual workers<br />
Self-employed<br />
House persons<br />
Students<br />
Other white collars<br />
Retired<br />
Managers<br />
TEA: 16-19<br />
TEA:15-<br />
TEA:20+<br />
Aged 25-39<br />
Aged 15-24<br />
Aged 40-54<br />
Aged 55+<br />
Some people look down on me because of my income or job situation<br />
I feel left out of society<br />
4%<br />
6%<br />
6%<br />
8%<br />
8%<br />
9%<br />
9%<br />
9%<br />
10%<br />
10%<br />
10%<br />
10%<br />
11%<br />
10%<br />
9%<br />
- 66 -<br />
14%<br />
13%<br />
13%<br />
13%<br />
15%<br />
14%<br />
13%<br />
13%<br />
46 QA22-1 and QA22-2. To what extent do you agree or disagree with the following statements?<br />
16%<br />
16%<br />
17%<br />
17%<br />
17%<br />
22%<br />
28%
<strong>Special</strong> EUROBAROMETER 273 “European Social Reality” Report<br />
In most Member States only around 1 person in 10 feels left out of society. However,<br />
higher rates are noted in the following countries: Italy has the highest proportion of<br />
people who feel left out of society, together with Bulgaria (both 21%). (Nearly the<br />
same proportions are noted In Lithuania (19%) and Hungary (18%). In Romania<br />
(15%), Austria (13%), Belgium and the United Kingdom (both 11%) just over 1<br />
person in 10 feels left out of society.<br />
- 67 -
<strong>Special</strong> EUROBAROMETER 273 “European Social Reality” Report<br />
3.2 Immigration<br />
The overall picture is that European Union citizens have balanced views about<br />
immigration: while many respondents express insecurity when it comes to the<br />
presence of people from other ethnic groups, particularly with regards to<br />
unemployment (46%), the majority feels that immigrants enrich the cultural life of<br />
their country (54%) and a relative majority feel that immigrants are needed to work<br />
in certain sectors of the economy 47 . Less than a third of the European Union citizens<br />
believe that the arrival of immigrants can efficiently solve the problem of the<br />
Europe's ageing population.<br />
The question of immigration<br />
(% tend to agree – EU 25)<br />
People from other ethnic groups are<br />
enriching the cultural life of (OUR<br />
COUNTRY)<br />
We need immigrants to work in certain<br />
sectors of our economy<br />
The presence of people from other<br />
ethnic groups increases unemployment<br />
in (OUR COUNTRY)<br />
The presence of people from other<br />
ethnic groups is a cause of insecurity<br />
The arrival of immigrants in Europe can<br />
efficiently solve the problem of Europe’s<br />
ageing population<br />
- 68 -<br />
42%<br />
32%<br />
54%<br />
48%<br />
46%<br />
30%<br />
38%<br />
40%<br />
41%<br />
11% 5%<br />
9% 5%<br />
9% 5%<br />
13% 4%<br />
48% 9% 11%<br />
0% 20% 40% 60% 80% 100%<br />
Tend to agree Tend to disagree It depends (SPONTANEOUS) DK<br />
Underneath this overall picture lies a more complicated structure, with views about<br />
immigration varying depending on people’s socio-economic status, their general<br />
outlook on life and the country they live in.<br />
For ease of presentation, we will compare the Member States and the other variables<br />
using a scale constructed of the five immigration items. The scale runs from 1 to 3<br />
and the closer the figure is to 3 the more positive the attitude towards immigrants is.<br />
The balanced overall picture is further evident from the EU25 average scale score of<br />
2.<br />
At the socio-demographic level, views about immigrants vary most depending on the<br />
age at which people left full-time education: the longer people stayed in school, the<br />
more positive their attitudes about immigrants tend to be.<br />
47<br />
The concept of immigration was measured by 5 items at QA25 (“For each of the following statements,<br />
please tell me whether you tend to agree or tend to disagree?”).
<strong>Special</strong> EUROBAROMETER 273 “European Social Reality” Report<br />
Age is another important factor: the younger people are, the more positive their<br />
attitudes about immigrants tend to be. People’s attitudes only vary slightly<br />
depending on whether or not in their country they belong to a majority group or<br />
minority group in terms of race, religion or culture 48 .<br />
The immigration scale: mean scores by<br />
socio-demographics (EU25)<br />
- 69 -<br />
Mean<br />
EU25 2.02<br />
Male 2.02<br />
Female 2.02<br />
Aged 15-24 2.07<br />
Aged 25-39 2.07<br />
Aged 40-54 2.05<br />
Aged 55+ 1.94<br />
TEA: 20+ 2.24<br />
TEA: 16-19 1.97<br />
TEA: 15- 1.86<br />
Managers 2.23<br />
Students 2.14<br />
Self-employed 2.06<br />
Manual workers 1.98<br />
House person 1.97<br />
Unemployed 1.94<br />
Retired 1.92<br />
Large town 2.09<br />
Small or middle sized town 2.02<br />
Rural area or village 1.97<br />
Belongs to majority group 2.03<br />
Belongs to minority group 1.97<br />
48 QA24 Do you personally have the feeling that you belong in (OUR COUNTRY) to one of the majority<br />
groups or one of the minority groups in terms of race, religion or culture? 64% of respondents feel they<br />
belong to a majority group and 11% to a minority group. 21% of respondents spontaneously answered<br />
that they feel they do not belong to any group and 4% lacked an opinion. The distribution of responses in<br />
each Member State can be found in the tables in the annexes.
<strong>Special</strong> EUROBAROMETER 273 “European Social Reality” Report<br />
Although people’s views about immigration vary less strongly on the basis of their<br />
general outlook on life, there are nonetheless clear differences. People who place<br />
themselves on the left of the political spectrum score highest on the scale. The 14%<br />
of citizens who regard immigration as one of the three top concerns in their country<br />
score lowest on the scale.<br />
The immigration scale: mean scores by<br />
respondent’s general outlook on life (EU25)<br />
- 70 -<br />
Mean<br />
EU25 2.02<br />
Political orientation: left 2.17<br />
Political orientation: centre 2.02<br />
Political orientation: right 1.89<br />
Does not trust political institutions 1.95<br />
Trusts 3 political institutions 2.15<br />
Trusts 2 political institutions 2.15<br />
Trusts 1 political institution 2.08<br />
Trusts no political institutions 1.95<br />
Feels happy 2.04<br />
Does not feel happy 1.86<br />
Feels safe 2.08<br />
Feels unsafe 1.89<br />
Country’s employment situation will be better 2.15<br />
Country’s economic situation will be better 2.14<br />
Personal job situation will be better 2.11<br />
Household’s financial situation will be better 2.10<br />
Life in general will be better 2.08<br />
Household’s financial situation will be worse 1.92<br />
Country’s economic situation will be worse 1.91<br />
Personal job situation will be worse 1.90<br />
Country’s employment situation will be worse 1.89<br />
Life in general will be worse 1.88<br />
Does not feel at risk of falling into poverty 2.07<br />
Feels at risk of falling into poverty 1.94<br />
Confident about pensions 2.05<br />
Not confident about pensions 2.00<br />
Immigration is not top three issue of concern 2.06<br />
Immigration is top three issue of concern 1.77
<strong>Special</strong> EUROBAROMETER 273 “European Social Reality” Report<br />
The largest variation in scale averages is found between the Member States. On<br />
average, people in Finland, Sweden and Denmark tend to hold the most positive<br />
views about immigration while people in Malta, Greece and Cyprus score lowest on<br />
the scale.<br />
The immigration scale: Member States'<br />
mean scores<br />
- 71 -<br />
Mean<br />
EU25 2.02<br />
FI 2.33<br />
SE 2.32<br />
DK 2.24<br />
LU 2.19<br />
FR 2.18<br />
NL 2.17<br />
ES 2.10<br />
PL 2.10<br />
DE 2.03<br />
EE 2.04<br />
IE 2.04<br />
BE 1.99<br />
SL 1.98<br />
PT 1.97<br />
LV 1.95<br />
UK 1.95<br />
LT 1.92<br />
AT 1.90<br />
IT 1.90<br />
SK 1.81<br />
CZ 1.81<br />
HU 1.78<br />
CY 1.70<br />
EL 1.68<br />
MT 1.52<br />
RO 1.99<br />
BG 1.79
<strong>Special</strong> EUROBAROMETER 273 “European Social Reality” Report<br />
4. Choices and solutions<br />
In this final chapter we focus on some possible choices and solutions that were put<br />
to respondents as part of the study.<br />
4.1 Pensions<br />
The study has shown that Europeans are worried about the future of their pensions.<br />
There are various measures that can be taken to guarantee the financing of the<br />
pension system at the national level. In this study, respondents who were currently<br />
in work were asked to choose from three possibilities 49 .<br />
The most favoured option among the European workforce is to maintain the<br />
retirement age and increase <strong>social</strong> security contributions (32%). People are less<br />
interested in working longer (22%) and the idea of receiving less is most unpopular<br />
(12%). It is to be noted that a significant minority of European workers favours none<br />
of the presented options (20%).<br />
Furthermore, the offered solutions are less popular among workers who lack<br />
confidence in the future of their pension (this applies to 59% of the European<br />
workforce) than they are among workers who have faith in the future of their<br />
pensions (38% of the workers). In fact, nearly a quarter of workers who lack<br />
confidence in the future of their pensions favour none of the offered solutions (24%)<br />
against just over one-tenth of workers who do feel confident (13%) 50 .<br />
49 (Asked IF CURRENTLY IN WORK) QA16b If you had to choose from the following possibilities aimed at<br />
guaranteeing the financing of the pension system in (OUR COUNTRY), which one would be most<br />
acceptable to you?<br />
50 See Chapter 1 for the country and socio-demographic result of QA15.<br />
- 72 -
<strong>Special</strong> EUROBAROMETER 273 “European Social Reality” Report<br />
QA16b. If you had to choose from the<br />
following possibilities aimed at<br />
guaranteeing the financing of the<br />
pension in (OUR COUNTRY), which one<br />
would be most acceptable to you?<br />
- 73 -<br />
EU25<br />
workforce<br />
Workers who<br />
are not<br />
confident<br />
about the<br />
future of<br />
pensions<br />
Workers who<br />
are confident<br />
about the<br />
future of<br />
pensions<br />
Work and contribute for longer 22% 19% 27%<br />
Maintain the retirement age and increase<br />
your <strong>social</strong> security contributions<br />
Maintain the current retirement age and<br />
accept that you will receive less<br />
32% 31% 36%<br />
12% 12% 12%<br />
None of these (SPONTANEOUS) 20% 24% 13%<br />
A combination of all three<br />
(SPONTANEOUS)<br />
6% 5% 6%<br />
DK 8% 8% 7%<br />
100% 100% 100%<br />
Support for the various solutions differs significantly from country to country. In<br />
Cyprus and Denmark, over half of the workforce favours the possibility of increasing<br />
the <strong>social</strong> security contributions (55% and 54%, respectively). In the other countries<br />
people are less in favour of this option with lowest support found in Hungary,<br />
Portugal (both 23%) and Romania (24%).<br />
The idea of working and contributing for longer is welcomed by close to a third of the<br />
labour force in Finland and the United Kingdom (both 31%) but rejected in Greece<br />
(6%), and Slovenia (9%).<br />
There are four countries where the majority view is that none of the three offered<br />
solutions is acceptable. These are Greece (42%), Portugal (35%), Latvia (33%) and<br />
Hungary (31%).<br />
Finally, the proportion of workers lacking an opinion varies greatly and ranges from<br />
nobody in Greece to 24% in Romania.
<strong>Special</strong> EUROBAROMETER 273 “European Social Reality” Report<br />
(IF CURRENTLY IN WORK) qA16b If you had to choose from the following aimed at<br />
guaranteeing the financing the pension system in (OUR COUNTRY), which one would be most<br />
acceptable for you?<br />
% by<br />
country<br />
Work and<br />
contribute<br />
longer<br />
Maintain the<br />
retirement<br />
age and<br />
increase your<br />
<strong>social</strong> security<br />
contributions<br />
Maintain the<br />
current<br />
retirement<br />
age and<br />
accept that<br />
you will<br />
receive less<br />
- 74 -<br />
None of these<br />
(Spontaneous)<br />
A combination<br />
of all three<br />
(Spontaneous)<br />
EU25 22% 32% 12% 20% 6% 8%<br />
BE 23% 33% 17% 20% 6% 1%<br />
CZ 12% 28% 19% 24% 9% 8%<br />
DK 23% 54% 13% 5% 2% 3%<br />
DE 16% 33% 21% 22% 4% 4%<br />
EE 14% 39% 11% 17% 7% 12%<br />
EL 6% 35% 11% 42% 6% 0%<br />
ES 26% 28% 7% 19% 6% 14%<br />
FR 28% 29% 11% 24% 5% 3%<br />
IE 22% 35% 4% 8% 17% 14%<br />
IT 22% 27% 6% 22% 8% 15%<br />
CY 12% 55% 3% 17% 6% 7%<br />
LV 13% 31% 13% 33% 4% 6%<br />
LT 19% 42% 12% 18% 0% 9%<br />
LU 19% 39% 17% 15% 3% 7%<br />
HU 12% 23% 13% 31% 12% 9%<br />
MT 21% 45% 5% 13% 8% 8%<br />
NL 25% 37% 20% 8% 4% 6%<br />
AT 16% 27% 17% 17% 15% 8%<br />
PL 25% 26% 10% 20% 2% 17%<br />
PT 17% 23% 3% 35% 9% 13%<br />
SI 9% 30% 15% 30% 10% 6%<br />
SK 14% 42% 9% 17% 5% 13%<br />
FI 31% 47% 9% 11% 1% 1%<br />
SE 21% 38% 11% 12% 7% 11%<br />
UK 31% 43% 9% 8% 4% 5%<br />
BG 21% 31% 3% 16% 13% 16%<br />
RO 22% 24% 7% 13% 10% 24%<br />
DK
<strong>Special</strong> EUROBAROMETER 273 “European Social Reality” Report<br />
Finally, the study shows that respondents who are currently not working understand<br />
the opinions of their working counterparts very well 51 . The main difference is that<br />
this group of respondents more often lacks an opinion than the working respondents<br />
do on this issue (15% vs. 8%).<br />
51 QA16d (asked of respondents not currently working and not retired): According to you, which of the<br />
following possibilities aimed at guaranteeing the financing of the pension system in (OUR COUNTRY),<br />
would be most acceptable to someone working?<br />
- 75 -
<strong>Special</strong> EUROBAROMETER 273 “European Social Reality” Report<br />
4.2 The <strong>social</strong> welfare system<br />
Overall European Union citizens are satisfied with the quality of the <strong>social</strong> welfare<br />
system in their country, with 51% finding that it provides wide enough coverage 52 .<br />
However, the majority of Europeans find the welfare system in their country too<br />
expensive (53%).<br />
Our <strong>social</strong> welfare system…<br />
Is too expensive for the<br />
(NATIONALITY) society<br />
Provides wide enough<br />
coverage<br />
Could serve as a model<br />
for other countries<br />
Quality of the welfare system<br />
(% it applies to – EU25)<br />
Satisfaction with the national welfare systems is most widespread in Luxembourg<br />
and France, where around three quarters of citizens feeling that it provides wide<br />
enough coverage (75% and 74%, respectively). In the majority of the Western<br />
European countries, satisfaction levels are also widespread, although in Portugal<br />
people clearly disagree as only 1 citizen in 10 feels that it provides wide enough<br />
coverage. In many Eastern European countries, the feeling that the <strong>social</strong> welfare<br />
system provides wide enough coverage is held by only a minority of citizens, with<br />
particular low satisfaction levels noted in Latvia (18%), Poland (19%) and Cyprus<br />
(20%). Satisfaction levels are also low in the two newest Member States and<br />
particularly so in Bulgaria. Here only 8% of people feel their <strong>social</strong> welfare system<br />
provides wide enough coverage.<br />
52<br />
QA20 For each of the following please tell me whether you think it applies to the (NATIONALITY) <strong>social</strong><br />
welfare system? Our <strong>social</strong> welfare system …<br />
- 76 -<br />
42%<br />
53%<br />
51%
<strong>Special</strong> EUROBAROMETER 273 “European Social Reality” Report<br />
Overall, over two-fifths of European Union citizens feel that their welfare system<br />
could serve as a model for other countries (42%). This belief is most widely held in<br />
Finland (79%) and Denmark (78%) and least widely so in Portugal (5%), Latvia<br />
(6%) and Greece (8%). In Romania and Bulgaria this view is shared by respectively<br />
7% and 2% of respondents.<br />
People’s propensity to feel that their country’s <strong>social</strong> welfare system could serve as a<br />
model for other countries is strongly related to whether they feel it provides enough<br />
coverage. Their propensity to feel that their country’s <strong>social</strong> welfare system could<br />
serve as a model for other countries is less directly related to how they think about<br />
the cost of the system.<br />
- 77 -
<strong>Special</strong> EUROBAROMETER 273 “European Social Reality” Report<br />
% could serve as a model<br />
% could serve as a model<br />
90%<br />
80%<br />
70%<br />
60%<br />
50%<br />
40%<br />
30%<br />
20%<br />
Relationship between satisfaction with welfare system and feeling<br />
that it could serve as a model for other countries (in %, by<br />
country)<br />
IT<br />
- 78 -<br />
SE<br />
IE<br />
MT<br />
SI<br />
DE<br />
NL<br />
ES<br />
DK<br />
AT<br />
UK<br />
FI<br />
FR<br />
BE<br />
10%<br />
0%<br />
BG PT<br />
PL<br />
LV<br />
LT<br />
CY EE<br />
RO<br />
SK<br />
EL<br />
HU<br />
CZ<br />
0% 10% 20% 30% 40% 50% 60% 70% 80% 90%<br />
90%<br />
80%<br />
70%<br />
60%<br />
50%<br />
40%<br />
30%<br />
20%<br />
% provides enough coverage<br />
Relationship between cost of the welfare system and feeling that it<br />
could serve as a model for other countries (in %, by country)<br />
LU<br />
DK<br />
FI<br />
AT<br />
IE<br />
ES<br />
NL<br />
SE<br />
IT<br />
10%<br />
0%<br />
CY<br />
BG<br />
EE<br />
RO<br />
LT<br />
SK<br />
LV<br />
CZ<br />
PT<br />
EL<br />
PL HU<br />
0% 10% 20% 30% 40% 50% 60% 70% 80% 90%<br />
UK<br />
SI<br />
% is too expensive<br />
MT<br />
BE<br />
FR<br />
DE<br />
LU
<strong>Special</strong> EUROBAROMETER 273 “European Social Reality” Report<br />
% Applies<br />
fairly well<br />
by country<br />
Our <strong>social</strong> welfare system…<br />
Provides<br />
wide<br />
enough<br />
coverage<br />
- 79 -<br />
Could<br />
serve as a<br />
model for<br />
other<br />
countries<br />
Is too<br />
expensive<br />
EU25 51% 42% 53%<br />
BE 72% 70% 57%<br />
CZ 45% 15% 60%<br />
DK 66% 78% 30%<br />
DE 55% 40% 65%<br />
EE 23% 10% 30%<br />
EL 32% 8% 66%<br />
ES 61% 47% 36%<br />
FR 74% 73% 65%<br />
IE 51% 32% 33%<br />
IT 36% 28% 42%<br />
CY 20% 11% 25%<br />
LV 18% 6% 57%<br />
LT 22% 13% 42%<br />
LU 75% 64% 26%<br />
HU 39% 11% 72%<br />
MT 48% 30% 54%<br />
NL 59% 63% 42%<br />
AT 64% 58% 33%<br />
PL 19% 8% 67%<br />
PT 10% 5% 59%<br />
SI 49% 23% 49%<br />
SK 30% 10% 52%<br />
FI 68% 79% 32%<br />
SE 47% 62% 43%<br />
UK 64% 53% 46%<br />
BG 8% 2% 24%<br />
RO 22% 7% 29%
<strong>Special</strong> EUROBAROMETER 273 “European Social Reality” Report<br />
4.3 Education<br />
Europeans regard education as the key to success. Yet, public opinion appears to be<br />
divided in terms of granting everyone equal access to higher education. In fact,<br />
Europeans are slightly more inclined to believe that places of higher education must<br />
be able to select students on the basis of their grades and motivation than to believe<br />
that places of higher education must be open to all students (47% vs. 43%) 53 .<br />
Furthermore, one out of two Europeans who regard getting a good education as one<br />
of the two most important things for getting ahead in life believes that places of<br />
higher education must be able to select students (50%) while 43% believe in equal<br />
access for students.<br />
QA27. Which of the following two opinions comes<br />
closest to your view?<br />
Places of higher education must be open to all<br />
students who have completed the secondary<br />
education, regardless of grades and motivation<br />
- 80 -<br />
EU25<br />
Getting a good<br />
education is<br />
one of two<br />
most<br />
important<br />
things<br />
Getting a good<br />
education is<br />
not one of two<br />
most<br />
important<br />
things<br />
43% 43% 44%<br />
Places of higher education must be able to select<br />
students on the basis of their grades and<br />
motivation<br />
47% 50% 43%<br />
Neither (SPONTANEOUS) 4% 4% 5%<br />
DK 6% 4% 8%<br />
100% 100% 100%<br />
53 QA27. Which of the following two opinions comes closest to your view?
<strong>Special</strong> EUROBAROMETER 273 “European Social Reality” Report<br />
Young Europeans form the socio-demographic group where the view that places of<br />
higher education must be open to all students is most popular (50%). The older<br />
Europeans are, the less they favour equal access. Managers are the group where the<br />
view that places of higher education must be able to select students is most widely<br />
held (60%).<br />
Which of these two statements comes closest to your view?<br />
(By SD's - EU25)<br />
Places of higher education must be able to select Places of higher education must be open<br />
EU25<br />
(1-4) Left<br />
(5-6) Centre<br />
(7-10) Right<br />
TEA: 16-19<br />
TEA: 15<br />
TEA: 20+<br />
Aged 15-24<br />
Aged 25-39<br />
Aged 40-54<br />
Aged 55 +<br />
Manual workers<br />
Unemployed<br />
House persons<br />
Other white collars<br />
Self-employed<br />
Retired<br />
Managers<br />
60<br />
50<br />
55<br />
56<br />
47<br />
47<br />
47<br />
44<br />
45<br />
48<br />
49<br />
48<br />
39<br />
42<br />
41<br />
42<br />
50<br />
49<br />
- 81 -<br />
43<br />
45<br />
42<br />
38<br />
45<br />
43<br />
38<br />
50<br />
47<br />
44<br />
37<br />
49<br />
48<br />
46<br />
45<br />
41<br />
37<br />
36
<strong>Special</strong> EUROBAROMETER 273 “European Social Reality” Report<br />
Views about equal access to higher education vary significantly among the Member<br />
States but in most countries the majority view is that places of higher education<br />
must be able to select students. Support for this view is particularly widespread in<br />
Sweden (69%). The only countries where the majority view is that places of<br />
education must be open to all students are Slovenia (58%), Belgium (55%), Italy<br />
(53%), Ireland, Luxembourg (both 52%), Spain (49%) and Austria (47%). Public<br />
opinion is divided on this issue in Poland, France and West Germany.<br />
EU25<br />
SI<br />
BE<br />
IT<br />
IE<br />
LU<br />
ES<br />
PL<br />
AT<br />
FR<br />
DE<br />
UK<br />
LV<br />
CY<br />
EE<br />
LT<br />
SK<br />
EL<br />
FI<br />
DK<br />
NL<br />
CZ<br />
PT<br />
MT<br />
SE<br />
HU<br />
RO<br />
BG<br />
Which of these two statements comes closest to your view?<br />
(By SD's - EU25)<br />
Places of higher education must be able to select Places of higher education must be open<br />
47<br />
32<br />
38<br />
31<br />
39<br />
38<br />
30<br />
46<br />
38<br />
47<br />
51<br />
53<br />
58<br />
59<br />
57<br />
57<br />
57<br />
62<br />
63<br />
62<br />
60<br />
59<br />
57<br />
63<br />
69<br />
63<br />
50<br />
55<br />
- 82 -<br />
43<br />
58<br />
55<br />
53<br />
52<br />
52<br />
49<br />
48<br />
47<br />
45<br />
43<br />
40<br />
39<br />
38<br />
36<br />
36<br />
36<br />
34<br />
34<br />
33<br />
33<br />
32<br />
28<br />
28<br />
27<br />
23<br />
28<br />
23
<strong>Special</strong> EUROBAROMETER 273 “European Social Reality” Report<br />
CONCLUSION<br />
Since its inception in 1973, the <strong>Eurobarometer</strong> has covered a wide array of questions<br />
that capture perceptions of <strong>social</strong>, economical, political and everyday life of European<br />
citizens. In order to measure all these dimensions at the same time and in all the<br />
Member States of the European Union, the European Commission launched this<br />
European Social Reality survey. The survey provides a wealth of information about<br />
the many <strong>social</strong> realities of European Union citizens at the end of 2006, and allows a<br />
good understanding of the <strong>social</strong> context Europeans live in nowadays.<br />
Overall, European Union citizens are happy with their personal life and relatively<br />
satisfied with their everyday life environment, notably with regards to the<br />
quality of life in the area where they live (86%), their standard of living (83%),<br />
travel facilities (78%), medical services (77%) and schools in their local area (71%).<br />
The family represents the cornerstone of European society and functions as<br />
the main source of support. However, a <strong>social</strong> reality of family life in the European<br />
Union at the end of 2006 is that men are still not doing their fair share of<br />
domestic chores.<br />
The level of job satisfaction is relatively high in the European Union. Workers<br />
feel that their job allows them to use their knowledge and skills (77%) and that they<br />
are required to keep learning (71%). Furthermore, empowerment at work is a reality<br />
for two thirds of the labour force. For a minority of employees, there is a downside<br />
to work: it is too demanding and stressful (41%) or carried out in dangerous and<br />
unhealthy conditions (21%). A very small group (14%) finds is difficult to balance<br />
their professional, family and private life. On the whole, the majority of people in<br />
work is confident that they are able to keep their job (85%) and a third<br />
considers it highly likely that they would find a similar job within six months if laidoff<br />
(33%). Career progression is less positively evaluated: 40% feel that their<br />
job offers good prospects for career advancement with close to half of the labour<br />
force finding that in order to progress they need to follow more specialised training<br />
(46%).<br />
Leisure time is very important to Europeans. In fact, they find it more important<br />
than work (90% vs. 84%). Helping others or doing voluntary work is also considered<br />
important (79%). However, most Europeans do not actively participate or do<br />
voluntary work, at least not in or for any of the 14 organisations covered in the<br />
survey (64%).<br />
Politics is considered important by only 43% of European Union citizens. Overall,<br />
Europeans convey relatively little trust in the political institutions that govern<br />
them. The more distant the political entity, the less the trust: On average, less than<br />
a third of EU citizens trust their country’s national political system (government and<br />
parliament) and even fewer citizens have faith in political parties.<br />
Overall, European Union citizens appear fairly critical about collective life. The<br />
tendency of EU citizens to distrust public institutions may help explain why<br />
around a third of EU citizens expect the next twelve months to be worse when it<br />
comes to the economic situation and the employment situation in their<br />
country (34% and 33%, respectively). The same critical stance towards collective life<br />
is apparent from the contradiction that while people in work are confident that they<br />
will keep their job, EU citizens are most concerned about unemployment (36%).<br />
- 83 -
<strong>Special</strong> EUROBAROMETER 273 “European Social Reality” Report<br />
Apart from unemployment, Europeans also express concern about the cost of<br />
living (35%) and pensions (30%). In fact, only 42% of citizens are confident<br />
about the future of their pension. These three issues not only represent the main<br />
current concerns, they also form the top three concerns for the next generation. The<br />
extent to which unemployment is a concern for the next generation is in fact even<br />
more widespread (40%).<br />
Overall, Europeans have balanced views about immigration: while many<br />
respondents express insecurity when it comes to the presence of people from other<br />
ethnic groups, particularly with regards to unemployment (46%), the majority<br />
feels that immigrants enrich the cultural life of their country (54%).<br />
Poverty and <strong>social</strong> exclusion is a reality identified by a considerable number of<br />
European Union citizens. The survey reveals that a quarter of European Union<br />
citizens feel at risk of falling into poverty and 62% believe that anyone is at risk of<br />
poverty sometime in their life. Being unemployed is perceived to be the most<br />
important risk when it comes to poverty. Close to half of Europeans who are<br />
unemployed feel that there is a risk that they could fall into poverty (44%). The<br />
burden of unemployment is further apparent in that this group of Europeans is most<br />
inclined to feel left out of society (22%) and to feel looked down on because of their<br />
income or job situation (28%). Unemployment, thus, appears to be the factor<br />
or concern that explains the schism in opinion of European Union citizens<br />
between their personal future and the collective future of their country.<br />
It also helps explain why European Union citizens widely consider getting a good<br />
education and working hard as the two most important things for getting<br />
ahead in life (62% and 45%, respectively). Nonetheless, 64% of European Union<br />
citizens are of the view that the life of those who are children today will be<br />
more difficult than the life of their own generation.<br />
The survey also put forward a number of possible solutions and asked respondents to<br />
make choices.<br />
♦ When it comes to guaranteeing the financing of the national pension<br />
systems, the most favoured option among European workers is to maintain<br />
the retirement age and increase <strong>social</strong> security contributions (32%).<br />
Respondents who are not currently in work share this view (30%). It is to be<br />
noted that a significant minority of European workers favours none of the<br />
three presented options (20%).<br />
♦ On average, 53% of EU citizens find their country’s <strong>social</strong> welfare system too<br />
expensive but 51% believe that it provides wide enough coverage. The<br />
perceived quality of the national <strong>social</strong> welfare system is linked to whether<br />
people want their system to serve as a model for other countries. The<br />
perceived cost of the system is a less relevant factor in this regard. In total,<br />
42% of Europeans find that their country’s <strong>social</strong> welfare system<br />
could serve as a model for other countries.<br />
- 84 -
<strong>Special</strong> EUROBAROMETER 273 “European Social Reality” Report<br />
♦ Even though Europeans regard education as the most important key to<br />
success, public opinion is divided when it comes to granting everyone<br />
equal access to higher education. Europeans are slightly more inclined to<br />
believe that universities/places of higher education must be able to select<br />
students on the basis of their grades and motivation than to believe that<br />
places of higher education must be open to all students (47% vs. 43%).<br />
Geographically, the survey points to a plurality of <strong>social</strong> realities among the<br />
Member States. To a degree the diversity stems from differences in the perceived<br />
quality and standard of living. Herewith an insight into some of the <strong>social</strong> realities, in<br />
Member states:<br />
♦ Hungary and the three Baltic States score comparatively low when it comes to<br />
satisfaction with the standard of living and correspondingly people are less<br />
inclined to feel happy. In these countries, people express stronger<br />
dissatisfaction regarding their everyday life environment and widespread<br />
concern about issues that affect them directly, like the cost of living and the<br />
health care system.<br />
♦ Conversely, in countries with higher standard of living satisfaction levels (such<br />
as Denmark 95%, the Netherlands and Sweden 94%, the UK 93%, Ireland<br />
92%), primary issues like unemployment are less of a concern and people<br />
worry about things that do not necessarily affect them immediately or<br />
directly. Swedish respondents, for instance, most commonly mentioned the<br />
environment as the main concern for their country (45%) and their concern<br />
for the next generation when it comes to the environment is even more<br />
intense (63%). Equally, crime is the most widely expressed concern in the<br />
United Kingdom (41%) and in Ireland one respondent in two considers crime<br />
to be one of the three issues which currently concerns them the most.<br />
♦ Geographical distinctions also exist on most other dimensions covered by the<br />
survey. Work, for instance, is most widely seen as being important in the lives<br />
of people in France, Slovenia, Luxembourg and Italy (all 90% or higher)<br />
whereas in the United Kingdom (66%) and Ireland (69%) it is comparatively<br />
less important.<br />
♦ Last but not least, the survey shows that the two countries that joined the<br />
Union on 1 January 2007 are quite different from each other. While the <strong>social</strong><br />
realities of Romanians in many ways are similar to those of people living in<br />
the other Member States, life in Bulgaria appears to be decisively different.<br />
People in Bulgaria rate most aspects of life considerably less positive and only<br />
39% of Bulgarians claim to be happy compared to 87% of EU citizens.<br />
- 85 -
ANNEXES
TECHNICAL SPECIFICATIONS
SPECIAL EUROBAROMETER N°273<br />
“European Social Reality”<br />
TECHNICAL SPECIFICATIONS<br />
Between the 17 th of November and the 19 th of December 2006, TNS Opinion & Social, a consortium created between Taylor Nelson Sofres and EOS<br />
Gallup Europe, carried out wave 66.3 of the EUROBAROMETER, on request of the EUROPEAN COMMISSION, Directorate General Communication,<br />
“Public Opinion and Media Monitoring”.<br />
The SPECIAL EUROBAROMETER N°273 is part of wave 66.3 and covers the population of the respective nationalities of the European Union Member<br />
States, resident in each of the Member States and aged 15 years and over. The SPECIAL EUROBAROMETER N°273 has also been conducted in the two<br />
acceding countries (Bulgaria and Romania). In these countries, the survey covers the national population of citizens of the respective nationalities and<br />
the population of citizens of all the European Union Member States that are residents in those countries and have a sufficient command of one of the<br />
respective national language(s) to answer the questionnaire. The basic sample design applied in all states is a multi-stage, random (probability) one. In<br />
each country, a number of sampling points was drawn with probability proportional to population size (for a total coverage of the country) and to<br />
population density.<br />
In order to do so, the sampling points were drawn systematically from each of the "administrative regional units", after stratification by individual unit<br />
and type of area. They thus represent the whole territory of the countries surveyed according to the EUROSTAT NUTS II (or equivalent) and according<br />
to the distribution of the resident population of the respective nationalities in terms of metropolitan, urban and rural areas. In each of the selected<br />
sampling points, a starting address was drawn, at random. Further addresses (every nth address) were selected by standard "random route"<br />
procedures, from the initial address. In each household, the respondent was drawn, at random (following the "closest birthday rule"). All interviews<br />
were conducted face-to-face in people's homes and in the appropriate national language. As far as the data capture is concerned, CAPI (Computer<br />
Assisted Personal Interview) was used in those countries where this technique was available.
POPULATION<br />
15+<br />
FIELDWORK<br />
DATES<br />
N°<br />
INTERVIEWS<br />
COUNTRIES INSTITUTES<br />
ABBREVIATIONS<br />
BE Belgium TNS Dimarso 1.009 18/11/2006 11/12/2006 8.650.994<br />
CZ Czech Rep. TNS Aisa 1.150 23/11/2006 11/12/2006 8.571.710<br />
DK Denmark TNS Gallup DK 1.037 19/11/2006 19/12/2006 4.411.580<br />
DE Germany TNS Infratest 1.504 18/11/2006 11/12/2006 64.361.608<br />
EE Estonia Emor 1.000 21/11/2006 15/12/2006 887.094<br />
EL Greece TNS ICAP 1.000 17/11/2006 14/12/2006 8.693.566<br />
ES Spain TNS Demoscopia 1.000 21/11/2006 15/12/2006 37.024.972<br />
FR France TNS Sofres 1.012 17/11/2006 15/12/2006 44.010.619<br />
IE Ireland TNS MRBI 1.000 21/11/2006 19/12/2006 3.089.775<br />
IT Italy TNS Abacus 1.038 18/11/2006 13/12/2006 48.892.559<br />
CY Rep. of Cyprus Synovate 504 18/11/2006 12/12/2006 596.752<br />
LV Latvia TNS Latvia 1.019 24/11/2006 14/12/2006 1.418.596<br />
LT Lithuania TNS Gallup Lithuania 1.025 18/11/2006 12/12/2006 2.803.661<br />
LU Luxembourg TNS ILReS 502 17/11/2006 13/12/2006 374.097<br />
HU Hungary TNS Hungary 1.000 22/11/2006 10/12/2006 8.503.379<br />
MT Malta MISCO 500 17/11/2006 11/12/2006 321.114<br />
NL Netherlands TNS NIPO 1.020 17/11/2006 15/12/2006 13.030.000<br />
AT Austria Österreichisches Gallup-Institut 1.029 17/11/2006 10/12/2006 6.848.736<br />
PL Poland TNS OBOP 1.000 23/11/2006 12/12/2006 31.967.880<br />
PT Portugal TNS EUROTESTE 1.004 24/11/2006 15/12/2006 8.080.915<br />
SI Slovenia RM PLUS 1.019 17/11/2006 10/12/2006 1.720.137<br />
SK Slovakia TNS AISA SK 1.003 20/11/2006 05/12/2006 4.316.438<br />
FI Finland TNS Gallup Oy 1.028 17/11/2006 14/12/2006 4.348.676<br />
SE Sweden TNS GALLUP 1.014 18/11/2006 15/12/2006 7.486.976<br />
UK United Kingdom TNS UK 1.315 17/11/2006 13/12/2006 47.685.578<br />
BG Bulgaria TNS BBSS 1.023 19/11/2006 30/11/2006 6.671.699<br />
RO Romania TNS CSOP 1.000 19/11/2006 14/12/2006 18.173.179<br />
TOTAL 26.755 17/11/2006 19/12/2006 392.942.290
For each country a comparison between the sample and the universe was carried out. The Universe description was derived from Eurostat population<br />
data or from national statistics offices. For all countries surveyed, a national weighting procedure, using marginal and intercellular weighting, was<br />
carried out based on this Universe description. In all countries, gender, age, region and size of locality were introduced in the iteration procedure. For<br />
international weighting (i.e. EU averages), TNS Opinion & Social applies the official population figures as provided by EUROSTAT or national statistic<br />
offices. The total population figures for input in this post-weighting procedure are listed above.<br />
Readers are reminded that survey results are estimations, the accuracy of which, everything being equal, rests upon the sample size and upon the<br />
observed percentage. With samples of about 1,000 interviews, the real percentages vary within the following confidence limits:<br />
Observed percentages 10% or 90% 20% or 80% 30% or 70% 40% or 60% 50%<br />
Confidence limits ± 1.9 points ± 2.5 points ± 2.7 points ± 3.0 points ± 3.1 points
QUESTIONNAIRE
POSER QA UNIQUEMENT EN UE25 + BG + RO - LES AUTRES ALLER EN QB<br />
ASK QA ONLY IN EU25 + BG + RO - OTHERS GO TO QB<br />
Tout bien considéré, diriez-vous que vous êtes … ?<br />
QA1 Taking all things together would you say you are…?<br />
QA1<br />
(MONTRER CARTE - LIRE)<br />
(155) (155)<br />
1 Très heureux(se)<br />
1<br />
2 Assez heureux(se)<br />
2<br />
3 Pas très heureux(se)<br />
3<br />
4 Pas du tout heureux(se)<br />
4<br />
5 NSP<br />
5<br />
(SHOW CARD - READ OUT)<br />
Very happy<br />
Quite happy<br />
Not very happy<br />
Not at all happy<br />
DK<br />
EVS1999 Q4<br />
EVS1999 Q4<br />
Pour chacune des choses suivantes, pouvez-vous me dire dans quelle mesure elle est<br />
importante dans votre vie.<br />
QA2 Please say for each of the following how important it is in your life?<br />
QA2<br />
(MONTRER CARTE AVEC ECHELLE – UNE REPONSE PAR LIGNE)<br />
(SHOW CARD WITH SCALE - ONE ANSWER PER LINE)<br />
NSP<br />
Pas du<br />
tout<br />
important<br />
Pas très<br />
important<br />
Assez<br />
important<br />
(LIRE - ROTATION) Très<br />
important<br />
DK<br />
Not at all<br />
important<br />
Not very<br />
important<br />
Quite<br />
important<br />
(READ OUT – ROTATE) Very<br />
important<br />
Le travail 1 2 3 4 5<br />
Votre famille 1 2 3 4 5<br />
Les amis et relations 1 2 3 4 5<br />
Les loisirs 1 2 3 4 5<br />
La politique 1 2 3 4 5<br />
La religion 1 2 3 4 5<br />
Aider les autres ou faire du 1 2 3 4 5<br />
bénévolat (N)<br />
La santé (N) 1 2 3 4 5<br />
(156) 1 Work 1 2 3 4 5 (156) 1<br />
(157) 2 Your family 1 2 3 4 5 (157) 2<br />
3 Friends and acquaintances 1 2 3 4 5<br />
3<br />
(158)<br />
(158)<br />
(159) 4 Leisure time 1 2 3 4 5 (159) 4<br />
(160) 5 Politics 1 2 3 4 5 (160) 5<br />
(161) 6 Religion 1 2 3 4 5 (161) 6<br />
7 Helping others or voluntary 1 2 3 4 5<br />
7<br />
(162)<br />
work (N)<br />
(162)<br />
(163) 8 Health (N) 1 2 3 4 5 (163) 8<br />
EVS1999-2000 Q1 TREND MODIFIED<br />
EVS1999-2000 Q1 TREND MODIFIED<br />
BilingualQuestionnaireEB663 5/85 29/11/2006
Je vais maintenant vous lire différents aspects de la vie de tous les jours. Pour chacun d'entre<br />
eux, pouvez-vous me dire si, en ce qui vous concerne, vous le trouvez très satisfaisant, plutôt<br />
satisfaisant, plutôt pas satisfaisant ou pas du tout satisfaisant ? (M)<br />
QA3 I am now going to read out different aspects of everyday life. For each, could you tell me if this QA3<br />
aspect of your life is very satisfactory, fairly satisfactory, not very satisfactory or not at all<br />
satisfactory? (M)<br />
(MONTRER CARTE AVEC ECHELLE – UNE REPONSE PAR LIGNE)<br />
SHOW CARD WITH SCALE - ONE ANSWER PER LINE)<br />
NSP<br />
Pas du<br />
tout<br />
satisfaisan<br />
t<br />
Pas très<br />
satisfaisan<br />
t<br />
Plutôt<br />
satisfaisan<br />
t<br />
(LIRE) Très<br />
satisfaisan<br />
t<br />
DK<br />
Not at all<br />
satisfactor<br />
y<br />
Not very<br />
satisfactor<br />
y<br />
Fairly<br />
satisfactor<br />
y<br />
(READ OUT) Very<br />
satisfactor<br />
y<br />
1 Your house or flat 1 2 3 4 5<br />
1 Votre maison ou votre<br />
1 2 3 4 5<br />
(164)<br />
(164)<br />
appartement<br />
2 The quality of life in the area 1 2 3 4 5<br />
2 La qualité de vie là où vous 1 2 3 4 5<br />
(165)<br />
where you live (N)<br />
(165)<br />
vivez (N)<br />
(166) 3 Your standard of living 1 2 3 4 5 (166) 3 Votre niveau de vie 1 2 3 4 5<br />
4 Travel facilities for going to 1 2 3 4 5<br />
4 Vos moyens de transport 1 2 3 4 5<br />
work, shopping<br />
pour aller travailler, faire des<br />
(167)<br />
(167)<br />
courses<br />
(168) 5 Your state of health 1 2 3 4 5 (168) 5 Votre état de santé 1 2 3 4 5<br />
6 The time you have available 1 2 3 4 5<br />
6 Le temps dont vous<br />
1 2 3 4 5<br />
to do the things you want to<br />
disposez pour faire ce que<br />
(169)<br />
do (M)<br />
(169)<br />
vous voulez faire (M)<br />
7 The medical services in your 1 2 3 4 5<br />
7 Les services médicaux là où 1 2 3 4 5<br />
(170)<br />
local area<br />
(170)<br />
vous vivez<br />
8 The shopping facilities in 1 2 3 4 5<br />
8 Les magasins là où vous 1 2 3 4 5<br />
(171)<br />
your local area<br />
(171)<br />
vivez<br />
9 The job opportunities in your 1 2 3 4 5<br />
9 Les opportunités d’emploi là 1 2 3 4 5<br />
(172)<br />
local area<br />
(172)<br />
où vous vivez<br />
10 The childcare facilities in 1 2 3 4 5<br />
10 Les infrastructures pour les 1 2 3 4 5<br />
your local area (N)<br />
enfants là où vous vivez (N)<br />
(173)<br />
(173)<br />
11 The schools in your local 1 2 3 4 5<br />
11 Les écoles là où vous vivez 1 2 3 4 5<br />
(174)<br />
area (N)<br />
(174)<br />
(N)<br />
12 Leisure facilities in your town 1 2 3 4 5<br />
12 Les infrastructures de loisir 1 2 3 4 5<br />
(175)<br />
(N)<br />
(175)<br />
là où vous vivez (N)<br />
EB56.1 Q20 TREND MODIFIED<br />
EB56.1 Q20 TREND MODIFIED<br />
BilingualQuestionnaireEB663 6/85 29/11/2006
De qui recevriez-vous l'aide dans chacune des situations suivantes ? Pour chacune des<br />
situations, choisissez la personne la plus importante.<br />
QA4 From whom would you get support in each of the following situations? For each situation, QA4<br />
choose the most important person.<br />
(MONTRER CARTE AVEC ECHELLE – UNE REPONSE PAR LIGNE)<br />
(SHOW CARD WITH SCALE – ONE ANSWER PER LINE)<br />
NSP<br />
Pers<br />
onne<br />
Quel<br />
qu’u<br />
n<br />
d’aut<br />
re<br />
Un(e<br />
)<br />
voisi<br />
n(e)<br />
Un(e<br />
)<br />
ami(<br />
e)<br />
Un(e<br />
)<br />
collè<br />
gue<br />
de<br />
trava<br />
il<br />
Un<br />
mem<br />
bre<br />
de<br />
votre<br />
famill<br />
e<br />
DK (LIRE)<br />
Votr<br />
e<br />
parte<br />
naire<br />
Nob<br />
ody<br />
Som<br />
eone<br />
else<br />
Neig<br />
hbou<br />
r<br />
Frien<br />
d<br />
Wor<br />
k<br />
colle<br />
ague<br />
Fami<br />
ly<br />
mem<br />
ber<br />
Your<br />
partn<br />
er<br />
(READ OUT)<br />
1 Si vous aviez besoin d’aide à la maison 1 2 3 4 5 6 7 8<br />
parce que vous êtes malade<br />
2 Si vous aviez besoin d’un conseil pour 1 2 3 4 5 6 7 8<br />
une affaire personnelle ou familiale<br />
grave<br />
3 Si vous vous sentiez un peu déprimé(e) 1 2 3 4 5 6 7 8<br />
et aviez besoin de parler à quelqu’un<br />
(176)<br />
1 If you needed help around the house 1 2 3 4 5 6 7 8<br />
when ill<br />
2 If you needed advice about a serious 1 2 3 4 5 6 7 8<br />
personal or family matter<br />
(176)<br />
(177)<br />
(177)<br />
3 If you were feeling a bit depressed and 1 2 3 4 5 6 7 8<br />
wanting someone to talk to<br />
(178)<br />
(178)<br />
4 Si vous aviez besoin rapidement d’une 1 2 3 4 5 6 7 8<br />
grosse somme d’argent pour faire face à<br />
une urgence (M)<br />
(179)<br />
4 If you needed to urgently raise an 1 2 3 4 5 6 7 8<br />
important sum of money to face an<br />
emergency (M)<br />
(179)<br />
EQLS2003 Q36 TREND MODIFIED<br />
EQLS2003 Q36 TREND MODIFIED<br />
BilingualQuestionnaireEB663 7/85 29/11/2006
Dans la liste suivante, quelles sont, selon vous, les 2 choses les plus importantes pour réussir<br />
dans la vie ?<br />
QA5 In your opinion, out of the following, which are the 2 most important things for getting ahead in QA5<br />
life?<br />
(MONTRER CARTE - LIRE - MAX. 2 REPONSES)<br />
(180-188) (180-188)<br />
1, Recevoir une bonne instruction<br />
1,<br />
2, Travailler dur<br />
2,<br />
3, Venir d’une famille aisée<br />
3,<br />
4, Connaître les bonnes personnes<br />
4,<br />
5, Etre un homme<br />
5,<br />
6, Avoir de la chance<br />
6,<br />
7, Etre intelligent(e), futé(e)<br />
7,<br />
8, Autre (SPONTANE)<br />
8,<br />
9, NSP<br />
9,<br />
(SHOW CARD - READ OUT – MAX. 2 ANSWERS)<br />
Getting a good education<br />
Working hard<br />
Coming from a wealthy family<br />
Knowing the right people<br />
Being a man<br />
Being lucky<br />
Being smart<br />
Other (SPONTANEOUS)<br />
DK<br />
NEW<br />
NEW<br />
POSER QA6 SI "MARIE(E), REMARIE(E) OU VIVANT EN COUPLE", CODE 1 à 3 en D7 -<br />
LES AUTRES ALLER EN QA7<br />
ASK QA6 IF "MARRIED, REMARRIED OR LIVING WITH PARTNER", CODE 1 to 3 in D7 -<br />
OTHERS GO TO QA7<br />
Pourriez-vous m’indiquer qui dans votre ménage est principalement responsable pour … ?<br />
QA6 Could you indicate who in your household is mainly responsible for…?<br />
QA6<br />
(MONTRER CARTE AVEC ECHELLE – UNE REPONSE PAR LIGNE)<br />
(SHOW CARD WITH SCALE – ONE ANSWER PER LINE)<br />
NSP<br />
Tous les 2<br />
(SPONTA<br />
NE)<br />
Quelqu’un<br />
d’autre<br />
(LIRE) Vous Votre<br />
partenaire<br />
DK<br />
Together\<br />
Both<br />
(SPONTA<br />
NEOUS)<br />
Someone<br />
else<br />
(READ OUT) You Your<br />
partner<br />
1 Cleaning the house\<br />
1 2 3 4 5<br />
1 Nettoyer votre logement 1 2 3 4 5<br />
(189)<br />
appartment<br />
(189)<br />
(190) 2 Cooking (M) 1 2 3 4 5 (190) 2 Faire la cuisine (M) 1 2 3 4 5<br />
(191) 3 Doing the ironing 1 2 3 4 5 (191) 3 Faire le repassage 1 2 3 4 5<br />
EB59.0 Q51 TREND MODIFIED<br />
EB59.0 Q51 TREND MODIFIED<br />
BilingualQuestionnaireEB663 8/85 29/11/2006
A TOUS<br />
ASK ALL<br />
Avez-vous eu des enfants ? (SI OUI) Combien ?<br />
QA7 Have you had any children? (IF YES) How many?<br />
QA7<br />
(SI "NON", CODER "AUCUN")<br />
(192-193) (192-193)<br />
1 Un<br />
1<br />
2 Deux<br />
2<br />
3 Trois<br />
3<br />
4 Quatre<br />
4<br />
5 Cinq<br />
5<br />
6 Six<br />
6<br />
7 Sept<br />
7<br />
8 Huit<br />
8<br />
9 Neuf<br />
9<br />
10 Dix ou plus<br />
10<br />
11 Aucun<br />
11<br />
12 NSP<br />
12<br />
(IF "NO", CODE "NONE")<br />
One<br />
Two<br />
Three<br />
Four<br />
Five<br />
Six<br />
Seven<br />
Eight<br />
Nine<br />
Ten or more<br />
None<br />
DK<br />
EB65.3 QE6 (AUCUN EN FIN D'ECHELLE)<br />
EB65.3 QE6 (NONE AT THE END OF THE SCALE)<br />
POSER QA8a SI "A DES ENFANTS", CODE 1 à 10 en QA7 - LES AUTRES ALLER EN QA8b<br />
ASK QA8a IF "HAVE CHILDREN", CODE 1 to 10 in QA7 - OTHERS GO TO QA8b<br />
Laquelle des affirmations suivantes correspond le mieux à ce que vous ressentez ?<br />
QA8a Which of the following statements most applies to how you feel?<br />
QA8a<br />
(MONTRER CARTE – LIRE – UNE SEULE REPONSE)<br />
(194) (194)<br />
1 Vous êtes heureux(se) du nombre d’enfants que vous avez<br />
1<br />
2 Vous aimeriez\ auriez aimé avoir plus d’enfants<br />
2<br />
3 Vous auriez été plus heureux(se) si vous aviez eu moins d’enfants<br />
3<br />
4 Vous auriez préféré ne pas avoir d’enfants<br />
4<br />
5 NSP<br />
5<br />
(SHOW CARD – READ OUT – ONE ANSWER ONLY)<br />
You are happy with the number of children you have<br />
You would like\ have liked to have (had) more children<br />
You would have been happier with fewer children<br />
You would have preferred not have had children<br />
DK<br />
NEW<br />
NEW<br />
BilingualQuestionnaireEB663 9/85 29/11/2006
POSER QA8b SI "N'A PAS D'ENFANTS", CODE 11 en QA7 - LES AUTRES ALLER EN QA9<br />
ASK QA8b IF "HAVE NO CHILDREN", CODE 11 in QA7 - OTHERS GO TO QA9<br />
Aimeriez-vous\ Auriez-vous aimé avoir des enfants ?<br />
QA8b Would you like or would you have liked to have children?<br />
QA8b<br />
(MONTRER CARTE – LIRE - UNE SEULE REPONSE)<br />
(195) (195)<br />
1 Oui, certainement<br />
1<br />
2 Oui, probablement<br />
2<br />
3 Non, probablement pas<br />
3<br />
4 Non, certainement pas<br />
4<br />
5 NSP<br />
5<br />
(SHOW CARD – READ OUT – ONE ANSWER ONLY)<br />
Yes, definitely<br />
Yes, probably<br />
No, probably not<br />
No, definitely not<br />
DK<br />
NEW<br />
NEW<br />
BilingualQuestionnaireEB663 10/85 29/11/2006
POSER QA9 A QA11 SI "TRAVAILLE ACTUELLEMENT", CODE 5 à 18 in D15a - LES<br />
AUTRES ALLER EN QA12<br />
ASK QA9 TO QA11 IF "CURRENTLY WORK", CODE 5 to 18 in D15a - OTHERS GO TO<br />
QA12<br />
Dans quelle mesure êtes-vous d’accord ou pas d’accord avec chacune des affirmations<br />
suivantes décrivant les aspects positifs et négatifs de votre travail ?<br />
QA9 How much do you agree or disagree with the following statements describing positive and QA9<br />
negative aspects of your job?<br />
(MONTRER CARTE AVEC ECHELLE – UNE REPONSE PAR LIGNE)<br />
(SHOW CARD WITH SCALE - ONE ANSWER PER LINE)<br />
NSP<br />
Pas<br />
du<br />
tout<br />
d’ac<br />
cord<br />
Pas<br />
d’ac<br />
cord<br />
Ni<br />
d’ac<br />
cord,<br />
ni<br />
pas<br />
d’ac<br />
cord<br />
D’ac<br />
cord<br />
DK (LIRE – ROTATION)<br />
Tout<br />
à fait<br />
d’ac<br />
cord<br />
Stro<br />
ngly<br />
disa<br />
gree<br />
Disa<br />
gree<br />
Neith<br />
er<br />
agre<br />
e nor<br />
disa<br />
gree<br />
Agre<br />
e<br />
Stro<br />
ngly<br />
agre<br />
e<br />
(READ OUT - ROTATE)<br />
(196) 1 My work is too demanding and stressful<br />
1 2 3 4 5 6 (196) 1 Mon travail est trop exigeant et trop stressant 1 2 3 4 5 6<br />
(197) 2 I am well paid<br />
1 2 3 4 5 6 (197) 2 Je suis bien payé(e)<br />
1 2 3 4 5 6<br />
(198) 3 My work is dull and boring<br />
1 2 3 4 5 6 (198) 3 Mon travail est monotone et ennuyeux<br />
1 2 3 4 5 6<br />
4 My job offers good prospects for career<br />
1 2 3 4 5 6<br />
4 Mon travail présente de bonnes opportunités 1 2 3 4 5 6<br />
(199)<br />
advancement<br />
(199)<br />
d’avancement<br />
5 I work in dangerous or unhealthy conditions<br />
1 2 3 4 5 6<br />
5 Je travaille dans des conditions dangereuses ou 1 2 3 4 5 6<br />
(200)<br />
(200)<br />
mauvaises pour la santé<br />
6 My job requires me to keep learning new things 1 2 3 4 5 6<br />
6 Mon travail implique que je continue à apprendre de 1 2 3 4 5 6<br />
(201)<br />
(201)<br />
nouvelles choses<br />
7 My job allows me to take part in making decisions 1 2 3 4 5 6<br />
7 Ma fonction me permet de prendre part aux<br />
1 2 3 4 5 6<br />
(202)<br />
that affect my work<br />
(202)<br />
décisions qui touchent mon travail<br />
8 My job allows me to balance my professional, family 1 2 3 4 5 6<br />
8 Mon travail me permet de concilier ma vie<br />
1 2 3 4 5 6<br />
and private life (N)<br />
professionnelle, ma vie familiale et ma vie privée (N)<br />
(203)<br />
(203)<br />
9 My job allows me to make use of my knowledge and 1 2 3 4 5 6<br />
9 Mon travail me permet d’utiliser mes connaissances 1 2 3 4 5 6<br />
(204)<br />
skills (N)<br />
(204)<br />
et mes compétences (N)<br />
(205) 10 I work with people I like (N)<br />
1 2 3 4 5 6 (205) 10 Je travaille avec des gens que j’apprécie (N) 1 2 3 4 5 6<br />
ESQL2003 Q12 + EB56.1 Q32 (items 6 and 7) TREND MODIFIED<br />
ESQL2003 Q12 + EB56.1 Q32 (items 6 and 7) TREND MODIFIED<br />
BilingualQuestionnaireEB663 11/85 29/11/2006
Dans quelle mesure êtes-vous confiant(e) ou pas dans votre capacité à garder votre emploi<br />
dans les mois à venir ? Etes-vous … ?<br />
QA10a How confident would you say you are in your ability to keep your job in the coming months? QA10a<br />
Are you…?<br />
(LIRE – UNE SEULE REPONSE)<br />
(206) (206)<br />
1 Très confiant(e)<br />
1<br />
2 Plutôt confiant(e)<br />
2<br />
3 Plutôt pas confiant(e)<br />
3<br />
4 Pas du tout confiant(e)<br />
4<br />
5 NSP<br />
5<br />
(READ OUT – ONE ANSWER ONLY)<br />
Very confident<br />
Fairly confident<br />
Not very confident<br />
Not at all confident<br />
DK<br />
EB65.3 QC7<br />
EB65.3 QC7<br />
POSER QA10b SI "PAS CONFIANT(E)", CODE 3 OU 4 en QA10a - LES AUTRES ALLER EN<br />
QA11<br />
ASK QA10b IF "NOT CONFIDENT", CODE 3 OR 4 in QA10a - OTHERS GO TO QA11<br />
Pourquoi n’êtes-vous pas confiant(e) dans votre capacité à garder votre emploi dans les mois<br />
à venir ?<br />
QA10b Why are you not confident about your ability to keep your job in the coming months?<br />
QA10b<br />
(IF NECESSARY, ASK FOR THE MAIN REASON) (SHOW CARD – READ OUT – ONE<br />
(SI NECESSAIRE, DEMANDER LA RAISON PRINCIPALE) (MONTRER CARTE – LIRE –<br />
ANSWER ONLY)<br />
UNE SEULE REPONSE)<br />
(207) (207)<br />
Your company\ this location is relocating abroad<br />
1 Votre entreprise\ vos bureaux sont delocalisés à l'étranger<br />
1<br />
Your company\ this location is closing down<br />
2 Votre entreprise\ vos bureaux vont fermer<br />
2<br />
Your company is merging with another company<br />
3 Votre entreprise va fusionner avec une autre<br />
3<br />
The work you do will be automated<br />
4 Le travail que vous effectuez va être automatisé<br />
4<br />
None (SPONTANEOUS)<br />
5 Aucune (SPONTANE)<br />
5<br />
Other reason (SPONTANEOUS - SPECIFY)<br />
6 Autre raison (SPONTANE – SPECIFIER)<br />
6<br />
DK<br />
7 NSP<br />
7<br />
NEW<br />
NEW<br />
BilingualQuestionnaireEB663 12/85 29/11/2006
POSER QA11 SI "TRAVAILLE ACTUELLEMENT", CODE 5 à 18 en D15a - LES AUTRES<br />
ALLER EN QA12<br />
ASK QA11 IF "CURRENTLY WORK", CODE 5 to 18 in D15a - OTHERS GO TO QA12<br />
Si vous deviez être licencié(e), à combien évaluez-vous sur une échelle de 1 à 10 les chances<br />
de retrouver un travail demandant les mêmes compétences et la même expérience dans les<br />
six prochains mois ? '1' signifie que ce serait "très improbable" et '10' signifie que ce serait<br />
"très probable".<br />
QA11 If you were to be laid-off, how would you rate on a scale from 1 to 10, the likelihood that you QA11<br />
find a job requiring the same skills and experience in the next six months? 1 means that it<br />
would be not at all likely and 10 means that it would be very likely.<br />
(READ OUT)<br />
(LIRE)<br />
(208-209) (208-209)<br />
Not at all likely Very likely<br />
Très improbable Très probable<br />
1 2 3 4 5 6 7 8 9 10 1 2 3 4 5 6 7 8 9 10<br />
11 NSP<br />
11<br />
DK<br />
EB65.3 QC14 TREND MODIFIE<br />
EB65.3 QC14 TREND MODIFIED<br />
A TOUS<br />
ASK ALL<br />
Quelles sont vos attentes pour les douze prochains mois : les douze prochains mois seront-ils<br />
meilleurs, moins bons ou sans changement, en ce qui concerne … ?<br />
QA12 What are your expectations for the next twelve months: will the next twelve months be better, QA12<br />
worse or the same, when it comes to...?<br />
NSP<br />
Sans<br />
changement<br />
(LIRE) Meilleurs Moins<br />
bons<br />
(READ OUT) Better Worse Same DK<br />
(210) 1 Your life in general 1 2 3 4 (210) 1 Votre vie en général 1 2 3 4<br />
2 The economic situation in (OUR<br />
1 2 3 4<br />
2 La situation économique en (NOTRE 1 2 3 4<br />
(211)<br />
COUNTRY)<br />
(211)<br />
PAYS)<br />
3 The financial situation of your household 1 2 3 4<br />
3 La situation financière de votre ménage 1 2 3 4<br />
(212)<br />
(212)<br />
4 The employment situation in (OUR<br />
1 2 3 4<br />
4 La situation de l'emploi en (NOTRE<br />
1 2 3 4<br />
(213)<br />
COUNTRY)<br />
(213)<br />
PAYS)<br />
(214) 5 Your personal job situation 1 2 3 4 (214) 5 Votre situation professionnelle 1 2 3 4<br />
EB66.1 QA4<br />
EB66.1 QA4<br />
BilingualQuestionnaireEB663 13/85 29/11/2006
QA13 If you compare your present situation with five years ago, would you say it has improved, QA13 Si vous comparez votre situation actuelle à celle d'il y a cinq ans, pensez-vous qu'elle s'est<br />
stayed about the same, or got worse?<br />
améliorée, qu'elle est restée à peu près la même ou qu'elle s'est dégradée ?<br />
(215) (215)<br />
Improved<br />
1 S'est améliorée<br />
1<br />
Stayed about the same<br />
2 Restée la même<br />
2<br />
Got worse<br />
3 S'est dégradée<br />
3<br />
DK<br />
4 NSP<br />
4<br />
EB65.2 QA5<br />
EB65.2 QA5<br />
QA14 In the course of the next five years, do you expect your personal situation to improve, to stay QA14 Au cours des cinq années à venir, vous attendez-vous à ce que votre situation personnelle<br />
about the same or to get worse?<br />
s'améliore, reste à peu près la même ou se dégrade ?<br />
(216) (216)<br />
Improve<br />
1 S'améliore<br />
1<br />
Stay about the same<br />
2 Reste la même<br />
2<br />
Get worse<br />
3 Se dégrade<br />
3<br />
DK<br />
4 NSP<br />
4<br />
EB65.2 QA6<br />
EB65.2 QA6<br />
Actuellement, quand vous pensez à l’avenir de votre retraite, diriez-vous que vous êtes … ?<br />
(M)<br />
QA15 At the moment, when you think of the future of your pension, would you say that you are…? QA15<br />
(M)<br />
(LIRE – UNE SEULE REPONSE)<br />
(217) (217)<br />
1 Très confiant(e)<br />
1<br />
2 Plutôt confiant(e)<br />
2<br />
3 Plutôt pas confiant(e)<br />
3<br />
4 Pas du tout confiant(e)<br />
4<br />
5 NSP<br />
5<br />
(READ OUT – ONE ANSWER ONLY)<br />
Very confident<br />
Rather confident<br />
Rather not confident<br />
Not at all confident<br />
DK<br />
EB62.1 QB17 TREND MODIFIED<br />
EB62.1 QB17 TREND MODIFIED<br />
BilingualQuestionnaireEB663 14/85 29/11/2006
POSER QA16a&b SI "TRAVAILLE ACTUELLEMENT", CODE 5 A 18 EN D15a - LES<br />
AUTRES ALLER EN QA16c<br />
ASK QA16a&b IF "CURRENTLY WORK", CODE 5 TO 18 IN D15a - OTHERS GO TO QA16c<br />
En ce qui vous concerne, croyez-vous que pour progresser dans votre carrière … ?<br />
QA16a Concerning yourself, do you think that in order for you to progress in your career…?<br />
QA16a<br />
(LIRE – UNE SEULE REPONSE)<br />
(218) (218)<br />
1 La formation que vous avez déjà acquise est suffisante<br />
1<br />
Vous devriez acquérir une formation plus spécialisée mais vous ne pouvez<br />
2 pas le faire actuellement<br />
2<br />
Vous devriez acquérir une formation plus spécialisée et vous envisagez de<br />
3 le faire<br />
3<br />
4 NSP<br />
4<br />
(READ OUT – ONE ANSWER ONLY)<br />
Your education and training to date is sufficient<br />
You should follow a more specialised training but you cannot currently do<br />
this<br />
You should follow a more specialised training and you intend doing this<br />
DK<br />
EB62.1 QB16a<br />
EB62.1 QB16a<br />
S’il fallait choisir parmi les possibilités suivantes visant à garantir le financement du système<br />
des retraites en (NOTRE PAYS), quelle est celle qui serait la plus acceptable en ce qui vous<br />
concerne ?<br />
QA16b If you had to choose from the following possibilities aimed at guaranteeing the financing of the QA16b<br />
pension system in (OUR COUNTRY), which one would be most acceptable for you?<br />
(LIRE – UNE SEULE REPONSE)<br />
(219) (219)<br />
1 Travailler et cotiser plus longtemps<br />
1<br />
Maintenir l’âge de la retraite et augmenter vos cotisations <strong>social</strong>es<br />
2 2<br />
Maintenir l’âge de la retraite actuel et accepter de toucher moins<br />
3 3<br />
4 Aucune de celles-là (SPONTANE)<br />
4<br />
5 Une combinaison des trois (SPONTANE)<br />
5<br />
6 NSP<br />
6<br />
(READ OUT – ONE ANSWER ONLY)<br />
Work and contribute for longer<br />
Maintain the retirement age and increase your <strong>social</strong> security contributions<br />
Maintain the current retirement age and accept that you will receive less<br />
None of these (SPONTANEOUS)<br />
A combination of all three (SPONTANEOUS)<br />
DK<br />
EB62.1 QB18a<br />
EB62.1 QB18a<br />
BilingualQuestionnaireEB663 15/85 29/11/2006
POSER QA16c SI "NE TRAVAILLE PAS ACTUELLEMENT" ET "PAS RETRAITE", CODE 1 A<br />
3 EN D15a - LES AUTRES ALLER EN QA16d<br />
ASK QA16c IF "NOT CURRENTLY WORK" AND "NOT RETIRED", CODE 1 TO 3 IN D15a -<br />
OTHERS GO TO QA16d<br />
En ce qui vous concerne, croyez-vous que pour trouver un emploi prochainement … ?<br />
QA16c Concerning yourself, do you think that in order to find a job soon…?<br />
QA16c<br />
(LIRE – UNE SEULE REPONSE)<br />
(220) (220)<br />
1 La formation que vous avez déjà acquise est suffisante<br />
1<br />
Vous devriez acquérir une formation plus spécialisée mais vous ne pouvez<br />
2 pas le faire actuellement<br />
2<br />
Vous devriez acquérir une formation plus spécialisée et vous envisagez de<br />
3 le faire<br />
3<br />
4 Vous n'êtes pas à la recherche d'un emploi (SPONTANE)<br />
4<br />
5 NSP<br />
5<br />
(READ OUT – ONE ANSWER ONLY)<br />
Your education and training to date is sufficient<br />
You should follow a more specialised training but you cannot currently do<br />
this<br />
You should follow a more specialised training and you intend doing this<br />
You are not looking for a job (SPONTANEOUS)<br />
DK<br />
EB62.1 QB16b<br />
EB62.1 QB16b<br />
POSER QA16d SI "NE TRAVAILLE PAS ACTUELLEMENT", CODE 1 A 4 EN D15a - LES<br />
AUTRES ALLER EN QA17<br />
ASK QA16d IF "NOT CURRENTLY WORK", CODE 1 TO 4 IN D15a - OTHERS GO TO QA17<br />
Parmi les possibilités suivantes visant à garantir le financement du système des retraites en<br />
(NOTRE PAYS), quelle est celle qui serait, selon vous, la plus acceptable pour quelqu’un qui<br />
travaille ?<br />
QA16d According to you, which of the following possibilities aimed at guaranteeing the financing of QA16d<br />
the pension system in (OUR COUNTRY), would be most acceptable for someone working?<br />
(LIRE – UNE SEULE REPONSE)<br />
(221) (221)<br />
1 Travailler et cotiser plus longtemps<br />
1<br />
Maintenir l’âge de la retraite et augmenter les cotisations <strong>social</strong>es payées<br />
2 par les personnes qui travaillent<br />
2<br />
Maintenir l’âge de la retraite actuel et accepter de toucher moins<br />
3 3<br />
4 Aucune de celles-là (SPONTANE)<br />
4<br />
5 Une combinaison des trois (SPONTANE)<br />
5<br />
6 NSP<br />
6<br />
(READ OUT – ONE ANSWER ONLY)<br />
Work and contribute for longer<br />
Maintain the retirement age and increase <strong>social</strong> security contributions paid<br />
by the workers<br />
Maintain the current retirement age and accept that one will receive less<br />
None of these (SPONTANEOUS)<br />
A combination of all three (SPONTANEOUS)<br />
DK<br />
EB62.1 QB18b<br />
EB62.1 QB18b<br />
BilingualQuestionnaireEB663 16/85 29/11/2006
A TOUS<br />
ASK ALL<br />
En général, pensez-vous que la vie des enfants d'aujourd'hui sera plus facile, plus difficile ou<br />
ni plus facile ni plus difficile que pour ceux de votre génération ?<br />
QA17 Generally speaking, do you think that the life of those who are children today will be easier, QA17<br />
more difficult or neither easier nor more difficult than the life of those from your own<br />
generation?<br />
(LIRE – UNE SEULE REPONSE)<br />
(222) (222)<br />
1 Plus facile<br />
1<br />
2 Plus difficile<br />
2<br />
3 Ni plus facile, ni plus difficile<br />
3<br />
4 NSP<br />
4<br />
(READ OUT – ONE ANSWER ONLY)<br />
Easier<br />
More difficult<br />
Neither easier nor more difficult<br />
DK<br />
NEW<br />
NEW<br />
Je voudrais maintenant vous poser une question à propos de la confiance que vous inspirent<br />
certaines institutions. Pour chacune des institutions suivantes, pourriez-vous me dire si vous<br />
avez plutôt confiance ou plutôt pas confiance en elle.<br />
QA18 I would like to ask you a question about how much trust you have in certain institutions. For QA18<br />
each of the following institutions, please tell me if you tend to trust it or tend not to trust it.<br />
NSP<br />
Plutôt pas<br />
confiance<br />
(LIRE) Plutôt<br />
confiance<br />
DK<br />
Tend not<br />
to trust<br />
(READ OUT) Tend to<br />
trust<br />
Le Gouvernement (NATIONALITE) 1 2 3<br />
Le (PARLEMENT NATIONALITE) (UTILISER LA 1 2 3<br />
DENOMINATION CORRECTE POUR LA<br />
CHAMBRE BASSE)<br />
Les partis politiques 1 2 3<br />
Le Conseil municipal de votre ville\ village (N) 1 2 3<br />
(223) 1 The (NATIONALITY) Government 1 2 3 (223) 1<br />
2 The (NATIONALITY PARLIAMENT) (USE PROPER 1 2 3<br />
2<br />
NAME FOR LOWER HOUSE )<br />
(224)<br />
(224)<br />
(225) 3 Political parties 1 2 3 (225) 3<br />
(226) 4 The council of your city\ village (N) 1 2 3 (226) 4<br />
EB66.1 QA6 TREND MODIFIED<br />
EB66.1 QA6 TREND MODIFIED<br />
BilingualQuestionnaireEB663 17/85 29/11/2006
Actuellement, participez-vous activement ou travaillez-vous bénévolement dans une ou<br />
plusieurs des organisations suivantes ? (M)<br />
QA19 Do you currently participate actively in or do voluntary work for one or more of the following QA19<br />
organisations? (M)<br />
(MONTRER CARTE - PLUSIEURS REPONSES POSSIBLES)<br />
(227-242) (227-242)<br />
1, Un club de sport ou un club pour des activités de plein air<br />
1,<br />
2, Une association culturelle, éducative ou artistique<br />
2,<br />
3, Un syndicat<br />
3,<br />
4, Une organisation de professionnels<br />
4,<br />
5, Une organisation de consommateurs<br />
5,<br />
Une organisation internationale telle qu’une organisation pour la défense<br />
6, des droits de l’homme ou d’aide au développement<br />
6,<br />
Une organisation pour la protection de l’environnement, les droits des<br />
7, animaux, etc.<br />
7,<br />
8, Une association caritative ou d’aide <strong>social</strong>e<br />
8,<br />
9, Une association de loisir pour les personnes âgées<br />
9,<br />
10, Une association pour la défense des droits des personnes âgées<br />
10,<br />
11, Une organisation religieuse \ église<br />
11,<br />
12, Un parti politique ou une organisation politique<br />
12,<br />
Une association pour la défense des intérêts des malades et\ou des<br />
13, personnes handicapées<br />
13,<br />
Autres groupes d’intérêt pour des causes spécifiques comme les femmes,<br />
les personnes avec une orientation sexuelle spécifique, les enjeux locaux,<br />
14, etc.<br />
14,<br />
15, Aucune de celles-ci (SPONTANE)<br />
15,<br />
16, NSP<br />
16,<br />
(SHOW CARD - MULTIPLE ANSWERS POSSIBLE)<br />
A sports club or club for outdoor activities (recreation organisation)<br />
Education, arts, music or cultural association<br />
A trade union<br />
A business or professional organisation<br />
A consumer organisation<br />
An international organisation such as development aid organisation or<br />
human rights organisation<br />
An organisation for the environmental protection, animal rights, etc.<br />
A charity organisation or <strong>social</strong> aid organisation<br />
A leisure association for the elderly<br />
An organisation for the defence of elderly rights<br />
Religious or church organisation<br />
Political party or organisation<br />
Organisation defending the interest of patients and\or disabled<br />
Other interest groups for specific causes such as women, people with<br />
specific sexual orientation or local issues<br />
None of these (SPONTANEOUS)<br />
DK<br />
EB62.2 QD9c TREND SLIGHTLY MODIFIED<br />
EB62.2 QD9c TREND SLIGHTLY MODIFIED<br />
BilingualQuestionnaireEB663 18/85 29/11/2006
Pensez-vous que les affirmations suivantes s’appliquent au système de sécurité <strong>social</strong>e<br />
(NATIONALITE) ou pas ? Notre système de sécurité <strong>social</strong>e …<br />
QA20 For each of the following please tell me whether you think it applies to the (NATIONALITY) QA20<br />
<strong>social</strong> welfare system? Our <strong>social</strong> welfare system…<br />
(UNE REPONSE PAR LIGNE)<br />
(ONE ANSWER PER LINE)<br />
NSP<br />
Ni l’un ni<br />
l’autre<br />
(SPONTA<br />
NE)<br />
(LIRE) S’applique S’applique<br />
plutôt bien plutôt mal<br />
DK<br />
Neither<br />
(SPONTA<br />
NEOUS)<br />
Applies<br />
fairly badly<br />
(READ OUT) Applies<br />
fairly well<br />
4<br />
Fournit un niveau de protection suffisant 1 2 3<br />
1<br />
4<br />
Provides wide enough coverage 1 2 3<br />
1<br />
(243)<br />
(243)<br />
Peut servir de modèle à d’autres pays 1 2 3 4<br />
2<br />
1 2 3 4<br />
2<br />
(244)<br />
(244)<br />
4<br />
1 2 3<br />
Coûte trop cher à la société<br />
(NATIONALITE)<br />
3<br />
4<br />
1 2 3<br />
3<br />
(245)<br />
Could serve as a model for other<br />
countries<br />
Is too expensive for the (NATIONALITY)<br />
society<br />
(245)<br />
NEW<br />
NEW<br />
Dans quelle mesure vous sentez-vous en sécurité quand vous marchez seul(e) dans votre<br />
quartier et qu’il fait noir ? Vous sentez-vous … ?<br />
QA21 How safe do you feel walking alone in the area where you live after dark? Do you feel … ? QA21<br />
(IF RESPONDENT NEVER GOES OUT, STRESS HOW SAFE WOULD YOU FEEL) (READ<br />
(SI LE REPONDANT NE SORT JAMAIS, INSISTER ET DEMANDER COMMENT IL\ ELLE SE<br />
OUT – ONE ANSWER ONLY)<br />
SENTIRAIT) (LIRE – UNE SEULE REPONSE)<br />
(246) (246)<br />
Very safe<br />
1 Tout à fait en sécurité<br />
1<br />
Fairly safe<br />
2 Plutôt en sécurité<br />
2<br />
A bit unsafe<br />
3 Pas très en sécurité<br />
3<br />
Very unsafe<br />
4 Pas du tout en sécurité<br />
4<br />
DK<br />
5 NSP<br />
5<br />
EB58.0 Q49<br />
EB58.0 Q49<br />
BilingualQuestionnaireEB663 19/85 29/11/2006
Dans quelle mesure êtes-vous d’accord ou pas d’accord avec chacune des propositions<br />
suivantes ?<br />
QA22 To what extent do you agree or disagree with the following statements?<br />
QA22<br />
(MONTRER CARTE AVEC ECHELLE – UNE REPONSE PAR LIGNE)<br />
(SHOW CARD WITH SCALE - ONE ANSWER PER LINE)<br />
NSP<br />
Pas<br />
du<br />
tout<br />
d’ac<br />
cord<br />
Pas<br />
d’ac<br />
cord<br />
Ni<br />
d’ac<br />
cord,<br />
ni<br />
pas<br />
d’ac<br />
cord<br />
D’ac<br />
cord<br />
DK (LIRE – ROTATION)<br />
Tout<br />
à fait<br />
d’ac<br />
cord<br />
Stro<br />
ngly<br />
disa<br />
gree<br />
Disa<br />
gree<br />
Neith<br />
er<br />
agre<br />
e nor<br />
disa<br />
gree<br />
Agre<br />
e<br />
Stro<br />
ngly<br />
agre<br />
e<br />
(READ OUT – ROTATE)<br />
(247) 1 I feel left out of society<br />
1 2 3 4 5 6 (247) 1 Je me sens mis(e) à l’écart de la société<br />
1 2 3 4 5 6<br />
2 Some people look down on me because of my 1 2 3 4 5 6<br />
2 Certaines personnes me regardent de haut à cause 1 2 3 4 5 6<br />
income or job situation<br />
de mon revenu ou de ma situation professionnelle<br />
(248)<br />
(248)<br />
3 I feel that there is a risk that I could fall into poverty 1 2 3 4 5 6<br />
3 Je sens qu’il y a un risque que je tombe dans la 1 2 3 4 5 6<br />
(249)<br />
(249)<br />
pauvreté<br />
EB56.1 Q21 TREND MODIFIED<br />
EB56.1 Q21 TREND MODIFIED<br />
Laquelle de ces affirmations se rapproche le plus de votre point de vue ?<br />
QA23 Which of these statements comes closest to your view?<br />
QA23<br />
(MONTRER CARTE - LIRE – UNE SEULE REPONSE)<br />
(250) (250)<br />
Il peut arriver à n’importe qui de tomber dans la pauvreté au cours de sa vie<br />
1 1<br />
2 Le risque de pauvreté est limité à certains groupes de personnes<br />
2<br />
3 Aucune de ces deux affirmations (SPONTANE)<br />
3<br />
4 NSP<br />
4<br />
(SHOW CARD - READ OUT – ONE ANSWER ONLY)<br />
Anyone is at risk of poverty at some time in their lives<br />
The risk of poverty is confined to certain groups of people<br />
None of these two statements (SPONTANEOUS)<br />
DK<br />
EB56.1 Q15<br />
EB56.1 Q15<br />
BilingualQuestionnaireEB663 20/85 29/11/2006
Personnellement, avez-vous le sentiment d’appartenir en (NOTRE PAYS), à un des groupes<br />
majoritaires ou à un des groupes minoritaires, en termes de race, de religion ou de culture ?<br />
QA24 Do you personally have the feeling that you belong in (OUR COUNTRY) to one of the majority QA24<br />
groups or one of minority group in terms of race, religion or culture?<br />
(LIRE – UNE SEULE REPONSE)<br />
(251) (251)<br />
1 Un groupe majoritaire<br />
1<br />
2 Un groupe minoritaire<br />
2<br />
3 Je n’ai pas le sentiment d’appartenir à un groupe (SPONTANE)<br />
3<br />
4 NSP<br />
4<br />
(READ OUT – ONE ANSWER ONLY)<br />
Majority group<br />
Minority group<br />
I do not feel I belong to any group (SPONTANEOUS)<br />
DK<br />
European Monitoring Centre on Racism and Xenophobia<br />
European Monitoring Centre on Racism and Xenophobia<br />
BilingualQuestionnaireEB663 21/85 29/11/2006
Pourriez-vous me dire si vous êtes plutôt d’accord ou plutôt pas d’accord avec chacune des<br />
affirmations suivantes.<br />
QA25 For each of the following statements, please tell me whether you tend to agree or tend to QA25<br />
disagree.<br />
(UNE REPONSE PAR LIGNE)<br />
(ONE ANSWER PER LINE)<br />
NSP<br />
Cela<br />
depend<br />
(SPONTA<br />
NE)<br />
Plutôt pas<br />
d’accord<br />
(LIRE) Plutôt<br />
d’accord<br />
DK<br />
It depends<br />
(SPONTA<br />
NEOUS)<br />
Tend to<br />
disagree<br />
(READ OUT) Tend to<br />
agree<br />
4<br />
1 2 3<br />
Les personnes appartenant à d’autres<br />
groupes ethniques enrichissent la vie<br />
culturelle en (NOTRE PAYS)<br />
1<br />
4<br />
1 2 3<br />
People from other ethnic groups are<br />
enriching the cultural life of (OUR<br />
COUNTRY)<br />
1<br />
(252)<br />
(252)<br />
2 La présence de personnes d’autres<br />
1 2 3 4<br />
groupes ethniques est une cause<br />
d’insécurité<br />
3 La présence de personnes d’autres<br />
1 2 3 4<br />
groupes ethniques augmente le<br />
chômage en (NOTRE PAYS)<br />
4 Nous avons besoin d'immigrés pour 1 2 3 4<br />
travailler dans certains secteurs de notre<br />
économie<br />
5 L'arrivée d'immigrés en Europe peut 1 2 3 4<br />
régler efficacement le problème du<br />
vieillissement de la population<br />
européenne<br />
1 2 3 4<br />
The presence of people from other<br />
ethnic groups is a cause of insecurity<br />
2<br />
(253)<br />
(253)<br />
4<br />
1 2 3<br />
3<br />
(254)<br />
The presence of people from other<br />
ethnic groups increases unemployment<br />
in (OUR COUNTRY)<br />
We need immigrants to work in certain<br />
sectors of our economy<br />
(254)<br />
1 2 3 4<br />
4<br />
(255)<br />
(255)<br />
4<br />
1 2 3<br />
The arrival of immigrants in Europe can<br />
efficiently solve the problem of Europe’s<br />
ageing population<br />
5<br />
(256)<br />
(256)<br />
European Monitoring Centre on Racism and Xenophobia<br />
European Monitoring Centre on Racism and Xenophobia<br />
BilingualQuestionnaireEB663 22/85 29/11/2006
Je vais vous montrer une liste de sujets. En pensant à (NOTRE PAYS), pourriez-vous me dire<br />
quels sont les 3 sujets qui actuellement, vous préoccupent le plus.<br />
QA26a I am going to show you a card with a list of topics. Thinking of (OUR COUNTRY), please tell QA26a<br />
me which 3 topics from this list currently concern you the most.<br />
Et quels sont les 3 sujets qui vous préoccupent le plus pour la prochaine génération ?<br />
QA26b And which 3 topics concern you the most for the next generation?<br />
QA26b<br />
(SHOW CARD – MAX. 3 ANSWERS PER COLUMN)<br />
(MONTRER CARTE – MAX. 3 REPONSES PAR COLONNE)<br />
(257-275) (276-294) (257-275) (276-294)<br />
QA26a QA26b<br />
QA26a QA26b<br />
CURRENTLY FOR THE NEXT<br />
ACTUELLEMEN POUR LA<br />
GENERATION<br />
T PROCHAINE<br />
GENERATION<br />
Pensions 1, 1,<br />
Les retraites 1, 1,<br />
Immigration 2, 2,<br />
L’immigration 2, 2,<br />
Health care 3, 3,<br />
Le système de santé 3, 3,<br />
Terrorism 4, 4,<br />
Le terrorisme 4, 4,<br />
Integration of foreigners 5, 5,<br />
L’intégration des étrangers 5, 5,<br />
The willingness of people to help others 6, 6,<br />
La volonté des gens d’aider les autres 6, 6,<br />
The cost of living 7, 7,<br />
Le coût de la vie 7, 7,<br />
Economic growth 8, 8,<br />
La croissance économique 8, 8,<br />
The care of the elderly 9, 9,<br />
La prise en charge des personnes âgées 9, 9,<br />
The care of disabled people 10, 10,<br />
La prise en charge des personnes handicapées 10, 10,<br />
Unemployment 11, 11,<br />
Le chômage 11, 11,<br />
Crime 12, 12,<br />
La criminalité 12, 12,<br />
The gap between the rich and the poor 13, 13,<br />
Le fossé entre riches et pauvres 13, 13,<br />
Transport infrastructure 14, 14,<br />
Les transports et leurs infrastructures 14, 14,<br />
Education 15, 15,<br />
L'éducation 15, 15,<br />
The environment 16, 16,<br />
L’environnement 16, 16,<br />
Globalisation 17, 17,<br />
La mondialisation 17, 17,<br />
None of these (SPONTANEOUS) 18, 18,<br />
Aucun de ceux-ci (SPONTANE) 18, 18,<br />
DK 19, 19,<br />
NSP 19, 19,<br />
NEW<br />
NEW<br />
BilingualQuestionnaireEB663 23/85 29/11/2006
Laquelle de ces opinions se rapproche le plus de ce que vous pensez ?<br />
QA27 Which of the following two opinions comes closest to your view?<br />
QA27<br />
(MONTRER CARTE – UNE SEULE REPONSE)<br />
(295) (295)<br />
Les universités et autres instituts d’études supérieures doivent être<br />
accessibles à tous les étudiants qui ont terminé leurs études secondaires<br />
(UTILISER LE NOM APPROPRIE), sans tenir compte de leur niveau ni de<br />
1 leur motivation<br />
1<br />
Les universités et autres instituts d’études supérieures doivent être en<br />
mesure de sélectionner les étudiants en fonction de leur niveau et de leur<br />
2 motivation<br />
2<br />
3 Ni l’une, ni l’autre (SPONTANE)<br />
3<br />
4 NSP<br />
4<br />
(SHOW CARD – ONE ANSWER ONLY)<br />
Universities and other places of higher education must be open to all<br />
students who have completed the (COUNTRY SPECIFIC NAME) secondary<br />
education, regardless of grades and motivation<br />
Universities and other places of higher education must be able to select<br />
students on the basis of their grades and motivation<br />
Neither (SPONTANEOUS)<br />
DK<br />
NOUVEAU<br />
NEW<br />
BilingualQuestionnaireEB663 24/85 29/11/2006
TABLES
QA1 Taking all things together would you say you are…?<br />
TOTAL Very happy Quite happy Not very happy Not at all happy DK Happy Not happy<br />
EU25 24732 26% 61% 11% 2% - 87% 13%<br />
EU27 26755 25% 60% 12% 2% 1% 85% 14%<br />
BE 1009 40% 54% 5% 1% - 94% 6%<br />
CZ 1150 16% 71% 11% 2% - 87% 13%<br />
DK 1037 49% 48% 3% - - 97% 3%<br />
D-W 1000 26% 57% 14% 2% 1% 83% 16%<br />
DE 1504 24% 58% 15% 3% - 82% 18%<br />
D-E 504 18% 62% 16% 4% - 80% 20%<br />
EE 1000 12% 63% 22% 2% 1% 75% 24%<br />
EL 1000 21% 59% 16% 4% - 80% 20%<br />
ES 1000 23% 67% 8% 1% 1% 90% 9%<br />
FR 1012 31% 59% 7% 2% 1% 90% 9%<br />
IE 1000 46% 48% 4% 1% 1% 94% 5%<br />
IT 1038 16% 68% 14% 2% - 84% 16%<br />
CY 504 24% 63% 11% 2% - 87% 13%<br />
LV 1019 12% 60% 24% 3% 1% 72% 27%<br />
LT 1025 13% 61% 22% 4% - 74% 26%<br />
LU 502 38% 55% 5% 2% - 93% 7%<br />
HU 1000 17% 51% 24% 8% - 68% 32%<br />
MT 500 26% 64% 7% 3% - 90% 10%<br />
NL 1020 43% 52% 4% 1% - 95% 5%<br />
AT 1029 20% 61% 16% 1% 2% 81% 17%<br />
PL 1000 19% 67% 11% 1% 2% 86% 12%<br />
PT 1004 17% 69% 10% 3% 1% 86% 13%<br />
SI 1019 26% 63% 10% 1% - 89% 11%<br />
SK 1003 10% 67% 20% 2% 1% 77% 22%<br />
FI 1028 28% 65% 6% 1% - 93% 7%<br />
SE 1014 38% 56% 4% 1% 1% 94% 5%<br />
UK 1315 39% 53% 7% 1% - 92% 8%<br />
BG 1023 8% 31% 41% 14% 6% 39% 55%<br />
RO 1000 9% 51% 31% 7% 2% 60% 38%<br />
Sex<br />
Male 11904 25% 62% 10% 2% 1% 87% 12%<br />
Female 12828 26% 60% 11% 2% 1% 86% 13%<br />
Age<br />
15-24 3755 33% 60% 6% 1% - 93% 7%<br />
25-39 6468 32% 60% 7% 1% - 92% 8%<br />
40-54 6326 22% 63% 12% 2% 1% 85% 14%<br />
55 + 8183 22% 60% 15% 3% - 82% 18%<br />
Education (End of)<br />
15 6147 18% 61% 17% 3% 1% 79% 20%<br />
16-19 10175 26% 62% 10% 2% - 88% 12%<br />
20+ 5626 33% 58% 7% 1% 1% 91% 8%<br />
Still Studying 2341 33% 61% 5% 1% - 94% 6%<br />
Left-Right scale<br />
(1-4) Left 6648 25% 62% 10% 2% 1% 87% 12%<br />
(5-6) Centre 8373 27% 61% 10% 2% - 88% 12%<br />
(7-10) Right 4340 28% 58% 11% 2% 1% 86% 13%<br />
Respondent occupation scale<br />
Self- employed 1876 29% 62% 6% 2% 1% 91% 8%<br />
Managers 2241 30% 63% 6% 1% - 93% 7%<br />
Other white collars 2982 28% 64% 7% 1% - 92% 8%<br />
Manual workers 5201 27% 61% 10% 2% - 88% 12%<br />
House persons 2402 27% 61% 10% 1% 1% 88% 11%<br />
Unemployed 1584 20% 55% 21% 4% - 75% 25%<br />
Retired 6106 20% 59% 17% 3% 1% 79% 20%<br />
Students 2341 33% 61% 5% 1% - 94% 6%<br />
Subjective urbanisation<br />
Rural village 8005 28% 59% 10% 2% 1% 87% 12%<br />
Small/ mid size town 10627 24% 63% 11% 2% - 87% 13%<br />
Large town 6068 27% 59% 11% 2% 1% 86% 13%<br />
EU27 results are purely indicative as it is impossible to anticipate the impact of the accession of these countries on the results.
QA2.1 Please say for each of the following how important it is in your life.<br />
Work<br />
TOTAL Very important Quite important Not very important Not at all important DK Important Not important<br />
EU25 24732 51% 33% 7% 7% 2% 84% 14%<br />
EU27 26755 51% 33% 8% 6% 2% 84% 14%<br />
BE 1009 50% 34% 8% 5% 3% 84% 13%<br />
CZ 1150 49% 35% 10% 5% 1% 84% 15%<br />
DK 1037 39% 41% 9% 7% 4% 80% 16%<br />
D-W 1000 52% 32% 7% 8% 1% 84% 15%<br />
DE 1504 54% 31% 7% 7% 1% 85% 14%<br />
D-E 504 62% 25% 6% 6% 1% 87% 12%<br />
EE 1000 45% 39% 8% 5% 3% 84% 13%<br />
EL 1000 58% 21% 6% 15% - 79% 21%<br />
ES 1000 59% 28% 8% 4% 1% 87% 12%<br />
FR 1012 61% 31% 4% 2% 2% 92% 6%<br />
IE 1000 37% 32% 8% 9% 14% 69% 17%<br />
IT 1038 56% 34% 5% 3% 2% 90% 8%<br />
CY 504 55% 33% 5% 4% 3% 88% 9%<br />
LV 1019 56% 32% 6% 4% 2% 88% 10%<br />
LT 1025 51% 34% 8% 5% 2% 85% 13%<br />
LU 502 52% 39% 4% 4% 1% 91% 8%<br />
HU 1000 48% 35% 12% 3% 2% 83% 15%<br />
MT 500 58% 30% 5% 2% 5% 88% 7%<br />
NL 1020 35% 46% 10% 7% 2% 81% 17%<br />
AT 1029 40% 36% 15% 7% 2% 76% 22%<br />
PL 1000 51% 31% 8% 4% 6% 82% 12%<br />
PT 1004 51% 34% 6% 5% 4% 85% 11%<br />
SI 1019 50% 42% 8% - - 92% 8%<br />
SK 1003 54% 32% 8% 3% 3% 86% 11%<br />
FI 1028 45% 42% 9% 3% 1% 87% 12%<br />
SE 1014 50% 38% 5% 4% 3% 88% 9%<br />
UK 1315 32% 34% 12% 18% 4% 66% 30%<br />
BG 1023 49% 25% 11% 11% 4% 74% 22%<br />
RO 1000 50% 37% 7% 3% 3% 87% 10%<br />
Sex<br />
Male 11904 54% 32% 6% 6% 2% 86% 12%<br />
Female 12828 47% 33% 9% 8% 3% 80% 17%<br />
Age<br />
15-24 3755 51% 36% 7% 3% 3% 87% 10%<br />
25-39 6468 59% 35% 4% 1% 1% 94% 5%<br />
40-54 6326 60% 33% 4% 2% 1% 93% 6%<br />
55 + 8183 37% 30% 13% 16% 4% 67% 29%<br />
Education (End of)<br />
15 6147 44% 30% 10% 13% 3% 74% 23%<br />
16-19 10175 55% 31% 7% 5% 2% 86% 12%<br />
20+ 5626 56% 35% 5% 3% 1% 91% 8%<br />
Still Studying 2341 42% 41% 8% 4% 5% 83% 12%<br />
Left-Right scale<br />
(1-4) Left 6648 52% 34% 8% 5% 1% 86% 13%<br />
(5-6) Centre 8373 50% 33% 8% 7% 2% 83% 15%<br />
(7-10) Right 4340 52% 30% 8% 8% 2% 82% 16%<br />
Respondent occupation scale<br />
Self- employed 1876 72% 25% 2% 1% - 97% 3%<br />
Managers 2241 60% 38% 2% - - 98% 2%<br />
Other white collars 2982 60% 36% 3% 1% - 96% 4%<br />
Manual workers 5201 64% 32% 3% 1% - 96% 4%<br />
House persons 2402 40% 34% 12% 10% 4% 74% 22%<br />
Unemployed 1584 55% 31% 8% 4% 2% 86% 12%<br />
Retired 6106 31% 28% 16% 19% 6% 59% 35%<br />
Students 2341 42% 41% 8% 4% 5% 83% 12%<br />
Subjective urbanisation<br />
Rural village 8005 53% 31% 7% 7% 2% 84% 14%<br />
Small/ mid size town 10627 51% 33% 7% 7% 2% 84% 14%<br />
Large town 6068 48% 34% 9% 6% 3% 82% 15%<br />
EU27 results are purely indicative as it is impossible to anticipate the impact of the accession of these countries on the results.
QA2.2 Please say for each of the following how important it is in your life.<br />
Your family<br />
TOTAL Very important Quite important Not very important Not at all important DK Important Not important<br />
EU25 24732 85% 12% 2% 1% - 97% 3%<br />
EU27 26755 85% 12% 2% 1% - 97% 3%<br />
BE 1009 86% 10% 2% 1% 1% 96% 3%<br />
CZ 1150 87% 12% 1% - - 99% 1%<br />
DK 1037 88% 10% 2% - - 98% 2%<br />
D-W 1000 86% 12% 2% - - 98% 2%<br />
DE 1504 86% 11% 2% 1% - 97% 3%<br />
D-E 504 88% 10% 1% 1% - 98% 2%<br />
EE 1000 83% 13% 2% 1% 1% 96% 3%<br />
EL 1000 92% 8% - - - 100% 0%<br />
ES 1000 88% 11% 1% - - 99% 1%<br />
FR 1012 88% 10% 1% 1% - 98% 2%<br />
IE 1000 91% 8% 1% - - 99% 1%<br />
IT 1038 77% 20% 2% 1% - 97% 3%<br />
CY 504 93% 7% - - - 100% 0%<br />
LV 1019 83% 14% 2% 1% - 97% 3%<br />
LT 1025 83% 14% 2% - 1% 97% 2%<br />
LU 502 89% 10% 1% - - 99% 1%<br />
HU 1000 86% 12% 2% - - 98% 2%<br />
MT 500 91% 9% - - - 100% 0%<br />
NL 1020 73% 16% 5% 4% 2% 89% 9%<br />
AT 1029 73% 21% 4% 2% - 94% 6%<br />
PL 1000 85% 13% 2% - - 98% 2%<br />
PT 1004 86% 13% 1% - - 99% 1%<br />
SI 1019 87% 12% 1% - - 99% 1%<br />
SK 1003 92% 8% - - - 100% 0%<br />
FI 1028 83% 14% 2% 1% - 97% 3%<br />
SE 1014 89% 8% 2% 1% - 97% 3%<br />
UK 1315 91% 6% 2% 1% - 97% 3%<br />
BG 1023 85% 13% 1% - 1% 98% 1%<br />
RO 1000 84% 15% 1% - - 99% 1%<br />
Sex<br />
Male 11904 82% 15% 2% 1% - 97% 3%<br />
Female 12828 89% 9% 1% 1% - 98% 2%<br />
Age<br />
15-24 3755 85% 14% 1% - - 99% 1%<br />
25-39 6468 86% 12% 2% - - 98% 2%<br />
40-54 6326 86% 11% 2% 1% - 97% 3%<br />
55 + 8183 85% 12% 2% 1% - 97% 3%<br />
Education (End of)<br />
15 6147 85% 12% 2% 1% - 97% 3%<br />
16-19 10175 87% 11% 1% 1% - 98% 2%<br />
20+ 5626 86% 12% 1% 1% - 98% 2%<br />
Still Studying 2341 82% 16% 2% - - 98% 2%<br />
Left-Right scale<br />
(1-4) Left 6648 84% 13% 2% 1% - 97% 3%<br />
(5-6) Centre 8373 86% 11% 2% 1% - 97% 3%<br />
(7-10) Right 4340 87% 11% 1% 1% - 98% 2%<br />
Respondent occupation scale<br />
Self- employed 1876 85% 12% 2% 1% - 97% 3%<br />
Managers 2241 88% 11% 1% - - 99% 1%<br />
Other white collars 2982 84% 14% 1% 1% - 98% 2%<br />
Manual workers 5201 87% 11% 1% 1% - 98% 2%<br />
House persons 2402 90% 8% 1% 1% - 98% 2%<br />
Unemployed 1584 82% 13% 4% 1% - 95% 5%<br />
Retired 6106 84% 12% 2% 1% 1% 96% 3%<br />
Students 2341 82% 16% 2% - - 98% 2%<br />
Subjective urbanisation<br />
Rural village 8005 88% 10% 1% 1% - 98% 2%<br />
Small/ mid size town 10627 85% 13% 1% 1% - 98% 2%<br />
Large town 6068 82% 14% 2% 1% 1% 96% 3%<br />
EU27 results are purely indicative as it is impossible to anticipate the impact of the accession of these countries on the results.
QA2.3 Please say for each of the following how important it is in your life.<br />
Friends and acquaintances<br />
TOTAL Very important Quite important Not very important Not at all important DK Important Not important<br />
EU25 24732 57% 38% 5% - - 95% 5%<br />
EU27 26755 56% 39% 5% - - 95% 5%<br />
BE 1009 61% 32% 6% 1% - 93% 7%<br />
CZ 1150 55% 41% 4% - - 96% 4%<br />
DK 1037 70% 27% 3% - - 97% 3%<br />
D-W 1000 59% 36% 4% 1% - 95% 5%<br />
DE 1504 59% 36% 4% 1% - 95% 5%<br />
D-E 504 59% 36% 4% 1% - 95% 5%<br />
EE 1000 50% 42% 8% - - 92% 8%<br />
EL 1000 60% 34% 5% 1% - 94% 6%<br />
ES 1000 54% 42% 4% - - 96% 4%<br />
FR 1012 58% 37% 4% 1% - 95% 5%<br />
IE 1000 73% 25% 2% - - 98% 2%<br />
IT 1038 50% 45% 5% - - 95% 5%<br />
CY 504 53% 43% 4% - - 96% 4%<br />
LV 1019 44% 44% 11% 1% - 88% 12%<br />
LT 1025 38% 49% 12% 1% - 87% 13%<br />
LU 502 61% 32% 6% 1% - 93% 7%<br />
HU 1000 62% 34% 4% - - 96% 4%<br />
MT 500 42% 40% 16% 1% 1% 82% 17%<br />
NL 1020 65% 31% 4% - - 96% 4%<br />
AT 1029 54% 40% 5% 1% - 94% 6%<br />
PL 1000 44% 50% 5% 1% - 94% 6%<br />
PT 1004 43% 48% 8% 1% - 91% 9%<br />
SI 1019 61% 38% 1% - - 99% 1%<br />
SK 1003 42% 51% 6% - 1% 93% 6%<br />
FI 1028 62% 36% 2% - - 98% 2%<br />
SE 1014 70% 27% 3% - - 97% 3%<br />
UK 1315 69% 26% 5% - - 95% 5%<br />
BG 1023 42% 48% 8% 1% 1% 90% 9%<br />
RO 1000 32% 51% 15% 1% 1% 83% 16%<br />
Sex<br />
Male 11904 54% 40% 5% 1% - 94% 6%<br />
Female 12828 59% 36% 4% 1% - 95% 5%<br />
Age<br />
15-24 3755 69% 28% 3% - - 97% 3%<br />
25-39 6468 59% 37% 4% - - 96% 4%<br />
40-54 6326 54% 41% 5% - - 95% 5%<br />
55 + 8183 52% 41% 6% 1% - 93% 7%<br />
Education (End of)<br />
15 6147 50% 42% 7% 1% - 92% 8%<br />
16-19 10175 57% 38% 5% - - 95% 5%<br />
20+ 5626 60% 37% 3% - - 97% 3%<br />
Still Studying 2341 72% 26% 2% - - 98% 2%<br />
Left-Right scale<br />
(1-4) Left 6648 60% 36% 4% - - 96% 4%<br />
(5-6) Centre 8373 57% 39% 4% - - 96% 4%<br />
(7-10) Right 4340 56% 37% 6% 1% - 93% 7%<br />
Respondent occupation scale<br />
Self- employed 1876 56% 39% 4% 1% - 95% 5%<br />
Managers 2241 61% 35% 4% - - 96% 4%<br />
Other white collars 2982 55% 42% 3% - - 97% 3%<br />
Manual workers 5201 57% 39% 4% - - 96% 4%<br />
House persons 2402 54% 39% 6% 1% - 93% 7%<br />
Unemployed 1584 60% 33% 6% 1% - 93% 7%<br />
Retired 6106 51% 41% 7% 1% - 92% 8%<br />
Students 2341 72% 26% 2% - - 98% 2%<br />
Subjective urbanisation<br />
Rural village 8005 58% 38% 4% - - 96% 4%<br />
Small/ mid size town 10627 56% 39% 5% - - 95% 5%<br />
Large town 6068 58% 36% 5% 1% - 94% 6%<br />
EU27 results are purely indicative as it is impossible to anticipate the impact of the accession of these countries on the results.
QA2.4 Please say for each of the following how important it is in your life.<br />
Leisure time<br />
TOTAL Very important Quite important Not very important Not at all important DK Important Not important<br />
EU25 24732 44% 46% 9% 1% - 90% 10%<br />
EU27 26755 43% 46% 10% 1% - 89% 11%<br />
BE 1009 42% 46% 10% 2% - 88% 12%<br />
CZ 1150 42% 48% 9% 1% - 90% 10%<br />
DK 1037 56% 35% 8% 1% - 91% 9%<br />
D-W 1000 40% 48% 11% 1% - 88% 12%<br />
DE 1504 41% 48% 10% 1% - 89% 11%<br />
D-E 504 43% 46% 10% 1% - 89% 11%<br />
EE 1000 37% 52% 10% - 1% 89% 10%<br />
EL 1000 55% 36% 8% 1% - 91% 9%<br />
ES 1000 47% 46% 7% - - 93% 7%<br />
FR 1012 36% 50% 12% 2% - 86% 14%<br />
IE 1000 52% 36% 8% 3% 1% 88% 11%<br />
IT 1038 41% 51% 7% 1% - 92% 8%<br />
CY 504 47% 47% 5% 1% - 94% 6%<br />
LV 1019 36% 50% 12% 1% 1% 86% 13%<br />
LT 1025 32% 50% 15% 2% 1% 82% 17%<br />
LU 502 45% 45% 9% 1% - 90% 10%<br />
HU 1000 44% 44% 10% 2% - 88% 12%<br />
MT 500 50% 40% 9% 1% - 90% 10%<br />
NL 1020 55% 40% 4% 1% - 95% 5%<br />
AT 1029 47% 40% 10% 2% 1% 87% 12%<br />
PL 1000 35% 55% 7% 1% 2% 90% 8%<br />
PT 1004 32% 56% 10% 1% 1% 88% 11%<br />
SI 1019 55% 40% 5% - - 95% 5%<br />
SK 1003 33% 56% 9% 1% 1% 89% 10%<br />
FI 1028 47% 48% 5% - - 95% 5%<br />
SE 1014 56% 38% 4% 1% 1% 94% 5%<br />
UK 1315 55% 36% 8% 1% - 91% 9%<br />
BG 1023 24% 46% 23% 5% 2% 70% 28%<br />
RO 1000 28% 47% 21% 3% 1% 75% 24%<br />
Sex<br />
Male 11904 46% 45% 8% 1% - 91% 9%<br />
Female 12828 41% 48% 10% 1% - 89% 11%<br />
Age<br />
15-24 3755 58% 37% 5% - - 95% 5%<br />
25-39 6468 47% 47% 6% - - 94% 6%<br />
40-54 6326 44% 47% 8% 1% - 91% 9%<br />
55 + 8183 34% 49% 14% 2% 1% 83% 16%<br />
Education (End of)<br />
15 6147 34% 49% 14% 2% 1% 83% 16%<br />
16-19 10175 45% 46% 8% 1% - 91% 9%<br />
20+ 5626 46% 46% 7% 1% - 92% 8%<br />
Still Studying 2341 58% 39% 3% - - 97% 3%<br />
Left-Right scale<br />
(1-4) Left 6648 47% 44% 8% 1% - 91% 9%<br />
(5-6) Centre 8373 42% 48% 9% 1% - 90% 10%<br />
(7-10) Right 4340 44% 44% 10% 2% - 88% 12%<br />
Respondent occupation scale<br />
Self- employed 1876 45% 45% 9% 1% - 90% 10%<br />
Managers 2241 49% 46% 5% - - 95% 5%<br />
Other white collars 2982 49% 46% 5% - - 95% 5%<br />
Manual workers 5201 48% 45% 7% - - 93% 7%<br />
House persons 2402 36% 50% 12% 2% - 86% 14%<br />
Unemployed 1584 41% 47% 11% 1% - 88% 12%<br />
Retired 6106 34% 49% 13% 3% 1% 83% 16%<br />
Students 2341 58% 39% 3% - - 97% 3%<br />
Subjective urbanisation<br />
Rural village 8005 43% 46% 9% 1% 1% 89% 10%<br />
Small/ mid size town 10627 42% 48% 9% 1% - 90% 10%<br />
Large town 6068 47% 43% 9% 1% - 90% 10%<br />
EU27 results are purely indicative as it is impossible to anticipate the impact of the accession of these countries on the results.
QA2.5 Please say for each of the following how important it is in your life.<br />
Politics<br />
TOTAL Very important Quite important Not very important Not at all important DK Important Not important<br />
EU25 24732 11% 32% 35% 22% - 43% 57%<br />
EU27 26755 10% 31% 35% 23% 1% 41% 58%<br />
BE 1009 8% 34% 34% 24% - 42% 58%<br />
CZ 1150 5% 21% 40% 34% - 26% 74%<br />
DK 1037 13% 40% 37% 10% - 53% 47%<br />
D-W 1000 15% 39% 34% 12% - 54% 46%<br />
DE 1504 15% 38% 34% 13% - 53% 47%<br />
D-E 504 13% 36% 33% 18% - 49% 51%<br />
EE 1000 5% 26% 43% 25% 1% 31% 68%<br />
EL 1000 14% 22% 37% 27% - 36% 64%<br />
ES 1000 5% 21% 39% 35% - 26% 74%<br />
FR 1012 12% 36% 29% 22% 1% 48% 51%<br />
IE 1000 9% 23% 38% 29% 1% 32% 67%<br />
IT 1038 14% 36% 30% 19% 1% 50% 49%<br />
CY 504 7% 21% 38% 34% - 28% 72%<br />
LV 1019 5% 23% 49% 22% 1% 28% 71%<br />
LT 1025 7% 24% 45% 24% - 31% 69%<br />
LU 502 12% 35% 31% 21% 1% 47% 52%<br />
HU 1000 8% 22% 40% 30% - 30% 70%<br />
MT 500 6% 22% 40% 31% 1% 28% 71%<br />
NL 1020 15% 53% 25% 7% - 68% 32%<br />
AT 1029 12% 26% 37% 24% 1% 38% 61%<br />
PL 1000 6% 30% 39% 24% 1% 36% 63%<br />
PT 1004 6% 20% 33% 40% 1% 26% 73%<br />
SI 1019 3% 24% 43% 30% - 27% 73%<br />
SK 1003 4% 21% 47% 27% 1% 25% 74%<br />
FI 1028 3% 24% 52% 21% - 27% 73%<br />
SE 1014 12% 44% 32% 11% 1% 56% 43%<br />
UK 1315 10% 33% 34% 22% 1% 43% 56%<br />
BG 1023 6% 15% 41% 36% 2% 21% 77%<br />
RO 1000 5% 16% 40% 38% 1% 21% 78%<br />
Sex<br />
Male 11904 12% 34% 34% 19% 1% 46% 53%<br />
Female 12828 9% 31% 35% 24% 1% 40% 59%<br />
Age<br />
15-24 3755 8% 28% 38% 26% - 36% 64%<br />
25-39 6468 10% 30% 38% 22% - 40% 60%<br />
40-54 6326 11% 36% 33% 20% - 47% 53%<br />
55 + 8183 12% 34% 31% 22% 1% 46% 53%<br />
Education (End of)<br />
15 6147 7% 27% 35% 30% 1% 34% 65%<br />
16-19 10175 10% 32% 36% 22% - 42% 58%<br />
20+ 5626 15% 41% 32% 12% - 56% 44%<br />
Still Studying 2341 10% 32% 37% 21% - 42% 58%<br />
Left-Right scale<br />
(1-4) Left 6648 16% 38% 31% 15% - 54% 46%<br />
(5-6) Centre 8373 9% 33% 38% 20% - 42% 58%<br />
(7-10) Right 4340 13% 37% 33% 17% - 50% 50%<br />
Respondent occupation scale<br />
Self- employed 1876 14% 36% 31% 19% - 50% 50%<br />
Managers 2241 14% 45% 32% 9% - 59% 41%<br />
Other white collars 2982 10% 35% 37% 17% 1% 45% 54%<br />
Manual workers 5201 9% 28% 38% 25% - 37% 63%<br />
House persons 2402 8% 29% 35% 27% 1% 37% 62%<br />
Unemployed 1584 10% 22% 40% 27% 1% 32% 67%<br />
Retired 6106 12% 34% 30% 23% 1% 46% 53%<br />
Students 2341 10% 32% 37% 21% - 42% 58%<br />
Subjective urbanisation<br />
Rural village 8005 9% 31% 37% 23% - 40% 60%<br />
Small/ mid size town 10627 10% 33% 35% 22% - 43% 57%<br />
Large town 6068 13% 34% 32% 20% 1% 47% 52%<br />
EU27 results are purely indicative as it is impossible to anticipate the impact of the accession of these countries on the results.
QA2.6 Please say for each of the following how important it is in your life.<br />
Religion<br />
TOTAL Very important Quite important Not very important Not at all important DK Important Not important<br />
EU25 24732 21% 31% 27% 20% 1% 52% 47%<br />
EU27 26755 22% 31% 27% 19% 1% 53% 46%<br />
BE 1009 13% 28% 35% 24% - 41% 59%<br />
CZ 1150 10% 18% 28% 44% - 28% 72%<br />
DK 1037 7% 23% 45% 25% - 30% 70%<br />
D-W 1000 20% 33% 30% 17% - 53% 47%<br />
DE 1504 18% 30% 28% 24% - 48% 52%<br />
D-E 504 10% 16% 23% 51% - 26% 74%<br />
EE 1000 8% 21% 38% 31% 2% 29% 69%<br />
EL 1000 51% 31% 12% 6% - 82% 18%<br />
ES 1000 10% 24% 37% 28% 1% 34% 65%<br />
FR 1012 12% 26% 30% 32% - 38% 62%<br />
IE 1000 28% 34% 23% 15% - 62% 38%<br />
IT 1038 31% 47% 17% 5% - 78% 22%<br />
CY 504 57% 29% 9% 5% - 86% 14%<br />
LV 1019 10% 27% 44% 18% 1% 37% 62%<br />
LT 1025 19% 37% 32% 12% - 56% 44%<br />
LU 502 16% 26% 29% 28% 1% 42% 57%<br />
HU 1000 15% 28% 38% 19% - 43% 57%<br />
MT 500 53% 35% 9% 3% - 88% 12%<br />
NL 1020 18% 22% 31% 29% - 40% 60%<br />
AT 1029 16% 28% 33% 22% 1% 44% 55%<br />
PL 1000 45% 42% 9% 3% 1% 87% 12%<br />
PT 1004 19% 38% 27% 15% 1% 57% 42%<br />
SI 1019 14% 37% 31% 17% 1% 51% 48%<br />
SK 1003 21% 35% 28% 15% 1% 56% 43%<br />
FI 1028 13% 34% 39% 14% - 47% 53%<br />
SE 1014 9% 21% 40% 29% 1% 30% 69%<br />
UK 1315 19% 26% 32% 22% 1% 45% 54%<br />
BG 1023 15% 27% 35% 20% 3% 42% 55%<br />
RO 1000 48% 34% 12% 5% 1% 82% 17%<br />
Sex<br />
Male 11904 16% 29% 29% 25% 1% 45% 54%<br />
Female 12828 25% 33% 26% 16% - 58% 42%<br />
Age<br />
15-24 3755 16% 28% 32% 23% 1% 44% 55%<br />
25-39 6468 15% 27% 32% 25% 1% 42% 57%<br />
40-54 6326 18% 31% 28% 22% 1% 49% 50%<br />
55 + 8183 29% 36% 22% 13% - 65% 35%<br />
Education (End of)<br />
15 6147 28% 34% 24% 14% - 62% 38%<br />
16-19 10175 18% 31% 28% 23% - 49% 51%<br />
20+ 5626 18% 29% 30% 22% 1% 47% 52%<br />
Still Studying 2341 18% 28% 31% 22% 1% 46% 53%<br />
Left-Right scale<br />
(1-4) Left 6648 16% 25% 32% 27% - 41% 59%<br />
(5-6) Centre 8373 18% 33% 30% 18% 1% 51% 48%<br />
(7-10) Right 4340 27% 32% 24% 17% - 59% 41%<br />
Respondent occupation scale<br />
Self- employed 1876 21% 32% 25% 21% 1% 53% 46%<br />
Managers 2241 13% 29% 33% 25% - 42% 58%<br />
Other white collars 2982 14% 30% 31% 24% 1% 44% 55%<br />
Manual workers 5201 15% 28% 31% 25% 1% 43% 56%<br />
House persons 2402 30% 35% 23% 11% 1% 65% 34%<br />
Unemployed 1584 17% 27% 30% 26% - 44% 56%<br />
Retired 6106 30% 35% 21% 14% - 65% 35%<br />
Students 2341 18% 28% 31% 22% 1% 46% 53%<br />
Subjective urbanisation<br />
Rural village 8005 21% 31% 28% 19% 1% 52% 47%<br />
Small/ mid size town 10627 20% 33% 27% 20% - 53% 47%<br />
Large town 6068 21% 28% 27% 23% 1% 49% 50%<br />
EU27 results are purely indicative as it is impossible to anticipate the impact of the accession of these countries on the results.
QA2.7 Please say for each of the following how important it is in your life.<br />
Helping others or voluntary work<br />
TOTAL Very important Quite important Not very important Not at all important DK Important Not important<br />
EU25 24732 25% 54% 15% 4% 2% 79% 19%<br />
EU27 26755 25% 53% 16% 4% 2% 78% 20%<br />
BE 1009 28% 52% 16% 4% - 80% 20%<br />
CZ 1150 24% 58% 16% 2% - 82% 18%<br />
DK 1037 27% 47% 21% 4% 1% 74% 25%<br />
D-W 1000 24% 51% 19% 5% 1% 75% 24%<br />
DE 1504 25% 51% 18% 5% 1% 76% 23%<br />
D-E 504 29% 52% 15% 4% - 81% 19%<br />
EE 1000 22% 57% 17% 2% 2% 79% 19%<br />
EL 1000 39% 47% 11% 3% - 86% 14%<br />
ES 1000 21% 53% 18% 4% 4% 74% 22%<br />
FR 1012 25% 57% 12% 4% 2% 82% 16%<br />
IE 1000 23% 40% 23% 11% 3% 63% 34%<br />
IT 1038 28% 60% 8% 2% 2% 88% 10%<br />
CY 504 35% 54% 10% 1% - 89% 11%<br />
LV 1019 11% 54% 24% 7% 4% 65% 31%<br />
LT 1025 24% 58% 15% 2% 1% 82% 17%<br />
LU 502 40% 45% 10% 4% 1% 85% 14%<br />
HU 1000 27% 52% 17% 3% 1% 79% 20%<br />
MT 500 40% 46% 10% 2% 2% 86% 12%<br />
NL 1020 31% 54% 13% 2% - 85% 15%<br />
AT 1029 22% 47% 24% 4% 3% 69% 28%<br />
PL 1000 22% 57% 14% 3% 4% 79% 17%<br />
PT 1004 25% 56% 14% 4% 1% 81% 18%<br />
SI 1019 32% 56% 9% 3% - 88% 12%<br />
SK 1003 20% 59% 16% 4% 1% 79% 20%<br />
FI 1028 18% 58% 22% 2% - 76% 24%<br />
SE 1014 27% 56% 13% 3% 1% 83% 16%<br />
UK 1315 26% 48% 19% 6% 1% 74% 25%<br />
BG 1023 15% 47% 28% 5% 5% 62% 33%<br />
RO 1000 14% 49% 28% 7% 2% 63% 35%<br />
Sex<br />
Male 11904 22% 53% 18% 5% 2% 75% 23%<br />
Female 12828 29% 55% 12% 3% 1% 84% 15%<br />
Age<br />
15-24 3755 27% 54% 15% 3% 1% 81% 18%<br />
25-39 6468 22% 56% 17% 3% 2% 78% 20%<br />
40-54 6326 27% 54% 14% 4% 1% 81% 18%<br />
55 + 8183 27% 52% 14% 5% 2% 79% 19%<br />
Education (End of)<br />
15 6147 26% 51% 15% 6% 2% 77% 21%<br />
16-19 10175 25% 53% 16% 4% 2% 78% 20%<br />
20+ 5626 26% 57% 14% 2% 1% 83% 16%<br />
Still Studying 2341 28% 54% 14% 2% 2% 82% 16%<br />
Left-Right scale<br />
(1-4) Left 6648 28% 53% 15% 3% 1% 81% 18%<br />
(5-6) Centre 8373 23% 55% 16% 4% 2% 78% 20%<br />
(7-10) Right 4340 26% 51% 17% 5% 1% 77% 22%<br />
Respondent occupation scale<br />
Self- employed 1876 23% 56% 14% 5% 2% 79% 19%<br />
Managers 2241 22% 56% 19% 2% 1% 78% 21%<br />
Other white collars 2982 23% 57% 16% 3% 1% 80% 19%<br />
Manual workers 5201 24% 53% 17% 4% 2% 77% 21%<br />
House persons 2402 32% 52% 11% 4% 1% 84% 15%<br />
Unemployed 1584 24% 53% 16% 5% 2% 77% 21%<br />
Retired 6106 27% 52% 14% 5% 2% 79% 19%<br />
Students 2341 28% 54% 14% 2% 2% 82% 16%<br />
Subjective urbanisation<br />
Rural village 8005 26% 53% 15% 4% 2% 79% 19%<br />
Small/ mid size town 10627 25% 55% 14% 4% 2% 80% 18%<br />
Large town 6068 26% 52% 16% 4% 2% 78% 20%<br />
EU27 results are purely indicative as it is impossible to anticipate the impact of the accession of these countries on the results.
QA2.8 Please say for each of the following how important it is in your life.<br />
Health<br />
TOTAL Very important Quite important Not very important Not at all important DK Important Not important<br />
EU25 24732 85% 14% 1% - - 99% 1%<br />
EU27 26755 85% 14% 1% - - 99% 1%<br />
BE 1009 88% 10% 1% 1% - 98% 2%<br />
CZ 1150 91% 9% - - - 100% 0%<br />
DK 1037 61% 34% 5% - - 95% 5%<br />
D-W 1000 86% 13% 1% - - 99% 1%<br />
DE 1504 86% 13% 1% - - 99% 1%<br />
D-E 504 88% 10% 2% - - 98% 2%<br />
EE 1000 81% 17% 2% - - 98% 2%<br />
EL 1000 94% 6% - - - 100% 0%<br />
ES 1000 89% 11% - - - 100% 0%<br />
FR 1012 87% 12% 1% - - 99% 1%<br />
IE 1000 85% 14% - - 1% 99% 0%<br />
IT 1038 81% 18% 1% - - 99% 1%<br />
CY 504 95% 5% - - - 100%<br />
LV 1019 79% 18% 3% - - 97% 3%<br />
LT 1025 85% 13% 2% - - 98% 2%<br />
LU 502 91% 8% 1% - - 99% 1%<br />
HU 1000 87% 12% 1% - - 99% 1%<br />
MT 500 86% 13% 1% - - 99% 1%<br />
NL 1020 89% 10% 1% - - 99% 1%<br />
AT 1029 77% 21% 1% 1% - 98% 2%<br />
PL 1000 85% 14% 1% - - 99% 1%<br />
PT 1004 83% 16% 1% - - 99% 1%<br />
SI 1019 93% 7% - - - 100% 0%<br />
SK 1003 91% 8% 1% - - 99% 1%<br />
FI 1028 87% 13% - - - 100% 0%<br />
SE 1014 85% 14% 1% - - 99% 1%<br />
UK 1315 83% 15% 2% - - 98% 2%<br />
BG 1023 86% 11% 2% - 1% 97% 2%<br />
RO 1000 82% 15% 2% - 1% 97% 2%<br />
Sex<br />
Male 11904 83% 15% 2% - - 98% 2%<br />
Female 12828 87% 12% 1% - - 99% 1%<br />
Age<br />
15-24 3755 79% 19% 2% - - 98% 2%<br />
25-39 6468 84% 15% 1% - - 99% 1%<br />
40-54 6326 87% 12% 1% - - 99% 1%<br />
55 + 8183 87% 12% 1% - - 99% 1%<br />
Education (End of)<br />
15 6147 87% 12% 1% - - 99% 1%<br />
16-19 10175 86% 13% 1% - - 99% 1%<br />
20+ 5626 86% 13% 1% - - 99% 1%<br />
Still Studying 2341 77% 21% 2% - - 98% 2%<br />
Left-Right scale<br />
(1-4) Left 6648 86% 13% 1% - - 99% 1%<br />
(5-6) Centre 8373 85% 14% 1% - - 99% 1%<br />
(7-10) Right 4340 86% 13% 1% - - 99% 1%<br />
Respondent occupation scale<br />
Self- employed 1876 85% 14% 1% - - 99% 1%<br />
Managers 2241 84% 14% 1% 1% - 98% 2%<br />
Other white collars 2982 85% 14% 1% - - 99% 1%<br />
Manual workers 5201 86% 13% 1% - - 99% 1%<br />
House persons 2402 86% 13% 1% - - 99% 1%<br />
Unemployed 1584 85% 13% 2% - - 98% 2%<br />
Retired 6106 88% 11% 1% - - 99% 1%<br />
Students 2341 77% 21% 2% - - 98% 2%<br />
Subjective urbanisation<br />
Rural village 8005 87% 12% 1% - - 99% 1%<br />
Small/ mid size town 10627 85% 14% 1% - - 99% 1%<br />
Large town 6068 82% 16% 2% - - 98% 2%<br />
EU27 results are purely indicative as it is impossible to anticipate the impact of the accession of these countries on the results.
QA3.1 I am now going to read out different aspects of everyday life. For each, could you tell me if this aspect of your life is very satisfactory, fairly satisfactory, not very satisfactory or not at all satisfactory?<br />
Your house or flat<br />
TOTAL Very satisfactory Fairly satisfactory Not very satisfactory Not at all satisfactory DK Satisfactory Not satisfactory<br />
EU25 24732 44% 48% 7% 1% - 92% 8%<br />
EU27 26755 43% 48% 8% 1% - 91% 9%<br />
BE 1009 55% 39% 5% 1% - 94% 6%<br />
CZ 1150 37% 53% 8% 2% - 90% 10%<br />
DK 1037 55% 39% 5% 1% - 94% 6%<br />
D-W 1000 53% 40% 6% 1% - 93% 7%<br />
DE 1504 52% 41% 6% 1% - 93% 7%<br />
D-E 504 49% 42% 8% 1% - 91% 9%<br />
EE 1000 21% 57% 19% 3% - 78% 22%<br />
EL 1000 45% 43% 10% 2% - 88% 12%<br />
ES 1000 40% 51% 8% 1% - 91% 9%<br />
FR 1012 39% 50% 9% 2% - 89% 11%<br />
IE 1000 62% 32% 3% 2% 1% 94% 5%<br />
IT 1038 36% 57% 6% 1% - 93% 7%<br />
CY 504 49% 42% 8% 1% - 91% 9%<br />
LV 1019 16% 53% 24% 7% - 69% 31%<br />
LT 1025 18% 49% 28% 5% - 67% 33%<br />
LU 502 72% 22% 5% 1% - 94% 6%<br />
HU 1000 40% 46% 12% 2% - 86% 14%<br />
MT 500 61% 35% 3% 1% - 96% 4%<br />
NL 1020 59% 38% 3% - - 97% 3%<br />
AT 1029 39% 51% 8% 1% 1% 90% 9%<br />
PL 1000 35% 56% 8% 1% - 91% 9%<br />
PT 1004 31% 58% 8% 2% 1% 89% 10%<br />
SI 1019 38% 53% 8% 1% - 91% 9%<br />
SK 1003 31% 58% 10% 1% - 89% 11%<br />
FI 1028 41% 54% 5% - - 95% 5%<br />
SE 1014 54% 40% 5% 1% - 94% 6%<br />
UK 1315 53% 40% 6% 1% - 93% 7%<br />
BG 1023 25% 46% 23% 5% 1% 71% 28%<br />
RO 1000 30% 56% 12% 2% - 86% 14%<br />
Sex<br />
Male 11904 42% 50% 7% 1% - 92% 8%<br />
Female 12828 46% 46% 7% 1% - 92% 8%<br />
Age<br />
15-24 3755 38% 51% 8% 2% 1% 89% 10%<br />
25-39 6468 38% 50% 10% 2% - 88% 12%<br />
40-54 6326 44% 48% 7% 1% - 92% 8%<br />
55 + 8183 51% 43% 5% 1% - 94% 6%<br />
Education (End of)<br />
15 6147 44% 48% 7% 1% - 92% 8%<br />
16-19 10175 44% 47% 7% 2% - 91% 9%<br />
20+ 5626 45% 46% 8% 1% - 91% 9%<br />
Still Studying 2341 41% 52% 6% 1% - 93% 7%<br />
Left-Right scale<br />
(1-4) Left 6648 43% 48% 8% 1% - 91% 9%<br />
(5-6) Centre 8373 46% 46% 7% 1% - 92% 8%<br />
(7-10) Right 4340 48% 44% 7% 1% - 92% 8%<br />
Respondent occupation scale<br />
Self- employed 1876 47% 44% 8% 1% - 91% 9%<br />
Managers 2241 48% 45% 7% - - 93% 7%<br />
Other white collars 2982 39% 53% 7% 1% - 92% 8%<br />
Manual workers 5201 39% 51% 9% 1% - 90% 10%<br />
House persons 2402 49% 42% 7% 2% - 91% 9%<br />
Unemployed 1584 33% 50% 13% 4% - 83% 17%<br />
Retired 6106 50% 44% 5% 1% - 94% 6%<br />
Students 2341 41% 52% 6% 1% - 93% 7%<br />
Subjective urbanisation<br />
Rural village 8005 49% 44% 6% 1% - 93% 7%<br />
Small/ mid size town 10627 42% 50% 7% 1% - 92% 8%<br />
Large town 6068 41% 48% 9% 2% - 89% 11%<br />
EU27 results are purely indicative as it is impossible to anticipate the impact of the accession of these countries on the results.
QA3.2 I am now going to read out different aspects of everyday life. For each, could you tell me if this aspect of your life is very satisfactory, fairly satisfactory, not very satisfactory or not at all satisfactory?<br />
The quality of life in the area where you live<br />
TOTAL Very satisfactory Fairly satisfactory Not very satisfactory Not at all satisfactory DK Satisfactory Not satisfactory<br />
EU25 24732 33% 53% 11% 2% 1% 86% 13%<br />
EU27 26755 32% 53% 13% 2% - 85% 15%<br />
BE 1009 44% 48% 7% 1% - 92% 8%<br />
CZ 1150 23% 60% 14% 3% - 83% 17%<br />
DK 1037 49% 44% 6% - 1% 93% 6%<br />
D-W 1000 46% 43% 9% 2% - 89% 11%<br />
DE 1504 43% 45% 10% 2% - 88% 12%<br />
D-E 504 29% 55% 13% 3% - 84% 16%<br />
EE 1000 21% 57% 19% 2% 1% 78% 21%<br />
EL 1000 31% 46% 19% 4% - 77% 23%<br />
ES 1000 31% 58% 9% 2% - 89% 11%<br />
FR 1012 36% 52% 9% 3% - 88% 12%<br />
IE 1000 54% 40% 4% 1% 1% 94% 5%<br />
IT 1038 22% 63% 13% 2% - 85% 15%<br />
CY 504 29% 56% 13% 2% - 85% 15%<br />
LV 1019 15% 55% 26% 4% - 70% 30%<br />
LT 1025 20% 57% 20% 3% - 77% 23%<br />
LU 502 68% 27% 5% - - 95% 5%<br />
HU 1000 20% 53% 22% 5% - 73% 27%<br />
MT 500 54% 40% 5% 1% - 94% 6%<br />
NL 1020 47% 45% 7% 1% - 92% 8%<br />
AT 1029 42% 48% 9% 1% - 90% 10%<br />
PL 1000 15% 64% 18% 2% 1% 79% 20%<br />
PT 1004 17% 64% 16% 2% 1% 81% 18%<br />
SI 1019 32% 58% 9% 1% - 90% 10%<br />
SK 1003 11% 64% 22% 3% - 75% 25%<br />
FI 1028 43% 52% 5% - - 95% 5%<br />
SE 1014 52% 41% 5% 1% 1% 93% 6%<br />
UK 1315 40% 48% 9% 2% 1% 88% 11%<br />
BG 1023 9% 33% 44% 13% 1% 42% 57%<br />
RO 1000 16% 54% 26% 4% - 70% 30%<br />
Sex<br />
Male 11904 31% 56% 11% 2% - 87% 13%<br />
Female 12828 35% 51% 12% 2% - 86% 14%<br />
Age<br />
15-24 3755 30% 54% 14% 2% - 84% 16%<br />
25-39 6468 30% 55% 12% 3% - 85% 15%<br />
40-54 6326 32% 53% 12% 2% 1% 85% 14%<br />
55 + 8183 38% 51% 9% 2% - 89% 11%<br />
Education (End of)<br />
15 6147 32% 54% 12% 2% - 86% 14%<br />
16-19 10175 33% 53% 11% 3% - 86% 14%<br />
20+ 5626 37% 51% 10% 2% - 88% 12%<br />
Still Studying 2341 33% 52% 14% 1% - 85% 15%<br />
Left-Right scale<br />
(1-4) Left 6648 32% 54% 12% 2% - 86% 14%<br />
(5-6) Centre 8373 36% 52% 10% 2% - 88% 12%<br />
(7-10) Right 4340 35% 51% 11% 3% - 86% 14%<br />
Respondent occupation scale<br />
Self- employed 1876 36% 51% 11% 2% - 87% 13%<br />
Managers 2241 42% 49% 7% 1% 1% 91% 8%<br />
Other white collars 2982 29% 58% 11% 2% - 87% 13%<br />
Manual workers 5201 29% 56% 12% 3% - 85% 15%<br />
House persons 2402 39% 48% 11% 2% - 87% 13%<br />
Unemployed 1584 23% 54% 18% 5% - 77% 23%<br />
Retired 6106 35% 52% 10% 2% 1% 87% 12%<br />
Students 2341 33% 52% 14% 1% - 85% 15%<br />
Subjective urbanisation<br />
Rural village 8005 38% 50% 10% 2% - 88% 12%<br />
Small/ mid size town 10627 31% 56% 11% 2% - 87% 13%<br />
Large town 6068 31% 53% 13% 3% - 84% 16%<br />
EU27 results are purely indicative as it is impossible to anticipate the impact of the accession of these countries on the results.
QA3.3 I am now going to read out different aspects of everyday life. For each, could you tell me if this aspect of your life is very satisfactory, fairly satisfactory, not very satisfactory or not at all satisfactory?<br />
Your standard of living<br />
TOTAL Very satisfactory Fairly satisfactory Not very satisfactory Not at all satisfactory DK Satisfactory Not satisfactory<br />
EU25 24732 26% 57% 14% 2% 1% 83% 16%<br />
EU27 26755 25% 56% 16% 3% - 81% 19%<br />
BE 1009 35% 55% 8% 2% - 90% 10%<br />
CZ 1150 14% 68% 15% 3% - 82% 18%<br />
DK 1037 55% 40% 5% - - 95% 5%<br />
D-W 1000 33% 53% 11% 3% - 86% 14%<br />
DE 1504 31% 54% 12% 3% - 85% 15%<br />
D-E 504 23% 54% 19% 4% - 77% 23%<br />
EE 1000 9% 59% 29% 3% - 68% 32%<br />
EL 1000 30% 54% 14% 2% - 84% 16%<br />
ES 1000 24% 60% 14% 1% 1% 84% 15%<br />
FR 1012 16% 60% 22% 2% - 76% 24%<br />
IE 1000 48% 44% 6% 1% 1% 92% 7%<br />
IT 1038 20% 65% 14% 1% - 85% 15%<br />
CY 504 24% 60% 15% 1% - 84% 16%<br />
LV 1019 6% 53% 36% 5% - 59% 41%<br />
LT 1025 6% 47% 37% 10% - 53% 47%<br />
LU 502 61% 34% 5% - - 95% 5%<br />
HU 1000 14% 50% 29% 7% - 64% 36%<br />
MT 500 36% 51% 12% 1% - 87% 13%<br />
NL 1020 46% 48% 5% 1% - 94% 6%<br />
AT 1029 32% 52% 14% 1% 1% 84% 15%<br />
PL 1000 14% 62% 20% 3% 1% 76% 23%<br />
PT 1004 14% 61% 21% 3% 1% 75% 24%<br />
SI 1019 16% 67% 15% 2% - 83% 17%<br />
SK 1003 10% 60% 27% 3% - 70% 30%<br />
FI 1028 26% 62% 11% 1% - 88% 12%<br />
SE 1014 45% 49% 5% 1% - 94% 6%<br />
UK 1315 40% 53% 6% 1% - 93% 7%<br />
BG 1023 5% 26% 45% 23% 1% 31% 68%<br />
RO 1000 11% 52% 31% 5% 1% 63% 36%<br />
Sex<br />
Male 11904 25% 59% 14% 2% - 84% 16%<br />
Female 12828 27% 56% 15% 2% - 83% 17%<br />
Age<br />
15-24 3755 29% 57% 12% 2% - 86% 14%<br />
25-39 6468 25% 59% 14% 2% - 84% 16%<br />
40-54 6326 24% 57% 16% 3% - 81% 19%<br />
55 + 8183 27% 57% 14% 2% - 84% 16%<br />
Education (End of)<br />
15 6147 22% 57% 18% 3% - 79% 21%<br />
16-19 10175 24% 58% 15% 3% - 82% 18%<br />
20+ 5626 32% 56% 10% 2% - 88% 12%<br />
Still Studying 2341 32% 57% 10% 1% - 89% 11%<br />
Left-Right scale<br />
(1-4) Left 6648 26% 57% 15% 2% - 83% 17%<br />
(5-6) Centre 8373 28% 58% 12% 2% - 86% 14%<br />
(7-10) Right 4340 29% 55% 14% 2% - 84% 16%<br />
Respondent occupation scale<br />
Self- employed 1876 33% 55% 11% 1% - 88% 12%<br />
Managers 2241 37% 55% 7% 1% - 92% 8%<br />
Other white collars 2982 23% 64% 12% 1% - 87% 13%<br />
Manual workers 5201 20% 61% 17% 2% - 81% 19%<br />
House persons 2402 31% 54% 13% 2% - 85% 15%<br />
Unemployed 1584 14% 49% 30% 7% - 63% 37%<br />
Retired 6106 25% 56% 16% 2% 1% 81% 18%<br />
Students 2341 32% 57% 10% 1% - 89% 11%<br />
Subjective urbanisation<br />
Rural village 8005 28% 55% 15% 2% - 83% 17%<br />
Small/ mid size town 10627 24% 60% 14% 2% - 84% 16%<br />
Large town 6068 27% 56% 14% 3% - 83% 17%<br />
EU27 results are purely indicative as it is impossible to anticipate the impact of the accession of these countries on the results.
QA3.4 I am now going to read out different aspects of everyday life. For each, could you tell me if this aspect of your life is very satisfactory, fairly satisfactory, not very satisfactory or not at all satisfactory?<br />
Travel facilities for going to work, shopping<br />
TOTAL Very satisfactory Fairly satisfactory Not very satisfactory Not at all satisfactory DK Satisfactory Not satisfactory<br />
EU25 24732 30% 48% 15% 5% 2% 78% 20%<br />
EU27 26755 29% 47% 16% 5% 3% 76% 21%<br />
BE 1009 49% 38% 8% 4% 1% 87% 12%<br />
CZ 1150 28% 53% 12% 5% 2% 81% 17%<br />
DK 1037 57% 28% 11% 3% 1% 85% 14%<br />
D-W 1000 36% 42% 16% 5% 1% 78% 21%<br />
DE 1504 36% 43% 15% 5% 1% 79% 20%<br />
D-E 504 32% 46% 15% 6% 1% 78% 21%<br />
EE 1000 26% 51% 15% 4% 4% 77% 19%<br />
EL 1000 31% 45% 20% 3% 1% 76% 23%<br />
ES 1000 21% 58% 16% 4% 1% 79% 20%<br />
FR 1012 29% 52% 11% 6% 2% 81% 17%<br />
IE 1000 35% 36% 18% 9% 2% 71% 27%<br />
IT 1038 15% 50% 23% 9% 3% 65% 32%<br />
CY 504 29% 39% 16% 13% 3% 68% 29%<br />
LV 1019 21% 53% 18% 4% 4% 74% 22%<br />
LT 1025 22% 55% 15% 5% 3% 77% 20%<br />
LU 502 58% 29% 8% 4% 1% 87% 12%<br />
HU 1000 25% 49% 16% 6% 4% 74% 22%<br />
MT 500 33% 43% 14% 4% 6% 76% 18%<br />
NL 1020 55% 38% 5% 1% 1% 93% 6%<br />
AT 1029 35% 50% 10% 2% 3% 85% 12%<br />
PL 1000 25% 55% 13% 2% 5% 80% 15%<br />
PT 1004 17% 55% 19% 5% 4% 72% 24%<br />
SI 1019 27% 49% 20% 3% 1% 76% 23%<br />
SK 1003 12% 59% 23% 4% 2% 71% 27%<br />
FI 1028 38% 45% 14% 2% 1% 83% 16%<br />
SE 1014 39% 38% 15% 6% 2% 77% 21%<br />
UK 1315 38% 41% 13% 5% 3% 79% 18%<br />
BG 1023 8% 30% 32% 19% 11% 38% 51%<br />
RO 1000 13% 44% 28% 9% 6% 57% 37%<br />
Sex<br />
Male 11904 30% 49% 14% 5% 2% 79% 19%<br />
Female 12828 30% 47% 16% 5% 2% 77% 21%<br />
Age<br />
15-24 3755 31% 46% 17% 5% 1% 77% 22%<br />
25-39 6468 31% 49% 15% 4% 1% 80% 19%<br />
40-54 6326 29% 48% 15% 6% 2% 77% 21%<br />
55 + 8183 29% 48% 14% 5% 4% 77% 19%<br />
Education (End of)<br />
15 6147 24% 48% 17% 7% 4% 72% 24%<br />
16-19 10175 29% 49% 15% 5% 2% 78% 20%<br />
20+ 5626 37% 46% 12% 4% 1% 83% 16%<br />
Still Studying 2341 32% 45% 18% 4% 1% 77% 22%<br />
Left-Right scale<br />
(1-4) Left 6648 32% 48% 13% 5% 2% 80% 18%<br />
(5-6) Centre 8373 31% 48% 15% 4% 2% 79% 19%<br />
(7-10) Right 4340 31% 47% 14% 6% 2% 78% 20%<br />
Respondent occupation scale<br />
Self- employed 1876 34% 45% 13% 5% 3% 79% 18%<br />
Managers 2241 39% 43% 14% 3% 1% 82% 17%<br />
Other white collars 2982 30% 49% 15% 5% 1% 79% 20%<br />
Manual workers 5201 28% 51% 15% 5% 1% 79% 20%<br />
House persons 2402 29% 46% 17% 5% 3% 75% 22%<br />
Unemployed 1584 26% 49% 16% 8% 1% 75% 24%<br />
Retired 6106 27% 48% 14% 6% 5% 75% 20%<br />
Students 2341 32% 45% 18% 4% 1% 77% 22%<br />
Subjective urbanisation<br />
Rural village 8005 26% 44% 20% 8% 2% 70% 28%<br />
Small/ mid size town 10627 29% 51% 13% 4% 3% 80% 17%<br />
Large town 6068 37% 47% 11% 3% 2% 84% 14%<br />
EU27 results are purely indicative as it is impossible to anticipate the impact of the accession of these countries on the results.
QA3.5 I am now going to read out different aspects of everyday life. For each, could you tell me if this aspect of your life is very satisfactory, fairly satisfactory, not very satisfactory or not at all satisfactory?<br />
Your state of health<br />
TOTAL Very satisfactory Fairly satisfactory Not very satisfactory Not at all satisfactory DK Satisfactory Not satisfactory<br />
EU25 24732 36% 48% 13% 3% - 84% 16%<br />
EU27 26755 36% 48% 13% 3% - 84% 16%<br />
BE 1009 47% 42% 8% 3% - 89% 11%<br />
CZ 1150 33% 52% 12% 3% - 85% 15%<br />
DK 1037 49% 40% 10% 1% - 89% 11%<br />
D-W 1000 36% 46% 14% 4% - 82% 18%<br />
DE 1504 35% 46% 15% 4% - 81% 19%<br />
D-E 504 33% 44% 19% 4% - 77% 23%<br />
EE 1000 21% 51% 23% 5% - 72% 28%<br />
EL 1000 56% 29% 12% 3% - 85% 15%<br />
ES 1000 40% 46% 13% 1% - 86% 14%<br />
FR 1012 36% 50% 11% 3% - 86% 14%<br />
IE 1000 57% 33% 7% 2% 1% 90% 9%<br />
IT 1038 30% 61% 8% 1% - 91% 9%<br />
CY 504 49% 37% 13% 1% - 86% 14%<br />
LV 1019 15% 55% 25% 5% - 70% 30%<br />
LT 1025 18% 49% 25% 8% - 67% 33%<br />
LU 502 54% 33% 10% 3% - 87% 13%<br />
HU 1000 35% 36% 21% 8% - 71% 29%<br />
MT 500 46% 41% 11% 1% 1% 87% 12%<br />
NL 1020 52% 38% 8% 2% - 90% 10%<br />
AT 1029 38% 44% 15% 2% 1% 82% 17%<br />
PL 1000 24% 52% 19% 5% - 76% 24%<br />
PT 1004 28% 51% 17% 4% - 79% 21%<br />
SI 1019 32% 48% 18% 2% - 80% 20%<br />
SK 1003 23% 56% 18% 3% - 79% 21%<br />
FI 1028 36% 47% 14% 3% - 83% 17%<br />
SE 1014 37% 48% 12% 3% - 85% 15%<br />
UK 1315 45% 43% 10% 2% - 88% 12%<br />
BG 1023 21% 37% 30% 11% 1% 58% 41%<br />
RO 1000 27% 46% 20% 7% - 73% 27%<br />
Sex<br />
Male 11904 38% 48% 11% 3% - 86% 14%<br />
Female 12828 35% 48% 14% 3% - 83% 17%<br />
Age<br />
15-24 3755 58% 37% 4% 1% - 95% 5%<br />
25-39 6468 49% 44% 6% 1% - 93% 7%<br />
40-54 6326 33% 52% 12% 3% - 85% 15%<br />
55 + 8183 21% 52% 22% 5% - 73% 27%<br />
Education (End of)<br />
15 6147 22% 51% 21% 6% - 73% 27%<br />
16-19 10175 36% 49% 12% 3% - 85% 15%<br />
20+ 5626 44% 46% 8% 2% - 90% 10%<br />
Still Studying 2341 62% 35% 3% - - 97% 3%<br />
Left-Right scale<br />
(1-4) Left 6648 36% 49% 13% 2% - 85% 15%<br />
(5-6) Centre 8373 38% 47% 12% 3% - 85% 15%<br />
(7-10) Right 4340 37% 46% 13% 4% - 83% 17%<br />
Respondent occupation scale<br />
Self- employed 1876 43% 47% 9% 1% - 90% 10%<br />
Managers 2241 44% 49% 7% - - 93% 7%<br />
Other white collars 2982 42% 50% 7% 1% - 92% 8%<br />
Manual workers 5201 42% 49% 8% 1% - 91% 9%<br />
House persons 2402 32% 50% 15% 3% - 82% 18%<br />
Unemployed 1584 38% 44% 14% 4% - 82% 18%<br />
Retired 6106 17% 50% 25% 8% - 67% 33%<br />
Students 2341 62% 35% 3% - - 97% 3%<br />
Subjective urbanisation<br />
Rural village 8005 38% 45% 14% 3% - 83% 17%<br />
Small/ mid size town 10627 35% 50% 12% 3% - 85% 15%<br />
Large town 6068 37% 47% 13% 3% - 84% 16%<br />
EU27 results are purely indicative as it is impossible to anticipate the impact of the accession of these countries on the results.
QA3.6 I am now going to read out different aspects of everyday life. For each, could you tell me if this aspect of your life is very satisfactory, fairly satisfactory, not very satisfactory or not at all satisfactory?<br />
The time you have available to do the things you want to do<br />
TOTAL Very satisfactory Fairly satisfactory Not very satisfactory Not at all satisfactory DK Satisfactory Not satisfactory<br />
EU25 24732 26% 48% 22% 4% - 74% 26%<br />
EU27 26755 25% 48% 22% 4% 1% 73% 26%<br />
BE 1009 34% 45% 18% 3% - 79% 21%<br />
CZ 1150 25% 55% 17% 2% 1% 80% 19%<br />
DK 1037 31% 46% 20% 3% - 77% 23%<br />
D-W 1000 27% 46% 22% 5% - 73% 27%<br />
DE 1504 25% 47% 23% 5% - 72% 28%<br />
D-E 504 21% 50% 24% 5% - 71% 29%<br />
EE 1000 19% 53% 24% 3% 1% 72% 27%<br />
EL 1000 30% 38% 25% 7% - 68% 32%<br />
ES 1000 28% 49% 20% 2% 1% 77% 22%<br />
FR 1012 25% 44% 24% 6% 1% 69% 30%<br />
IE 1000 31% 48% 16% 4% 1% 79% 20%<br />
IT 1038 20% 55% 22% 3% - 75% 25%<br />
CY 504 17% 49% 29% 5% - 66% 34%<br />
LV 1019 11% 55% 30% 4% - 66% 34%<br />
LT 1025 18% 53% 25% 4% - 71% 29%<br />
LU 502 37% 40% 18% 5% - 77% 23%<br />
HU 1000 28% 41% 23% 8% - 69% 31%<br />
MT 500 25% 46% 22% 5% 2% 71% 27%<br />
NL 1020 31% 52% 15% 2% - 83% 17%<br />
AT 1029 31% 45% 21% 3% - 76% 24%<br />
PL 1000 20% 53% 22% 4% 1% 73% 26%<br />
PT 1004 13% 61% 22% 3% 1% 74% 25%<br />
SI 1019 22% 53% 22% 3% - 75% 25%<br />
SK 1003 14% 54% 29% 3% - 68% 32%<br />
FI 1028 25% 53% 20% 2% - 78% 22%<br />
SE 1014 30% 45% 20% 4% 1% 75% 24%<br />
UK 1315 33% 43% 20% 4% - 76% 24%<br />
BG 1023 14% 41% 34% 9% 2% 55% 43%<br />
RO 1000 16% 50% 27% 6% 1% 66% 33%<br />
Sex<br />
Male 11904 26% 49% 21% 4% - 75% 25%<br />
Female 12828 26% 48% 22% 4% - 74% 26%<br />
Age<br />
15-24 3755 27% 48% 22% 3% - 75% 25%<br />
25-39 6468 18% 48% 29% 5% - 66% 34%<br />
40-54 6326 19% 48% 27% 6% - 67% 33%<br />
55 + 8183 36% 49% 12% 2% 1% 85% 14%<br />
Education (End of)<br />
15 6147 31% 50% 16% 3% - 81% 19%<br />
16-19 10175 23% 49% 23% 5% - 72% 28%<br />
20+ 5626 22% 46% 27% 5% - 68% 32%<br />
Still Studying 2341 29% 47% 22% 2% - 76% 24%<br />
Left-Right scale<br />
(1-4) Left 6648 24% 49% 23% 4% - 73% 27%<br />
(5-6) Centre 8373 26% 49% 21% 4% - 75% 25%<br />
(7-10) Right 4340 28% 46% 22% 4% - 74% 26%<br />
Respondent occupation scale<br />
Self- employed 1876 20% 41% 32% 7% - 61% 39%<br />
Managers 2241 13% 49% 33% 5% - 62% 38%<br />
Other white collars 2982 14% 52% 28% 6% - 66% 34%<br />
Manual workers 5201 17% 49% 28% 6% - 66% 34%<br />
House persons 2402 29% 50% 17% 4% - 79% 21%<br />
Unemployed 1584 34% 48% 15% 3% - 82% 18%<br />
Retired 6106 41% 48% 9% 1% 1% 89% 10%<br />
Students 2341 29% 47% 22% 2% - 76% 24%<br />
Subjective urbanisation<br />
Rural village 8005 26% 49% 21% 4% - 75% 25%<br />
Small/ mid size town 10627 26% 48% 22% 4% - 74% 26%<br />
Large town 6068 26% 47% 23% 4% - 73% 27%<br />
EU27 results are purely indicative as it is impossible to anticipate the impact of the accession of these countries on the results.
QA3.7 I am now going to read out different aspects of everyday life. For each, could you tell me if this aspect of your life is very satisfactory, fairly satisfactory, not very satisfactory or not at all satisfactory?<br />
The medical services in your local area<br />
TOTAL Very satisfactory Fairly satisfactory Not very satisfactory Not at all satisfactory DK Satisfactory Not satisfactory<br />
EU25 24732 28% 49% 16% 4% 3% 77% 20%<br />
EU27 26755 27% 49% 17% 4% 3% 76% 21%<br />
BE 1009 54% 40% 5% 1% - 94% 6%<br />
CZ 1150 23% 52% 19% 5% 1% 75% 24%<br />
DK 1037 27% 41% 8% 2% 22% 68% 10%<br />
D-W 1000 40% 47% 10% 2% 1% 87% 12%<br />
DE 1504 38% 47% 12% 2% 1% 85% 14%<br />
D-E 504 28% 48% 18% 3% 3% 76% 21%<br />
EE 1000 15% 48% 25% 6% 6% 63% 31%<br />
EL 1000 15% 41% 32% 11% 1% 56% 43%<br />
ES 1000 20% 58% 17% 3% 2% 78% 20%<br />
FR 1012 34% 51% 10% 3% 2% 85% 13%<br />
IE 1000 32% 47% 12% 5% 4% 79% 17%<br />
IT 1038 14% 54% 26% 6% - 68% 32%<br />
CY 504 15% 48% 23% 11% 3% 63% 34%<br />
LV 1019 8% 45% 31% 8% 8% 53% 39%<br />
LT 1025 12% 46% 26% 12% 4% 58% 38%<br />
LU 502 57% 31% 8% 2% 2% 88% 10%<br />
HU 1000 29% 48% 13% 6% 4% 77% 19%<br />
MT 500 25% 48% 15% 7% 5% 73% 22%<br />
NL 1020 54% 37% 6% 1% 2% 91% 7%<br />
AT 1029 40% 53% 4% 2% 1% 93% 6%<br />
PL 1000 11% 53% 25% 7% 4% 64% 32%<br />
PT 1004 8% 50% 31% 8% 3% 58% 39%<br />
SI 1019 22% 52% 22% 3% 1% 74% 25%<br />
SK 1003 8% 57% 31% 4% - 65% 35%<br />
FI 1028 19% 51% 21% 5% 4% 70% 26%<br />
SE 1014 23% 46% 17% 5% 9% 69% 22%<br />
UK 1315 40% 43% 9% 3% 5% 83% 12%<br />
BG 1023 9% 34% 34% 18% 5% 43% 52%<br />
RO 1000 12% 42% 31% 12% 3% 54% 43%<br />
Sex<br />
Male 11904 27% 50% 15% 4% 4% 77% 19%<br />
Female 12828 29% 48% 17% 4% 2% 77% 21%<br />
Age<br />
15-24 3755 27% 47% 16% 5% 5% 74% 21%<br />
25-39 6468 26% 49% 18% 4% 3% 75% 22%<br />
40-54 6326 27% 50% 16% 5% 2% 77% 21%<br />
55 + 8183 32% 49% 14% 3% 2% 81% 17%<br />
Education (End of)<br />
15 6147 28% 51% 16% 4% 1% 79% 20%<br />
16-19 10175 28% 49% 16% 5% 2% 77% 21%<br />
20+ 5626 30% 47% 16% 3% 4% 77% 19%<br />
Still Studying 2341 28% 48% 15% 3% 6% 76% 18%<br />
Left-Right scale<br />
(1-4) Left 6648 30% 50% 15% 3% 2% 80% 18%<br />
(5-6) Centre 8373 30% 50% 15% 3% 2% 80% 18%<br />
(7-10) Right 4340 28% 48% 16% 5% 3% 76% 21%<br />
Respondent occupation scale<br />
Self- employed 1876 25% 47% 19% 6% 3% 72% 25%<br />
Managers 2241 28% 49% 15% 4% 4% 77% 19%<br />
Other white collars 2982 24% 52% 18% 3% 3% 76% 21%<br />
Manual workers 5201 26% 51% 16% 4% 3% 77% 20%<br />
House persons 2402 30% 49% 16% 4% 1% 79% 20%<br />
Unemployed 1584 26% 46% 19% 6% 3% 72% 25%<br />
Retired 6106 32% 48% 15% 3% 2% 80% 18%<br />
Students 2341 28% 48% 15% 3% 6% 76% 18%<br />
Subjective urbanisation<br />
Rural village 8005 27% 48% 18% 5% 2% 75% 23%<br />
Small/ mid size town 10627 28% 51% 15% 4% 2% 79% 19%<br />
Large town 6068 30% 47% 15% 3% 5% 77% 18%<br />
EU27 results are purely indicative as it is impossible to anticipate the impact of the accession of these countries on the results.
QA3.8 I am now going to read out different aspects of everyday life. For each, could you tell me if this aspect of your life is very satisfactory, fairly satisfactory, not very satisfactory or not at all satisfactory?<br />
The shopping facilities in your local area<br />
TOTAL Very satisfactory Fairly satisfactory Not very satisfactory Not at all satisfactory DK Satisfactory Not satisfactory<br />
EU25 24732 30% 48% 17% 4% 1% 78% 21%<br />
EU27 26755 29% 49% 18% 4% - 78% 22%<br />
BE 1009 42% 39% 13% 6% - 81% 19%<br />
CZ 1150 27% 43% 20% 10% - 70% 30%<br />
DK 1037 56% 32% 10% 2% - 88% 12%<br />
D-W 1000 41% 43% 13% 3% - 84% 16%<br />
DE 1504 41% 42% 13% 4% - 83% 17%<br />
D-E 504 44% 40% 11% 4% 1% 84% 15%<br />
EE 1000 26% 44% 22% 7% 1% 70% 29%<br />
EL 1000 22% 49% 24% 5% - 71% 29%<br />
ES 1000 24% 56% 17% 3% - 80% 20%<br />
FR 1012 24% 51% 18% 6% 1% 75% 24%<br />
IE 1000 43% 41% 13% 2% 1% 84% 15%<br />
IT 1038 15% 56% 25% 4% - 71% 29%<br />
CY 504 22% 47% 20% 11% - 69% 31%<br />
LV 1019 22% 52% 22% 3% 1% 74% 25%<br />
LT 1025 30% 49% 16% 4% 1% 79% 20%<br />
LU 502 30% 32% 23% 15% - 62% 38%<br />
HU 1000 34% 45% 16% 5% - 79% 21%<br />
MT 500 44% 43% 10% 2% 1% 87% 12%<br />
NL 1020 47% 37% 13% 3% - 84% 16%<br />
AT 1029 39% 49% 9% 2% 1% 88% 11%<br />
PL 1000 22% 58% 16% 3% 1% 80% 19%<br />
PT 1004 10% 56% 26% 7% 1% 66% 33%<br />
SI 1019 28% 45% 22% 5% - 73% 27%<br />
SK 1003 14% 55% 26% 5% - 69% 31%<br />
FI 1028 26% 54% 17% 3% - 80% 20%<br />
SE 1014 24% 40% 24% 10% 2% 64% 34%<br />
UK 1315 38% 42% 16% 3% 1% 80% 19%<br />
BG 1023 17% 52% 21% 8% 2% 69% 29%<br />
RO 1000 23% 50% 22% 4% 1% 73% 26%<br />
Sex<br />
Male 11904 29% 50% 17% 3% 1% 79% 20%<br />
Female 12828 30% 47% 18% 5% - 77% 23%<br />
Age<br />
15-24 3755 31% 45% 19% 5% - 76% 24%<br />
25-39 6468 28% 49% 19% 4% - 77% 23%<br />
40-54 6326 29% 49% 17% 5% - 78% 22%<br />
55 + 8183 30% 49% 16% 4% 1% 79% 20%<br />
Education (End of)<br />
15 6147 27% 50% 18% 5% - 77% 23%<br />
16-19 10175 30% 48% 17% 4% 1% 78% 21%<br />
20+ 5626 30% 49% 17% 4% - 79% 21%<br />
Still Studying 2341 31% 44% 20% 5% - 75% 25%<br />
Left-Right scale<br />
(1-4) Left 6648 31% 49% 17% 3% - 80% 20%<br />
(5-6) Centre 8373 31% 47% 17% 5% - 78% 22%<br />
(7-10) Right 4340 30% 49% 17% 4% - 79% 21%<br />
Respondent occupation scale<br />
Self- employed 1876 29% 49% 18% 4% - 78% 22%<br />
Managers 2241 30% 50% 15% 4% 1% 80% 19%<br />
Other white collars 2982 26% 52% 17% 5% - 78% 22%<br />
Manual workers 5201 29% 49% 18% 4% - 78% 22%<br />
House persons 2402 29% 49% 17% 5% - 78% 22%<br />
Unemployed 1584 31% 45% 19% 5% - 76% 24%<br />
Retired 6106 30% 48% 17% 4% 1% 78% 21%<br />
Students 2341 31% 44% 20% 5% - 75% 25%<br />
Subjective urbanisation<br />
Rural village 8005 21% 47% 25% 7% - 68% 32%<br />
Small/ mid size town 10627 31% 50% 15% 4% - 81% 19%<br />
Large town 6068 39% 46% 12% 2% 1% 85% 14%<br />
EU27 results are purely indicative as it is impossible to anticipate the impact of the accession of these countries on the results.
QA3.9 I am now going to read out different aspects of everyday life. For each, could you tell me if this aspect of your life is very satisfactory, fairly satisfactory, not very satisfactory or not at all satisfactory?<br />
The job opportunities in your local area<br />
TOTAL Very satisfactory Fairly satisfactory Not very satisfactory Not at all satisfactory DK Satisfactory Not satisfactory<br />
EU25 24732 9% 29% 31% 17% 14% 38% 48%<br />
EU27 26755 9% 28% 31% 18% 14% 37% 49%<br />
BE 1009 17% 36% 28% 11% 8% 53% 39%<br />
CZ 1150 7% 26% 35% 25% 7% 33% 60%<br />
DK 1037 18% 34% 20% 5% 23% 52% 25%<br />
D-W 1000 12% 36% 28% 12% 12% 48% 40%<br />
DE 1504 11% 32% 29% 17% 11% 43% 46%<br />
D-E 504 6% 14% 33% 39% 8% 20% 72%<br />
EE 1000 9% 27% 30% 17% 17% 36% 47%<br />
EL 1000 5% 18% 48% 26% 3% 23% 74%<br />
ES 1000 10% 35% 31% 13% 11% 45% 44%<br />
FR 1012 7% 24% 36% 16% 17% 31% 52%<br />
IE 1000 16% 37% 24% 10% 13% 53% 34%<br />
IT 1038 11% 34% 33% 18% 4% 45% 51%<br />
CY 504 6% 32% 37% 17% 8% 38% 54%<br />
LV 1019 6% 28% 33% 17% 16% 34% 50%<br />
LT 1025 5% 25% 30% 22% 18% 30% 52%<br />
LU 502 17% 33% 25% 13% 12% 50% 38%<br />
HU 1000 6% 20% 28% 38% 8% 26% 66%<br />
MT 500 6% 17% 25% 23% 29% 23% 48%<br />
NL 1020 17% 36% 18% 5% 24% 53% 23%<br />
AT 1029 25% 41% 20% 6% 8% 66% 26%<br />
PL 1000 3% 19% 37% 28% 13% 22% 65%<br />
PT 1004 3% 20% 42% 27% 8% 23% 69%<br />
SI 1019 8% 29% 42% 17% 4% 37% 59%<br />
SK 1003 4% 24% 37% 30% 5% 28% 67%<br />
FI 1028 10% 37% 33% 10% 10% 47% 43%<br />
SE 1014 8% 26% 24% 12% 30% 34% 36%<br />
UK 1315 8% 28% 25% 7% 32% 36% 32%<br />
BG 1023 5% 11% 30% 40% 14% 16% 70%<br />
RO 1000 5% 21% 31% 32% 11% 26% 63%<br />
Sex<br />
Male 11904 10% 31% 31% 15% 13% 41% 46%<br />
Female 12828 8% 27% 31% 18% 16% 35% 49%<br />
Age<br />
15-24 3755 9% 31% 33% 17% 10% 40% 50%<br />
25-39 6468 11% 32% 34% 16% 7% 43% 50%<br />
40-54 6326 10% 29% 32% 21% 8% 39% 53%<br />
55 + 8183 7% 26% 27% 13% 27% 33% 40%<br />
Education (End of)<br />
15 6147 6% 27% 31% 17% 19% 33% 48%<br />
16-19 10175 9% 29% 32% 18% 12% 38% 50%<br />
20+ 5626 12% 31% 30% 14% 13% 43% 44%<br />
Still Studying 2341 10% 29% 33% 14% 14% 39% 47%<br />
Left-Right scale<br />
(1-4) Left 6648 10% 30% 33% 14% 13% 40% 47%<br />
(5-6) Centre 8373 8% 31% 31% 15% 15% 39% 46%<br />
(7-10) Right 4340 9% 29% 29% 18% 15% 38% 47%<br />
Respondent occupation scale<br />
Self- employed 1876 15% 31% 26% 16% 12% 46% 42%<br />
Managers 2241 13% 35% 31% 10% 11% 48% 41%<br />
Other white collars 2982 10% 37% 33% 14% 6% 47% 47%<br />
Manual workers 5201 10% 33% 35% 16% 6% 43% 51%<br />
House persons 2402 9% 29% 31% 18% 13% 38% 49%<br />
Unemployed 1584 3% 16% 35% 41% 5% 19% 76%<br />
Retired 6106 5% 23% 27% 15% 30% 28% 42%<br />
Students 2341 10% 29% 33% 14% 14% 39% 47%<br />
Subjective urbanisation<br />
Rural village 8005 8% 26% 34% 21% 11% 34% 55%<br />
Small/ mid size town 10627 8% 30% 32% 17% 13% 38% 49%<br />
Large town 6068 12% 31% 27% 10% 20% 43% 37%<br />
EU27 results are purely indicative as it is impossible to anticipate the impact of the accession of these countries on the results.
QA3.10 I am now going to read out different aspects of everyday life. For each, could you tell me if this aspect of your life is very satisfactory, fairly satisfactory, not very satisfactory or not at all satisfactory?<br />
The childcare facilities in your local area<br />
TOTAL Very satisfactory Fairly satisfactory Not very satisfactory Not at all satisfactory DK Satisfactory Not satisfactory<br />
EU25 24732 13% 42% 16% 5% 24% 55% 21%<br />
EU27 26755 13% 41% 16% 6% 24% 54% 22%<br />
BE 1009 20% 45% 16% 5% 14% 65% 21%<br />
CZ 1150 19% 53% 12% 5% 11% 72% 17%<br />
DK 1037 30% 36% 4% 1% 29% 66% 5%<br />
D-W 1000 16% 44% 10% 3% 27% 60% 13%<br />
DE 1504 17% 44% 10% 3% 26% 61% 13%<br />
D-E 504 18% 43% 11% 4% 24% 61% 15%<br />
EE 1000 18% 41% 12% 5% 24% 59% 17%<br />
EL 1000 12% 41% 31% 9% 7% 53% 40%<br />
ES 1000 12% 46% 23% 8% 11% 58% 31%<br />
FR 1012 12% 51% 16% 4% 17% 63% 20%<br />
IE 1000 13% 30% 10% 7% 40% 43% 17%<br />
IT 1038 10% 46% 29% 8% 7% 56% 37%<br />
CY 504 28% 50% 12% 6% 4% 78% 18%<br />
LV 1019 6% 41% 17% 5% 31% 47% 22%<br />
LT 1025 10% 36% 11% 10% 33% 46% 21%<br />
LU 502 33% 29% 12% 6% 20% 62% 18%<br />
HU 1000 18% 43% 21% 9% 9% 61% 30%<br />
MT 500 6% 22% 12% 17% 43% 28% 29%<br />
NL 1020 16% 26% 5% 1% 52% 42% 6%<br />
AT 1029 26% 45% 8% 1% 20% 71% 9%<br />
PL 1000 7% 48% 17% 8% 20% 55% 25%<br />
PT 1004 6% 50% 30% 10% 4% 56% 40%<br />
SI 1019 22% 50% 16% 3% 9% 72% 19%<br />
SK 1003 8% 54% 23% 8% 7% 62% 31%<br />
FI 1028 15% 50% 10% 1% 24% 65% 11%<br />
SE 1014 19% 27% 3% 2% 49% 46% 5%<br />
UK 1315 9% 21% 8% 2% 60% 30% 10%<br />
BG 1023 8% 34% 22% 15% 21% 42% 37%<br />
RO 1000 6% 29% 25% 13% 27% 35% 38%<br />
Sex<br />
Male 11904 12% 42% 15% 5% 26% 54% 20%<br />
Female 12828 14% 42% 16% 6% 22% 56% 22%<br />
Age<br />
15-24 3755 13% 41% 16% 5% 25% 54% 21%<br />
25-39 6468 15% 44% 18% 6% 17% 59% 24%<br />
40-54 6326 14% 43% 17% 6% 20% 57% 23%<br />
55 + 8183 11% 40% 13% 4% 32% 51% 17%<br />
Education (End of)<br />
15 6147 11% 41% 17% 6% 25% 52% 23%<br />
16-19 10175 13% 43% 15% 6% 23% 56% 21%<br />
20+ 5626 15% 42% 15% 4% 24% 57% 19%<br />
Still Studying 2341 12% 40% 17% 5% 26% 52% 22%<br />
Left-Right scale<br />
(1-4) Left 6648 14% 44% 15% 5% 22% 58% 20%<br />
(5-6) Centre 8373 13% 42% 15% 4% 26% 55% 19%<br />
(7-10) Right 4340 13% 40% 16% 6% 25% 53% 22%<br />
Respondent occupation scale<br />
Self- employed 1876 17% 42% 16% 6% 19% 59% 22%<br />
Managers 2241 15% 41% 13% 4% 27% 56% 17%<br />
Other white collars 2982 14% 45% 17% 5% 19% 59% 22%<br />
Manual workers 5201 14% 44% 17% 5% 20% 58% 22%<br />
House persons 2402 15% 44% 18% 7% 16% 59% 25%<br />
Unemployed 1584 11% 39% 19% 8% 23% 50% 27%<br />
Retired 6106 10% 39% 13% 5% 33% 49% 18%<br />
Students 2341 12% 40% 17% 5% 26% 52% 22%<br />
Subjective urbanisation<br />
Rural village 8005 13% 42% 19% 8% 18% 55% 27%<br />
Small/ mid size town 10627 13% 44% 15% 4% 24% 57% 19%<br />
Large town 6068 13% 39% 13% 4% 31% 52% 17%<br />
EU27 results are purely indicative as it is impossible to anticipate the impact of the accession of these countries on the results.
QA3.11 I am now going to read out different aspects of everyday life. For each, could you tell me if this aspect of your life is very satisfactory, fairly satisfactory, not very satisfactory or not at all satisfactory?<br />
The schools in your local area<br />
TOTAL Very satisfactory Fairly satisfactory Not very satisfactory Not at all satisfactory DK Satisfactory Not satisfactory<br />
EU25 24732 22% 49% 11% 3% 15% 71% 14%<br />
EU27 26755 21% 49% 12% 3% 15% 70% 15%<br />
BE 1009 42% 46% 5% 3% 4% 88% 8%<br />
CZ 1150 24% 53% 11% 6% 6% 77% 17%<br />
DK 1037 32% 37% 5% 2% 24% 69% 7%<br />
D-W 1000 24% 44% 11% 2% 19% 68% 13%<br />
DE 1504 23% 43% 12% 3% 19% 66% 15%<br />
D-E 504 18% 38% 18% 9% 17% 56% 27%<br />
EE 1000 24% 46% 11% 2% 17% 70% 13%<br />
EL 1000 21% 51% 18% 6% 4% 72% 24%<br />
ES 1000 14% 57% 15% 4% 10% 71% 19%<br />
FR 1012 19% 59% 7% 1% 14% 78% 8%<br />
IE 1000 39% 39% 4% 3% 15% 78% 7%<br />
IT 1038 14% 56% 21% 4% 5% 70% 25%<br />
CY 504 37% 53% 4% 5% 1% 90% 9%<br />
LV 1019 15% 53% 10% 2% 20% 68% 12%<br />
LT 1025 17% 45% 10% 6% 22% 62% 16%<br />
LU 502 42% 32% 9% 3% 14% 74% 12%<br />
HU 1000 28% 46% 11% 8% 7% 74% 19%<br />
MT 500 22% 44% 7% 2% 25% 66% 9%<br />
NL 1020 34% 33% 5% 1% 27% 67% 6%<br />
AT 1029 29% 47% 9% 1% 14% 76% 10%<br />
PL 1000 18% 60% 10% 2% 10% 78% 12%<br />
PT 1004 10% 63% 21% 3% 3% 73% 24%<br />
SI 1019 26% 56% 12% 2% 4% 82% 14%<br />
SK 1003 12% 61% 18% 5% 4% 73% 23%<br />
FI 1028 24% 54% 8% 1% 13% 78% 9%<br />
SE 1014 23% 34% 7% 2% 34% 57% 9%<br />
UK 1315 30% 32% 6% 2% 30% 62% 8%<br />
BG 1023 11% 40% 19% 15% 15% 51% 34%<br />
RO 1000 15% 47% 18% 6% 14% 62% 24%<br />
Sex<br />
Male 11904 21% 49% 12% 3% 15% 70% 15%<br />
Female 12828 23% 49% 11% 3% 14% 72% 14%<br />
Age<br />
15-24 3755 25% 48% 14% 2% 11% 73% 16%<br />
25-39 6468 23% 49% 13% 3% 12% 72% 16%<br />
40-54 6326 23% 51% 12% 3% 11% 74% 15%<br />
55 + 8183 19% 47% 9% 3% 22% 66% 12%<br />
Education (End of)<br />
15 6147 17% 49% 13% 4% 17% 66% 17%<br />
16-19 10175 23% 49% 11% 3% 14% 72% 14%<br />
20+ 5626 23% 49% 10% 2% 16% 72% 12%<br />
Still Studying 2341 26% 48% 14% 3% 9% 74% 17%<br />
Left-Right scale<br />
(1-4) Left 6648 22% 51% 11% 2% 14% 73% 13%<br />
(5-6) Centre 8373 23% 47% 10% 3% 17% 70% 13%<br />
(7-10) Right 4340 22% 48% 12% 3% 15% 70% 15%<br />
Respondent occupation scale<br />
Self- employed 1876 22% 48% 13% 4% 13% 70% 17%<br />
Managers 2241 25% 47% 10% 2% 16% 72% 12%<br />
Other white collars 2982 20% 53% 11% 3% 13% 73% 14%<br />
Manual workers 5201 23% 51% 12% 3% 11% 74% 15%<br />
House persons 2402 25% 50% 11% 4% 10% 75% 15%<br />
Unemployed 1584 20% 47% 16% 4% 13% 67% 20%<br />
Retired 6106 18% 47% 9% 2% 24% 65% 11%<br />
Students 2341 26% 48% 14% 3% 9% 74% 17%<br />
Subjective urbanisation<br />
Rural village 8005 21% 50% 14% 4% 11% 71% 18%<br />
Small/ mid size town 10627 22% 51% 10% 2% 15% 73% 12%<br />
Large town 6068 22% 44% 10% 3% 21% 66% 13%<br />
EU27 results are purely indicative as it is impossible to anticipate the impact of the accession of these countries on the results.
QA3.12 I am now going to read out different aspects of everyday life. For each, could you tell me if this aspect of your life is very satisfactory, fairly satisfactory, not very satisfactory or not at all satisfactory?<br />
Leisure facilities in your town<br />
TOTAL Very satisfactory Fairly satisfactory Not very satisfactory Not at all satisfactory DK Satisfactory Not satisfactory<br />
EU25 24732 16% 44% 26% 9% 5% 60% 35%<br />
EU27 26755 16% 43% 26% 10% 5% 59% 36%<br />
BE 1009 25% 44% 20% 9% 2% 69% 29%<br />
CZ 1150 14% 48% 25% 11% 2% 62% 36%<br />
DK 1037 34% 40% 9% 2% 15% 74% 11%<br />
D-W 1000 23% 50% 21% 3% 3% 73% 24%<br />
DE 1504 20% 48% 24% 5% 3% 68% 29%<br />
D-E 504 11% 40% 32% 13% 4% 51% 45%<br />
EE 1000 17% 45% 20% 10% 8% 62% 30%<br />
EL 1000 10% 37% 37% 14% 2% 47% 51%<br />
ES 1000 17% 48% 23% 8% 4% 65% 31%<br />
FR 1012 12% 50% 27% 6% 5% 62% 33%<br />
IE 1000 24% 39% 19% 11% 7% 63% 30%<br />
IT 1038 11% 40% 36% 11% 2% 51% 47%<br />
CY 504 13% 39% 24% 20% 4% 52% 44%<br />
LV 1019 6% 38% 32% 18% 6% 44% 50%<br />
LT 1025 7% 32% 32% 19% 10% 39% 51%<br />
LU 502 29% 37% 19% 6% 9% 66% 25%<br />
HU 1000 13% 33% 28% 19% 7% 46% 47%<br />
MT 500 10% 36% 24% 16% 14% 46% 40%<br />
NL 1020 31% 49% 11% 2% 7% 80% 13%<br />
AT 1029 28% 45% 16% 6% 5% 73% 22%<br />
PL 1000 8% 35% 34% 17% 6% 43% 51%<br />
PT 1004 5% 43% 36% 13% 3% 48% 49%<br />
SI 1019 17% 50% 26% 5% 2% 67% 31%<br />
SK 1003 4% 34% 38% 20% 4% 38% 58%<br />
FI 1028 19% 56% 17% 3% 5% 75% 20%<br />
SE 1014 31% 45% 13% 4% 7% 76% 17%<br />
UK 1315 20% 44% 20% 6% 10% 64% 26%<br />
BG 1023 8% 23% 31% 30% 8% 31% 61%<br />
RO 1000 9% 31% 27% 21% 12% 40% 48%<br />
Sex<br />
Male 11904 17% 45% 26% 8% 4% 62% 34%<br />
Female 12828 16% 43% 26% 9% 6% 59% 35%<br />
Age<br />
15-24 3755 20% 38% 30% 10% 2% 58% 40%<br />
25-39 6468 15% 45% 28% 9% 3% 60% 37%<br />
40-54 6326 15% 44% 28% 10% 3% 59% 38%<br />
55 + 8183 16% 47% 20% 7% 10% 63% 27%<br />
Education (End of)<br />
15 6147 14% 45% 24% 9% 8% 59% 33%<br />
16-19 10175 15% 45% 27% 9% 4% 60% 36%<br />
20+ 5626 18% 45% 26% 7% 4% 63% 33%<br />
Still Studying 2341 23% 39% 27% 9% 2% 62% 36%<br />
Left-Right scale<br />
(1-4) Left 6648 19% 45% 26% 7% 3% 64% 33%<br />
(5-6) Centre 8373 16% 47% 25% 7% 5% 63% 32%<br />
(7-10) Right 4340 16% 43% 27% 10% 4% 59% 37%<br />
Respondent occupation scale<br />
Self- employed 1876 18% 40% 27% 12% 3% 58% 39%<br />
Managers 2241 18% 51% 22% 6% 3% 69% 28%<br />
Other white collars 2982 15% 47% 27% 8% 3% 62% 35%<br />
Manual workers 5201 14% 44% 30% 9% 3% 58% 39%<br />
House persons 2402 19% 44% 24% 8% 5% 63% 32%<br />
Unemployed 1584 12% 37% 33% 12% 6% 49% 45%<br />
Retired 6106 16% 46% 21% 7% 10% 62% 28%<br />
Students 2341 23% 39% 27% 9% 2% 62% 36%<br />
Subjective urbanisation<br />
Rural village 8005 13% 39% 30% 13% 5% 52% 43%<br />
Small/ mid size town 10627 15% 47% 26% 7% 5% 62% 33%<br />
Large town 6068 22% 45% 20% 6% 7% 67% 26%<br />
EU27 results are purely indicative as it is impossible to anticipate the impact of the accession of these countries on the results.
TOTAL Your partner Family member Work colleague Friend Neighbour Someone else Nobody DK<br />
EU25 24732 45% 43% 1% 5% 2% 2% 2% -<br />
EU27 26755 45% 43% 1% 5% 2% 2% 2% -<br />
BE 1009 50% 35% 1% 4% 2% 6% 2% -<br />
CZ 1150 38% 49% 2% 6% 2% 1% 1% 1%<br />
DK 1037 54% 30% - 9% 3% 2% 2% -<br />
D-W 1000 58% 32% 1% 3% 1% 3% 2% -<br />
DE 1504 58% 32% 1% 3% 1% 3% 2% -<br />
D-E 504 58% 31% - 5% 2% 3% 1% -<br />
EE 1000 25% 61% - 6% 4% 2% 2% -<br />
EL 1000 45% 46% - 6% 1% 1% 1% -<br />
ES 1000 42% 51% - 3% 1% 1% 2% -<br />
FR 1012 47% 34% 1% 8% 3% 3% 3% 1%<br />
IE 1000 41% 49% - 5% 2% 1% 1% 1%<br />
IT 1038 34% 58% 1% 3% 1% 2% 1% -<br />
CY 504 52% 45% - 1% 1% 1% - -<br />
LV 1019 21% 65% 1% 7% 3% 1% 2% -<br />
LT 1025 26% 58% - 5% 6% 3% 2% -<br />
LU 502 50% 40% - 3% - 6% - 1%<br />
HU 1000 42% 46% 1% 5% 2% 2% 2% -<br />
MT 500 34% 62% - 2% - 1% 1% -<br />
NL 1020 48% 30% - 9% 3% 6% 2% 2%<br />
AT 1029 42% 44% 1% 7% 3% 2% 1% -<br />
PL 1000 37% 52% 2% 3% 2% 1% 2% 1%<br />
PT 1004 42% 49% 1% 2% 2% 2% 1% 1%<br />
SI 1019 40% 47% 1% 5% 5% 1% 1% -<br />
SK 1003 33% 59% - 5% 1% 1% 1% -<br />
FI 1028 54% 30% 1% 8% 3% 3% 1% -<br />
SE 1014 56% 34% - 5% 2% 1% 1% 1%<br />
UK 1315 44% 40% - 8% 2% 2% 3% 1%<br />
BG 1023 46% 44% - 2% 3% 2% 2% 1%<br />
RO 1000 44% 47% 1% 3% 3% - 2% -<br />
Sex<br />
Male 11904 50% 38% 1% 5% 1% 2% 2% 1%<br />
Female 12828 39% 47% 1% 5% 2% 3% 2% 1%<br />
Age<br />
15-24 3755 15% 75% 1% 6% 1% 1% 1% -<br />
25-39 6468 52% 38% 1% 5% 1% 1% 2% -<br />
40-54 6326 55% 33% 1% 6% 1% 1% 2% 1%<br />
55 + 8183 44% 40% - 4% 4% 5% 2% 1%<br />
Education (End of)<br />
15 6147 42% 44% 1% 3% 3% 3% 3% 1%<br />
16-19 10175 49% 39% 1% 5% 2% 2% 2% -<br />
20+ 5626 55% 32% 1% 6% 2% 2% 2% -<br />
Still Studying 2341 8% 81% 1% 7% 1% 1% 1% -<br />
Left-Right scale<br />
(1-4) Left 6648 48% 39% 1% 6% 2% 2% 2% -<br />
(5-6) Centre 8373 46% 41% 1% 5% 2% 2% 2% 1%<br />
(7-10) Right 4340 47% 41% 1% 4% 2% 3% 2% -<br />
Respondent occupation scale<br />
Self- employed 1876 56% 33% 1% 5% 1% 1% 2% 1%<br />
Managers 2241 62% 26% 1% 6% 1% 2% 1% 1%<br />
Other white collars 2982 50% 41% 1% 4% 1% 1% 2% -<br />
Manual workers 5201 51% 39% 1% 5% 1% 1% 2% -<br />
House persons 2402 49% 42% 1% 3% 2% 2% 1% -<br />
Unemployed 1584 32% 49% 1% 10% 2% 2% 3% 1%<br />
Retired 6106 42% 40% - 4% 4% 6% 3% 1%<br />
Students 2341 8% 81% 1% 7% 1% 1% 1% -<br />
Subjective urbanisation<br />
Rural village 8005 49% 40% 1% 3% 2% 3% 2% -<br />
Small/ mid size town 10627 44% 43% 1% 5% 2% 2% 2% 1%<br />
Large town 6068 40% 45% 1% 7% 2% 2% 2% 1%<br />
QA4.1 From whom would you get support in each of the following situations? For each situation, choose the most important person.<br />
If you needed help around the house when ill<br />
EU27 results are purely indicative as it is impossible to anticipate the impact of the accession of these countries on the results.
TOTAL Your partner Family member Work colleague Friend Neighbour Someone else Nobody DK<br />
EU25 24732 38% 40% 1% 14% 1% 3% 2% 1%<br />
EU27 26755 38% 40% 1% 14% 1% 3% 2% 1%<br />
BE 1009 41% 35% 2% 13% - 6% 3% -<br />
CZ 1150 35% 41% 2% 16% 1% 3% 2% -<br />
DK 1037 40% 30% 2% 23% 1% 2% 2% -<br />
D-W 1000 54% 26% 1% 12% 1% 3% 3% -<br />
DE 1504 54% 27% 1% 12% 1% 2% 3% -<br />
D-E 504 52% 32% 1% 10% 2% 1% 1% 1%<br />
EE 1000 18% 51% 2% 19% 2% 2% 5% 1%<br />
EL 1000 37% 43% 1% 16% 1% 1% 1% -<br />
ES 1000 38% 39% 1% 17% 1% 1% 2% 1%<br />
FR 1012 31% 39% 1% 18% 1% 6% 3% 1%<br />
IE 1000 38% 44% - 13% 1% 2% 1% 1%<br />
IT 1038 29% 54% 2% 12% 1% 1% 1% -<br />
CY 504 40% 44% 1% 13% - 1% 1% -<br />
LV 1019 16% 49% 3% 21% 2% 3% 5% 1%<br />
LT 1025 22% 54% 1% 12% 4% 3% 3% 1%<br />
LU 502 40% 37% 1% 16% 1% 2% 2% 1%<br />
HU 1000 40% 44% 2% 9% 2% 1% 2% -<br />
MT 500 28% 47% 1% 11% - 9% 2% 2%<br />
NL 1020 43% 30% - 20% 1% 3% 2% 1%<br />
AT 1029 37% 37% 1% 20% 2% 1% 2% -<br />
PL 1000 34% 49% 3% 9% 1% 1% 2% 1%<br />
PT 1004 36% 47% 2% 9% 1% 2% 1% 2%<br />
SI 1019 38% 37% 1% 19% 1% 2% 1% 1%<br />
SK 1003 33% 50% 2% 11% 1% 2% 1% -<br />
FI 1028 31% 33% 3% 22% 1% 7% 1% 2%<br />
SE 1014 42% 32% 1% 20% 1% 2% 1% 1%<br />
UK 1315 37% 39% 1% 15% 1% 4% 2% 1%<br />
BG 1023 35% 42% 1% 15% 1% 2% 2% 2%<br />
RO 1000 40% 41% 2% 12% 2% 1% 1% 1%<br />
Sex<br />
Male 11904 43% 35% 2% 14% 1% 2% 2% 1%<br />
Female 12828 34% 44% 1% 14% 1% 3% 2% 1%<br />
Age<br />
15-24 3755 15% 57% 1% 24% 1% 1% 1% -<br />
25-39 6468 44% 35% 2% 16% - 1% 1% 1%<br />
40-54 6326 48% 30% 1% 14% - 3% 3% 1%<br />
55 + 8183 37% 43% 1% 9% 2% 4% 3% 1%<br />
Education (End of)<br />
15 6147 38% 44% 1% 9% 2% 2% 3% 1%<br />
16-19 10175 41% 37% 1% 14% 1% 3% 2% 1%<br />
20+ 5626 46% 33% 1% 15% - 2% 2% 1%<br />
Still Studying 2341 11% 57% 1% 29% - 1% 1% -<br />
Left-Right scale<br />
(1-4) Left 6648 39% 37% 2% 17% 1% 2% 2% -<br />
(5-6) Centre 8373 41% 38% 1% 13% 1% 3% 2% 1%<br />
(7-10) Right 4340 40% 38% 1% 14% 1% 3% 2% 1%<br />
Respondent occupation scale<br />
Self- employed 1876 49% 31% 1% 13% 1% 2% 2% 1%<br />
Managers 2241 53% 28% 1% 14% - 3% 1% -<br />
Other white collars 2982 42% 37% 2% 16% - 1% 1% 1%<br />
Manual workers 5201 43% 36% 2% 14% - 2% 2% 1%<br />
House persons 2402 45% 37% 1% 11% 1% 2% 2% 1%<br />
Unemployed 1584 28% 43% 1% 21% 1% 3% 3% -<br />
Retired 6106 35% 45% 1% 9% 2% 4% 3% 1%<br />
Students 2341 11% 57% 1% 29% - 1% 1% -<br />
Subjective urbanisation<br />
Rural village 8005 43% 37% 1% 12% 1% 3% 2% 1%<br />
Small/ mid size town 10627 36% 42% 1% 15% 1% 2% 2% 1%<br />
Large town 6068 35% 40% 2% 17% 1% 2% 2% 1%<br />
QA4.2 From whom would you get support in each of the following situations? For each situation, choose the most important person.<br />
If you needed advice about a serious personal or family matter<br />
EU27 results are purely indicative as it is impossible to anticipate the impact of the accession of these countries on the results.
TOTAL Your partner Family member Work colleague Friend Neighbour Someone else Nobody DK<br />
EU25 24732 37% 29% 2% 24% 2% 2% 3% 1%<br />
EU27 26755 37% 29% 2% 24% 2% 2% 3% 1%<br />
BE 1009 38% 22% 2% 25% 1% 6% 6% -<br />
CZ 1150 29% 23% 3% 38% 2% 2% 2% 1%<br />
DK 1037 42% 20% 2% 25% 2% 3% 4% 2%<br />
D-W 1000 49% 22% 1% 19% 1% 2% 5% 1%<br />
DE 1504 49% 22% 1% 20% 1% 2% 4% 1%<br />
D-E 504 49% 21% 2% 21% 2% 2% 2% 1%<br />
EE 1000 19% 37% 2% 31% 3% 1% 6% 1%<br />
EL 1000 33% 34% 1% 28% 1% 1% 2% -<br />
ES 1000 38% 33% 1% 21% 1% 1% 4% 1%<br />
FR 1012 32% 21% 1% 33% 1% 5% 7% -<br />
IE 1000 35% 36% 1% 19% 1% 4% 3% 1%<br />
IT 1038 28% 41% 2% 24% 2% 1% 2% -<br />
CY 504 35% 36% 2% 24% 1% 1% 1% -<br />
LV 1019 16% 33% 3% 36% 4% 3% 4% 1%<br />
LT 1025 21% 39% 1% 26% 6% 3% 3% 1%<br />
LU 502 37% 22% 1% 27% 2% 4% 6% 1%<br />
HU 1000 39% 31% 1% 21% 4% 1% 3% -<br />
MT 500 30% 37% 1% 23% - 4% 4% 1%<br />
NL 1020 42% 19% 1% 26% 1% 4% 5% 2%<br />
AT 1029 41% 27% 1% 26% 2% 1% 1% 1%<br />
PL 1000 34% 35% 6% 18% 3% 1% 2% 1%<br />
PT 1004 36% 38% 3% 15% 2% 3% 2% 1%<br />
SI 1019 36% 31% 1% 27% 1% 1% 2% 1%<br />
SK 1003 34% 31% 3% 26% 2% 3% 1% -<br />
FI 1028 36% 20% 2% 33% 2% 5% 1% 1%<br />
SE 1014 41% 22% 1% 25% 1% 7% 1% 2%<br />
UK 1315 37% 28% 1% 24% 2% 3% 4% 1%<br />
BG 1023 30% 28% 1% 32% 5% 1% 2% 1%<br />
RO 1000 36% 31% 3% 21% 4% 1% 2% 2%<br />
Sex<br />
Male 11904 44% 24% 2% 22% 1% 2% 4% 1%<br />
Female 12828 30% 33% 2% 26% 2% 3% 3% 1%<br />
Age<br />
15-24 3755 19% 35% 2% 41% - 1% 2% -<br />
25-39 6468 43% 25% 2% 25% - 2% 2% 1%<br />
40-54 6326 44% 23% 2% 22% 1% 4% 3% 1%<br />
55 + 8183 35% 34% 1% 16% 4% 3% 6% 1%<br />
Education (End of)<br />
15 6147 35% 36% 1% 16% 4% 2% 5% 1%<br />
16-19 10175 40% 26% 2% 23% 1% 3% 4% 1%<br />
20+ 5626 43% 21% 3% 26% - 3% 3% 1%<br />
Still Studying 2341 14% 37% 2% 45% - 1% 1% -<br />
Left-Right scale<br />
(1-4) Left 6648 38% 26% 2% 27% 1% 3% 3% -<br />
(5-6) Centre 8373 38% 27% 2% 24% 2% 3% 3% 1%<br />
(7-10) Right 4340 39% 27% 2% 23% 2% 2% 4% 1%<br />
Respondent occupation scale<br />
Self- employed 1876 48% 23% 1% 20% 1% 2% 4% 1%<br />
Managers 2241 50% 18% 2% 25% - 2% 2% 1%<br />
Other white collars 2982 41% 26% 2% 26% - 2% 2% 1%<br />
Manual workers 5201 42% 24% 3% 24% 1% 2% 3% 1%<br />
House persons 2402 39% 31% 1% 21% 2% 2% 3% 1%<br />
Unemployed 1584 28% 31% 1% 29% 2% 4% 4% 1%<br />
Retired 6106 34% 35% 1% 16% 4% 3% 6% 1%<br />
Students 2341 14% 37% 2% 45% - 1% 1% -<br />
Subjective urbanisation<br />
Rural village 8005 40% 28% 2% 21% 2% 3% 3% 1%<br />
Small/ mid size town 10627 36% 29% 2% 25% 2% 2% 3% 1%<br />
Large town 6068 34% 30% 2% 25% 1% 3% 4% 1%<br />
QA4.3 From whom would you get support in each of the following situations? For each situation, choose the most important person.<br />
If you were feeling a bit depressed and wanting someone to talk to<br />
EU27 results are purely indicative as it is impossible to anticipate the impact of the accession of these countries on the results.
QA4.4 From whom would you get support in each of the following situations? For each situation, choose the most important person.<br />
If you needed to urgently raise an important sum of money to face an emergency<br />
TOTAL Your partner Family member Work colleague Friend Neighbour Someone else Nobody DK<br />
EU25 24732 14% 55% 1% 6% 1% 9% 10% 4%<br />
EU27 26755 14% 55% 1% 6% 1% 9% 10% 4%<br />
BE 1009 12% 52% 1% 3% - 17% 14% 1%<br />
CZ 1150 11% 53% 1% 8% 1% 13% 9% 4%<br />
DK 1037 17% 49% 1% 6% 1% 11% 9% 6%<br />
D-W 1000 20% 45% 1% 4% - 9% 16% 5%<br />
DE 1504 19% 46% - 5% - 9% 16% 5%<br />
D-E 504 17% 46% - 7% 1% 9% 18% 2%<br />
EE 1000 6% 54% 2% 17% 1% 5% 9% 6%<br />
EL 1000 16% 64% 1% 11% - 3% 5% -<br />
ES 1000 14% 65% 1% 6% - 3% 7% 4%<br />
FR 1012 7% 52% - 4% 1% 14% 19% 3%<br />
IE 1000 23% 46% 1% 5% - 15% 4% 6%<br />
IT 1038 14% 67% 2% 7% - 6% 2% 2%<br />
CY 504 24% 53% - 2% - 15% 6% -<br />
LV 1019 6% 44% 7% 17% 2% 10% 10% 4%<br />
LT 1025 8% 54% 3% 15% 4% 6% 7% 3%<br />
LU 502 9% 45% - 4% - 27% 11% 4%<br />
HU 1000 11% 49% 1% 6% 2% 7% 21% 3%<br />
MT 500 10% 50% - 2% - 18% 8% 12%<br />
NL 1020 14% 52% 1% 4% - 13% 10% 6%<br />
AT 1029 23% 49% 1% 8% 1% 4% 7% 7%<br />
PL 1000 8% 58% 4% 8% 2% 7% 9% 4%<br />
PT 1004 8% 57% 1% 4% 1% 6% 11% 12%<br />
SI 1019 15% 55% 1% 14% 1% 7% 4% 3%<br />
SK 1003 9% 69% 1% 8% 1% 5% 5% 2%<br />
FI 1028 16% 44% 1% 5% - 27% 5% 2%<br />
SE 1014 15% 51% 2% 5% - 15% 6% 6%<br />
UK 1315 20% 51% 1% 5% - 9% 8% 6%<br />
BG 1023 9% 43% 3% 19% 2% 2% 14% 8%<br />
RO 1000 16% 53% 3% 13% 2% 3% 6% 4%<br />
Sex<br />
Male 11904 12% 54% 2% 7% - 10% 11% 4%<br />
Female 12828 17% 56% 1% 5% - 7% 10% 4%<br />
Age<br />
15-24 3755 6% 79% 1% 7% - 2% 3% 2%<br />
25-39 6468 14% 61% 2% 6% - 7% 7% 3%<br />
40-54 6326 17% 48% 1% 7% - 11% 12% 4%<br />
55 + 8183 16% 44% 1% 4% 1% 12% 15% 7%<br />
Education (End of)<br />
15 6147 14% 49% 1% 5% 1% 10% 15% 5%<br />
16-19 10175 16% 52% 1% 6% 1% 9% 11% 4%<br />
20+ 5626 15% 55% 1% 7% - 10% 8% 4%<br />
Still Studying 2341 4% 83% 1% 7% - 1% 2% 2%<br />
Left-Right scale<br />
(1-4) Left 6648 14% 55% 1% 6% 1% 9% 10% 4%<br />
(5-6) Centre 8373 16% 52% 1% 5% - 10% 12% 4%<br />
(7-10) Right 4340 14% 55% 1% 6% 1% 10% 10% 3%<br />
Respondent occupation scale<br />
Self- employed 1876 17% 48% 2% 8% 1% 12% 8% 4%<br />
Managers 2241 18% 53% 1% 7% 1% 11% 6% 3%<br />
Other white collars 2982 16% 59% 2% 7% - 7% 6% 3%<br />
Manual workers 5201 13% 56% 1% 6% - 9% 11% 4%<br />
House persons 2402 24% 51% 1% 4% - 8% 7% 5%<br />
Unemployed 1584 9% 58% 1% 10% 1% 4% 14% 3%<br />
Retired 6106 14% 45% 1% 4% 1% 12% 17% 6%<br />
Students 2341 4% 83% 1% 7% - 1% 2% 2%<br />
Subjective urbanisation<br />
Rural village 8005 15% 54% 1% 5% - 9% 11% 5%<br />
Small/ mid size town 10627 12% 55% 1% 6% 1% 10% 11% 4%<br />
Large town 6068 17% 56% 1% 7% - 7% 8% 4%<br />
EU27 results are purely indicative as it is impossible to anticipate the impact of the accession of these countries on the results.
QA5 In your opinion, out of the following, which are the 2 most important things for getting ahead in life? (MAX. 2 ANSWERS)<br />
DK<br />
Other<br />
(SPONTANEOUS)<br />
Being a man Being lucky Being smart<br />
Knowing the right<br />
people<br />
Coming from a<br />
wealthy family<br />
Working hard<br />
Getting a good<br />
education<br />
TOTAL<br />
EU25 24732 62% 45% 9% 26% 2% 24% 17% 2% 1%<br />
EU27 26755 61% 45% 10% 26% 3% 25% 18% 2% 1%<br />
BE 1009 63% 49% 5% 20% 2% 34% 18% 3% -<br />
CZ 1150 47% 29% 11% 31% 3% 45% 19% 3% 0%<br />
DK 1037 83% 43% 2% 29% 1% 18% 15% 2% 1%<br />
D-W 1000 82% 27% 8% 26% 2% 19% 24% 1% -<br />
DE 1504 81% 28% 8% 28% 2% 19% 23% 1% 0%<br />
D-E 504 73% 31% 8% 39% 2% 21% 16% 0% 0%<br />
EE 1000 66% 41% 4% 27% 5% 20% 20% 3% 1%<br />
EL 1000 54% 57% 10% 29% 1% 25% 17% 2% -<br />
ES 1000 50% 50% 9% 18% 2% 36% 21% 2% 1%<br />
FR 1012 58% 54% 5% 20% 3% 24% 26% 3% 1%<br />
IE 1000 74% 60% 5% 19% 3% 15% 11% 2% 3%<br />
IT 1038 46% 44% 18% 32% 4% 26% 7% 1% 0%<br />
CY 504 74% 46% 11% 22% 1% 15% 14% 6% 2%<br />
LV 1019 69% 15% 6% 36% 1% 38% 23% 3% 1%<br />
LT 1025 67% 23% 8% 28% 3% 16% 36% 2% 2%<br />
LU 502 75% 36% 4% 23% 1% 18% 26% 1% 1%<br />
HU 1000 33% 40% 31% 29% 2% 31% 22% 2% 1%<br />
MT 500 75% 27% 5% 18% 11% 13% 34% 4% 1%<br />
NL 1020 61% 36% 2% 22% 1% 38% 26% 6% 1%<br />
AT 1029 58% 44% 16% 31% 5% 24% 10% 1% 1%<br />
PL 1000 57% 36% 12% 32% 4% 27% 16% 2% 1%<br />
PT 1004 67% 37% 14% 20% 3% 28% 24% 1% 1%<br />
SI 1019 61% 42% 4% 34% 2% 29% 15% 2% 0%<br />
SK 1003 49% 35% 6% 35% 2% 39% 26% 1% 0%<br />
FI 1028 68% 54% 5% 26% 1% 26% 9% 3% 0%<br />
SE 1014 67% 41% 3% 54% 2% 13% 14% 2% 0%<br />
UK 1315 77% 70% 4% 21% 1% 10% 7% 1% 1%<br />
BG 1023 48% 38% 14% 21% 2% 43% 15% 2% 2%<br />
RO 1000 49% 40% 18% 22% 4% 36% 24% 1% 1%<br />
Sex<br />
Male 11904 60% 47% 9% 27% 3% 23% 17% 2% 0%<br />
Female 12828 65% 43% 9% 25% 2% 26% 18% 2% 1%<br />
Age<br />
15-24 3755 65% 43% 11% 27% 2% 23% 20% 1% 0%<br />
25-39 6468 59% 45% 9% 28% 3% 26% 19% 2% 0%<br />
40-54 6326 61% 42% 10% 29% 2% 24% 17% 2% 1%<br />
55 + 8183 64% 48% 9% 22% 3% 24% 15% 2% 1%<br />
Education (End of)<br />
15 6147 56% 47% 11% 24% 3% 27% 15% 2% 1%<br />
16-19 10175 61% 45% 9% 28% 3% 26% 17% 1% 0%<br />
20+ 5626 67% 44% 8% 27% 2% 21% 19% 3% 1%<br />
Still Studying 2341 73% 41% 10% 26% 1% 21% 19% 1% 0%<br />
Left-Right scale<br />
(1-4) Left 6648 64% 42% 8% 26% 3% 25% 20% 2% 0%<br />
(5-6) Centre 8373 66% 47% 8% 26% 2% 23% 16% 2% 0%<br />
(7-10) Right 4340 60% 47% 10% 27% 3% 25% 17% 1% 0%<br />
Respondent occupation scale<br />
Self- employed 1876 56% 53% 8% 25% 2% 22% 17% 2% 0%<br />
Managers 2241 72% 45% 6% 26% 2% 18% 22% 3% 0%<br />
Other white collars 2982 57% 44% 9% 30% 3% 26% 17% 2% 0%<br />
Manual workers 5201 59% 44% 10% 28% 3% 28% 18% 1% 0%<br />
House persons 2402 60% 42% 11% 24% 2% 28% 18% 1% 1%<br />
Unemployed 1584 58% 42% 11% 31% 3% 25% 17% 1% 1%<br />
Retired 6106 64% 47% 8% 23% 3% 23% 15% 2% 2%<br />
Students 2341 73% 41% 10% 26% 1% 21% 19% 1% 0%<br />
Subjective urbanisation<br />
Rural village 8005 61% 44% 9% 26% 2% 26% 19% 2% 1%<br />
Small/ mid size town 10627 62% 46% 10% 27% 2% 23% 16% 2% 1%<br />
Large town 6068 64% 45% 9% 25% 3% 24% 17% 2% 1%<br />
EU27 results are purely indicative as it is impossible to anticipate the impact of the accession of these countries on the results.
QA6.1 Could you indicate who in your household is mainly responsible for…?<br />
Cleaning the house\ appartment<br />
(IF 'MARRIED, REMARRIED OR LIVING WITH PARTNER', CODE 1 TO 3 IN D7)<br />
Together\ Both<br />
TOTAL You Your partner Someone else<br />
DK<br />
(SPONTANEOUS)<br />
EU25 14811 45% 35% 6% 14% -<br />
EU27 16039 45% 35% 6% 14% -<br />
BE 646 42% 36% 11% 11% -<br />
CZ 699 47% 40% 3% 10% -<br />
DK 589 40% 32% 5% 23% -<br />
D-W 691 51% 35% 5% 9% -<br />
DE 1029 50% 36% 4% 10% -<br />
D-E 331 47% 41% 2% 10% -<br />
EE 542 47% 31% 2% 20% -<br />
EL 568 47% 42% 4% 7% -<br />
ES 606 41% 28% 7% 24% -<br />
FR 588 44% 34% 4% 18% -<br />
IE 555 46% 23% 3% 25% 3%<br />
IT 603 47% 41% 7% 5% -<br />
CY 337 46% 37% 6% 11% -<br />
LV 549 44% 32% 5% 19% -<br />
LT 565 51% 40% 4% 4% 1%<br />
LU 324 44% 24% 16% 16% -<br />
HU 552 44% 41% 4% 11% -<br />
MT 296 48% 33% 5% 13% 1%<br />
NL 573 40% 31% 8% 21% -<br />
AT 613 39% 41% 7% 13% -<br />
PL 625 44% 36% 10% 10% -<br />
PT 595 44% 30% 10% 15% 1%<br />
SI 621 39% 31% 3% 27% -<br />
SK 615 49% 34% 4% 12% 1%<br />
FI 640 41% 32% 3% 24% -<br />
SE 667 40% 31% 3% 26% -<br />
UK 669 45% 31% 3% 21% -<br />
BG 685 45% 34% 6% 10% 5%<br />
RO 586 41% 39% 2% 17% 1%<br />
Sex<br />
Male 7419 9% 66% 7% 18% -<br />
Female 7392 81% 4% 4% 11% -<br />
Age<br />
15-24 755 46% 17% 21% 15% 1%<br />
25-39 4435 47% 31% 3% 19% -<br />
40-54 4646 46% 37% 4% 13% -<br />
55 + 4975 43% 39% 6% 12% -<br />
Education (End of)<br />
15 3721 48% 38% 4% 10% -<br />
16-19 6730 48% 35% 3% 14% -<br />
20+ 3831 39% 35% 8% 18% -<br />
Still Studying 278 32% 6% 43% 19% -<br />
Left-Right scale<br />
(1-4) Left 4060 44% 35% 6% 15% -<br />
(5-6) Centre 5100 46% 34% 5% 15% -<br />
(7-10) Right 2750 41% 40% 7% 12% -<br />
Respondent occupation scale<br />
Self- employed 1373 29% 48% 10% 13% -<br />
Managers 1667 34% 41% 7% 18% -<br />
Other white collars 2058 44% 35% 4% 17% -<br />
Manual workers 3338 39% 42% 2% 17% -<br />
House persons 1929 89% 4% 2% 5% -<br />
Unemployed 697 55% 27% 4% 14% -<br />
Retired 3470 39% 41% 7% 13% -<br />
Students 278 32% 6% 43% 19% -<br />
Subjective urbanisation<br />
Rural village 5268 44% 37% 6% 13% -<br />
Small/ mid size town 6202 45% 36% 5% 14% -<br />
Large town 3327 47% 30% 6% 17% -<br />
EU27 results are purely indicative as it is impossible to anticipate the impact of the accession of these countries on the results.
QA6.2 Could you indicate who in your household is mainly responsible for…?<br />
Cooking<br />
(IF 'MARRIED, REMARRIED OR LIVING WITH PARTNER', CODE 1 TO 3 IN D7)<br />
Together\ Both<br />
TOTAL You Your partner Someone else<br />
DK<br />
(SPONTANEOUS)<br />
EU25 14811 48% 36% 3% 13% -<br />
EU27 16039 48% 37% 3% 12% -<br />
BE 646 48% 38% 4% 10% -<br />
CZ 699 48% 44% 3% 5% -<br />
DK 589 44% 35% - 21% -<br />
D-W 691 54% 37% 2% 7% -<br />
DE 1029 54% 37% 1% 8% -<br />
D-E 331 52% 38% 1% 9% -<br />
EE 542 47% 33% 1% 19% -<br />
EL 568 49% 44% 2% 5% -<br />
ES 606 45% 31% 4% 20% -<br />
FR 588 48% 34% 1% 17% -<br />
IE 555 47% 28% 2% 20% 3%<br />
IT 603 48% 42% 5% 5% -<br />
CY 337 48% 38% 5% 9% -<br />
LV 549 44% 32% 4% 20% -<br />
LT 565 50% 42% 4% 4% -<br />
LU 324 52% 32% 3% 13% -<br />
HU 552 45% 42% 5% 8% -<br />
MT 296 50% 34% 3% 13% -<br />
NL 573 42% 33% 1% 24% -<br />
AT 613 43% 45% 2% 10% -<br />
PL 625 46% 37% 9% 7% 1%<br />
PT 595 46% 34% 5% 14% 1%<br />
SI 621 44% 37% 3% 16% -<br />
SK 615 49% 41% 3% 6% 1%<br />
FI 640 42% 37% 1% 20% -<br />
SE 667 43% 27% 1% 29% -<br />
UK 669 46% 33% 1% 20% -<br />
BG 685 45% 34% 9% 6% 6%<br />
RO 586 44% 45% 3% 7% 1%<br />
Sex<br />
Male 7419 13% 67% 4% 16% -<br />
Female 7392 82% 6% 3% 9% -<br />
Age<br />
15-24 755 46% 15% 21% 17% 1%<br />
25-39 4435 50% 32% 2% 16% -<br />
40-54 4646 47% 38% 2% 13% -<br />
55 + 4975 46% 43% 2% 9% -<br />
Education (End of)<br />
15 3721 50% 40% 2% 8% -<br />
16-19 6730 50% 35% 2% 13% -<br />
20+ 3831 42% 38% 3% 17% -<br />
Still Studying 278 40% 8% 35% 17% -<br />
Left-Right scale<br />
(1-4) Left 4060 46% 36% 3% 15% -<br />
(5-6) Centre 5100 48% 37% 3% 12% -<br />
(7-10) Right 2750 43% 42% 4% 11% -<br />
Respondent occupation scale<br />
Self- employed 1373 34% 48% 3% 15% -<br />
Managers 1667 38% 43% 2% 17% -<br />
Other white collars 2058 43% 38% 3% 16% -<br />
Manual workers 3338 39% 42% 3% 16% -<br />
House persons 1929 91% 5% 1% 3% -<br />
Unemployed 697 58% 26% 3% 13% -<br />
Retired 3470 43% 45% 2% 10% -<br />
Students 278 40% 8% 35% 17% -<br />
Subjective urbanisation<br />
Rural village 5268 46% 39% 3% 12% -<br />
Small/ mid size town 6202 48% 37% 3% 12% -<br />
Large town 3327 50% 31% 3% 16% -<br />
EU27 results are purely indicative as it is impossible to anticipate the impact of the accession of these countries on the results.
QA6.3 Could you indicate who in your household is mainly responsible for…?<br />
Doing the ironing<br />
(IF 'MARRIED, REMARRIED OR LIVING WITH PARTNER', CODE 1 TO 3 IN D7)<br />
Together\ Both<br />
TOTAL You Your partner Someone else<br />
DK<br />
(SPONTANEOUS)<br />
EU25 14811 47% 41% 6% 5% 1%<br />
EU27 16039 47% 41% 6% 5% 1%<br />
BE 646 46% 42% 8% 4% -<br />
CZ 699 48% 46% 4% 2% -<br />
DK 589 40% 43% 2% 12% 3%<br />
D-W 691 52% 40% 5% 2% 1%<br />
DE 1029 52% 40% 5% 2% 1%<br />
D-E 331 50% 41% 4% 3% 2%<br />
EE 542 48% 41% 3% 7% 1%<br />
EL 568 49% 46% 4% 1% -<br />
ES 606 49% 36% 6% 9% -<br />
FR 588 48% 40% 5% 6% 1%<br />
IE 555 46% 33% 5% 12% 4%<br />
IT 603 44% 45% 9% 2% -<br />
CY 337 47% 40% 8% 5% -<br />
LV 549 46% 39% 4% 9% 2%<br />
LT 565 50% 41% 5% 3% 1%<br />
LU 324 45% 36% 11% 8% -<br />
HU 552 46% 45% 5% 3% 1%<br />
MT 296 52% 39% 3% 5% 1%<br />
NL 573 43% 41% 5% 9% 2%<br />
AT 613 44% 48% 6% 2% -<br />
PL 625 46% 40% 8% 5% 1%<br />
PT 595 48% 36% 10% 5% 1%<br />
SI 621 48% 42% 3% 7% -<br />
SK 615 50% 45% 3% 1% 1%<br />
FI 640 44% 43% 2% 10% 1%<br />
SE 667 41% 39% 3% 12% 5%<br />
UK 669 41% 39% 4% 14% 2%<br />
BG 685 47% 38% 6% 3% 6%<br />
RO 586 46% 47% 2% 4% 1%<br />
Sex<br />
Male 7419 8% 78% 7% 6% 1%<br />
Female 7392 85% 4% 5% 5% 1%<br />
Age<br />
15-24 755 49% 19% 19% 8% 5%<br />
25-39 4435 48% 38% 5% 8% 1%<br />
40-54 4646 47% 42% 5% 6% -<br />
55 + 4975 46% 46% 5% 3% -<br />
Education (End of)<br />
15 3721 49% 44% 4% 3% -<br />
16-19 6730 50% 40% 4% 5% 1%<br />
20+ 3831 41% 41% 8% 9% 1%<br />
Still Studying 278 34% 15% 33% 13% 5%<br />
Left-Right scale<br />
(1-4) Left 4060 45% 42% 6% 6% 1%<br />
(5-6) Centre 5100 48% 41% 5% 5% 1%<br />
(7-10) Right 2750 42% 47% 7% 4% -<br />
Respondent occupation scale<br />
Self- employed 1373 28% 55% 11% 4% 2%<br />
Managers 1667 34% 47% 8% 10% 1%<br />
Other white collars 2058 47% 40% 5% 7% 1%<br />
Manual workers 3338 40% 49% 4% 6% 1%<br />
House persons 1929 91% 4% 2% 3% -<br />
Unemployed 697 56% 33% 6% 3% 2%<br />
Retired 3470 42% 50% 5% 3% -<br />
Students 278 34% 15% 33% 13% 5%<br />
Subjective urbanisation<br />
Rural village 5268 47% 42% 6% 4% 1%<br />
Small/ mid size town 6202 46% 43% 5% 5% 1%<br />
Large town 3327 48% 36% 6% 8% 2%<br />
EU27 results are purely indicative as it is impossible to anticipate the impact of the accession of these countries on the results.
QA7 Have you had any children? (IF YES) How many?<br />
TOTAL One Two Three Four Five Six Seven Eight Nine Ten or more None DK<br />
EU25 24732 18% 31% 13% 4% 1% 1% - - - - 32% -<br />
EU27 26755 18% 31% 13% 4% 1% 1% - - - - 32% -<br />
BE 1009 17% 29% 14% 5% 2% 1% 1% - - - 31% -<br />
CZ 1150 19% 40% 11% 3% 1% - - - - - 26% -<br />
DK 1037 15% 34% 14% 4% 2% - - - - - 31% -<br />
D-W 1000 18% 35% 12% 5% 2% - - - - - 28% -<br />
DE 1504 19% 35% 12% 4% 2% 1% - - - - 27% -<br />
D-E 504 22% 35% 15% 3% 1% - 1% - - - 23% -<br />
EE 1000 22% 31% 14% 4% 1% 1% - - - - 27% -<br />
EL 1000 14% 34% 10% 3% 1% - - - - - 38% -<br />
ES 1000 17% 28% 13% 4% 2% 1% - - - - 35% -<br />
FR 1012 15% 28% 16% 5% 2% 1% - - - - 33% -<br />
IE 1000 10% 18% 15% 10% 4% 3% - - - 1% 37% 2%<br />
IT 1038 21% 30% 9% 2% 1% - - - - - 37% -<br />
CY 504 10% 26% 24% 8% 2% 1% - - - - 28% 1%<br />
LV 1019 29% 28% 9% 2% 1% - - - - - 31% -<br />
LT 1025 23% 32% 9% 3% 1% 1% - - - - 31% -<br />
LU 502 19% 32% 16% 4% 1% 1% - - - - 27% -<br />
HU 1000 22% 36% 9% 2% 1% - - - - - 29% 1%<br />
MT 500 14% 28% 12% 5% 2% 1% 1% - - 1% 36% -<br />
NL 1020 12% 29% 15% 4% 2% 1% - - - - 37% -<br />
AT 1029 21% 30% 12% 3% 1% - - - - - 33% -<br />
PL 1000 19% 30% 14% 4% 2% - 1% - - - 30% -<br />
PT 1004 22% 29% 9% 4% 2% 1% - - - 1% 31% 1%<br />
SI 1019 19% 37% 11% 3% - - - - - - 30% -<br />
SK 1003 16% 37% 12% 3% 1% - - - - - 31% -<br />
FI 1028 18% 30% 17% 5% 1% 1% - - - - 28% -<br />
SE 1014 13% 33% 18% 6% 1% 1% - - - - 28% -<br />
UK 1315 16% 29% 15% 6% 2% 1% - - - - 31% -<br />
BG 1023 23% 45% 5% 1% 1% - - - - - 20% 5%<br />
RO 1000 27% 28% 7% 2% 1% - - - - - 34% 1%<br />
Sex<br />
Male 11904 17% 28% 12% 4% 1% 1% - - - - 37% -<br />
Female 12828 18% 33% 14% 5% 2% 1% - - - - 27% -<br />
Age<br />
15-24 3755 7% 3% - - - - - - - - 89% 1%<br />
25-39 6468 23% 26% 8% 2% 1% - - - - - 40% -<br />
40-54 6326 20% 41% 17% 4% 2% 1% - - - - 15% -<br />
55 + 8183 17% 40% 19% 8% 3% 1% - - - - 12% -<br />
Education (End of)<br />
15 6147 18% 35% 20% 7% 3% 1% 1% - - - 15% -<br />
16-19 10175 20% 36% 12% 4% 1% - - - - - 27% -<br />
20+ 5626 19% 31% 12% 3% 1% 1% - - - - 33% -<br />
Still Studying 2341 2% 1% 1% - - - - - - - 95% 1%<br />
Left-Right scale<br />
(1-4) Left 6648 19% 32% 11% 4% 1% 1% - - - - 32% -<br />
(5-6) Centre 8373 18% 31% 14% 4% 2% 1% - - - - 30% -<br />
(7-10) Right 4340 16% 32% 14% 5% 2% 1% - - - - 30% -<br />
Respondent occupation scale<br />
Self- employed 1876 22% 35% 14% 3% 1% - - - - - 25% -<br />
Managers 2241 19% 33% 12% 2% 1% - - - - - 33% -<br />
Other white collars 2982 23% 30% 8% 2% - - - - - - 37% -<br />
Manual workers 5201 18% 32% 11% 3% 1% 1% - - - - 34% -<br />
House persons 2402 19% 42% 20% 6% 3% 1% 1% - - - 8% -<br />
Unemployed 1584 19% 23% 12% 5% 2% - - - - - 39% -<br />
Retired 6106 18% 37% 19% 8% 3% 1% 1% - - - 13% -<br />
Students 2341 2% 1% 1% - - - - - - - 95% 1%<br />
Subjective urbanisation<br />
Rural village 8005 16% 34% 15% 5% 3% 1% - - - - 26% -<br />
Small/ mid size town 10627 18% 31% 13% 4% 1% 1% - - - - 32% -<br />
Large town 6068 20% 27% 10% 4% 1% 1% - - - - 37% -<br />
EU27 results are purely indicative as it is impossible to anticipate the impact of the accession of these countries on the results.
QA8a Which of the following statements most applies to how you feel?<br />
(IF 'HAVE CHILDREN', CODE 1 TO 10 IN QA7)<br />
DK<br />
You would have preferred not<br />
have had children<br />
You would have been happier<br />
with fewer children<br />
You would like\ have liked to<br />
have (had) more children<br />
You are happy with the<br />
number of children you have<br />
TOTAL<br />
EU25 16841 79% 18% 1% 1% 1%<br />
EU27 18215 79% 18% 1% 1% 1%<br />
BE 701 80% 16% 2% 1% 1%<br />
CZ 848 83% 14% 2% 1% -<br />
DK 720 76% 23% 1% - -<br />
D-W 723 81% 15% 2% 1% 1%<br />
DE 1102 82% 14% 2% 1% 1%<br />
D-E 389 83% 14% 2% 1% -<br />
EE 730 71% 27% 1% - 1%<br />
EL 623 61% 38% 1% - -<br />
ES 648 80% 16% 2% 1% 1%<br />
FR 681 75% 23% 1% 1% -<br />
IE 613 86% 11% 1% 1% 1%<br />
IT 657 76% 21% 1% 1% 1%<br />
CY 362 61% 39% - - -<br />
LV 698 70% 27% 1% - 2%<br />
LT 704 75% 21% 2% 1% 1%<br />
LU 365 81% 16% 1% 1% 1%<br />
HU 703 78% 19% 2% - 1%<br />
MT 317 81% 16% 1% 1% 1%<br />
NL 643 81% 17% 1% 1% -<br />
AT 688 82% 12% 3% 1% 2%<br />
PL 694 85% 11% 1% 1% 2%<br />
PT 685 75% 22% 2% - 1%<br />
SI 717 78% 21% 1% - -<br />
SK 691 88% 10% 1% - 1%<br />
FI 739 80% 18% 1% - 1%<br />
SE 730 81% 18% - - 1%<br />
UK 900 81% 17% 2% - -<br />
BG 774 82% 14% 2% 1% 1%<br />
RO 650 81% 17% 1% - 1%<br />
Sex<br />
Male 7453 80% 16% 2% 1% 1%<br />
Female 9387 79% 19% 1% - 1%<br />
Age<br />
15-24 370 59% 33% 4% 1% 3%<br />
25-39 3894 72% 25% 1% 1% 1%<br />
40-54 5363 81% 16% 1% 1% 1%<br />
55 + 7213 83% 14% 2% 1% -<br />
Education (End of)<br />
15 5223 82% 15% 2% 1% -<br />
16-19 7424 80% 17% 1% 1% 1%<br />
20+ 3757 75% 23% 1% - 1%<br />
Still Studying 99 63% 28% 4% - 5%<br />
Left-Right scale<br />
(1-4) Left 4486 79% 18% 2% - 1%<br />
(5-6) Centre 5867 81% 17% 1% - 1%<br />
(7-10) Right 3023 78% 19% 1% 1% 1%<br />
Respondent occupation scale<br />
Self- employed 1415 80% 18% 1% - 1%<br />
Managers 1502 76% 22% 1% - 1%<br />
Other white collars 1896 78% 20% 1% - 1%<br />
Manual workers 3440 79% 18% 1% 1% 1%<br />
House persons 2196 79% 19% 1% 1% -<br />
Unemployed 966 74% 19% 3% 2% 2%<br />
Retired 5327 82% 14% 2% 1% 1%<br />
Students 99 63% 28% 4% - 5%<br />
Subjective urbanisation<br />
Rural village 5874 81% 16% 1% 1% 1%<br />
Small/ mid size town 7160 79% 18% 1% 1% 1%<br />
Large town 3783 78% 19% 1% 1% 1%<br />
EU27 results are purely indicative as it is impossible to anticipate the impact of the accession of these countries on the results.
QA8b Would you like\ have liked to have children?<br />
(IF 'HAVE NO CHILDREN', CODE 11 IN QA7)<br />
TOTAL Yes, definitely Yes, probably No, probably not No, definitely not DK Yes No<br />
EU25 7841 48% 25% 8% 11% 8% 73% 19%<br />
EU27 8459 48% 25% 8% 11% 8% 73% 19%<br />
BE 308 50% 31% 8% 8% 3% 81% 16%<br />
CZ 298 68% 21% 7% 3% 1% 89% 10%<br />
DK 317 52% 21% 7% 13% 7% 73% 20%<br />
D-W 276 44% 24% 8% 15% 9% 68% 23%<br />
DE 401 46% 24% 8% 14% 8% 70% 22%<br />
D-E 115 56% 26% 6% 9% 3% 82% 15%<br />
EE 266 57% 23% 5% 3% 12% 80% 8%<br />
EL 377 31% 14% 23% 31% 1% 45% 54%<br />
ES 352 40% 29% 9% 10% 12% 69% 19%<br />
FR 329 64% 20% 5% 7% 4% 84% 12%<br />
IE 368 43% 27% 3% 7% 20% 70% 10%<br />
IT 378 41% 25% 8% 14% 12% 66% 22%<br />
CY 138 65% 22% 1% 5% 7% 87% 6%<br />
LV 316 59% 20% 8% 7% 6% 79% 15%<br />
LT 316 55% 16% 6% 12% 11% 71% 18%<br />
LU 137 36% 34% 9% 10% 11% 70% 19%<br />
HU 292 68% 16% 6% 6% 4% 84% 12%<br />
MT 181 36% 28% 8% 12% 16% 64% 20%<br />
NL 376 48% 19% 8% 17% 8% 67% 25%<br />
AT 341 33% 36% 11% 11% 9% 69% 22%<br />
PL 303 49% 27% 8% 6% 10% 76% 14%<br />
PT 311 62% 14% 6% 11% 7% 76% 17%<br />
SI 302 53% 31% 7% 4% 5% 84% 11%<br />
SK 312 74% 13% 2% 4% 7% 87% 6%<br />
FI 288 36% 37% 13% 8% 6% 73% 21%<br />
SE 284 42% 29% 11% 10% 8% 71% 21%<br />
UK 411 43% 30% 9% 11% 7% 73% 20%<br />
BG 201 61% 22% 1% 4% 12% 83% 5%<br />
RO 343 53% 20% 7% 7% 13% 73% 14%<br />
Sex<br />
Male 4427 44% 28% 8% 11% 9% 72% 19%<br />
Female 3414 52% 21% 8% 12% 7% 73% 20%<br />
Age<br />
15-24 3355 53% 25% 5% 8% 9% 78% 13%<br />
25-39 2564 52% 25% 8% 8% 7% 77% 16%<br />
40-54 955 28% 27% 16% 20% 9% 55% 36%<br />
55 + 966 35% 24% 11% 22% 8% 59% 33%<br />
Education (End of)<br />
15 920 44% 26% 8% 15% 7% 70% 23%<br />
16-19 2737 46% 24% 10% 12% 8% 70% 22%<br />
20+ 1865 49% 25% 10% 10% 6% 74% 20%<br />
Still Studying 2221 51% 24% 5% 9% 11% 75% 14%<br />
Left-Right scale<br />
(1-4) Left 2146 47% 28% 9% 10% 6% 75% 19%<br />
(5-6) Centre 2496 50% 26% 7% 10% 7% 76% 17%<br />
(7-10) Right 1311 44% 24% 9% 15% 8% 68% 24%<br />
Respondent occupation scale<br />
Self- employed 460 38% 30% 10% 13% 9% 68% 23%<br />
Managers 729 49% 24% 10% 12% 5% 73% 22%<br />
Other white collars 1084 49% 25% 10% 9% 7% 74% 19%<br />
Manual workers 1753 49% 26% 8% 10% 7% 75% 18%<br />
House persons 204 51% 20% 7% 15% 7% 71% 22%<br />
Unemployed 615 48% 24% 10% 11% 7% 72% 21%<br />
Retired 775 37% 24% 11% 20% 8% 61% 31%<br />
Students 2221 51% 24% 5% 9% 11% 75% 14%<br />
Subjective urbanisation<br />
Rural village 2115 48% 25% 7% 11% 9% 73% 18%<br />
Small/ mid size town 3457 48% 25% 7% 12% 8% 73% 19%<br />
Large town 2263 47% 24% 10% 12% 7% 71% 22%<br />
EU27 results are purely indicative as it is impossible to anticipate the impact of the accession of these countries on the results.
QA9.1 How much do you agree or disagree with the following statements describing positive and negative aspects of your job?<br />
My work is too demanding and stressful<br />
(IF 'CURRENTLY WORK', CODE 5 TO 18 IN D15a)<br />
Neither agree nor<br />
TOTAL Strongly agree Agree<br />
Disagree Strongly disagree DK Agree Disagree<br />
disagree<br />
EU25 12299 12% 29% 24% 25% 9% 1% 41% 34%<br />
EU27 13257 13% 29% 24% 25% 8% 1% 42% 33%<br />
BE 468 8% 24% 26% 33% 9% - 32% 42%<br />
CZ 635 7% 26% 35% 27% 4% 1% 33% 31%<br />
DK 578 10% 25% 27% 30% 7% 1% 35% 37%<br />
D-W 482 12% 27% 22% 21% 17% 1% 39% 38%<br />
DE 727 13% 26% 22% 21% 17% 1% 39% 38%<br />
D-E 246 18% 21% 22% 21% 18% - 39% 39%<br />
EE 544 10% 29% 25% 30% 6% - 39% 36%<br />
EL 450 35% 35% 16% 12% 2% - 70% 14%<br />
ES 506 8% 33% 31% 23% 4% 1% 41% 27%<br />
FR 532 12% 25% 18% 31% 14% - 37% 45%<br />
IE 515 8% 28% 21% 30% 11% 2% 36% 41%<br />
IT 529 16% 36% 31% 15% 2% - 52% 17%<br />
CY 257 28% 34% 14% 19% 5% - 62% 24%<br />
LV 565 16% 37% 21% 22% 4% - 53% 26%<br />
LT 491 26% 45% 17% 11% 1% - 71% 12%<br />
LU 238 22% 23% 11% 26% 17% 1% 45% 43%<br />
HU 435 15% 26% 26% 24% 8% 1% 41% 32%<br />
MT 216 37% 30% 17% 15% 1% - 67% 16%<br />
NL 574 4% 20% 20% 41% 15% - 24% 56%<br />
AT 573 15% 31% 34% 15% 5% - 46% 20%<br />
PL 425 13% 30% 22% 30% 4% 1% 43% 34%<br />
PT 501 18% 37% 20% 22% 2% 1% 55% 24%<br />
SI 462 9% 31% 27% 29% 4% - 40% 33%<br />
SK 595 12% 35% 29% 14% 2% 8% 47% 16%<br />
FI 565 4% 21% 25% 39% 11% - 25% 50%<br />
SE 581 14% 40% 16% 16% 14% - 54% 30%<br />
UK 628 11% 23% 22% 34% 9% 1% 34% 43%<br />
BG 443 39% 31% 17% 10% 2% 1% 70% 12%<br />
RO 482 15% 32% 25% 17% 1% 10% 47% 18%<br />
Sex<br />
Male 6938 13% 29% 24% 25% 8% 1% 42% 33%<br />
Female 5361 12% 28% 24% 25% 10% 1% 40% 35%<br />
Age<br />
15-24 1111 9% 25% 23% 28% 14% 1% 34% 42%<br />
25-39 4997 13% 28% 26% 26% 7% - 41% 33%<br />
40-54 4703 14% 30% 23% 24% 9% - 44% 33%<br />
55 + 1489 12% 29% 21% 25% 10% 3% 41% 35%<br />
Education (End of)<br />
15 1769 16% 30% 23% 23% 7% 1% 46% 30%<br />
16-19 6241 11% 28% 25% 26% 9% 1% 39% 35%<br />
20+ 4154 13% 30% 23% 25% 9% - 43% 34%<br />
Still Studying 0 - - - - - -<br />
Left-Right scale<br />
(1-4) Left 3521 11% 29% 26% 25% 9% - 40% 34%<br />
(5-6) Centre 4331 13% 28% 23% 26% 9% 1% 41% 35%<br />
(7-10) Right 2159 14% 29% 23% 25% 9% - 43% 34%<br />
Respondent occupation scale<br />
Self- employed 1876 16% 28% 24% 22% 9% 1% 44% 31%<br />
Managers 2241 13% 32% 24% 24% 7% - 45% 31%<br />
Other white collars 2982 10% 29% 27% 25% 9% - 39% 34%<br />
Manual workers 5201 13% 27% 23% 27% 9% 1% 40% 36%<br />
House persons 0 - - - - - -<br />
Unemployed 0 - - - - - -<br />
Retired 0 - - - - - -<br />
Students 0 - - - - - -<br />
Subjective urbanisation<br />
Rural village 4061 12% 28% 23% 27% 9% 1% 40% 36%<br />
Small/ mid size town 5253 12% 29% 26% 24% 8% 1% 41% 32%<br />
Large town 2967 14% 29% 23% 24% 9% 1% 43% 33%<br />
EU27 results are purely indicative as it is impossible to anticipate the impact of the accession of these countries on the results.
QA9.2 How much do you agree or disagree with the following statements describing positive and negative aspects of your job?<br />
I am well paid<br />
(IF 'CURRENTLY WORK', CODE 5 TO 18 IN D15a)<br />
Neither agree nor<br />
TOTAL Strongly agree Agree<br />
Disagree Strongly disagree DK Agree Disagree<br />
disagree<br />
EU25 12299 9% 34% 25% 22% 9% 1% 43% 31%<br />
EU27 13257 8% 33% 26% 23% 9% 1% 41% 32%<br />
BE 468 12% 48% 20% 15% 4% 1% 60% 19%<br />
CZ 635 5% 25% 31% 27% 11% 1% 30% 38%<br />
DK 578 9% 34% 20% 26% 10% 1% 43% 36%<br />
D-W 482 10% 45% 21% 17% 6% 1% 55% 23%<br />
DE 727 10% 42% 21% 18% 8% 1% 52% 26%<br />
D-E 246 9% 32% 22% 21% 15% 1% 41% 36%<br />
EE 544 9% 36% 20% 27% 7% 1% 45% 34%<br />
EL 450 12% 30% 30% 19% 9% - 42% 28%<br />
ES 506 7% 31% 31% 25% 5% 1% 38% 30%<br />
FR 532 5% 28% 18% 32% 16% 1% 33% 48%<br />
IE 515 9% 41% 21% 19% 7% 3% 50% 26%<br />
IT 529 10% 34% 37% 13% 5% 1% 44% 18%<br />
CY 257 16% 33% 33% 16% 2% - 49% 18%<br />
LV 565 6% 27% 26% 32% 8% 1% 33% 40%<br />
LT 491 4% 26% 29% 33% 7% 1% 30% 40%<br />
LU 238 28% 45% 14% 10% 3% - 73% 13%<br />
HU 435 5% 16% 34% 25% 20% - 21% 45%<br />
MT 216 9% 30% 31% 24% 5% 1% 39% 29%<br />
NL 574 14% 48% 19% 15% 4% - 62% 19%<br />
AT 573 11% 41% 32% 11% 4% 1% 52% 15%<br />
PL 425 5% 25% 22% 33% 13% 2% 30% 46%<br />
PT 501 4% 24% 32% 29% 9% 2% 28% 38%<br />
SI 462 4% 28% 34% 25% 9% - 32% 34%<br />
SK 595 3% 12% 35% 31% 10% 9% 15% 41%<br />
FI 565 5% 33% 24% 27% 11% - 38% 38%<br />
SE 581 14% 38% 18% 17% 13% - 52% 30%<br />
UK 628 11% 36% 21% 22% 8% 2% 47% 30%<br />
BG 443 12% 24% 29% 21% 13% 1% 36% 34%<br />
RO 482 6% 19% 31% 28% 6% 10% 25% 34%<br />
Sex<br />
Male 6938 9% 37% 26% 20% 7% 1% 46% 27%<br />
Female 5361 7% 30% 25% 26% 11% 1% 37% 37%<br />
Age<br />
15-24 1111 6% 34% 25% 25% 9% 1% 40% 34%<br />
25-39 4997 8% 35% 26% 22% 8% 1% 43% 30%<br />
40-54 4703 9% 33% 25% 23% 10% - 42% 33%<br />
55 + 1489 10% 32% 23% 22% 9% 4% 42% 31%<br />
Education (End of)<br />
15 1769 7% 29% 26% 26% 10% 2% 36% 36%<br />
16-19 6241 7% 34% 26% 23% 9% 1% 41% 32%<br />
20+ 4154 11% 36% 24% 21% 8% - 47% 29%<br />
Still Studying 0 - - - - - -<br />
Left-Right scale<br />
(1-4) Left 3521 9% 35% 25% 22% 9% - 44% 31%<br />
(5-6) Centre 4331 9% 35% 25% 22% 8% 1% 44% 30%<br />
(7-10) Right 2159 9% 35% 25% 21% 9% 1% 44% 30%<br />
Respondent occupation scale<br />
Self- employed 1876 14% 33% 26% 17% 7% 3% 47% 24%<br />
Managers 2241 12% 45% 21% 17% 4% 1% 57% 21%<br />
Other white collars 2982 7% 34% 30% 22% 7% - 41% 29%<br />
Manual workers 5201 6% 29% 24% 27% 13% 1% 35% 40%<br />
House persons 0 - - - - - -<br />
Unemployed 0 - - - - - -<br />
Retired 0 - - - - - -<br />
Students 0 - - - - - -<br />
Subjective urbanisation<br />
Rural village 4061 8% 34% 23% 25% 8% 2% 42% 33%<br />
Small/ mid size town 5253 8% 33% 27% 22% 9% 1% 41% 31%<br />
Large town 2967 10% 34% 25% 21% 9% 1% 44% 30%<br />
EU27 results are purely indicative as it is impossible to anticipate the impact of the accession of these countries on the results.
QA9.3 How much do you agree or disagree with the following statements describing positive and negative aspects of your job?<br />
My work is dull and boring<br />
(IF 'CURRENTLY WORK', CODE 5 TO 18 IN D15a)<br />
Neither agree nor<br />
TOTAL Strongly agree Agree<br />
Disagree Strongly disagree DK Agree Disagree<br />
disagree<br />
EU25 12299 4% 11% 16% 37% 31% 1% 15% 68%<br />
EU27 13257 4% 11% 17% 37% 30% 1% 15% 67%<br />
BE 468 1% 9% 9% 45% 36% - 10% 81%<br />
CZ 635 2% 9% 22% 42% 24% 1% 11% 66%<br />
DK 578 1% 5% 7% 51% 36% - 6% 87%<br />
D-W 482 2% 3% 9% 20% 65% 1% 5% 85%<br />
DE 727 2% 3% 10% 18% 66% 1% 5% 84%<br />
D-E 246 2% 3% 12% 12% 71% - 5% 83%<br />
EE 544 2% 13% 14% 45% 25% 1% 15% 70%<br />
EL 450 6% 15% 24% 33% 22% - 21% 55%<br />
ES 506 5% 15% 23% 48% 8% 1% 20% 56%<br />
FR 532 4% 10% 8% 39% 39% - 14% 78%<br />
IE 515 2% 12% 15% 45% 24% 2% 14% 69%<br />
IT 529 6% 19% 26% 37% 12% - 25% 49%<br />
CY 257 10% 11% 17% 49% 13% - 21% 62%<br />
LV 565 2% 6% 13% 56% 22% 1% 8% 78%<br />
LT 491 7% 16% 20% 47% 10% - 23% 57%<br />
LU 238 4% 5% 7% 37% 46% 1% 9% 83%<br />
HU 435 7% 12% 22% 38% 21% - 19% 59%<br />
MT 216 2% 9% 15% 55% 18% 1% 11% 73%<br />
NL 574 1% 3% 6% 37% 53% - 4% 90%<br />
AT 573 6% 11% 16% 34% 33% - 17% 67%<br />
PL 425 4% 16% 19% 48% 12% 1% 20% 60%<br />
PT 501 3% 15% 18% 46% 14% 4% 18% 60%<br />
SI 462 1% 10% 20% 46% 23% - 11% 69%<br />
SK 595 1% 7% 23% 47% 13% 9% 8% 60%<br />
FI 565 1% 6% 15% 51% 27% - 7% 78%<br />
SE 581 2% 10% 10% 22% 56% - 12% 78%<br />
UK 628 3% 10% 14% 42% 29% 2% 13% 71%<br />
BG 443 7% 20% 28% 24% 19% 2% 27% 43%<br />
RO 482 3% 9% 33% 37% 7% 11% 12% 44%<br />
Sex<br />
Male 6938 4% 10% 16% 38% 31% 1% 14% 69%<br />
Female 5361 4% 11% 16% 37% 31% 1% 15% 68%<br />
Age<br />
15-24 1111 5% 12% 19% 35% 28% 1% 17% 63%<br />
25-39 4997 4% 11% 17% 39% 29% - 15% 68%<br />
40-54 4703 4% 10% 14% 37% 34% 1% 14% 71%<br />
55 + 1489 3% 9% 14% 35% 36% 3% 12% 71%<br />
Education (End of)<br />
15 1769 7% 15% 20% 34% 23% 1% 22% 57%<br />
16-19 6241 4% 11% 17% 38% 29% 1% 15% 67%<br />
20+ 4154 2% 7% 12% 39% 39% 1% 9% 78%<br />
Still Studying 0 - - - - - -<br />
Left-Right scale<br />
(1-4) Left 3521 4% 11% 15% 37% 33% - 15% 70%<br />
(5-6) Centre 4331 3% 10% 15% 37% 34% 1% 13% 71%<br />
(7-10) Right 2159 4% 10% 14% 39% 33% - 14% 72%<br />
Respondent occupation scale<br />
Self- employed 1876 3% 8% 14% 37% 37% 1% 11% 74%<br />
Managers 2241 1% 5% 9% 37% 47% 1% 6% 84%<br />
Other white collars 2982 4% 12% 19% 41% 24% - 16% 65%<br />
Manual workers 5201 5% 13% 17% 36% 28% 1% 18% 64%<br />
House persons 0 - - - - - -<br />
Unemployed 0 - - - - - -<br />
Retired 0 - - - - - -<br />
Students 0 - - - - - -<br />
Subjective urbanisation<br />
Rural village 4061 3% 10% 15% 37% 34% 1% 13% 71%<br />
Small/ mid size town 5253 3% 11% 15% 39% 31% 1% 14% 70%<br />
Large town 2967 4% 11% 18% 36% 30% 1% 15% 66%<br />
EU27 results are purely indicative as it is impossible to anticipate the impact of the accession of these countries on the results.
QA9.4 How much do you agree or disagree with the following statements describing positive and negative aspects of your job?<br />
My job offers good prospects for career advancement<br />
(IF 'CURRENTLY WORK', CODE 5 TO 18 IN D15a)<br />
Neither agree nor<br />
TOTAL Strongly agree Agree<br />
Disagree Strongly disagree DK Agree Disagree<br />
disagree<br />
EU25 12299 12% 28% 22% 25% 12% 1% 40% 37%<br />
EU27 13257 12% 28% 22% 25% 11% 2% 40% 36%<br />
BE 468 11% 30% 19% 28% 11% 1% 41% 39%<br />
CZ 635 5% 17% 26% 35% 16% 1% 22% 51%<br />
DK 578 13% 29% 28% 23% 5% 2% 42% 28%<br />
D-W 482 18% 24% 17% 26% 14% 1% 42% 40%<br />
DE 727 17% 23% 18% 26% 15% 1% 40% 41%<br />
D-E 246 13% 22% 21% 24% 19% 1% 35% 43%<br />
EE 544 8% 21% 26% 31% 13% 1% 29% 44%<br />
EL 450 10% 21% 23% 32% 14% - 31% 46%<br />
ES 506 6% 35% 27% 25% 6% 1% 41% 31%<br />
FR 532 14% 25% 16% 25% 19% 1% 39% 44%<br />
IE 515 12% 31% 23% 21% 9% 4% 43% 30%<br />
IT 529 12% 35% 26% 18% 8% 1% 47% 26%<br />
CY 257 11% 21% 23% 30% 14% 1% 32% 44%<br />
LV 565 7% 27% 21% 31% 13% 1% 34% 44%<br />
LT 491 6% 25% 22% 37% 9% 1% 31% 46%<br />
LU 238 21% 24% 20% 20% 13% 2% 45% 33%<br />
HU 435 14% 32% 26% 19% 8% 1% 46% 27%<br />
MT 216 19% 25% 23% 23% 9% 1% 44% 32%<br />
NL 574 13% 34% 22% 18% 12% 1% 47% 30%<br />
AT 573 17% 40% 23% 14% 5% 1% 57% 19%<br />
PL 425 5% 21% 27% 32% 13% 2% 26% 45%<br />
PT 501 9% 28% 24% 27% 9% 3% 37% 36%<br />
SI 462 8% 30% 27% 27% 7% 1% 38% 34%<br />
SK 595 3% 14% 32% 33% 9% 9% 17% 42%<br />
FI 565 8% 29% 26% 29% 8% - 37% 37%<br />
SE 581 12% 24% 21% 20% 20% 3% 36% 40%<br />
UK 628 17% 31% 15% 25% 9% 3% 48% 34%<br />
BG 443 15% 20% 25% 21% 18% 1% 35% 39%<br />
RO 482 7% 19% 21% 35% 7% 11% 26% 42%<br />
Sex<br />
Male 6938 14% 31% 22% 23% 9% 1% 45% 32%<br />
Female 5361 10% 25% 21% 27% 15% 2% 35% 42%<br />
Age<br />
15-24 1111 17% 36% 17% 22% 6% 2% 53% 28%<br />
25-39 4997 14% 30% 23% 22% 10% 1% 44% 32%<br />
40-54 4703 10% 26% 22% 27% 14% 1% 36% 41%<br />
55 + 1489 9% 24% 20% 28% 15% 4% 33% 43%<br />
Education (End of)<br />
15 1769 7% 26% 22% 28% 16% 1% 33% 44%<br />
16-19 6241 11% 28% 21% 26% 12% 2% 39% 38%<br />
20+ 4154 16% 30% 22% 21% 10% 1% 46% 31%<br />
Still Studying 0 - - - - - -<br />
Left-Right scale<br />
(1-4) Left 3521 12% 30% 23% 24% 10% 1% 42% 34%<br />
(5-6) Centre 4331 14% 27% 21% 25% 11% 2% 41% 36%<br />
(7-10) Right 2159 12% 29% 21% 24% 12% 2% 41% 36%<br />
Respondent occupation scale<br />
Self- employed 1876 16% 25% 24% 21% 11% 3% 41% 32%<br />
Managers 2241 17% 35% 22% 18% 7% 1% 52% 25%<br />
Other white collars 2982 12% 32% 23% 24% 8% 1% 44% 32%<br />
Manual workers 5201 9% 25% 20% 30% 15% 1% 34% 45%<br />
House persons 0 - - - - - -<br />
Unemployed 0 - - - - - -<br />
Retired 0 - - - - - -<br />
Students 0 - - - - - -<br />
Subjective urbanisation<br />
Rural village 4061 11% 25% 23% 27% 13% 1% 36% 40%<br />
Small/ mid size town 5253 13% 29% 20% 25% 12% 1% 42% 37%<br />
Large town 2967 14% 31% 21% 22% 10% 2% 45% 32%<br />
EU27 results are purely indicative as it is impossible to anticipate the impact of the accession of these countries on the results.
QA9.5 How much do you agree or disagree with the following statements describing positive and negative aspects of your job?<br />
I work in dangerous or unhealthy conditions<br />
(IF 'CURRENTLY WORK', CODE 5 TO 18 IN D15a)<br />
Neither agree nor<br />
TOTAL Strongly agree Agree<br />
Disagree Strongly disagree DK Agree Disagree<br />
disagree<br />
EU25 12299 6% 15% 12% 32% 34% 1% 21% 66%<br />
EU27 13257 6% 15% 13% 32% 33% 1% 21% 65%<br />
BE 468 6% 12% 14% 34% 34% - 18% 68%<br />
CZ 635 5% 15% 16% 37% 27% - 20% 64%<br />
DK 578 2% 10% 13% 41% 34% - 12% 75%<br />
D-W 482 5% 10% 11% 18% 55% 1% 15% 73%<br />
DE 727 5% 11% 11% 18% 54% 1% 16% 72%<br />
D-E 246 7% 12% 11% 20% 50% - 19% 70%<br />
EE 544 6% 17% 15% 36% 25% 1% 23% 61%<br />
EL 450 20% 16% 14% 29% 21% - 36% 50%<br />
ES 506 2% 15% 11% 44% 27% 1% 17% 71%<br />
FR 532 7% 16% 8% 28% 40% 1% 23% 68%<br />
IE 515 3% 13% 12% 34% 35% 3% 16% 69%<br />
IT 529 5% 16% 17% 36% 26% - 21% 62%<br />
CY 257 14% 12% 9% 39% 26% - 26% 65%<br />
LV 565 9% 27% 18% 33% 12% 1% 36% 45%<br />
LT 491 7% 23% 21% 38% 11% - 30% 49%<br />
LU 238 13% 11% 10% 25% 41% - 24% 66%<br />
HU 435 9% 14% 15% 33% 28% 1% 23% 61%<br />
MT 216 7% 10% 13% 49% 21% - 17% 70%<br />
NL 574 2% 9% 9% 32% 48% - 11% 80%<br />
AT 573 8% 12% 17% 29% 34% - 20% 63%<br />
PL 425 8% 19% 17% 36% 19% 1% 27% 55%<br />
PT 501 4% 13% 14% 44% 23% 2% 17% 67%<br />
SI 462 7% 19% 15% 38% 21% - 26% 59%<br />
SK 595 3% 12% 23% 39% 15% 8% 15% 54%<br />
FI 565 5% 18% 13% 37% 27% - 23% 64%<br />
SE 581 6% 21% 10% 14% 48% 1% 27% 62%<br />
UK 628 6% 16% 6% 39% 31% 2% 22% 70%<br />
BG 443 6% 11% 24% 23% 33% 3% 17% 56%<br />
RO 482 6% 15% 22% 34% 13% 10% 21% 47%<br />
Sex<br />
Male 6938 7% 18% 13% 33% 28% 1% 25% 61%<br />
Female 5361 4% 11% 10% 32% 42% 1% 15% 74%<br />
Age<br />
15-24 1111 4% 16% 11% 36% 32% 1% 20% 68%<br />
25-39 4997 7% 16% 12% 33% 32% - 23% 65%<br />
40-54 4703 5% 15% 12% 32% 36% - 20% 68%<br />
55 + 1489 6% 11% 13% 29% 38% 3% 17% 67%<br />
Education (End of)<br />
15 1769 9% 18% 16% 30% 26% 1% 27% 56%<br />
16-19 6241 6% 16% 12% 35% 30% 1% 22% 65%<br />
20+ 4154 4% 12% 9% 30% 44% 1% 16% 74%<br />
Still Studying 0 - - - - - -<br />
Left-Right scale<br />
(1-4) Left 3521 5% 16% 12% 32% 35% - 21% 67%<br />
(5-6) Centre 4331 7% 14% 12% 32% 34% 1% 21% 66%<br />
(7-10) Right 2159 6% 14% 12% 32% 36% - 20% 68%<br />
Respondent occupation scale<br />
Self- employed 1876 7% 12% 13% 28% 39% 1% 19% 67%<br />
Managers 2241 3% 9% 9% 32% 47% - 12% 79%<br />
Other white collars 2982 3% 10% 9% 36% 42% - 13% 78%<br />
Manual workers 5201 8% 21% 15% 32% 23% 1% 29% 55%<br />
House persons 0 - - - - - -<br />
Unemployed 0 - - - - - -<br />
Retired 0 - - - - - -<br />
Students 0 - - - - - -<br />
Subjective urbanisation<br />
Rural village 4061 6% 15% 14% 30% 34% 1% 21% 64%<br />
Small/ mid size town 5253 5% 14% 11% 35% 34% 1% 19% 69%<br />
Large town 2967 6% 15% 11% 31% 36% 1% 21% 67%<br />
EU27 results are purely indicative as it is impossible to anticipate the impact of the accession of these countries on the results.
QA9.6 How much do you agree or disagree with the following statements describing positive and negative aspects of your job?<br />
My job requires me to keep learning new things<br />
(IF 'CURRENTLY WORK', CODE 5 TO 18 IN D15a)<br />
Neither agree nor<br />
TOTAL Strongly agree Agree<br />
Disagree Strongly disagree DK Agree Disagree<br />
disagree<br />
EU25 12299 30% 41% 14% 10% 4% 1% 71% 14%<br />
EU27 13257 29% 41% 14% 11% 4% 1% 70% 15%<br />
BE 468 29% 41% 11% 15% 4% - 70% 19%<br />
CZ 635 17% 41% 23% 14% 5% - 58% 19%<br />
DK 578 35% 49% 10% 5% 1% - 84% 6%<br />
D-W 482 38% 37% 11% 9% 4% 1% 75% 13%<br />
DE 727 40% 35% 10% 9% 5% 1% 75% 14%<br />
D-E 246 48% 29% 6% 11% 6% - 77% 17%<br />
EE 544 26% 43% 12% 16% 3% - 69% 19%<br />
EL 450 24% 34% 22% 17% 3% - 58% 20%<br />
ES 506 15% 47% 17% 15% 6% - 62% 21%<br />
FR 532 37% 43% 6% 9% 5% - 80% 14%<br />
IE 515 20% 47% 11% 11% 8% 3% 67% 19%<br />
IT 529 21% 44% 26% 7% 2% - 65% 9%<br />
CY 257 30% 39% 12% 14% 5% - 69% 19%<br />
LV 565 24% 52% 6% 14% 4% - 76% 18%<br />
LT 491 18% 44% 16% 18% 4% - 62% 22%<br />
LU 238 36% 36% 7% 12% 9% - 72% 21%<br />
HU 435 17% 24% 21% 24% 14% - 41% 38%<br />
MT 216 39% 41% 9% 9% 2% - 80% 11%<br />
NL 574 39% 42% 7% 8% 3% 1% 81% 11%<br />
AT 573 26% 45% 19% 7% 3% - 71% 10%<br />
PL 425 28% 42% 14% 11% 4% 1% 70% 15%<br />
PT 501 18% 45% 18% 14% 3% 2% 63% 17%<br />
SI 462 23% 46% 17% 12% 2% - 69% 14%<br />
SK 595 17% 47% 18% 8% 2% 8% 64% 10%<br />
FI 565 44% 44% 6% 5% 1% - 88% 6%<br />
SE 581 42% 38% 9% 8% 3% - 80% 11%<br />
UK 628 36% 42% 9% 8% 3% 2% 78% 11%<br />
BG 443 21% 21% 19% 21% 16% 2% 42% 37%<br />
RO 482 9% 43% 18% 16% 4% 10% 52% 20%<br />
Sex<br />
Male 6938 30% 43% 14% 9% 3% 1% 73% 12%<br />
Female 5361 28% 40% 13% 12% 6% 1% 68% 18%<br />
Age<br />
15-24 1111 31% 43% 12% 11% 2% 1% 74% 13%<br />
25-39 4997 29% 43% 14% 10% 4% - 72% 14%<br />
40-54 4703 30% 41% 14% 10% 5% - 71% 15%<br />
55 + 1489 29% 38% 14% 11% 5% 3% 67% 16%<br />
Education (End of)<br />
15 1769 17% 40% 19% 16% 7% 1% 57% 23%<br />
16-19 6241 25% 42% 15% 12% 5% 1% 67% 17%<br />
20+ 4154 42% 42% 9% 5% 2% - 84% 7%<br />
Still Studying 0 - - - - - -<br />
Left-Right scale<br />
(1-4) Left 3521 33% 41% 13% 10% 3% - 74% 13%<br />
(5-6) Centre 4331 31% 41% 13% 10% 4% 1% 72% 14%<br />
(7-10) Right 2159 30% 43% 14% 10% 3% - 73% 13%<br />
Respondent occupation scale<br />
Self- employed 1876 35% 40% 14% 7% 3% 1% 75% 10%<br />
Managers 2241 48% 42% 6% 3% 1% - 90% 4%<br />
Other white collars 2982 25% 46% 18% 8% 3% - 71% 11%<br />
Manual workers 5201 22% 39% 15% 16% 7% 1% 61% 23%<br />
House persons 0 - - - - - -<br />
Unemployed 0 - - - - - -<br />
Retired 0 - - - - - -<br />
Students 0 - - - - - -<br />
Subjective urbanisation<br />
Rural village 4061 29% 41% 15% 10% 4% 1% 70% 14%<br />
Small/ mid size town 5253 29% 41% 14% 11% 4% 1% 70% 15%<br />
Large town 2967 31% 42% 13% 9% 4% 1% 73% 13%<br />
EU27 results are purely indicative as it is impossible to anticipate the impact of the accession of these countries on the results.
QA9.7 How much do you agree or disagree with the following statements describing positive and negative aspects of your job?<br />
My job allows me to take part in making decisions that affect my work<br />
(IF 'CURRENTLY WORK', CODE 5 TO 18 IN D15a)<br />
Neither agree nor<br />
TOTAL Strongly agree Agree<br />
Disagree Strongly disagree DK Agree Disagree<br />
disagree<br />
EU25 12299 27% 38% 14% 14% 6% 1% 65% 20%<br />
EU27 13257 26% 37% 15% 14% 7% 1% 63% 21%<br />
BE 468 25% 43% 11% 14% 7% - 68% 21%<br />
CZ 635 17% 30% 20% 19% 13% 1% 47% 32%<br />
DK 578 39% 45% 9% 5% 2% - 84% 7%<br />
D-W 482 41% 32% 11% 10% 5% 1% 73% 15%<br />
DE 727 40% 31% 11% 10% 7% 1% 71% 17%<br />
D-E 246 38% 28% 9% 12% 12% 1% 66% 24%<br />
EE 544 22% 39% 15% 17% 5% 2% 61% 22%<br />
EL 450 28% 28% 19% 18% 7% - 56% 25%<br />
ES 506 19% 37% 20% 17% 7% - 56% 24%<br />
FR 532 28% 38% 8% 15% 11% - 66% 26%<br />
IE 515 23% 41% 15% 12% 6% 3% 64% 18%<br />
IT 529 18% 38% 23% 18% 3% - 56% 21%<br />
CY 257 23% 32% 14% 23% 8% - 55% 31%<br />
LV 565 19% 49% 11% 16% 4% 1% 68% 20%<br />
LT 491 13% 39% 18% 22% 7% 1% 52% 29%<br />
LU 238 45% 29% 5% 13% 7% 1% 74% 20%<br />
HU 435 20% 25% 19% 18% 17% 1% 45% 35%<br />
MT 216 26% 39% 14% 15% 4% 2% 65% 19%<br />
NL 574 35% 39% 10% 11% 5% - 74% 16%<br />
AT 573 26% 43% 17% 10% 4% - 69% 14%<br />
PL 425 21% 34% 18% 18% 6% 3% 55% 24%<br />
PT 501 15% 39% 17% 19% 8% 2% 54% 27%<br />
SI 462 15% 42% 20% 18% 5% - 57% 23%<br />
SK 595 8% 28% 25% 22% 9% 8% 36% 31%<br />
FI 565 26% 45% 16% 11% 2% - 71% 13%<br />
SE 581 39% 41% 8% 8% 4% - 80% 12%<br />
UK 628 30% 50% 8% 7% 3% 2% 80% 10%<br />
BG 443 22% 20% 14% 22% 20% 2% 42% 42%<br />
RO 482 7% 26% 24% 23% 8% 12% 33% 31%<br />
Sex<br />
Male 6938 30% 38% 14% 12% 5% 1% 68% 17%<br />
Female 5361 23% 37% 15% 16% 8% 1% 60% 24%<br />
Age<br />
15-24 1111 17% 39% 16% 18% 9% 1% 56% 27%<br />
25-39 4997 26% 38% 16% 14% 6% - 64% 20%<br />
40-54 4703 29% 38% 12% 14% 7% - 67% 21%<br />
55 + 1489 33% 34% 13% 12% 5% 3% 67% 17%<br />
Education (End of)<br />
15 1769 23% 35% 14% 19% 8% 1% 58% 27%<br />
16-19 6241 24% 37% 16% 15% 7% 1% 61% 22%<br />
20+ 4154 34% 40% 13% 9% 4% - 74% 13%<br />
Still Studying 0 - - - - - -<br />
Left-Right scale<br />
(1-4) Left 3521 28% 39% 13% 14% 6% - 67% 20%<br />
(5-6) Centre 4331 29% 37% 13% 14% 6% 1% 66% 20%<br />
(7-10) Right 2159 29% 38% 14% 12% 6% 1% 67% 18%<br />
Respondent occupation scale<br />
Self- employed 1876 58% 29% 7% 3% 1% 2% 87% 4%<br />
Managers 2241 38% 43% 9% 7% 3% - 81% 10%<br />
Other white collars 2982 17% 41% 20% 16% 6% - 58% 22%<br />
Manual workers 5201 17% 36% 16% 20% 10% 1% 53% 30%<br />
House persons 0 - - - - - -<br />
Unemployed 0 - - - - - -<br />
Retired 0 - - - - - -<br />
Students 0 - - - - - -<br />
Subjective urbanisation<br />
Rural village 4061 27% 37% 14% 14% 7% 1% 64% 21%<br />
Small/ mid size town 5253 25% 39% 14% 15% 6% 1% 64% 21%<br />
Large town 2967 29% 37% 15% 12% 6% 1% 66% 18%<br />
EU27 results are purely indicative as it is impossible to anticipate the impact of the accession of these countries on the results.
QA9.8 How much do you agree or disagree with the following statements describing positive and negative aspects of your job?<br />
My job allows me to balance my professional, family and private life<br />
(IF 'CURRENTLY WORK', CODE 5 TO 18 IN D15a)<br />
Neither agree nor<br />
TOTAL Strongly agree Agree<br />
Disagree Strongly disagree DK Agree Disagree<br />
disagree<br />
EU25 12299 23% 46% 16% 11% 3% 1% 69% 14%<br />
EU27 13257 22% 45% 16% 11% 4% 2% 67% 15%<br />
BE 468 31% 47% 12% 8% 2% - 78% 10%<br />
CZ 635 9% 53% 24% 10% 3% 1% 62% 13%<br />
DK 578 21% 48% 16% 12% 3% - 69% 15%<br />
D-W 482 36% 35% 12% 13% 3% 1% 71% 16%<br />
DE 727 33% 36% 13% 13% 4% 1% 69% 17%<br />
D-E 246 24% 38% 15% 16% 7% - 62% 23%<br />
EE 544 13% 40% 19% 20% 6% 2% 53% 26%<br />
EL 450 19% 38% 19% 19% 5% - 57% 24%<br />
ES 506 20% 51% 18% 9% 1% 1% 71% 10%<br />
FR 532 29% 43% 11% 10% 6% 1% 72% 16%<br />
IE 515 15% 46% 22% 11% 2% 4% 61% 13%<br />
IT 529 16% 50% 23% 8% 3% - 66% 11%<br />
CY 257 17% 50% 16% 11% 6% - 67% 17%<br />
LV 565 15% 52% 16% 14% 3% - 67% 17%<br />
LT 491 18% 52% 16% 10% 3% 1% 70% 13%<br />
LU 238 45% 35% 10% 6% 3% 1% 80% 9%<br />
HU 435 18% 42% 21% 13% 6% - 60% 19%<br />
MT 216 17% 42% 22% 18% 1% - 59% 19%<br />
NL 574 27% 44% 16% 9% 3% 1% 71% 12%<br />
AT 573 17% 48% 19% 9% 7% - 65% 16%<br />
PL 425 21% 48% 16% 12% 2% 1% 69% 14%<br />
PT 501 17% 52% 20% 8% 1% 2% 69% 9%<br />
SI 462 11% 51% 22% 13% 3% - 62% 16%<br />
SK 595 6% 42% 31% 11% 2% 8% 48% 13%<br />
FI 565 18% 47% 17% 14% 3% 1% 65% 17%<br />
SE 581 34% 39% 10% 8% 9% - 73% 17%<br />
UK 628 18% 52% 9% 15% 3% 3% 70% 18%<br />
BG 443 19% 39% 23% 12% 5% 2% 58% 17%<br />
RO 482 9% 38% 28% 12% 3% 10% 47% 15%<br />
Sex<br />
Male 6938 21% 46% 16% 12% 4% 1% 67% 16%<br />
Female 5361 25% 46% 14% 11% 3% 1% 71% 14%<br />
Age<br />
15-24 1111 19% 46% 17% 11% 5% 2% 65% 16%<br />
25-39 4997 21% 45% 17% 13% 4% - 66% 17%<br />
40-54 4703 24% 46% 15% 11% 3% 1% 70% 14%<br />
55 + 1489 29% 45% 12% 8% 3% 3% 74% 11%<br />
Education (End of)<br />
15 1769 21% 46% 16% 12% 4% 1% 67% 16%<br />
16-19 6241 22% 45% 17% 11% 4% 1% 67% 15%<br />
20+ 4154 25% 46% 14% 11% 3% 1% 71% 14%<br />
Still Studying 0 - - - - - -<br />
Left-Right scale<br />
(1-4) Left 3521 23% 47% 14% 12% 3% 1% 70% 15%<br />
(5-6) Centre 4331 24% 45% 15% 11% 4% 1% 69% 15%<br />
(7-10) Right 2159 24% 43% 17% 13% 3% - 67% 16%<br />
Respondent occupation scale<br />
Self- employed 1876 32% 42% 14% 8% 3% 1% 74% 11%<br />
Managers 2241 23% 47% 15% 12% 2% 1% 70% 14%<br />
Other white collars 2982 20% 49% 17% 11% 3% - 69% 14%<br />
Manual workers 5201 21% 44% 16% 13% 5% 1% 65% 18%<br />
House persons 0 - - - - - -<br />
Unemployed 0 - - - - - -<br />
Retired 0 - - - - - -<br />
Students 0 - - - - - -<br />
Subjective urbanisation<br />
Rural village 4061 23% 45% 16% 12% 3% 1% 68% 15%<br />
Small/ mid size town 5253 21% 48% 15% 11% 4% 1% 69% 15%<br />
Large town 2967 24% 44% 17% 11% 3% 1% 68% 14%<br />
EU27 results are purely indicative as it is impossible to anticipate the impact of the accession of these countries on the results.
QA9.9 How much do you agree or disagree with the following statements describing positive and negative aspects of your job?<br />
My job allows me to make use of my knowledge and skills<br />
(IF 'CURRENTLY WORK', CODE 5 TO 18 IN D15a)<br />
Neither agree nor<br />
TOTAL Strongly agree Agree<br />
Disagree Strongly disagree DK Agree Disagree<br />
disagree<br />
EU25 12299 32% 45% 11% 8% 3% 1% 77% 11%<br />
EU27 13257 32% 45% 11% 8% 3% 1% 77% 11%<br />
BE 468 37% 43% 9% 9% 2% - 80% 11%<br />
CZ 635 22% 51% 14% 9% 3% 1% 73% 12%<br />
DK 578 41% 48% 7% 3% 1% - 89% 4%<br />
D-W 482 48% 35% 6% 6% 4% 1% 83% 10%<br />
DE 727 49% 34% 6% 6% 4% 1% 83% 10%<br />
D-E 246 52% 31% 7% 6% 4% - 83% 10%<br />
EE 544 35% 45% 8% 9% 2% 1% 80% 11%<br />
EL 450 33% 44% 11% 8% 4% - 77% 12%<br />
ES 506 18% 54% 14% 9% 4% 1% 72% 13%<br />
FR 532 36% 44% 6% 8% 5% 1% 80% 13%<br />
IE 515 26% 54% 8% 5% 3% 4% 80% 8%<br />
IT 529 21% 48% 19% 10% 2% - 69% 12%<br />
CY 257 35% 49% 9% 6% 1% - 84% 7%<br />
LV 565 23% 58% 9% 8% 1% 1% 81% 9%<br />
LT 491 22% 53% 13% 10% 2% - 75% 12%<br />
LU 238 52% 36% 5% 4% 3% - 88% 7%<br />
HU 435 28% 41% 19% 7% 5% - 69% 12%<br />
MT 216 36% 56% 4% 4% - - 92% 4%<br />
NL 574 36% 46% 10% 5% 3% - 82% 8%<br />
AT 573 30% 50% 13% 5% 2% - 80% 7%<br />
PL 425 23% 47% 15% 10% 3% 2% 70% 13%<br />
PT 501 22% 51% 14% 9% 3% 1% 73% 12%<br />
SI 462 26% 51% 16% 5% 2% - 77% 7%<br />
SK 595 13% 56% 17% 5% 1% 8% 69% 6%<br />
FI 565 38% 47% 8% 6% 1% - 85% 7%<br />
SE 581 61% 31% 4% 3% 1% - 92% 4%<br />
UK 628 35% 47% 5% 9% 2% 2% 82% 11%<br />
BG 443 34% 36% 15% 9% 5% 1% 70% 14%<br />
RO 482 15% 47% 18% 8% 2% 10% 62% 10%<br />
Sex<br />
Male 6938 34% 46% 10% 7% 2% 1% 80% 9%<br />
Female 5361 30% 44% 12% 9% 4% 1% 74% 13%<br />
Age<br />
15-24 1111 30% 45% 10% 10% 4% 1% 75% 14%<br />
25-39 4997 31% 45% 12% 9% 3% - 76% 12%<br />
40-54 4703 34% 46% 10% 6% 3% 1% 80% 9%<br />
55 + 1489 36% 44% 9% 6% 2% 3% 80% 8%<br />
Education (End of)<br />
15 1769 26% 45% 14% 10% 4% 1% 71% 14%<br />
16-19 6241 29% 47% 11% 9% 3% 1% 76% 12%<br />
20+ 4154 41% 43% 8% 5% 3% - 84% 8%<br />
Still Studying 0 - - - - - -<br />
Left-Right scale<br />
(1-4) Left 3521 35% 45% 9% 8% 3% - 80% 11%<br />
(5-6) Centre 4331 34% 45% 9% 7% 3% 2% 79% 10%<br />
(7-10) Right 2159 33% 46% 12% 7% 2% - 79% 9%<br />
Respondent occupation scale<br />
Self- employed 1876 48% 38% 8% 4% 1% 1% 86% 5%<br />
Managers 2241 47% 43% 5% 4% 1% - 90% 5%<br />
Other white collars 2982 25% 53% 13% 7% 2% - 78% 9%<br />
Manual workers 5201 25% 44% 13% 11% 5% 2% 69% 16%<br />
House persons 0 - - - - - -<br />
Unemployed 0 - - - - - -<br />
Retired 0 - - - - - -<br />
Students 0 - - - - - -<br />
Subjective urbanisation<br />
Rural village 4061 32% 45% 12% 7% 3% 1% 77% 10%<br />
Small/ mid size town 5253 31% 47% 10% 8% 3% 1% 78% 11%<br />
Large town 2967 36% 43% 10% 7% 3% 1% 79% 10%<br />
EU27 results are purely indicative as it is impossible to anticipate the impact of the accession of these countries on the results.
QA9.10 How much do you agree or disagree with the following statements describing positive and negative aspects of your job?<br />
I work with people I like<br />
(IF 'CURRENTLY WORK', CODE 5 TO 18 IN D15a)<br />
Neither agree nor<br />
TOTAL Strongly agree Agree<br />
Disagree Strongly disagree DK Agree Disagree<br />
disagree<br />
EU25 12299 30% 50% 14% 4% 1% 1% 80% 5%<br />
EU27 13257 29% 50% 15% 3% 1% 2% 79% 4%<br />
BE 468 31% 53% 12% 2% 1% 1% 84% 3%<br />
CZ 635 15% 50% 30% 4% 1% - 65% 5%<br />
DK 578 43% 45% 9% 2% - 1% 88% 2%<br />
D-W 482 36% 48% 12% 3% 1% - 84% 4%<br />
DE 727 37% 47% 13% 2% 1% - 84% 3%<br />
D-E 246 39% 41% 16% 3% 1% - 80% 4%<br />
EE 544 30% 50% 13% 5% 1% 1% 80% 6%<br />
EL 450 33% 44% 16% 4% 2% 1% 77% 6%<br />
ES 506 25% 56% 13% 3% 1% 2% 81% 4%<br />
FR 532 31% 45% 13% 6% 3% 2% 76% 9%<br />
IE 515 27% 59% 8% 2% - 4% 86% 2%<br />
IT 529 18% 57% 21% 3% 1% - 75% 4%<br />
CY 257 28% 45% 22% 5% - - 73% 5%<br />
LV 565 23% 53% 16% 6% 1% 1% 76% 7%<br />
LT 491 18% 47% 25% 7% 1% 2% 65% 8%<br />
LU 238 46% 37% 11% 3% 2% 1% 83% 5%<br />
HU 435 27% 48% 19% 3% 2% 1% 75% 5%<br />
MT 216 34% 47% 13% 3% 2% 1% 81% 5%<br />
NL 574 35% 51% 11% 2% - 1% 86% 2%<br />
AT 573 26% 51% 21% 1% 1% - 77% 2%<br />
PL 425 22% 52% 17% 5% 1% 3% 74% 6%<br />
PT 501 24% 52% 17% 3% 1% 3% 76% 4%<br />
SI 462 15% 59% 18% 7% 1% - 74% 8%<br />
SK 595 12% 49% 27% 4% - 8% 61% 4%<br />
FI 565 34% 55% 10% 1% - - 89% 1%<br />
SE 581 60% 31% 5% 2% 1% 1% 91% 3%<br />
UK 628 36% 51% 7% 3% 1% 2% 87% 4%<br />
BG 443 28% 42% 20% 5% 3% 2% 70% 8%<br />
RO 482 13% 44% 25% 7% 1% 10% 57% 8%<br />
Sex<br />
Male 6938 27% 52% 15% 4% 1% 1% 79% 5%<br />
Female 5361 33% 48% 14% 3% 1% 1% 81% 4%<br />
Age<br />
15-24 1111 35% 47% 12% 3% 1% 2% 82% 4%<br />
25-39 4997 29% 52% 14% 3% 1% 1% 81% 4%<br />
40-54 4703 28% 51% 15% 3% 2% 1% 79% 5%<br />
55 + 1489 32% 43% 17% 4% 1% 3% 75% 5%<br />
Education (End of)<br />
15 1769 27% 48% 18% 3% 2% 2% 75% 5%<br />
16-19 6241 28% 51% 15% 4% 1% 1% 79% 5%<br />
20+ 4154 33% 50% 12% 3% 1% 1% 83% 4%<br />
Still Studying 0 - - - - - -<br />
Left-Right scale<br />
(1-4) Left 3521 30% 50% 14% 4% 1% 1% 80% 5%<br />
(5-6) Centre 4331 31% 50% 13% 3% 1% 2% 81% 4%<br />
(7-10) Right 2159 27% 51% 17% 2% 2% 1% 78% 4%<br />
Respondent occupation scale<br />
Self- employed 1876 33% 45% 16% 2% 2% 2% 78% 4%<br />
Managers 2241 35% 50% 12% 2% 1% - 85% 3%<br />
Other white collars 2982 26% 54% 14% 4% 1% 1% 80% 5%<br />
Manual workers 5201 28% 50% 15% 4% 2% 1% 78% 6%<br />
House persons 0 - - - - - -<br />
Unemployed 0 - - - - - -<br />
Retired 0 - - - - - -<br />
Students 0 - - - - - -<br />
Subjective urbanisation<br />
Rural village 4061 31% 50% 13% 3% 1% 2% 81% 4%<br />
Small/ mid size town 5253 28% 52% 15% 3% 1% 1% 80% 4%<br />
Large town 2967 31% 48% 15% 3% 2% 1% 79% 5%<br />
EU27 results are purely indicative as it is impossible to anticipate the impact of the accession of these countries on the results.
QA10a How confident would you say you are in your ability to keep your job in the coming months? Are you…?<br />
(IF 'CURRENTLY WORK', CODE 5 TO 18 IN D15a)<br />
TOTAL Very confident Fairly confident Not very confident Not at all confident DK Confident Not confident<br />
EU25 12299 47% 38% 9% 4% 2% 85% 13%<br />
EU27 13257 47% 39% 8% 3% 3% 86% 11%<br />
BE 468 61% 30% 5% 3% 1% 91% 8%<br />
CZ 635 37% 53% 6% 1% 3% 90% 7%<br />
DK 578 76% 18% 3% 2% 1% 94% 5%<br />
D-W 482 56% 32% 7% 3% 2% 88% 10%<br />
DE 727 54% 32% 8% 4% 2% 86% 12%<br />
D-E 246 46% 32% 12% 7% 3% 78% 19%<br />
EE 544 43% 42% 10% 4% 1% 85% 14%<br />
EL 450 56% 32% 6% 6% - 88% 12%<br />
ES 506 40% 49% 7% 1% 3% 89% 8%<br />
FR 532 44% 38% 8% 8% 2% 82% 16%<br />
IE 515 59% 33% 3% - 5% 92% 3%<br />
IT 529 38% 51% 9% 1% 1% 89% 10%<br />
CY 257 76% 14% 6% 2% 2% 90% 8%<br />
LV 565 59% 26% 11% 4% - 85% 15%<br />
LT 491 30% 46% 17% 6% 1% 76% 23%<br />
LU 238 67% 25% 5% 2% 1% 92% 7%<br />
HU 435 27% 47% 15% 8% 3% 74% 23%<br />
MT 216 55% 34% 8% 1% 2% 89% 9%<br />
NL 574 71% 18% 6% 4% 1% 89% 10%<br />
AT 573 33% 55% 9% 1% 2% 88% 10%<br />
PL 425 34% 43% 13% 5% 5% 77% 18%<br />
PT 501 33% 51% 10% 3% 3% 84% 13%<br />
SI 462 47% 43% 8% 1% 1% 90% 9%<br />
SK 595 17% 46% 24% 4% 9% 63% 28%<br />
FI 565 53% 34% 7% 4% 2% 87% 11%<br />
SE 581 76% 16% 4% 3% 1% 92% 7%<br />
UK 628 58% 30% 7% 2% 3% 88% 9%<br />
BG 443 37% 38% 11% 6% 8% 75% 17%<br />
RO 482 33% 45% 8% 2% 12% 78% 10%<br />
Sex<br />
Male 6938 48% 39% 8% 3% 2% 87% 11%<br />
Female 5361 46% 38% 9% 4% 3% 84% 13%<br />
Age<br />
15-24 1111 43% 39% 12% 3% 3% 82% 15%<br />
25-39 4997 45% 42% 8% 3% 2% 87% 11%<br />
40-54 4703 49% 37% 8% 4% 2% 86% 12%<br />
55 + 1489 52% 31% 9% 2% 6% 83% 11%<br />
Education (End of)<br />
15 1769 41% 41% 11% 4% 3% 82% 15%<br />
16-19 6241 44% 41% 10% 3% 2% 85% 13%<br />
20+ 4154 55% 34% 6% 3% 2% 89% 9%<br />
Still Studying 0 - - - - -<br />
Left-Right scale<br />
(1-4) Left 3521 49% 38% 8% 4% 1% 87% 12%<br />
(5-6) Centre 4331 47% 38% 9% 3% 3% 85% 12%<br />
(7-10) Right 2159 50% 36% 9% 3% 2% 86% 12%<br />
Respondent occupation scale<br />
Self- employed 1876 58% 32% 5% 2% 3% 90% 7%<br />
Managers 2241 58% 34% 5% 2% 1% 92% 7%<br />
Other white collars 2982 40% 46% 8% 4% 2% 86% 12%<br />
Manual workers 5201 43% 39% 11% 4% 3% 82% 15%<br />
House persons 0 - - - - -<br />
Unemployed 0 - - - - -<br />
Retired 0 - - - - -<br />
Students 0 - - - - -<br />
Subjective urbanisation<br />
Rural village 4061 49% 36% 8% 4% 3% 85% 12%<br />
Small/ mid size town 5253 45% 40% 9% 4% 2% 85% 13%<br />
Large town 2967 48% 38% 8% 3% 3% 86% 11%<br />
EU27 results are purely indicative as it is impossible to anticipate the impact of the accession of these countries on the results.
QA10b Why are you not confident about your ability to keep your job in the coming months?<br />
(IF 'NOT CONFIDENT', CODE 3 OR 4 IN QA10a)<br />
Your company\ this Your company\ this Your company is<br />
The work you do will<br />
None<br />
Other reason<br />
TOTAL location is relocating location is closing merging with<br />
DK<br />
be automated (SPONTANEOUS) (SPONTANEOUS)<br />
abroad<br />
down<br />
another company<br />
EU25 1469 3% 12% 11% 8% 23% 37% 6%<br />
EU27 1579 3% 12% 10% 7% 25% 36% 7%<br />
BE 35 9% 11% 8% 3% 10% 55% 4%<br />
CZ 46 3% 11% 11% 9% 9% 44% 13%<br />
DK 30 5% 20% 18% - 7% 50% -<br />
D-W 48 - 11% 13% 19% 26% 27% 4%<br />
DE 84 1% 10% 12% 14% 32% 27% 4%<br />
D-E 46 2% 10% 10% 3% 43% 27% 5%<br />
EE 78 1% 18% 10% 5% 18% 44% 4%<br />
EL 53 5% 7% 7% 8% 6% 65% 2%<br />
ES 41 - 2% 9% 10% 29% 41% 9%<br />
FR 87 7% 11% 7% 7% 14% 46% 8%<br />
IE 18 - - - 4% 30% 43% 23%<br />
IT 53 3% 14% 22% 3% 38% 18% 2%<br />
CY 20 6% 16% 6% 10% 16% 42% 4%<br />
LV 82 3% 18% 8% 7% 24% 32% 8%<br />
LT 112 - 13% 3% 2% 42% 28% 12%<br />
LU 16 14% - 8% - 15% 63% -<br />
HU 103 5% 21% 6% 7% 28% 26% 7%<br />
MT 20 8% 16% 12% - 23% 34% 7%<br />
NL 59 3% 11% 11% 4% 24% 47% -<br />
AT 61 2% 34% 23% 11% 10% 15% 5%<br />
PL 80 3% 9% 11% 8% 23% 34% 12%<br />
PT 65 5% 17% 3% 2% 19% 37% 17%<br />
SI 43 - 6% 22% 3% 31% 29% 9%<br />
SK 170 - 10% 15% 11% 16% 38% 10%<br />
FI 66 2% 20% 14% 5% 37% 21% 1%<br />
SE 40 - 27% 4% - 51% 18% -<br />
UK 60 3% 17% 5% 5% 9% 61% -<br />
BG 74 - 6% 2% 6% 48% 26% 12%<br />
RO 47 3% 17% 7% 2% 42% 13% 16%<br />
Sex<br />
Male 734 5% 11% 12% 7% 21% 37% 7%<br />
Female 735 2% 13% 9% 7% 26% 37% 6%<br />
Age<br />
15-24 167 4% 9% 5% 10% 21% 43% 8%<br />
25-39 565 3% 11% 9% 8% 28% 35% 6%<br />
40-54 572 4% 14% 13% 6% 21% 37% 5%<br />
55 + 165 1% 11% 13% 10% 22% 36% 7%<br />
Education (End of)<br />
15 265 1% 15% 11% 12% 27% 31% 3%<br />
16-19 797 4% 13% 11% 7% 21% 36% 8%<br />
20+ 384 3% 9% 10% 6% 25% 44% 3%<br />
Still Studying 0 - - - - - - -<br />
Left-Right scale<br />
(1-4) Left 395 4% 11% 12% 9% 20% 39% 5%<br />
(5-6) Centre 536 1% 14% 13% 6% 23% 37% 6%<br />
(7-10) Right 249 6% 14% 8% 7% 27% 31% 7%<br />
Respondent occupation scale<br />
Self- employed 147 1% 20% 10% 4% 24% 38% 3%<br />
Managers 156 4% 12% 7% 11% 20% 44% 2%<br />
Other white collars 363 4% 9% 17% 7% 21% 37% 5%<br />
Manual workers 803 3% 12% 9% 8% 25% 35% 8%<br />
House persons 0 - - - - - - -<br />
Unemployed 0 - - - - - - -<br />
Retired 0 - - - - - - -<br />
Students 0 - - - - - - -<br />
Subjective urbanisation<br />
Rural village 486 1% 14% 10% 7% 20% 40% 8%<br />
Small/ mid size town 659 5% 12% 11% 7% 24% 36% 5%<br />
Large town 321 1% 9% 12% 10% 28% 35% 5%<br />
EU27 results are purely indicative as it is impossible to anticipate the impact of the accession of these countries on the results.
QA11 If you were to be laid-off, how would you rate on a scale from 1 to 10, the likelihood that you find a job requiring the same skills and experience in the next six months? 1 means that it would be not at all likely and 10 means that it would be<br />
(IF 'CURRENTLY WORK', CODE 5 TO 18 IN D15a)<br />
NOT AT ALL<br />
VERY<br />
TOTAL<br />
2 3 4 5 6 7 8 9<br />
DK Average<br />
LIKELY<br />
LIKELY<br />
EU25 12299 11% 5% 8% 6% 13% 7% 11% 13% 6% 14% 6% 5,9<br />
EU27 13257 10% 5% 8% 6% 13% 7% 11% 13% 6% 14% 7% 5,9<br />
BE 468 10% 4% 4% 5% 12% 4% 11% 17% 8% 21% 4% 6,5<br />
CZ 635 8% 3% 8% 6% 12% 10% 14% 16% 5% 14% 4% 6,2<br />
DK 578 7% 3% 4% 3% 6% 3% 4% 13% 8% 47% 2% 7,7<br />
D-W 482 21% 5% 11% 7% 14% 5% 7% 8% 3% 13% 6% 4,9<br />
DE 727 22% 5% 11% 7% 14% 4% 7% 8% 3% 13% 6% 4,8<br />
D-E 246 28% 7% 10% 8% 13% 2% 8% 8% 2% 10% 4% 4,4<br />
EE 544 7% 1% 4% 2% 11% 5% 11% 16% 9% 30% 4% 7,3<br />
EL 450 13% 9% 12% 5% 10% 11% 11% 10% 7% 10% 2% 5,3<br />
ES 506 3% 4% 6% 6% 12% 9% 15% 18% 7% 8% 12% 6,4<br />
FR 532 10% 5% 8% 5% 17% 7% 8% 15% 7% 12% 6% 5,9<br />
IE 515 3% 2% 3% 2% 6% 6% 10% 19% 13% 23% 13% 7,5<br />
IT 529 8% 10% 10% 7% 12% 9% 14% 11% 4% 9% 6% 5,4<br />
CY 257 12% 4% 11% 3% 9% 4% 11% 9% 7% 24% 6% 6,2<br />
LV 565 4% 4% 5% 3% 8% 7% 9% 16% 9% 33% 2% 7,4<br />
LT 491 7% 4% 5% 6% 14% 5% 7% 14% 8% 25% 5% 6,7<br />
LU 238 12% 4% 11% 5% 15% 3% 8% 11% 11% 12% 8% 5,8<br />
HU 435 15% 7% 12% 10% 15% 8% 8% 9% 3% 10% 3% 5,0<br />
MT 216 12% 6% 5% 5% 11% 9% 10% 16% 6% 13% 7% 5,9<br />
NL 574 9% 3% 5% 4% 10% 7% 13% 18% 8% 20% 3% 6,6<br />
AT 573 6% 6% 11% 9% 17% 10% 12% 11% 5% 7% 6% 5,6<br />
PL 425 11% 8% 10% 5% 14% 7% 7% 14% 5% 10% 9% 5,4<br />
PT 501 10% 4% 11% 12% 15% 8% 13% 13% 5% 5% 4% 5,3<br />
SI 462 8% 4% 6% 5% 12% 9% 14% 15% 8% 16% 3% 6,4<br />
SK 595 5% 7% 6% 7% 14% 10% 10% 14% 10% 8% 9% 5,9<br />
FI 565 7% 4% 5% 5% 7% 9% 10% 17% 14% 20% 2% 6,9<br />
SE 581 8% 4% 6% 6% 6% 6% 7% 18% 8% 28% 3% 6,9<br />
UK 628 7% 3% 4% 7% 10% 8% 12% 11% 8% 24% 6% 6,8<br />
BG 443 10% 8% 10% 7% 17% 8% 8% 8% 7% 11% 6% 5,4<br />
RO 482 4% 5% 4% 5% 11% 9% 12% 13% 8% 9% 20% 6,3<br />
Sex<br />
Male 6938 10% 6% 8% 6% 12% 7% 11% 13% 6% 15% 6% 6,0<br />
Female 5361 12% 5% 8% 6% 14% 8% 10% 13% 5% 13% 6% 5,7<br />
Age<br />
15-24 1111 3% 3% 5% 7% 12% 11% 15% 19% 7% 14% 4% 6,6<br />
25-39 4997 6% 4% 6% 7% 13% 7% 13% 16% 6% 17% 5% 6,4<br />
40-54 4703 13% 6% 9% 6% 13% 8% 9% 11% 6% 13% 6% 5,5<br />
55 + 1489 24% 8% 11% 4% 10% 5% 5% 6% 4% 11% 12% 4,5<br />
Education (End of)<br />
15 1769 14% 6% 11% 7% 12% 7% 11% 9% 4% 10% 9% 5,2<br />
16-19 6241 11% 6% 8% 7% 13% 7% 11% 12% 6% 13% 6% 5,7<br />
20+ 4154 8% 4% 7% 5% 13% 7% 11% 15% 7% 18% 5% 6,3<br />
Still Studying 0 - - - - - - - - - - - 0,0<br />
Left-Right scale<br />
(1-4) Left 3521 10% 6% 10% 7% 11% 8% 12% 13% 6% 12% 5% 5,7<br />
(5-6) Centre 4331 11% 4% 7% 7% 15% 7% 10% 13% 5% 15% 6% 5,9<br />
(7-10) Right 2159 10% 5% 7% 5% 11% 7% 10% 14% 8% 18% 5% 6,2<br />
Respondent occupation scale<br />
Self- employed 1876 14% 5% 5% 4% 10% 6% 6% 11% 6% 20% 13% 6,0<br />
Managers 2241 10% 6% 6% 5% 13% 6% 12% 13% 7% 17% 5% 6,1<br />
Other white collars 2982 10% 6% 9% 7% 13% 10% 13% 14% 5% 10% 3% 5,7<br />
Manual workers 5201 10% 5% 9% 7% 13% 7% 10% 13% 6% 14% 6% 5,8<br />
House persons 0 - - - - - - - - - - - 0,0<br />
Unemployed 0 - - - - - - - - - - - 0,0<br />
Retired 0 - - - - - - - - - - - 0,0<br />
Students 0 - - - - - - - - - - - 0,0<br />
Subjective urbanisation<br />
Rural village 4061 12% 6% 8% 6% 13% 8% 9% 12% 5% 13% 8% 5,7<br />
Small/ mid size town 5253 10% 5% 9% 7% 12% 7% 11% 14% 6% 14% 5% 5,8<br />
Large town 2967 8% 5% 7% 6% 13% 8% 12% 12% 6% 17% 6% 6,2<br />
EU27 results are purely indicative as it is impossible to anticipate the impact of the accession of these countries on the results.
QA12.1 What are your expectations for the next twelve months: will the next 12 months be better, worse or the same, when it comes to...?<br />
Your life in general<br />
TOTAL Better Worse Same DK<br />
EU25 24732 35% 10% 52% 3%<br />
EU27 26755 35% 11% 51% 3%<br />
BE 1009 34% 7% 58% 1%<br />
CZ 1150 27% 12% 58% 3%<br />
DK 1037 41% 2% 55% 2%<br />
D-W 1000 20% 15% 63% 2%<br />
DE 1504 20% 16% 62% 2%<br />
D-E 504 19% 22% 57% 2%<br />
EE 1000 52% 4% 41% 3%<br />
EL 1000 39% 16% 45% -<br />
ES 1000 39% 6% 52% 3%<br />
FR 1012 45% 7% 45% 3%<br />
IE 1000 44% 3% 49% 4%<br />
IT 1038 35% 11% 49% 5%<br />
CY 504 35% 8% 48% 9%<br />
LV 1019 46% 6% 45% 3%<br />
LT 1025 43% 9% 44% 4%<br />
LU 502 32% 5% 59% 4%<br />
HU 1000 17% 38% 42% 3%<br />
MT 500 35% 10% 48% 7%<br />
NL 1020 34% 4% 60% 2%<br />
AT 1029 20% 10% 67% 3%<br />
PL 1000 37% 11% 48% 4%<br />
PT 1004 25% 16% 54% 5%<br />
SI 1019 29% 13% 56% 2%<br />
SK 1003 31% 11% 56% 2%<br />
FI 1028 34% 3% 62% 1%<br />
SE 1014 43% 3% 51% 3%<br />
UK 1315 48% 4% 45% 3%<br />
BG 1023 17% 29% 44% 10%<br />
RO 1000 44% 16% 34% 6%<br />
Sex<br />
Male 11904 36% 10% 51% 3%<br />
Female 12828 34% 10% 53% 3%<br />
Age<br />
15-24 3755 57% 5% 36% 2%<br />
25-39 6468 48% 7% 43% 2%<br />
40-54 6326 32% 12% 53% 3%<br />
55 + 8183 17% 13% 66% 4%<br />
Education (End of)<br />
15 6147 22% 15% 59% 4%<br />
16-19 10175 35% 10% 53% 2%<br />
20+ 5626 41% 6% 50% 3%<br />
Still Studying 2341 56% 5% 37% 2%<br />
Left-Right scale<br />
(1-4) Left 6648 38% 9% 51% 2%<br />
(5-6) Centre 8373 34% 10% 53% 3%<br />
(7-10) Right 4340 34% 10% 54% 2%<br />
Respondent occupation scale<br />
Self- employed 1876 45% 9% 44% 2%<br />
Managers 2241 40% 6% 52% 2%<br />
Other white collars 2982 39% 9% 50% 2%<br />
Manual workers 5201 38% 10% 49% 3%<br />
House persons 2402 30% 10% 57% 3%<br />
Unemployed 1584 49% 11% 36% 4%<br />
Retired 6106 16% 14% 66% 4%<br />
Students 2341 56% 5% 37% 2%<br />
Subjective urbanisation<br />
Rural village 8005 31% 11% 56% 2%<br />
Small/ mid size town 10627 36% 10% 51% 3%<br />
Large town 6068 40% 10% 48% 2%<br />
EU27 results are purely indicative as it is impossible to anticipate the impact of the accession of these countries on the results.
QA12.2 What are your expectations for the next twelve months: will the next 12 months be better, worse or the same, when it comes to...?<br />
The economic situation in (OUR COUNTRY)<br />
TOTAL Better Worse Same DK<br />
EU25 24732 20% 34% 39% 7%<br />
EU27 26755 21% 34% 38% 7%<br />
BE 1009 12% 48% 39% 1%<br />
CZ 1150 18% 33% 45% 4%<br />
DK 1037 22% 12% 60% 6%<br />
D-W 1000 24% 37% 37% 2%<br />
DE 1504 23% 40% 35% 2%<br />
D-E 504 17% 50% 31% 2%<br />
EE 1000 48% 6% 36% 10%<br />
EL 1000 10% 55% 34% 1%<br />
ES 1000 16% 21% 50% 13%<br />
FR 1012 18% 37% 37% 8%<br />
IE 1000 28% 15% 47% 10%<br />
IT 1038 24% 36% 34% 6%<br />
CY 504 15% 46% 29% 10%<br />
LV 1019 28% 20% 45% 7%<br />
LT 1025 32% 18% 42% 8%<br />
LU 502 14% 43% 33% 10%<br />
HU 1000 9% 62% 24% 5%<br />
MT 500 25% 23% 25% 27%<br />
NL 1020 36% 16% 42% 6%<br />
AT 1029 28% 17% 51% 4%<br />
PL 1000 21% 27% 41% 11%<br />
PT 1004 12% 48% 32% 8%<br />
SI 1019 20% 32% 44% 4%<br />
SK 1003 28% 26% 42% 4%<br />
FI 1028 17% 15% 66% 2%<br />
SE 1014 32% 23% 34% 11%<br />
UK 1315 15% 37% 37% 11%<br />
BG 1023 14% 38% 29% 19%<br />
RO 1000 33% 27% 29% 11%<br />
Sex<br />
Male 11904 22% 33% 39% 6%<br />
Female 12828 18% 34% 40% 8%<br />
Age<br />
15-24 3755 24% 26% 41% 9%<br />
25-39 6468 22% 32% 40% 6%<br />
40-54 6326 20% 38% 37% 5%<br />
55 + 8183 18% 35% 39% 8%<br />
Education (End of)<br />
15 6147 16% 37% 38% 9%<br />
16-19 10175 19% 37% 39% 5%<br />
20+ 5626 25% 29% 40% 6%<br />
Still Studying 2341 27% 23% 40% 10%<br />
Left-Right scale<br />
(1-4) Left 6648 22% 32% 41% 5%<br />
(5-6) Centre 8373 19% 34% 41% 6%<br />
(7-10) Right 4340 22% 36% 37% 5%<br />
Respondent occupation scale<br />
Self- employed 1876 26% 35% 34% 5%<br />
Managers 2241 24% 29% 42% 5%<br />
Other white collars 2982 21% 34% 41% 4%<br />
Manual workers 5201 17% 37% 39% 7%<br />
House persons 2402 20% 33% 39% 8%<br />
Unemployed 1584 20% 36% 37% 7%<br />
Retired 6106 17% 35% 39% 9%<br />
Students 2341 27% 23% 40% 10%<br />
Subjective urbanisation<br />
Rural village 8005 18% 35% 40% 7%<br />
Small/ mid size town 10627 21% 34% 38% 7%<br />
Large town 6068 22% 32% 39% 7%<br />
EU27 results are purely indicative as it is impossible to anticipate the impact of the accession of these countries on the results.
QA12.3 What are your expectations for the next twelve months: will the next 12 months be better, worse or the same, when it comes to...?<br />
The financial situation of your household<br />
TOTAL Better Worse Same DK<br />
EU25 24732 25% 16% 56% 3%<br />
EU27 26755 25% 16% 56% 3%<br />
BE 1009 21% 10% 68% 1%<br />
CZ 1150 21% 18% 59% 2%<br />
DK 1037 32% 6% 61% 1%<br />
D-W 1000 14% 23% 62% 1%<br />
DE 1504 13% 26% 60% 1%<br />
D-E 504 9% 35% 55% 1%<br />
EE 1000 47% 5% 46% 2%<br />
EL 1000 24% 22% 54% -<br />
ES 1000 24% 8% 64% 4%<br />
FR 1012 30% 13% 54% 3%<br />
IE 1000 36% 6% 53% 5%<br />
IT 1038 28% 15% 54% 3%<br />
CY 504 23% 21% 52% 4%<br />
LV 1019 38% 9% 50% 3%<br />
LT 1025 36% 11% 50% 3%<br />
LU 502 21% 9% 67% 3%<br />
HU 1000 12% 51% 35% 2%<br />
MT 500 14% 9% 70% 7%<br />
NL 1020 26% 12% 60% 2%<br />
AT 1029 21% 13% 63% 3%<br />
PL 1000 28% 15% 52% 5%<br />
PT 1004 18% 18% 59% 5%<br />
SI 1019 18% 16% 64% 2%<br />
SK 1003 24% 18% 56% 2%<br />
FI 1028 22% 6% 72% -<br />
SE 1014 34% 9% 54% 3%<br />
UK 1315 36% 9% 52% 3%<br />
BG 1023 13% 35% 42% 10%<br />
RO 1000 34% 19% 41% 6%<br />
Sex<br />
Male 11904 27% 16% 55% 2%<br />
Female 12828 23% 16% 58% 3%<br />
Age<br />
15-24 3755 42% 10% 45% 3%<br />
25-39 6468 37% 13% 48% 2%<br />
40-54 6326 23% 19% 56% 2%<br />
55 + 8183 10% 18% 70% 2%<br />
Education (End of)<br />
15 6147 15% 19% 63% 3%<br />
16-19 10175 25% 17% 56% 2%<br />
20+ 5626 30% 12% 56% 2%<br />
Still Studying 2341 41% 10% 45% 4%<br />
Left-Right scale<br />
(1-4) Left 6648 25% 16% 57% 2%<br />
(5-6) Centre 8373 25% 16% 57% 2%<br />
(7-10) Right 4340 26% 15% 57% 2%<br />
Respondent occupation scale<br />
Self- employed 1876 36% 12% 50% 2%<br />
Managers 2241 31% 11% 57% 1%<br />
Other white collars 2982 29% 14% 55% 2%<br />
Manual workers 5201 28% 16% 53% 3%<br />
House persons 2402 21% 16% 60% 3%<br />
Unemployed 1584 37% 19% 40% 4%<br />
Retired 6106 9% 20% 69% 2%<br />
Students 2341 41% 10% 45% 4%<br />
Subjective urbanisation<br />
Rural village 8005 22% 16% 59% 3%<br />
Small/ mid size town 10627 26% 16% 56% 2%<br />
Large town 6068 28% 16% 53% 3%<br />
EU27 results are purely indicative as it is impossible to anticipate the impact of the accession of these countries on the results.
QA12.4 What are your expectations for the next twelve months: will the next 12 months be better, worse or the same, when it comes to...?<br />
The employment situation in (OUR COUNTRY)<br />
TOTAL Better Worse Same DK<br />
EU25 24732 22% 33% 38% 7%<br />
EU27 26755 23% 32% 37% 8%<br />
BE 1009 12% 58% 29% 1%<br />
CZ 1150 16% 30% 50% 4%<br />
DK 1037 26% 9% 61% 4%<br />
D-W 1000 27% 34% 37% 2%<br />
DE 1504 24% 37% 37% 2%<br />
D-E 504 13% 49% 36% 2%<br />
EE 1000 46% 6% 35% 13%<br />
EL 1000 9% 59% 32% -<br />
ES 1000 17% 20% 49% 14%<br />
FR 1012 22% 37% 36% 5%<br />
IE 1000 25% 17% 46% 12%<br />
IT 1038 22% 34% 38% 6%<br />
CY 504 11% 46% 27% 16%<br />
LV 1019 32% 10% 47% 11%<br />
LT 1025 44% 9% 37% 10%<br />
LU 502 10% 58% 22% 10%<br />
HU 1000 5% 59% 32% 4%<br />
MT 500 27% 25% 28% 20%<br />
NL 1020 52% 10% 30% 8%<br />
AT 1029 27% 21% 46% 6%<br />
PL 1000 29% 21% 42% 8%<br />
PT 1004 12% 52% 29% 7%<br />
SI 1019 18% 35% 43% 4%<br />
SK 1003 29% 22% 43% 6%<br />
FI 1028 28% 19% 52% 1%<br />
SE 1014 48% 17% 26% 9%<br />
UK 1315 15% 38% 33% 14%<br />
BG 1023 15% 25% 30% 30%<br />
RO 1000 31% 25% 27% 17%<br />
Sex<br />
Male 11904 24% 32% 38% 6%<br />
Female 12828 21% 33% 38% 8%<br />
Age<br />
15-24 3755 27% 26% 40% 7%<br />
25-39 6468 25% 31% 39% 5%<br />
40-54 6326 21% 36% 39% 4%<br />
55 + 8183 19% 34% 37% 10%<br />
Education (End of)<br />
15 6147 17% 37% 36% 10%<br />
16-19 10175 22% 35% 38% 5%<br />
20+ 5626 27% 27% 40% 6%<br />
Still Studying 2341 28% 25% 38% 9%<br />
Left-Right scale<br />
(1-4) Left 6648 25% 30% 40% 5%<br />
(5-6) Centre 8373 21% 34% 39% 6%<br />
(7-10) Right 4340 26% 33% 36% 5%<br />
Respondent occupation scale<br />
Self- employed 1876 26% 34% 35% 5%<br />
Managers 2241 25% 26% 44% 5%<br />
Other white collars 2982 23% 32% 41% 4%<br />
Manual workers 5201 20% 36% 39% 5%<br />
House persons 2402 20% 32% 39% 9%<br />
Unemployed 1584 25% 35% 34% 6%<br />
Retired 6106 19% 34% 36% 11%<br />
Students 2341 28% 25% 38% 9%<br />
Subjective urbanisation<br />
Rural village 8005 21% 33% 39% 7%<br />
Small/ mid size town 10627 23% 33% 37% 7%<br />
Large town 6068 24% 30% 39% 7%<br />
EU27 results are purely indicative as it is impossible to anticipate the impact of the accession of these countries on the results.
QA12.5 What are your expectations for the next twelve months: will the next 12 months be better, worse or the same, when it comes to...?<br />
Your personal job situation<br />
TOTAL Better Worse Same DK<br />
EU25 24732 22% 7% 62% 9%<br />
EU27 26755 22% 8% 60% 10%<br />
BE 1009 18% 7% 66% 9%<br />
CZ 1150 13% 7% 61% 19%<br />
DK 1037 24% 2% 68% 6%<br />
D-W 1000 16% 9% 67% 8%<br />
DE 1504 15% 9% 68% 8%<br />
D-E 504 15% 10% 71% 4%<br />
EE 1000 31% 3% 50% 16%<br />
EL 1000 18% 8% 72% 2%<br />
ES 1000 23% 5% 68% 4%<br />
FR 1012 29% 5% 56% 10%<br />
IE 1000 26% 3% 54% 17%<br />
IT 1038 26% 11% 58% 5%<br />
CY 504 13% 7% 63% 17%<br />
LV 1019 29% 3% 46% 22%<br />
LT 1025 31% 11% 41% 17%<br />
LU 502 13% 5% 70% 12%<br />
HU 1000 6% 32% 52% 10%<br />
MT 500 12% 4% 58% 26%<br />
NL 1020 25% 5% 51% 19%<br />
AT 1029 19% 8% 63% 10%<br />
PL 1000 20% 5% 64% 11%<br />
PT 1004 16% 11% 63% 10%<br />
SI 1019 12% 7% 76% 5%<br />
SK 1003 16% 7% 53% 24%<br />
FI 1028 14% 3% 79% 4%<br />
SE 1014 25% 3% 63% 9%<br />
UK 1315 29% 4% 55% 12%<br />
BG 1023 12% 12% 60% 16%<br />
RO 1000 23% 7% 38% 32%<br />
Sex<br />
Male 11904 25% 7% 60% 8%<br />
Female 12828 19% 7% 63% 11%<br />
Age<br />
15-24 3755 43% 5% 42% 10%<br />
25-39 6468 35% 8% 54% 3%<br />
40-54 6326 19% 10% 66% 5%<br />
55 + 8183 5% 6% 73% 16%<br />
Education (End of)<br />
15 6147 11% 8% 69% 12%<br />
16-19 10175 22% 8% 62% 8%<br />
20+ 5626 29% 5% 60% 6%<br />
Still Studying 2341 40% 5% 41% 14%<br />
Left-Right scale<br />
(1-4) Left 6648 25% 7% 61% 7%<br />
(5-6) Centre 8373 21% 7% 63% 9%<br />
(7-10) Right 4340 22% 7% 61% 10%<br />
Respondent occupation scale<br />
Self- employed 1876 34% 8% 55% 3%<br />
Managers 2241 30% 5% 63% 2%<br />
Other white collars 2982 26% 9% 63% 2%<br />
Manual workers 5201 24% 10% 63% 3%<br />
House persons 2402 15% 7% 67% 11%<br />
Unemployed 1584 42% 13% 36% 9%<br />
Retired 6106 3% 4% 73% 20%<br />
Students 2341 40% 5% 41% 14%<br />
Subjective urbanisation<br />
Rural village 8005 18% 7% 66% 9%<br />
Small/ mid size town 10627 23% 7% 61% 9%<br />
Large town 6068 27% 8% 55% 10%<br />
EU27 results are purely indicative as it is impossible to anticipate the impact of the accession of these countries on the results.
QA13 If you compare your present situation with five years ago, would you say it has improved, stayed about the same, or got worse?<br />
TOTAL Improved Stayed about the same Got worse DK<br />
EU25 24732 39% 35% 25% 1%<br />
EU27 26755 39% 35% 25% 1%<br />
BE 1009 40% 42% 18% -<br />
CZ 1150 40% 36% 23% 1%<br />
DK 1037 60% 25% 14% 1%<br />
D-W 1000 29% 39% 31% 1%<br />
DE 1504 29% 38% 32% 1%<br />
D-E 504 28% 38% 34% -<br />
EE 1000 69% 20% 10% 1%<br />
EL 1000 31% 29% 40% -<br />
ES 1000 43% 42% 15% -<br />
FR 1012 38% 29% 32% 1%<br />
IE 1000 62% 26% 9% 3%<br />
IT 1038 37% 39% 23% 1%<br />
CY 504 51% 30% 18% 1%<br />
LV 1019 62% 24% 13% 1%<br />
LT 1025 55% 29% 15% 1%<br />
LU 502 42% 40% 17% 1%<br />
HU 1000 22% 32% 46% -<br />
MT 500 44% 28% 26% 2%<br />
NL 1020 49% 31% 18% 2%<br />
AT 1029 32% 47% 18% 3%<br />
PL 1000 38% 31% 28% 3%<br />
PT 1004 30% 38% 29% 3%<br />
SI 1019 39% 38% 23% -<br />
SK 1003 37% 38% 24% 1%<br />
FI 1028 52% 34% 14% -<br />
SE 1014 57% 28% 14% 1%<br />
UK 1315 50% 29% 20% 1%<br />
BG 1023 19% 37% 39% 5%<br />
RO 1000 43% 32% 23% 2%<br />
Sex<br />
Male 11904 42% 33% 24% 1%<br />
Female 12828 37% 36% 26% 1%<br />
Age<br />
15-24 3755 59% 27% 12% 2%<br />
25-39 6468 55% 26% 18% 1%<br />
40-54 6326 37% 34% 28% 1%<br />
55 + 8183 19% 46% 34% 1%<br />
Education (End of)<br />
15 6147 23% 42% 34% 1%<br />
16-19 10175 39% 34% 26% 1%<br />
20+ 5626 51% 29% 19% 1%<br />
Still Studying 2341 57% 31% 9% 3%<br />
Left-Right scale<br />
(1-4) Left 6648 42% 34% 23% 1%<br />
(5-6) Centre 8373 38% 36% 25% 1%<br />
(7-10) Right 4340 39% 33% 27% 1%<br />
Respondent occupation scale<br />
Self- employed 1876 52% 28% 19% 1%<br />
Managers 2241 58% 26% 15% 1%<br />
Other white collars 2982 50% 32% 17% 1%<br />
Manual workers 5201 45% 32% 22% 1%<br />
House persons 2402 31% 40% 28% 1%<br />
Unemployed 1584 30% 27% 42% 1%<br />
Retired 6106 17% 45% 37% 1%<br />
Students 2341 57% 31% 9% 3%<br />
Subjective urbanisation<br />
Rural village 8005 37% 36% 26% 1%<br />
Small/ mid size town 10627 40% 34% 25% 1%<br />
Large town 6068 41% 34% 23% 2%<br />
EU27 results are purely indicative as it is impossible to anticipate the impact of the accession of these countries on the results.
QA14 In the course of the next five years, do you expect your personal situation to improve, to stay about the same or to get worse?<br />
TOTAL Improve Stay about the same Get worse DK<br />
EU25 24732 41% 40% 14% 5%<br />
EU27 26755 42% 39% 14% 5%<br />
BE 1009 37% 52% 10% 1%<br />
CZ 1150 34% 45% 15% 6%<br />
DK 1037 49% 42% 7% 2%<br />
D-W 1000 25% 50% 22% 3%<br />
DE 1504 26% 48% 23% 3%<br />
D-E 504 28% 41% 29% 2%<br />
EE 1000 60% 25% 6% 9%<br />
EL 1000 35% 35% 28% 2%<br />
ES 1000 51% 39% 5% 5%<br />
FR 1012 47% 36% 13% 4%<br />
IE 1000 52% 34% 6% 8%<br />
IT 1038 38% 42% 13% 7%<br />
CY 504 46% 26% 12% 16%<br />
LV 1019 59% 29% 7% 5%<br />
LT 1025 48% 29% 11% 12%<br />
LU 502 37% 49% 9% 5%<br />
HU 1000 25% 32% 38% 5%<br />
MT 500 48% 26% 9% 17%<br />
NL 1020 43% 46% 9% 2%<br />
AT 1029 30% 56% 8% 6%<br />
PL 1000 44% 33% 13% 10%<br />
PT 1004 54% 28% 12% 6%<br />
SI 1019 35% 45% 16% 4%<br />
SK 1003 44% 39% 11% 6%<br />
FI 1028 43% 47% 9% 1%<br />
SE 1014 50% 36% 9% 5%<br />
UK 1315 53% 34% 9% 4%<br />
BG 1023 23% 34% 23% 20%<br />
RO 1000 52% 27% 11% 10%<br />
Sex<br />
Male 11904 44% 38% 14% 4%<br />
Female 12828 40% 41% 14% 5%<br />
Age<br />
15-24 3755 72% 20% 5% 3%<br />
25-39 6468 59% 29% 7% 5%<br />
40-54 6326 38% 42% 15% 5%<br />
55 + 8183 16% 56% 22% 6%<br />
Education (End of)<br />
15 6147 24% 49% 21% 6%<br />
16-19 10175 40% 41% 14% 5%<br />
20+ 5626 49% 37% 10% 4%<br />
Still Studying 2341 73% 21% 4% 2%<br />
Left-Right scale<br />
(1-4) Left 6648 44% 39% 13% 4%<br />
(5-6) Centre 8373 40% 42% 14% 4%<br />
(7-10) Right 4340 41% 41% 15% 3%<br />
Respondent occupation scale<br />
Self- employed 1876 51% 35% 10% 4%<br />
Managers 2241 49% 39% 9% 3%<br />
Other white collars 2982 49% 37% 9% 5%<br />
Manual workers 5201 48% 35% 12% 5%<br />
House persons 2402 34% 46% 14% 6%<br />
Unemployed 1584 59% 23% 12% 6%<br />
Retired 6106 13% 57% 24% 6%<br />
Students 2341 73% 21% 4% 2%<br />
Subjective urbanisation<br />
Rural village 8005 39% 42% 14% 5%<br />
Small/ mid size town 10627 42% 40% 13% 5%<br />
Large town 6068 44% 37% 15% 4%<br />
EU27 results are purely indicative as it is impossible to anticipate the impact of the accession of these countries on the results.
QA15 At the moment, when you think of the future of your pension, would you say that you are…?<br />
TOTAL Very confident Rather confident Rather not confident Not at all confident DK Confident Not confident<br />
EU25 24732 10% 32% 32% 20% 6% 42% 52%<br />
EU27 26755 10% 32% 32% 20% 6% 42% 52%<br />
BE 1009 11% 42% 31% 12% 4% 53% 43%<br />
CZ 1150 4% 30% 36% 26% 4% 34% 62%<br />
DK 1037 29% 45% 17% 4% 5% 74% 21%<br />
D-W 1000 6% 21% 39% 31% 3% 27% 70%<br />
DE 1504 5% 20% 39% 33% 3% 25% 72%<br />
D-E 504 3% 19% 37% 40% 1% 22% 77%<br />
EE 1000 8% 37% 29% 14% 12% 45% 43%<br />
EL 1000 15% 23% 32% 29% 1% 38% 61%<br />
ES 1000 14% 37% 29% 10% 10% 51% 39%<br />
FR 1012 3% 29% 35% 29% 4% 32% 64%<br />
IE 1000 19% 37% 14% 8% 22% 56% 22%<br />
IT 1038 11% 35% 34% 16% 4% 46% 50%<br />
CY 504 18% 32% 21% 10% 19% 50% 31%<br />
LV 1019 11% 31% 29% 21% 8% 42% 50%<br />
LT 1025 10% 33% 29% 19% 9% 43% 48%<br />
LU 502 9% 32% 38% 15% 6% 41% 53%<br />
HU 1000 4% 25% 37% 28% 6% 29% 65%<br />
MT 500 9% 33% 25% 18% 15% 42% 43%<br />
NL 1020 19% 47% 16% 9% 9% 66% 25%<br />
AT 1029 14% 47% 25% 5% 9% 61% 30%<br />
PL 1000 7% 24% 37% 21% 11% 31% 58%<br />
PT 1004 6% 28% 34% 22% 10% 34% 56%<br />
SI 1019 5% 30% 40% 22% 3% 35% 62%<br />
SK 1003 5% 36% 38% 13% 8% 41% 51%<br />
FI 1028 16% 51% 26% 6% 1% 67% 32%<br />
SE 1014 12% 41% 29% 11% 7% 53% 40%<br />
UK 1315 12% 38% 27% 14% 9% 50% 41%<br />
BG 1023 6% 19% 33% 29% 13% 25% 62%<br />
RO 1000 11% 36% 27% 16% 10% 47% 43%<br />
Sex<br />
Male 11904 11% 33% 30% 20% 6% 44% 50%<br />
Female 12828 9% 30% 34% 20% 7% 39% 54%<br />
Age<br />
15-24 3755 8% 27% 30% 20% 15% 35% 50%<br />
25-39 6468 7% 26% 36% 26% 5% 33% 62%<br />
40-54 6326 8% 29% 36% 24% 3% 37% 60%<br />
55 + 8183 13% 41% 28% 12% 6% 54% 40%<br />
Education (End of)<br />
15 6147 10% 37% 30% 17% 6% 47% 47%<br />
16-19 10175 8% 29% 35% 23% 5% 37% 58%<br />
20+ 5626 11% 32% 33% 20% 4% 43% 53%<br />
Still Studying 2341 10% 27% 29% 17% 17% 37% 46%<br />
Left-Right scale<br />
(1-4) Left 6648 10% 33% 34% 18% 5% 43% 52%<br />
(5-6) Centre 8373 9% 32% 33% 21% 5% 41% 54%<br />
(7-10) Right 4340 10% 34% 30% 21% 5% 44% 51%<br />
Respondent occupation scale<br />
Self- employed 1876 10% 26% 33% 27% 4% 36% 60%<br />
Managers 2241 10% 37% 32% 18% 3% 47% 50%<br />
Other white collars 2982 10% 30% 37% 20% 3% 40% 57%<br />
Manual workers 5201 6% 27% 37% 26% 4% 33% 63%<br />
House persons 2402 10% 29% 33% 19% 9% 39% 52%<br />
Unemployed 1584 6% 21% 34% 32% 7% 27% 66%<br />
Retired 6106 13% 42% 27% 12% 6% 55% 39%<br />
Students 2341 10% 27% 29% 17% 17% 37% 46%<br />
Subjective urbanisation<br />
Rural village 8005 10% 32% 32% 20% 6% 42% 52%<br />
Small/ mid size town 10627 9% 32% 33% 21% 5% 41% 54%<br />
Large town 6068 10% 31% 32% 20% 7% 41% 52%<br />
EU27 results are purely indicative as it is impossible to anticipate the impact of the accession of these countries on the results.
QA16a Concerning yourself, do you think that in order for you to progress in your career…?<br />
(IF 'CURRENTLY WORK', CODE 5 TO 18 IN D15a)<br />
You should follow a more<br />
You should follow a more<br />
Your education and training to date<br />
TOTAL<br />
specialised training but you cannot specialised training and you intend<br />
DK<br />
is sufficient<br />
currently do this<br />
doing this<br />
EU25 12299 48% 25% 21% 6%<br />
EU27 13257 49% 24% 21% 6%<br />
BE 468 62% 16% 18% 4%<br />
CZ 635 62% 17% 16% 5%<br />
DK 578 42% 26% 29% 3%<br />
D-W 482 45% 27% 25% 3%<br />
DE 727 42% 26% 29% 3%<br />
D-E 246 34% 24% 40% 2%<br />
EE 544 39% 32% 23% 6%<br />
EL 450 69% 20% 10% 1%<br />
ES 506 59% 20% 13% 8%<br />
FR 532 39% 31% 25% 5%<br />
IE 515 53% 15% 25% 7%<br />
IT 529 51% 28% 11% 10%<br />
CY 257 69% 19% 9% 3%<br />
LV 565 38% 35% 23% 4%<br />
LT 491 35% 37% 18% 10%<br />
LU 238 54% 20% 21% 5%<br />
HU 435 50% 29% 17% 4%<br />
MT 216 39% 31% 28% 2%<br />
NL 574 42% 19% 35% 4%<br />
AT 573 48% 25% 23% 4%<br />
PL 425 43% 27% 23% 7%<br />
PT 501 63% 20% 13% 4%<br />
SI 462 47% 26% 23% 4%<br />
SK 595 57% 16% 15% 12%<br />
FI 565 48% 29% 21% 2%<br />
SE 581 48% 21% 25% 6%<br />
UK 628 48% 21% 24% 7%<br />
BG 443 62% 18% 12% 8%<br />
RO 482 50% 21% 15% 14%<br />
Sex<br />
Male 6938 51% 23% 21% 5%<br />
Female 5361 45% 26% 22% 7%<br />
Age<br />
15-24 1111 34% 24% 38% 4%<br />
25-39 4997 42% 28% 25% 5%<br />
40-54 4703 53% 23% 18% 6%<br />
55 + 1489 64% 17% 8% 11%<br />
Education (End of)<br />
15 1769 54% 25% 11% 10%<br />
16-19 6241 48% 27% 20% 5%<br />
20+ 4154 47% 22% 27% 4%<br />
Still Studying 0 - - - -<br />
Left-Right scale<br />
(1-4) Left 3521 47% 26% 23% 4%<br />
(5-6) Centre 4331 48% 25% 22% 5%<br />
(7-10) Right 2159 53% 21% 21% 5%<br />
Respondent occupation scale<br />
Self- employed 1876 57% 20% 18% 5%<br />
Managers 2241 52% 18% 27% 3%<br />
Other white collars 2982 47% 28% 20% 5%<br />
Manual workers 5201 45% 28% 20% 7%<br />
House persons 0 - - - -<br />
Unemployed 0 - - - -<br />
Retired 0 - - - -<br />
Students 0 - - - -<br />
Subjective urbanisation<br />
Rural village 4061 49% 25% 20% 6%<br />
Small/ mid size town 5253 48% 25% 20% 7%<br />
Large town 2967 48% 24% 24% 4%<br />
EU27 results are purely indicative as it is impossible to anticipate the impact of the accession of these countries on the results.
QA16b If you had to choose from the following possibilities aimed at guaranteeing the financing of the pension system in (OUR COUNTRY), which one would be most acceptable for you?<br />
(IF 'CURRENTLY WORK', CODE 5 TO 18 IN D15a)<br />
Maintain the retirement Maintain the current<br />
Work and contribute for age and increase your retirement age and<br />
None of these A combination of all<br />
TOTAL<br />
DK<br />
longer<br />
<strong>social</strong> security accept that you will (SPONTANEOUS) three (SPONTANEOUS)<br />
contributions<br />
receive less<br />
EU25 12299 22% 32% 12% 20% 6% 8%<br />
EU27 13257 22% 32% 12% 19% 6% 9%<br />
BE 468 23% 33% 17% 20% 6% 1%<br />
CZ 635 12% 28% 19% 24% 9% 8%<br />
DK 578 23% 54% 13% 5% 2% 3%<br />
D-W 482 18% 31% 20% 22% 4% 5%<br />
DE 727 16% 33% 21% 22% 4% 4%<br />
D-E 246 7% 41% 22% 23% 5% 2%<br />
EE 544 14% 39% 11% 17% 7% 12%<br />
EL 450 6% 35% 11% 42% 6% -<br />
ES 506 26% 28% 7% 19% 6% 14%<br />
FR 532 28% 29% 11% 24% 5% 3%<br />
IE 515 22% 35% 4% 8% 17% 14%<br />
IT 529 22% 27% 6% 22% 8% 15%<br />
CY 257 12% 55% 3% 17% 6% 7%<br />
LV 565 13% 31% 13% 33% 4% 6%<br />
LT 491 19% 42% 12% 18% - 9%<br />
LU 238 19% 39% 17% 15% 3% 7%<br />
HU 435 12% 23% 13% 31% 12% 9%<br />
MT 216 21% 45% 5% 13% 8% 8%<br />
NL 574 25% 37% 20% 8% 4% 6%<br />
AT 573 16% 27% 17% 17% 15% 8%<br />
PL 425 25% 26% 10% 20% 2% 17%<br />
PT 501 17% 23% 3% 35% 9% 13%<br />
SI 462 9% 30% 15% 30% 10% 6%<br />
SK 595 14% 42% 9% 17% 5% 13%<br />
FI 565 31% 47% 9% 11% 1% 1%<br />
SE 581 21% 38% 11% 12% 7% 11%<br />
UK 628 31% 43% 9% 8% 4% 5%<br />
BG 443 21% 31% 3% 16% 13% 16%<br />
RO 482 22% 24% 7% 13% 10% 24%<br />
Sex<br />
Male 6938 23% 32% 12% 19% 6% 8%<br />
Female 5361 21% 33% 11% 20% 6% 9%<br />
Age<br />
15-24 1111 25% 33% 11% 14% 5% 12%<br />
25-39 4997 22% 31% 12% 19% 6% 10%<br />
40-54 4703 21% 34% 12% 21% 5% 7%<br />
55 + 1489 25% 31% 11% 20% 6% 7%<br />
Education (End of)<br />
15 1769 21% 30% 10% 22% 4% 13%<br />
16-19 6241 20% 32% 12% 21% 6% 9%<br />
20+ 4154 25% 34% 12% 17% 6% 6%<br />
Still Studying 0 - - - - - -<br />
Left-Right scale<br />
(1-4) Left 3521 22% 35% 13% 19% 5% 6%<br />
(5-6) Centre 4331 23% 34% 13% 18% 5% 7%<br />
(7-10) Right 2159 26% 29% 12% 20% 5% 8%<br />
Respondent occupation scale<br />
Self- employed 1876 25% 24% 12% 24% 5% 10%<br />
Managers 2241 25% 34% 14% 17% 6% 4%<br />
Other white collars 2982 24% 35% 11% 18% 5% 7%<br />
Manual workers 5201 20% 33% 12% 20% 5% 10%<br />
House persons 0 - - - - - -<br />
Unemployed 0 - - - - - -<br />
Retired 0 - - - - - -<br />
Students 0 - - - - - -<br />
Subjective urbanisation<br />
Rural village 4061 20% 32% 14% 19% 6% 9%<br />
Small/ mid size town 5253 23% 32% 12% 20% 5% 8%<br />
Large town 2967 26% 32% 10% 19% 6% 7%<br />
EU27 results are purely indicative as it is impossible to anticipate the impact of the accession of these countries on the results.
QA16c Concerning yourself, do you think that in order to find a job soon…?<br />
(IF 'NOT CURRENTLY WORK' AND 'NOT RETIRED', CODE 1 TO 3 IN D15a)<br />
DK<br />
You are not looking for a job<br />
(SPONTANEOUS)<br />
You should follow a more<br />
specialised training and you<br />
intend doing this<br />
You should follow a more<br />
specialised training but you<br />
cannot currently do this<br />
Your education and training<br />
to date is sufficient<br />
TOTAL<br />
EU25 6327 25% 20% 23% 28% 4%<br />
EU27 6855 24% 20% 23% 28% 5%<br />
BE 280 22% 17% 27% 31% 3%<br />
CZ 236 21% 15% 18% 44% 2%<br />
DK 213 21% 9% 40% 30% -<br />
D-W 273 33% 24% 22% 17% 4%<br />
DE 393 32% 23% 26% 15% 4%<br />
D-E 106 29% 20% 48% 1% 2%<br />
EE 216 19% 15% 35% 27% 4%<br />
EL 345 12% 16% 16% 56% -<br />
ES 322 27% 14% 20% 36% 3%<br />
FR 218 22% 20% 23% 32% 3%<br />
IE 367 15% 8% 17% 43% 17%<br />
IT 267 18% 21% 21% 35% 5%<br />
CY 162 16% 11% 13% 45% 15%<br />
LV 280 21% 24% 35% 16% 4%<br />
LT 268 28% 28% 24% 9% 11%<br />
LU 151 13% 10% 15% 56% 6%<br />
HU 231 16% 33% 31% 16% 4%<br />
MT 192 13% 16% 20% 42% 9%<br />
NL 250 37% 11% 17% 33% 2%<br />
AT 194 16% 20% 22% 39% 3%<br />
PL 256 21% 36% 20% 16% 7%<br />
PT 256 13% 14% 24% 38% 11%<br />
SI 250 19% 12% 27% 40% 2%<br />
SK 213 21% 14% 24% 30% 11%<br />
FI 186 28% 15% 40% 15% 2%<br />
SE 169 19% 15% 43% 14% 9%<br />
UK 341 28% 19% 24% 27% 2%<br />
BG 278 23% 25% 18% 17% 17%<br />
RO 258 16% 20% 17% 28% 19%<br />
Sex<br />
Male 2135 27% 19% 32% 18% 4%<br />
Female 4192 23% 21% 19% 33% 4%<br />
Age<br />
15-24 2624 22% 18% 38% 18% 4%<br />
25-39 1391 29% 34% 21% 14% 2%<br />
40-54 1202 29% 23% 13% 31% 4%<br />
55 + 1110 18% 8% 4% 64% 6%<br />
Education (End of)<br />
15 1280 21% 18% 8% 47% 6%<br />
16-19 1983 27% 29% 14% 26% 4%<br />
20+ 618 38% 23% 16% 19% 4%<br />
Still Studying 2341 21% 14% 42% 20% 3%<br />
Left-Right scale<br />
(1-4) Left 1666 26% 21% 29% 22% 2%<br />
(5-6) Centre 1934 26% 21% 23% 27% 3%<br />
(7-10) Right 984 25% 20% 20% 32% 3%<br />
Respondent occupation scale<br />
Self- employed 0 - - - - -<br />
Managers 0 - - - - -<br />
Other white collars 0 - - - - -<br />
Manual workers 0 - - - - -<br />
House persons 2402 22% 19% 8% 47% 4%<br />
Unemployed 1584 32% 33% 20% 10% 5%<br />
Retired 0 - - - - -<br />
Students 2341 21% 14% 42% 20% 3%<br />
Subjective urbanisation<br />
Rural village 1852 26% 19% 18% 32% 5%<br />
Small/ mid size town 2711 23% 21% 25% 28% 3%<br />
Large town 1755 24% 21% 26% 25% 4%<br />
EU27 results are purely indicative as it is impossible to anticipate the impact of the accession of these countries on the results.
QA16d According to you, which of the following possibilities aimed at guaranteeing the financing of the pension system in (OUR COUNTRY), would be most acceptable for someone working?<br />
(IF 'NOT CURRENTLY WORK', CODE 1 TO 4 IN D15a)<br />
DK<br />
A combination of all<br />
three (SPONTANEOUS)<br />
None of these<br />
(SPONTANEOUS)<br />
Maintain the current<br />
retirement age and<br />
accept that one will<br />
receive less<br />
Maintain the retirement<br />
age and increase <strong>social</strong><br />
security contributions<br />
paid by the workers<br />
Work and contribute for<br />
longer<br />
TOTAL<br />
EU25 12433 24% 30% 10% 15% 6% 15%<br />
EU27 13498 23% 30% 10% 15% 6% 16%<br />
BE 541 30% 25% 12% 21% 8% 4%<br />
CZ 515 15% 31% 16% 17% 8% 13%<br />
DK 459 36% 40% 11% 3% 3% 7%<br />
D-W 518 24% 29% 17% 18% 6% 6%<br />
DE 777 22% 31% 17% 19% 6% 5%<br />
D-E 258 11% 37% 18% 24% 6% 4%<br />
EE 456 13% 31% 7% 17% 6% 26%<br />
EL 550 5% 40% 5% 40% 7% 3%<br />
ES 494 23% 27% 6% 16% 6% 22%<br />
FR 480 38% 30% 10% 13% 4% 5%<br />
IE 485 17% 20% 5% 6% 15% 37%<br />
IT 509 22% 26% 7% 18% 8% 19%<br />
CY 247 9% 42% 1% 12% 2% 34%<br />
LV 454 14% 31% 8% 25% 3% 19%<br />
LT 534 17% 31% 11% 16% 1% 24%<br />
LU 264 22% 36% 14% 14% 4% 10%<br />
HU 565 13% 22% 10% 22% 10% 23%<br />
MT 284 22% 33% 5% 9% 6% 25%<br />
NL 446 25% 40% 12% 6% 3% 14%<br />
AT 456 18% 25% 12% 14% 17% 14%<br />
PL 575 24% 26% 9% 14% 3% 24%<br />
PT 503 12% 16% 3% 26% 9% 34%<br />
SI 557 12% 31% 16% 22% 7% 12%<br />
SK 408 12% 41% 8% 13% 6% 20%<br />
FI 463 33% 41% 5% 12% 3% 6%<br />
SE 433 22% 30% 7% 11% 7% 23%<br />
UK 687 27% 38% 8% 5% 6% 16%<br />
BG 580 18% 18% 5% 7% 8% 44%<br />
RO 518 19% 21% 8% 6% 7% 39%<br />
Sex<br />
Male 4966 26% 31% 10% 14% 6% 13%<br />
Female 7467 22% 30% 10% 16% 6% 16%<br />
Age<br />
15-24 2645 26% 31% 7% 12% 5% 19%<br />
25-39 1471 24% 32% 11% 15% 7% 11%<br />
40-54 1623 21% 30% 16% 15% 6% 12%<br />
55 + 6694 23% 30% 9% 17% 6% 15%<br />
Education (End of)<br />
15 4378 19% 31% 9% 18% 6% 17%<br />
16-19 3934 25% 31% 12% 15% 6% 11%<br />
20+ 1472 31% 27% 13% 14% 6% 9%<br />
Still Studying 2341 26% 32% 7% 11% 5% 19%<br />
Left-Right scale<br />
(1-4) Left 3127 24% 31% 14% 15% 6% 10%<br />
(5-6) Centre 4043 25% 34% 10% 14% 7% 10%<br />
(7-10) Right 2181 29% 32% 8% 15% 5% 11%<br />
Respondent occupation scale<br />
Self- employed 0 - - - - - -<br />
Managers 0 - - - - - -<br />
Other white collars 0 - - - - - -<br />
Manual workers 0 - - - - - -<br />
House persons 2402 23% 30% 11% 14% 7% 15%<br />
Unemployed 1584 24% 30% 14% 15% 6% 11%<br />
Retired 6106 23% 30% 10% 17% 6% 14%<br />
Students 2341 26% 32% 7% 11% 5% 19%<br />
Subjective urbanisation<br />
Rural village 3944 22% 28% 11% 17% 6% 16%<br />
Small/ mid size town 5374 24% 31% 10% 15% 6% 14%<br />
Large town 3101 24% 31% 9% 15% 7% 14%<br />
EU27 results are purely indicative as it is impossible to anticipate the impact of the accession of these countries on the results.
QA17 Generally speaking, do you think that the life of those who are children today will be easier, more difficult or neither easier nor more difficult than the life of those from your own generation?<br />
TOTAL Easier More difficult Neither easier nor more difficult DK<br />
EU25 24732 17% 64% 16% 3%<br />
EU27 26755 18% 62% 16% 4%<br />
BE 1009 13% 71% 15% 1%<br />
CZ 1150 15% 58% 25% 2%<br />
DK 1037 22% 56% 20% 2%<br />
D-W 1000 3% 81% 15% 1%<br />
DE 1504 3% 81% 15% 1%<br />
D-E 504 4% 81% 14% 1%<br />
EE 1000 28% 52% 15% 5%<br />
EL 1000 13% 79% 7% 1%<br />
ES 1000 27% 50% 18% 5%<br />
FR 1012 8% 76% 14% 2%<br />
IE 1000 44% 36% 16% 4%<br />
IT 1038 15% 67% 15% 3%<br />
CY 504 28% 60% 9% 3%<br />
LV 1019 44% 28% 24% 4%<br />
LT 1025 51% 19% 23% 7%<br />
LU 502 14% 71% 13% 2%<br />
HU 1000 24% 54% 18% 4%<br />
MT 500 10% 81% 7% 2%<br />
NL 1020 14% 58% 27% 1%<br />
AT 1029 16% 51% 30% 3%<br />
PL 1000 31% 46% 17% 6%<br />
PT 1004 57% 26% 14% 3%<br />
SI 1019 14% 64% 20% 2%<br />
SK 1003 29% 36% 30% 5%<br />
FI 1028 46% 29% 24% 1%<br />
SE 1014 8% 65% 23% 4%<br />
UK 1315 16% 69% 11% 4%<br />
BG 1023 22% 39% 23% 16%<br />
RO 1000 36% 32% 21% 11%<br />
Sex<br />
Male 11904 19% 61% 17% 3%<br />
Female 12828 16% 66% 15% 3%<br />
Age<br />
15-24 3755 24% 51% 21% 4%<br />
25-39 6468 16% 61% 20% 3%<br />
40-54 6326 15% 69% 14% 2%<br />
55 + 8183 16% 69% 12% 3%<br />
Education (End of)<br />
15 6147 18% 67% 12% 3%<br />
16-19 10175 15% 67% 15% 3%<br />
20+ 5626 14% 64% 19% 3%<br />
Still Studying 2341 25% 46% 25% 4%<br />
Left-Right scale<br />
(1-4) Left 6648 15% 67% 16% 2%<br />
(5-6) Centre 8373 16% 66% 16% 2%<br />
(7-10) Right 4340 18% 63% 17% 2%<br />
Respondent occupation scale<br />
Self- employed 1876 16% 62% 19% 3%<br />
Managers 2241 13% 65% 20% 2%<br />
Other white collars 2982 14% 66% 18% 2%<br />
Manual workers 5201 17% 66% 14% 3%<br />
House persons 2402 17% 66% 14% 3%<br />
Unemployed 1584 20% 63% 15% 2%<br />
Retired 6106 17% 68% 12% 3%<br />
Students 2341 25% 46% 25% 4%<br />
Subjective urbanisation<br />
Rural village 8005 18% 63% 16% 3%<br />
Small/ mid size town 10627 16% 65% 16% 3%<br />
Large town 6068 17% 63% 17% 3%<br />
EU27 results are purely indicative as it is impossible to anticipate the impact of the accession of these countries on the results.
QA18.1 I would like to ask you a question about how much trust you have in certain institutions. For each of the following institutions, please tell me if you tend to trust it or tend not to trust it.<br />
The (NATIONALITY) Government<br />
TOTAL Tend to trust Tend not to trust DK<br />
EU25 24732 31% 62% 7%<br />
EU27 26755 31% 62% 7%<br />
BE 1009 50% 47% 3%<br />
CZ 1150 19% 77% 4%<br />
DK 1037 58% 39% 3%<br />
D-W 1000 32% 66% 2%<br />
DE 1504 29% 68% 3%<br />
D-E 504 20% 77% 3%<br />
EE 1000 48% 43% 9%<br />
EL 1000 35% 65% -<br />
ES 1000 33% 55% 12%<br />
FR 1012 28% 66% 6%<br />
IE 1000 44% 47% 9%<br />
IT 1038 25% 64% 11%<br />
CY 504 53% 36% 11%<br />
LV 1019 28% 66% 6%<br />
LT 1025 22% 71% 7%<br />
LU 502 62% 30% 8%<br />
HU 1000 26% 66% 8%<br />
MT 500 39% 42% 19%<br />
NL 1020 54% 40% 6%<br />
AT 1029 46% 43% 11%<br />
PL 1000 16% 78% 6%<br />
PT 1004 32% 60% 8%<br />
SI 1019 34% 62% 4%<br />
SK 1003 39% 56% 5%<br />
FI 1028 70% 29% 1%<br />
SE 1014 48% 43% 9%<br />
UK 1315 29% 62% 9%<br />
BG 1023 26% 65% 9%<br />
RO 1000 30% 64% 6%<br />
Sex<br />
Male 11904 33% 61% 6%<br />
Female 12828 29% 64% 7%<br />
Age<br />
15-24 3755 31% 60% 9%<br />
25-39 6468 29% 64% 7%<br />
40-54 6326 29% 65% 6%<br />
55 + 8183 34% 59% 7%<br />
Education (End of)<br />
15 6147 28% 64% 8%<br />
16-19 10175 27% 67% 6%<br />
20+ 5626 39% 56% 5%<br />
Still Studying 2341 36% 55% 9%<br />
Left-Right scale<br />
(1-4) Left 6648 35% 60% 5%<br />
(5-6) Centre 8373 31% 63% 6%<br />
(7-10) Right 4340 34% 62% 4%<br />
Respondent occupation scale<br />
Self- employed 1876 31% 62% 7%<br />
Managers 2241 33% 62% 5%<br />
Other white collars 2982 32% 62% 6%<br />
Manual workers 5201 26% 67% 7%<br />
House persons 2402 33% 59% 8%<br />
Unemployed 1584 24% 70% 6%<br />
Retired 6106 33% 60% 7%<br />
Students 2341 36% 55% 9%<br />
Subjective urbanisation<br />
Rural village 8005 32% 61% 7%<br />
Small/ mid size town 10627 30% 63% 7%<br />
Large town 6068 33% 61% 6%<br />
EU27 results are purely indicative as it is impossible to anticipate the impact of the accession of these countries on the results.
QA18.2 I would like to ask you a question about how much trust you have in certain institutions. For each of the following institutions, please tell me if you tend to trust it or tend not to trust it.<br />
The (NATIONALITY PARLIAMENT)<br />
TOTAL Tend to trust Tend not to trust DK<br />
EU25 24732 31% 61% 8%<br />
EU27 26755 30% 62% 8%<br />
BE 1009 49% 48% 3%<br />
CZ 1150 15% 82% 3%<br />
DK 1037 74% 23% 3%<br />
D-W 1000 34% 63% 3%<br />
DE 1504 31% 66% 3%<br />
D-E 504 20% 78% 2%<br />
EE 1000 36% 55% 9%<br />
EL 1000 38% 62% -<br />
ES 1000 31% 54% 15%<br />
FR 1012 28% 62% 10%<br />
IE 1000 41% 47% 12%<br />
IT 1038 26% 65% 9%<br />
CY 504 47% 40% 13%<br />
LV 1019 23% 70% 7%<br />
LT 1025 15% 79% 6%<br />
LU 502 56% 32% 12%<br />
HU 1000 23% 68% 9%<br />
MT 500 38% 43% 19%<br />
NL 1020 59% 35% 6%<br />
AT 1029 48% 42% 10%<br />
PL 1000 12% 82% 6%<br />
PT 1004 31% 61% 8%<br />
SI 1019 30% 66% 4%<br />
SK 1003 33% 61% 6%<br />
FI 1028 67% 31% 2%<br />
SE 1014 54% 36% 10%<br />
UK 1315 28% 60% 12%<br />
BG 1023 15% 77% 8%<br />
RO 1000 23% 70% 7%<br />
Sex<br />
Male 11904 32% 61% 7%<br />
Female 12828 29% 62% 9%<br />
Age<br />
15-24 3755 30% 60% 10%<br />
25-39 6468 30% 62% 8%<br />
40-54 6326 29% 65% 6%<br />
55 + 8183 32% 59% 9%<br />
Education (End of)<br />
15 6147 27% 63% 10%<br />
16-19 10175 26% 66% 8%<br />
20+ 5626 41% 53% 6%<br />
Still Studying 2341 37% 54% 9%<br />
Left-Right scale<br />
(1-4) Left 6648 36% 58% 6%<br />
(5-6) Centre 8373 31% 61% 8%<br />
(7-10) Right 4340 34% 62% 4%<br />
Respondent occupation scale<br />
Self- employed 1876 31% 62% 7%<br />
Managers 2241 37% 57% 6%<br />
Other white collars 2982 31% 62% 7%<br />
Manual workers 5201 26% 66% 8%<br />
House persons 2402 32% 57% 11%<br />
Unemployed 1584 23% 70% 7%<br />
Retired 6106 31% 61% 8%<br />
Students 2341 37% 54% 9%<br />
Subjective urbanisation<br />
Rural village 8005 31% 61% 8%<br />
Small/ mid size town 10627 29% 63% 8%<br />
Large town 6068 33% 59% 8%<br />
EU27 results are purely indicative as it is impossible to anticipate the impact of the accession of these countries on the results.
QA18.3 I would like to ask you a question about how much trust you have in certain institutions. For each of the following institutions, please tell me if you tend to trust it or tend not to trust it.<br />
Political parties<br />
TOTAL Tend to trust Tend not to trust DK<br />
EU25 24732 20% 73% 7%<br />
EU27 26755 19% 73% 8%<br />
BE 1009 33% 64% 3%<br />
CZ 1150 14% 82% 4%<br />
DK 1037 53% 40% 7%<br />
D-W 1000 21% 75% 4%<br />
DE 1504 19% 78% 3%<br />
D-E 504 11% 88% 1%<br />
EE 1000 20% 67% 13%<br />
EL 1000 19% 80% 1%<br />
ES 1000 22% 64% 14%<br />
FR 1012 14% 79% 7%<br />
IE 1000 28% 59% 13%<br />
IT 1038 17% 77% 6%<br />
CY 504 24% 63% 13%<br />
LV 1019 11% 82% 7%<br />
LT 1025 9% 84% 7%<br />
LU 502 36% 50% 14%<br />
HU 1000 14% 75% 11%<br />
MT 500 23% 53% 24%<br />
NL 1020 52% 40% 8%<br />
AT 1029 31% 60% 9%<br />
PL 1000 7% 87% 6%<br />
PT 1004 15% 77% 8%<br />
SI 1019 19% 76% 5%<br />
SK 1003 15% 77% 8%<br />
FI 1028 41% 55% 4%<br />
SE 1014 29% 60% 11%<br />
UK 1315 18% 72% 10%<br />
BG 1023 10% 81% 9%<br />
RO 1000 14% 78% 8%<br />
Sex<br />
Male 11904 20% 73% 7%<br />
Female 12828 19% 73% 8%<br />
Age<br />
15-24 3755 23% 68% 9%<br />
25-39 6468 18% 75% 7%<br />
40-54 6326 18% 76% 6%<br />
55 + 8183 21% 71% 8%<br />
Education (End of)<br />
15 6147 18% 74% 8%<br />
16-19 10175 17% 77% 6%<br />
20+ 5626 23% 71% 6%<br />
Still Studying 2341 28% 62% 10%<br />
Left-Right scale<br />
(1-4) Left 6648 24% 70% 6%<br />
(5-6) Centre 8373 19% 75% 6%<br />
(7-10) Right 4340 23% 72% 5%<br />
Respondent occupation scale<br />
Self- employed 1876 19% 77% 4%<br />
Managers 2241 18% 76% 6%<br />
Other white collars 2982 19% 75% 6%<br />
Manual workers 5201 17% 76% 7%<br />
House persons 2402 21% 70% 9%<br />
Unemployed 1584 15% 78% 7%<br />
Retired 6106 21% 71% 8%<br />
Students 2341 28% 62% 10%<br />
Subjective urbanisation<br />
Rural village 8005 19% 73% 8%<br />
Small/ mid size town 10627 19% 74% 7%<br />
Large town 6068 21% 72% 7%<br />
EU27 results are purely indicative as it is impossible to anticipate the impact of the accession of these countries on the results.
QA18.4 I would like to ask you a question about how much trust you have in certain institutions. For each of the following institutions, please tell me if you tend to trust it or tend not to trust it.<br />
The council of your city\ village<br />
TOTAL Tend to trust Tend not to trust DK<br />
EU25 24732 49% 42% 9%<br />
EU27 26755 48% 42% 10%<br />
BE 1009 66% 32% 2%<br />
CZ 1150 54% 40% 6%<br />
DK 1037 60% 32% 8%<br />
D-W 1000 56% 38% 6%<br />
DE 1504 54% 40% 6%<br />
D-E 504 48% 48% 4%<br />
EE 1000 56% 30% 14%<br />
EL 1000 43% 56% 1%<br />
ES 1000 38% 51% 11%<br />
FR 1012 61% 31% 8%<br />
IE 1000 49% 36% 15%<br />
IT 1038 35% 53% 12%<br />
CY 504 50% 36% 14%<br />
LV 1019 45% 47% 8%<br />
LT 1025 35% 51% 14%<br />
LU 502 62% 29% 9%<br />
HU 1000 60% 29% 11%<br />
MT 500 56% 29% 15%<br />
NL 1020 54% 32% 14%<br />
AT 1029 59% 33% 8%<br />
PL 1000 43% 45% 12%<br />
PT 1004 51% 40% 9%<br />
SI 1019 45% 49% 6%<br />
SK 1003 49% 45% 6%<br />
FI 1028 59% 36% 5%<br />
SE 1014 45% 36% 19%<br />
UK 1315 48% 41% 11%<br />
BG 1023 33% 53% 14%<br />
RO 1000 38% 53% 9%<br />
Sex<br />
Male 11904 49% 43% 8%<br />
Female 12828 49% 40% 11%<br />
Age<br />
15-24 3755 49% 40% 11%<br />
25-39 6468 47% 43% 10%<br />
40-54 6326 48% 44% 8%<br />
55 + 8183 51% 39% 10%<br />
Education (End of)<br />
15 6147 48% 42% 10%<br />
16-19 10175 47% 44% 9%<br />
20+ 5626 53% 38% 9%<br />
Still Studying 2341 51% 38% 11%<br />
Left-Right scale<br />
(1-4) Left 6648 52% 41% 7%<br />
(5-6) Centre 8373 51% 40% 9%<br />
(7-10) Right 4340 51% 42% 7%<br />
Respondent occupation scale<br />
Self- employed 1876 47% 44% 9%<br />
Managers 2241 50% 40% 10%<br />
Other white collars 2982 49% 43% 8%<br />
Manual workers 5201 47% 44% 9%<br />
House persons 2402 47% 42% 11%<br />
Unemployed 1584 44% 49% 7%<br />
Retired 6106 51% 39% 10%<br />
Students 2341 51% 38% 11%<br />
Subjective urbanisation<br />
Rural village 8005 53% 37% 10%<br />
Small/ mid size town 10627 49% 42% 9%<br />
Large town 6068 44% 47% 9%<br />
EU27 results are purely indicative as it is impossible to anticipate the impact of the accession of these countries on the results.
QA19 Do you currently participate actively in or do voluntary work for one or more of the following organisations? (MULTIPLE ANSWERS POSSIBLE)<br />
A charity<br />
organisation or<br />
<strong>social</strong> aid<br />
organisation<br />
An organisation for<br />
the environmental<br />
protection, animal<br />
rights, etc.<br />
An international<br />
organisation such<br />
as development aid<br />
organisation or<br />
human rights<br />
A consumer<br />
organisation<br />
A business or<br />
professional<br />
organisation<br />
A trade union<br />
Education, arts,<br />
music or cultural<br />
association<br />
A sports club or<br />
club for outdoor<br />
activities<br />
(recreation<br />
organisation)<br />
TOTAL<br />
organisation<br />
EU25 24732 13% 8% 4% 2% 1% 2% 2% 5%<br />
EU27 26755 13% 7% 4% 2% 1% 2% 2% 5%<br />
BE 1009 16% 11% 2% 4% 1% 2% 2% 4%<br />
CZ 1150 15% 4% 4% 2% 0% 0% 1% 2%<br />
DK 1037 21% 14% 8% 3% 2% 6% 5% 7%<br />
D-W 1000 30% 11% 5% 4% 0% 1% 4% 9%<br />
DE 1504 28% 10% 5% 4% 0% 1% 4% 8%<br />
D-E 504 21% 7% 6% 4% 0% 0% 3% 7%<br />
EE 1000 10% 8% 3% 2% 0% 0% 1% 2%<br />
EL 1000 5% 5% 1% 1% 1% 1% 2% 2%<br />
ES 1000 5% 4% 2% 1% 0% 1% 0% 3%<br />
FR 1012 13% 11% 4% 2% 1% 1% 1% 6%<br />
IE 1000 24% 5% 3% 3% 0% 1% 1% 6%<br />
IT 1038 8% 9% 4% 3% 3% 5% 4% 4%<br />
CY 504 8% 5% 3% 1% - 1% 1% 5%<br />
LV 1019 7% 4% 3% 1% 0% 0% 1% 2%<br />
LT 1025 3% 3% 2% 0% 0% 0% 0% 1%<br />
LU 502 22% 14% 5% 4% 2% 3% 3% 10%<br />
HU 1000 6% 2% 2% 1% 1% 0% 0% 1%<br />
MT 500 9% 5% 1% 2% - 0% 2% 2%<br />
NL 1020 27% 12% 3% 2% 1% 5% 3% 6%<br />
AT 1029 21% 13% 11% 8% 4% 3% 7% 10%<br />
PL 1000 5% 3% 2% 1% 1% 1% 2% 2%<br />
PT 1004 3% 1% 1% 1% 1% 0% 0% 2%<br />
SI 1019 15% 6% 6% 1% - 0% 1% 2%<br />
SK 1003 13% 6% 6% 1% 1% 0% 2% 2%<br />
FI 1028 19% 6% 10% 3% 1% 5% 3% 8%<br />
SE 1014 25% 10% 13% 5% 3% 6% 4% 7%<br />
UK 1315 9% 6% 2% 2% 0% 1% 2% 7%<br />
BG 1023 2% 1% 3% 2% 1% 0% 0% 1%<br />
RO 1000 3% 2% 3% 2% 1% 1% 2% 2%<br />
Sex<br />
Male 11904 17% 8% 5% 3% 1% 2% 2% 5%<br />
Female 12828 10% 8% 3% 2% 1% 2% 2% 6%<br />
Age<br />
15-24 3755 20% 8% 1% 1% 1% 2% 2% 3%<br />
25-39 6468 14% 7% 3% 2% 1% 2% 2% 4%<br />
40-54 6326 15% 9% 6% 3% 1% 2% 3% 6%<br />
55 + 8183 9% 7% 3% 2% 1% 2% 2% 6%<br />
Education (End of)<br />
15 6147 7% 6% 3% 2% 1% 2% 2% 5%<br />
16-19 10175 14% 6% 4% 2% 1% 1% 2% 5%<br />
20+ 5626 16% 12% 6% 4% 1% 3% 4% 6%<br />
Still Studying 2341 24% 10% 1% 1% 1% 3% 2% 3%<br />
Left-Right scale<br />
(1-4) Left 6648 16% 10% 6% 3% 1% 2% 3% 6%<br />
(5-6) Centre 8373 15% 9% 4% 3% 1% 2% 2% 6%<br />
(7-10) Right 4340 14% 7% 3% 4% 1% 2% 2% 5%<br />
Respondent occupation scale<br />
Self- employed 1876 16% 9% 2% 8% 1% 2% 3% 4%<br />
Managers 2241 24% 12% 8% 6% 1% 2% 4% 6%<br />
Other white collars 2982 16% 8% 5% 2% 1% 2% 2% 4%<br />
Manual workers 5201 13% 6% 6% 1% 1% 1% 2% 5%<br />
House persons 2402 8% 7% 2% 1% 1% 2% 2% 7%<br />
Unemployed 1584 6% 4% 2% 0% 0% 1% 2% 4%<br />
Retired 6106 8% 7% 2% 2% 1% 1% 2% 6%<br />
Students 2341 24% 10% 1% 1% 1% 3% 2% 3%<br />
Subjective urbanisation<br />
Rural village 8005 15% 8% 4% 2% 1% 1% 2% 6%<br />
Small/ mid size town 10627 13% 7% 3% 2% 1% 2% 3% 5%<br />
Large town 6068 12% 8% 3% 3% 1% 2% 2% 5%<br />
EU27 results are purely indicative as it is impossible to anticipate the impact of the accession of these countries on the results.
QA19 Do you currently participate actively in or do voluntary work for one or more of the following organisations? (MULTIPLE ANSWERS POSSIBLE)<br />
DK<br />
None of these<br />
(SPONTANEOUS)<br />
Other interest<br />
groups for specific<br />
causes such as<br />
women, people with<br />
specific sexual<br />
orientation or local<br />
issues<br />
Organisation<br />
defending the<br />
interest of patients<br />
and\ or disabled<br />
Political party or<br />
organisation<br />
Religious or church<br />
organisation<br />
An organisation for<br />
the defence of<br />
elderly rights<br />
A leisure<br />
association for the<br />
elderly<br />
TOTAL<br />
EU25 24732 3% 1% 6% 2% 2% 2% 64% 2%<br />
EU27 26755 2% 1% 6% 2% 1% 2% 65% 2%<br />
BE 1009 4% 0% 4% 1% 2% 3% 62% 1%<br />
CZ 1150 3% - 3% 2% 1% 3% 66% 1%<br />
DK 1037 6% 2% 4% 5% 2% 4% 50% 1%<br />
D-W 1000 2% - 10% 4% 1% 3% 46% 1%<br />
DE 1504 2% 0% 9% 3% 1% 3% 47% 1%<br />
D-E 504 2% 0% 6% 2% 1% 2% 54% 1%<br />
EE 1000 3% 0% 3% 3% 2% 1% 69% 3%<br />
EL 1000 1% 0% 1% 3% 0% 1% 82% 0%<br />
ES 1000 2% 1% 2% 1% 1% 1% 81% 1%<br />
FR 1012 3% 1% 3% 2% 2% 1% 61% 3%<br />
IE 1000 2% 1% 6% 1% 2% 1% 57% 3%<br />
IT 1038 4% 1% 9% 2% 3% 1% 65% 1%<br />
CY 504 0% 1% 5% 3% 1% 1% 75% 2%<br />
LV 1019 1% 0% 4% 1% 0% 1% 72% 8%<br />
LT 1025 1% 0% 2% 1% 0% 0% 77% 12%<br />
LU 502 4% 1% 4% 3% 3% 1% 55% 0%<br />
HU 1000 1% 0% 3% 1% 1% 2% 81% 2%<br />
MT 500 1% 0% 10% 1% 1% 0% 75% 1%<br />
NL 1020 4% 1% 15% 3% 4% 5% 44% 1%<br />
AT 1029 7% 4% 9% 6% 2% 1% 39% 1%<br />
PL 1000 1% 0% 3% 1% 0% 1% 80% 4%<br />
PT 1004 0% 0% 3% 0% 0% 3% 86% 2%<br />
SI 1019 4% 1% 4% 2% 3% 1% 64% 1%<br />
SK 1003 3% 0% 7% 2% 1% 1% 66% 1%<br />
FI 1028 3% 1% 7% 4% 3% 3% 50% 0%<br />
SE 1014 6% 1% 9% 6% 3% 3% 47% 0%<br />
UK 1315 1% 1% 8% 1% 1% 2% 70% 2%<br />
BG 1023 0% 0% 1% 2% - 0% 88% 2%<br />
RO 1000 1% 2% 7% 1% 1% 1% 80% 2%<br />
Sex<br />
Male 11904 2% 1% 5% 3% 1% 2% 62% 2%<br />
Female 12828 3% 1% 7% 2% 2% 2% 66% 2%<br />
Age<br />
15-24 3755 1% 0% 4% 2% 1% 1% 64% 2%<br />
25-39 6468 1% 1% 4% 2% 1% 2% 67% 2%<br />
40-54 6326 1% 1% 6% 2% 2% 2% 61% 2%<br />
55 + 8183 5% 1% 9% 3% 2% 2% 64% 1%<br />
Education (End of)<br />
15 6147 4% 1% 7% 1% 1% 2% 71% 1%<br />
16-19 10175 2% 1% 5% 2% 1% 1% 66% 2%<br />
20+ 5626 2% 1% 8% 4% 2% 3% 56% 1%<br />
Still Studying 2341 0% 0% 5% 2% 1% 1% 57% 2%<br />
Left-Right scale<br />
(1-4) Left 6648 2% 1% 6% 4% 2% 2% 58% 1%<br />
(5-6) Centre 8373 3% 1% 7% 1% 1% 2% 63% 2%<br />
(7-10) Right 4340 3% 1% 7% 3% 2% 2% 62% 1%<br />
Respondent occupation scale<br />
Self- employed 1876 1% 0% 5% 2% 2% 2% 61% 1%<br />
Managers 2241 1% 0% 8% 4% 1% 2% 49% 2%<br />
Other white collars 2982 1% 1% 5% 3% 1% 2% 62% 2%<br />
Manual workers 5201 1% 1% 4% 1% 2% 2% 68% 2%<br />
House persons 2402 3% 1% 8% 1% 1% 3% 69% 1%<br />
Unemployed 1584 1% 0% 3% 1% 1% 2% 78% 2%<br />
Retired 6106 6% 1% 9% 2% 2% 2% 66% 2%<br />
Students 2341 0% 0% 5% 2% 1% 1% 57% 2%<br />
Subjective urbanisation<br />
Rural village 8005 3% 1% 7% 2% 1% 2% 63% 2%<br />
Small/ mid size town 10627 3% 1% 6% 2% 2% 2% 64% 2%<br />
Large town 6068 2% 0% 5% 2% 1% 2% 66% 2%<br />
EU27 results are purely indicative as it is impossible to anticipate the impact of the accession of these countries on the results.
QA20.1 For each of the following please tell me whether you think it applies to the (NATIONALITY) <strong>social</strong> welfare system? Our <strong>social</strong> welfare system…<br />
Provides wide enough coverage<br />
TOTAL Applies fairly well Applies fairly badly Neither (SPONTANEOUS) DK<br />
EU25 24732 51% 38% 5% 6%<br />
EU27 26755 49% 38% 6% 7%<br />
BE 1009 72% 24% 3% 1%<br />
CZ 1150 45% 40% 10% 5%<br />
DK 1037 66% 30% 1% 3%<br />
D-W 1000 58% 39% 2% 1%<br />
DE 1504 55% 42% 2% 1%<br />
D-E 504 43% 55% 1% 1%<br />
EE 1000 23% 53% 11% 13%<br />
EL 1000 32% 63% 5% -<br />
ES 1000 61% 25% 4% 10%<br />
FR 1012 74% 22% 2% 2%<br />
IE 1000 50% 24% 7% 19%<br />
IT 1038 36% 39% 14% 11%<br />
CY 504 20% 50% 6% 24%<br />
LV 1019 18% 71% 3% 8%<br />
LT 1025 22% 57% 9% 12%<br />
LU 502 75% 11% 7% 7%<br />
HU 1000 39% 46% 5% 10%<br />
MT 500 48% 25% 7% 20%<br />
NL 1020 59% 31% 3% 7%<br />
AT 1029 64% 19% 13% 4%<br />
PL 1000 19% 69% 6% 6%<br />
PT 1004 10% 77% 6% 7%<br />
SI 1019 49% 38% 9% 4%<br />
SK 1003 30% 53% 6% 11%<br />
FI 1028 68% 28% 3% 1%<br />
SE 1014 47% 32% 9% 12%<br />
UK 1315 64% 27% 2% 7%<br />
BG 1023 8% 48% 23% 21%<br />
RO 1000 22% 45% 7% 26%<br />
Sex<br />
Male 11904 54% 35% 5% 6%<br />
Female 12828 48% 40% 6% 6%<br />
Age<br />
15-24 3755 49% 33% 6% 12%<br />
25-39 6468 53% 37% 5% 5%<br />
40-54 6326 50% 42% 5% 3%<br />
55 + 8183 51% 37% 5% 7%<br />
Education (End of)<br />
15 6147 47% 40% 6% 7%<br />
16-19 10175 51% 40% 5% 4%<br />
20+ 5626 58% 34% 4% 4%<br />
Still Studying 2341 48% 31% 7% 14%<br />
Left-Right scale<br />
(1-4) Left 6648 55% 36% 4% 5%<br />
(5-6) Centre 8373 54% 37% 5% 4%<br />
(7-10) Right 4340 53% 38% 5% 4%<br />
Respondent occupation scale<br />
Self- employed 1876 48% 42% 6% 4%<br />
Managers 2241 58% 35% 4% 3%<br />
Other white collars 2982 54% 36% 6% 4%<br />
Manual workers 5201 51% 39% 5% 5%<br />
House persons 2402 50% 36% 6% 8%<br />
Unemployed 1584 47% 45% 4% 4%<br />
Retired 6106 50% 38% 5% 7%<br />
Students 2341 48% 31% 7% 14%<br />
Subjective urbanisation<br />
Rural village 8005 52% 38% 4% 6%<br />
Small/ mid size town 10627 51% 38% 5% 6%<br />
Large town 6068 50% 37% 7% 6%<br />
EU27 results are purely indicative as it is impossible to anticipate the impact of the accession of these countries on the results.
QA20.2 For each of the following please tell me whether you think it applies to the (NATIONALITY) <strong>social</strong> welfare system? Our <strong>social</strong> welfare system…<br />
Could serve as a model for other countries<br />
TOTAL Applies fairly well Applies fairly badly Neither (SPONTANEOUS) DK<br />
EU25 24732 42% 42% 6% 10%<br />
EU27 26755 39% 43% 7% 11%<br />
BE 1009 70% 21% 6% 3%<br />
CZ 1150 15% 68% 10% 7%<br />
DK 1037 78% 17% 1% 4%<br />
D-W 1000 42% 48% 5% 5%<br />
DE 1504 40% 51% 5% 4%<br />
D-E 504 31% 64% 3% 2%<br />
EE 1000 10% 63% 10% 17%<br />
EL 1000 8% 82% 8% 2%<br />
ES 1000 47% 26% 5% 22%<br />
FR 1012 73% 18% 2% 7%<br />
IE 1000 32% 27% 12% 29%<br />
IT 1038 28% 41% 17% 14%<br />
CY 504 11% 34% 16% 39%<br />
LV 1019 6% 81% 4% 9%<br />
LT 1025 13% 64% 8% 15%<br />
LU 502 64% 17% 7% 12%<br />
HU 1000 11% 69% 5% 15%<br />
MT 500 30% 33% 6% 31%<br />
NL 1020 63% 24% 2% 11%<br />
AT 1029 58% 13% 18% 11%<br />
PL 1000 8% 84% 4% 4%<br />
PT 1004 5% 81% 6% 8%<br />
SI 1019 23% 49% 15% 13%<br />
SK 1003 10% 73% 6% 11%<br />
FI 1028 79% 15% 4% 2%<br />
SE 1014 62% 19% 9% 10%<br />
UK 1315 53% 34% 3% 10%<br />
BG 1023 2% 27% 39% 32%<br />
RO 1000 7% 52% 11% 30%<br />
Sex<br />
Male 11904 43% 42% 6% 9%<br />
Female 12828 41% 43% 6% 10%<br />
Age<br />
15-24 3755 43% 39% 5% 13%<br />
25-39 6468 42% 43% 7% 8%<br />
40-54 6326 41% 46% 6% 7%<br />
55 + 8183 41% 40% 7% 12%<br />
Education (End of)<br />
15 6147 37% 41% 8% 14%<br />
16-19 10175 41% 45% 6% 8%<br />
20+ 5626 48% 41% 5% 6%<br />
Still Studying 2341 42% 38% 6% 14%<br />
Left-Right scale<br />
(1-4) Left 6648 47% 39% 5% 9%<br />
(5-6) Centre 8373 45% 42% 6% 7%<br />
(7-10) Right 4340 41% 46% 6% 7%<br />
Respondent occupation scale<br />
Self- employed 1876 36% 51% 6% 7%<br />
Managers 2241 45% 44% 6% 5%<br />
Other white collars 2982 42% 43% 8% 7%<br />
Manual workers 5201 43% 43% 5% 9%<br />
House persons 2402 42% 37% 8% 13%<br />
Unemployed 1584 41% 44% 5% 10%<br />
Retired 6106 40% 41% 7% 12%<br />
Students 2341 42% 38% 6% 14%<br />
Subjective urbanisation<br />
Rural village 8005 42% 41% 6% 11%<br />
Small/ mid size town 10627 42% 43% 6% 9%<br />
Large town 6068 40% 43% 7% 10%<br />
EU27 results are purely indicative as it is impossible to anticipate the impact of the accession of these countries on the results.
QA20.3 For each of the following please tell me whether you think it applies to the (NATIONALITY) <strong>social</strong> welfare system? Our <strong>social</strong> welfare system…<br />
Is too expensive for the (NATIONALITY) society<br />
TOTAL Applies fairly well Applies fairly badly Neither (SPONTANEOUS) DK<br />
EU25 24732 53% 28% 7% 12%<br />
EU27 26755 51% 28% 7% 14%<br />
BE 1009 57% 33% 7% 3%<br />
CZ 1150 60% 22% 8% 10%<br />
DK 1037 30% 63% 1% 6%<br />
D-W 1000 66% 24% 5% 5%<br />
DE 1504 65% 26% 5% 4%<br />
D-E 504 62% 32% 3% 3%<br />
EE 1000 30% 30% 11% 29%<br />
EL 1000 66% 25% 7% 2%<br />
ES 1000 36% 32% 8% 24%<br />
FR 1012 65% 25% 3% 7%<br />
IE 1000 33% 21% 16% 30%<br />
IT 1038 42% 25% 14% 19%<br />
CY 504 25% 23% 11% 41%<br />
LV 1019 57% 26% 4% 13%<br />
LT 1025 42% 26% 10% 22%<br />
LU 502 26% 51% 8% 15%<br />
HU 1000 72% 11% 4% 13%<br />
MT 500 54% 13% 7% 26%<br />
NL 1020 42% 44% 3% 11%<br />
AT 1029 33% 30% 26% 11%<br />
PL 1000 67% 18% 6% 9%<br />
PT 1004 59% 21% 6% 14%<br />
SI 1019 49% 30% 11% 10%<br />
SK 1003 52% 26% 6% 16%<br />
FI 1028 32% 57% 6% 5%<br />
SE 1014 43% 37% 7% 13%<br />
UK 1315 46% 36% 4% 14%<br />
BG 1023 24% 20% 17% 39%<br />
RO 1000 29% 23% 11% 37%<br />
Sex<br />
Male 11904 53% 29% 7% 11%<br />
Female 12828 53% 27% 7% 13%<br />
Age<br />
15-24 3755 52% 25% 6% 17%<br />
25-39 6468 54% 29% 7% 10%<br />
40-54 6326 55% 30% 7% 8%<br />
55 + 8183 51% 28% 7% 14%<br />
Education (End of)<br />
15 6147 52% 25% 7% 16%<br />
16-19 10175 55% 28% 7% 10%<br />
20+ 5626 54% 32% 7% 7%<br />
Still Studying 2341 47% 27% 7% 19%<br />
Left-Right scale<br />
(1-4) Left 6648 50% 34% 7% 9%<br />
(5-6) Centre 8373 57% 28% 6% 9%<br />
(7-10) Right 4340 58% 27% 6% 9%<br />
Respondent occupation scale<br />
Self- employed 1876 55% 27% 8% 10%<br />
Managers 2241 56% 32% 7% 5%<br />
Other white collars 2982 55% 28% 8% 9%<br />
Manual workers 5201 55% 29% 6% 10%<br />
House persons 2402 50% 28% 7% 15%<br />
Unemployed 1584 53% 29% 7% 11%<br />
Retired 6106 52% 27% 7% 14%<br />
Students 2341 47% 27% 7% 19%<br />
Subjective urbanisation<br />
Rural village 8005 54% 28% 6% 12%<br />
Small/ mid size town 10627 53% 28% 7% 12%<br />
Large town 6068 51% 29% 8% 12%<br />
EU27 results are purely indicative as it is impossible to anticipate the impact of the accession of these countries on the results.
QA21 How safe do you feel walking alone in the area where you live after dark? Do you feel…?<br />
TOTAL Very safe Fairly safe A bit unsafe Very unsafe DK Safe Unsafe<br />
EU25 24732 28% 42% 20% 9% 1% 70% 29%<br />
EU27 26755 28% 42% 20% 9% 1% 70% 29%<br />
BE 1009 33% 43% 17% 7% - 76% 24%<br />
CZ 1150 17% 45% 32% 6% - 62% 38%<br />
DK 1037 60% 25% 13% 2% - 85% 15%<br />
D-W 1000 32% 44% 18% 6% - 76% 24%<br />
DE 1504 30% 43% 20% 7% - 73% 27%<br />
D-E 504 24% 40% 25% 11% - 64% 36%<br />
EE 1000 23% 42% 22% 10% 3% 65% 32%<br />
EL 1000 31% 28% 19% 21% 1% 59% 40%<br />
ES 1000 24% 44% 22% 9% 1% 68% 31%<br />
FR 1012 41% 38% 14% 6% 1% 79% 20%<br />
IE 1000 27% 41% 18% 13% 1% 68% 31%<br />
IT 1038 19% 45% 23% 13% - 64% 36%<br />
CY 504 36% 36% 18% 10% - 72% 28%<br />
LV 1019 23% 40% 23% 13% 1% 63% 36%<br />
LT 1025 13% 32% 31% 23% 1% 45% 54%<br />
LU 502 44% 32% 16% 7% 1% 76% 23%<br />
HU 1000 31% 38% 22% 9% - 69% 31%<br />
MT 500 44% 28% 15% 12% 1% 72% 27%<br />
NL 1020 46% 42% 9% 2% 1% 88% 11%<br />
AT 1029 25% 49% 20% 4% 2% 74% 24%<br />
PL 1000 21% 44% 23% 9% 3% 65% 32%<br />
PT 1004 17% 54% 20% 8% 1% 71% 28%<br />
SI 1019 43% 45% 11% 1% - 88% 12%<br />
SK 1003 10% 50% 30% 10% - 60% 40%<br />
FI 1028 52% 37% 10% 1% - 89% 11%<br />
SE 1014 51% 32% 11% 5% 1% 83% 16%<br />
UK 1315 25% 40% 20% 14% 1% 65% 34%<br />
BG 1023 16% 30% 30% 22% 2% 46% 52%<br />
RO 1000 24% 45% 21% 10% - 69% 31%<br />
Sex<br />
Male 11904 38% 43% 13% 5% 1% 81% 18%<br />
Female 12828 19% 41% 26% 13% 1% 60% 39%<br />
Age<br />
15-24 3755 30% 43% 19% 8% - 73% 27%<br />
25-39 6468 31% 43% 18% 7% 1% 74% 25%<br />
40-54 6326 32% 42% 18% 8% - 74% 26%<br />
55 + 8183 23% 40% 23% 13% 1% 63% 36%<br />
Education (End of)<br />
15 6147 22% 40% 23% 14% 1% 62% 37%<br />
16-19 10175 28% 42% 20% 9% 1% 70% 29%<br />
20+ 5626 37% 42% 15% 5% 1% 79% 20%<br />
Still Studying 2341 30% 44% 18% 7% 1% 74% 25%<br />
Left-Right scale<br />
(1-4) Left 6648 32% 42% 17% 8% 1% 74% 25%<br />
(5-6) Centre 8373 27% 43% 21% 8% 1% 70% 29%<br />
(7-10) Right 4340 33% 38% 20% 8% 1% 71% 28%<br />
Respondent occupation scale<br />
Self- employed 1876 37% 43% 13% 6% 1% 80% 19%<br />
Managers 2241 40% 41% 15% 3% 1% 81% 18%<br />
Other white collars 2982 27% 46% 20% 7% - 73% 27%<br />
Manual workers 5201 32% 43% 17% 7% 1% 75% 24%<br />
House persons 2402 21% 38% 26% 14% 1% 59% 40%<br />
Unemployed 1584 29% 42% 20% 9% - 71% 29%<br />
Retired 6106 21% 39% 24% 14% 2% 60% 38%<br />
Students 2341 30% 44% 18% 7% 1% 74% 25%<br />
Subjective urbanisation<br />
Rural village 8005 39% 41% 14% 5% 1% 80% 19%<br />
Small/ mid size town 10627 24% 43% 22% 10% 1% 67% 32%<br />
Large town 6068 22% 40% 23% 14% 1% 62% 37%<br />
EU27 results are purely indicative as it is impossible to anticipate the impact of the accession of these countries on the results.
QA22.1 To what extent do you agree or disagree with the following statements?<br />
I feel left out of society<br />
Neither agree nor<br />
TOTAL Strongly agree Agree<br />
Disagree Strongly disagree DK Agree Disagree<br />
disagree<br />
EU25 24732 2% 7% 11% 33% 46% 1% 9% 79%<br />
EU27 26755 3% 7% 11% 33% 45% 1% 10% 78%<br />
BE 1009 2% 9% 7% 38% 44% - 11% 82%<br />
CZ 1150 2% 7% 9% 34% 48% - 9% 82%<br />
DK 1037 1% 3% 5% 33% 57% 1% 4% 90%<br />
D-W 1000 3% 4% 7% 17% 69% - 7% 86%<br />
DE 1504 3% 5% 7% 18% 67% - 8% 85%<br />
D-E 504 4% 8% 10% 22% 56% - 12% 78%<br />
EE 1000 1% 6% 12% 41% 39% 1% 7% 80%<br />
EL 1000 2% 4% 7% 26% 61% - 6% 87%<br />
ES 1000 1% 4% 7% 32% 55% 1% 5% 87%<br />
FR 1012 3% 6% 9% 33% 49% - 9% 82%<br />
IE 1000 1% 5% 9% 40% 43% 2% 6% 83%<br />
IT 1038 6% 15% 19% 35% 25% - 21% 60%<br />
CY 504 2% 3% 4% 20% 70% 1% 5% 90%<br />
LV 1019 2% 7% 11% 26% 53% 1% 9% 79%<br />
LT 1025 5% 14% 26% 42% 11% 2% 19% 53%<br />
LU 502 2% 3% 4% 28% 61% 2% 5% 89%<br />
HU 1000 6% 12% 20% 36% 25% 1% 18% 61%<br />
MT 500 1% 2% 4% 47% 45% 1% 3% 92%<br />
NL 1020 1% 3% 5% 33% 58% - 4% 91%<br />
AT 1029 4% 9% 15% 23% 48% 1% 13% 71%<br />
PL 1000 1% 4% 11% 49% 32% 3% 5% 81%<br />
PT 1004 2% 4% 9% 39% 45% 1% 6% 84%<br />
SI 1019 - 2% 5% 36% 57% - 2% 93%<br />
SK 1003 2% 5% 13% 42% 37% 1% 7% 79%<br />
FI 1028 1% 5% 10% 42% 42% - 6% 84%<br />
SE 1014 1% 5% 7% 9% 78% - 6% 87%<br />
UK 1315 2% 9% 12% 42% 33% 2% 11% 75%<br />
BG 1023 6% 15% 22% 35% 20% 2% 21% 55%<br />
RO 1000 4% 11% 19% 37% 24% 5% 15% 61%<br />
Sex<br />
Male 11904 3% 7% 10% 33% 46% 1% 10% 79%<br />
Female 12828 3% 8% 11% 32% 45% 1% 11% 77%<br />
Age<br />
15-24 3755 3% 6% 10% 34% 46% 1% 9% 80%<br />
25-39 6468 2% 7% 11% 34% 45% 1% 9% 79%<br />
40-54 6326 3% 8% 10% 32% 46% 1% 11% 78%<br />
55 + 8183 2% 7% 12% 32% 46% 1% 9% 78%<br />
Education (End of)<br />
15 6147 3% 10% 12% 34% 40% 1% 13% 74%<br />
16-19 10175 2% 8% 11% 33% 45% 1% 10% 78%<br />
20+ 5626 2% 4% 8% 31% 54% 1% 6% 85%<br />
Still Studying 2341 2% 4% 11% 31% 50% 2% 6% 81%<br />
Left-Right scale<br />
(1-4) Left 6648 3% 7% 9% 30% 50% 1% 10% 80%<br />
(5-6) Centre 8373 2% 7% 10% 34% 46% 1% 9% 80%<br />
(7-10) Right 4340 3% 7% 10% 33% 47% - 10% 80%<br />
Respondent occupation scale<br />
Self- employed 1876 2% 6% 9% 29% 53% 1% 8% 82%<br />
Managers 2241 1% 3% 6% 29% 61% - 4% 90%<br />
Other white collars 2982 3% 5% 9% 35% 47% 1% 8% 82%<br />
Manual workers 5201 2% 7% 10% 36% 44% 1% 9% 80%<br />
House persons 2402 4% 9% 12% 30% 44% 1% 13% 74%<br />
Unemployed 1584 8% 14% 16% 35% 27% - 22% 62%<br />
Retired 6106 2% 8% 13% 32% 44% 1% 10% 76%<br />
Students 2341 2% 4% 11% 31% 50% 2% 6% 81%<br />
Subjective urbanisation<br />
Rural village 8005 2% 6% 10% 32% 49% 1% 8% 81%<br />
Small/ mid size town 10627 3% 7% 11% 35% 43% 1% 10% 78%<br />
Large town 6068 3% 8% 11% 30% 47% 1% 11% 77%<br />
EU27 results are purely indicative as it is impossible to anticipate the impact of the accession of these countries on the results.
QA22.2 To what extent do you agree or disagree with the following statements?<br />
Some people look down on me because of my income or job situation<br />
Neither agree nor<br />
TOTAL Strongly agree Agree<br />
Disagree Strongly disagree DK Agree Disagree<br />
disagree<br />
EU25 24732 4% 11% 11% 30% 42% 2% 15% 72%<br />
EU27 26755 4% 11% 12% 30% 41% 2% 15% 71%<br />
BE 1009 3% 14% 10% 36% 35% 2% 17% 71%<br />
CZ 1150 2% 10% 12% 34% 41% 1% 12% 75%<br />
DK 1037 2% 7% 6% 30% 53% 2% 9% 83%<br />
D-W 1000 2% 7% 10% 16% 63% 2% 9% 79%<br />
DE 1504 2% 8% 10% 17% 61% 2% 10% 78%<br />
D-E 504 2% 13% 12% 21% 51% 1% 15% 72%<br />
EE 1000 3% 14% 15% 35% 29% 4% 17% 64%<br />
EL 1000 1% 5% 4% 25% 65% - 6% 90%<br />
ES 1000 2% 5% 6% 29% 56% 2% 7% 85%<br />
FR 1012 4% 12% 8% 27% 48% 1% 16% 75%<br />
IE 1000 3% 6% 6% 35% 46% 4% 9% 81%<br />
IT 1038 8% 16% 20% 34% 20% 2% 24% 54%<br />
CY 504 - 2% 3% 20% 74% 1% 2% 94%<br />
LV 1019 8% 27% 15% 20% 28% 2% 35% 48%<br />
LT 1025 2% 15% 19% 42% 17% 5% 17% 59%<br />
LU 502 1% 8% 5% 25% 58% 3% 9% 83%<br />
HU 1000 5% 9% 12% 33% 34% 7% 14% 67%<br />
MT 500 1% 4% 3% 45% 45% 2% 5% 90%<br />
NL 1020 2% 6% 7% 33% 48% 4% 8% 81%<br />
AT 1029 5% 14% 18% 22% 38% 3% 19% 60%<br />
PL 1000 2% 14% 15% 45% 21% 3% 16% 66%<br />
PT 1004 2% 7% 10% 36% 43% 2% 9% 79%<br />
SI 1019 1% 8% 8% 32% 50% 1% 9% 82%<br />
SK 1003 2% 10% 13% 40% 32% 3% 12% 72%<br />
FI 1028 1% 11% 13% 39% 34% 2% 12% 73%<br />
SE 1014 2% 7% 3% 7% 78% 3% 9% 85%<br />
UK 1315 4% 13% 12% 36% 32% 3% 17% 68%<br />
BG 1023 4% 12% 13% 41% 25% 5% 16% 66%<br />
RO 1000 5% 18% 16% 35% 21% 5% 23% 56%<br />
Sex<br />
Male 11904 3% 11% 12% 29% 42% 3% 14% 71%<br />
Female 12828 3% 11% 11% 31% 42% 2% 14% 73%<br />
Age<br />
15-24 3755 5% 12% 11% 28% 40% 4% 17% 68%<br />
25-39 6468 4% 13% 12% 30% 40% 1% 17% 70%<br />
40-54 6326 4% 12% 11% 30% 41% 2% 16% 71%<br />
55 + 8183 2% 8% 11% 31% 46% 2% 10% 77%<br />
Education (End of)<br />
15 6147 4% 10% 11% 31% 41% 3% 14% 72%<br />
16-19 10175 4% 11% 13% 31% 40% 1% 15% 71%<br />
20+ 5626 3% 10% 10% 28% 47% 2% 13% 75%<br />
Still Studying 2341 3% 10% 11% 27% 43% 6% 13% 70%<br />
Left-Right scale<br />
(1-4) Left 6648 3% 11% 10% 28% 46% 2% 14% 74%<br />
(5-6) Centre 8373 3% 11% 11% 30% 43% 2% 14% 73%<br />
(7-10) Right 4340 4% 11% 12% 30% 42% 1% 15% 72%<br />
Respondent occupation scale<br />
Self- employed 1876 4% 12% 12% 27% 43% 2% 16% 70%<br />
Managers 2241 2% 8% 10% 27% 52% 1% 10% 79%<br />
Other white collars 2982 3% 10% 11% 33% 42% 1% 13% 75%<br />
Manual workers 5201 4% 13% 12% 31% 39% 1% 17% 70%<br />
House persons 2402 4% 10% 11% 32% 42% 1% 14% 74%<br />
Unemployed 1584 9% 19% 10% 30% 30% 2% 28% 60%<br />
Retired 6106 2% 8% 12% 31% 44% 3% 10% 75%<br />
Students 2341 3% 10% 11% 27% 43% 6% 13% 70%<br />
Subjective urbanisation<br />
Rural village 8005 2% 10% 11% 29% 46% 2% 12% 75%<br />
Small/ mid size town 10627 4% 11% 12% 32% 39% 2% 15% 71%<br />
Large town 6068 4% 11% 12% 28% 43% 2% 15% 71%<br />
EU27 results are purely indicative as it is impossible to anticipate the impact of the accession of these countries on the results.
QA22.3 To what extent do you agree or disagree with the following statements?<br />
I feel that there is a risk that I could fall into poverty<br />
Neither agree nor<br />
TOTAL Strongly agree Agree<br />
Disagree Strongly disagree DK Agree Disagree<br />
disagree<br />
EU25 24732 7% 18% 19% 32% 22% 2% 25% 54%<br />
EU27 26755 7% 18% 20% 31% 21% 3% 25% 52%<br />
BE 1009 3% 12% 14% 40% 31% - 15% 71%<br />
CZ 1150 2% 10% 23% 41% 21% 3% 12% 62%<br />
DK 1037 3% 10% 10% 46% 30% 1% 13% 76%<br />
D-W 1000 7% 14% 16% 32% 30% 1% 21% 62%<br />
DE 1504 8% 15% 16% 32% 28% 1% 23% 60%<br />
D-E 504 12% 22% 15% 30% 21% - 34% 51%<br />
EE 1000 3% 17% 14% 40% 24% 2% 20% 64%<br />
EL 1000 7% 15% 23% 25% 30% - 22% 55%<br />
ES 1000 5% 16% 16% 28% 29% 6% 21% 57%<br />
FR 1012 8% 20% 13% 32% 26% 1% 28% 58%<br />
IE 1000 6% 10% 10% 35% 32% 7% 16% 67%<br />
IT 1038 10% 26% 34% 20% 7% 3% 36% 27%<br />
CY 504 3% 8% 19% 27% 34% 9% 11% 61%<br />
LV 1019 10% 35% 18% 21% 15% 1% 45% 36%<br />
LT 1025 6% 24% 30% 30% 7% 3% 30% 37%<br />
LU 502 2% 5% 5% 27% 59% 2% 7% 86%<br />
HU 1000 19% 26% 24% 23% 8% - 45% 31%<br />
MT 500 - 6% 14% 38% 38% 4% 6% 76%<br />
NL 1020 4% 8% 13% 43% 31% 1% 12% 74%<br />
AT 1029 7% 18% 25% 25% 21% 4% 25% 46%<br />
PL 1000 5% 22% 24% 38% 8% 3% 27% 46%<br />
PT 1004 4% 15% 27% 25% 23% 6% 19% 48%<br />
SI 1019 2% 17% 14% 33% 34% - 19% 67%<br />
SK 1003 6% 22% 33% 26% 12% 1% 28% 38%<br />
FI 1028 2% 8% 13% 47% 30% - 10% 77%<br />
SE 1014 3% 9% 10% 16% 58% 4% 12% 74%<br />
UK 1315 6% 19% 14% 41% 18% 2% 25% 59%<br />
BG 1023 12% 21% 21% 28% 12% 6% 33% 40%<br />
RO 1000 8% 16% 23% 31% 16% 6% 24% 47%<br />
Sex<br />
Male 11904 6% 18% 19% 32% 23% 2% 24% 55%<br />
Female 12828 7% 19% 19% 32% 21% 2% 26% 53%<br />
Age<br />
15-24 3755 5% 16% 22% 32% 21% 4% 21% 53%<br />
25-39 6468 7% 18% 20% 33% 20% 2% 25% 53%<br />
40-54 6326 9% 21% 17% 31% 20% 2% 30% 51%<br />
55 + 8183 6% 17% 19% 31% 25% 2% 23% 56%<br />
Education (End of)<br />
15 6147 9% 21% 20% 27% 20% 3% 30% 47%<br />
16-19 10175 7% 20% 19% 33% 19% 2% 27% 52%<br />
20+ 5626 4% 14% 17% 35% 29% 1% 18% 64%<br />
Still Studying 2341 4% 14% 24% 31% 23% 4% 18% 54%<br />
Left-Right scale<br />
(1-4) Left 6648 7% 19% 17% 32% 23% 2% 26% 55%<br />
(5-6) Centre 8373 6% 17% 18% 33% 24% 2% 23% 57%<br />
(7-10) Right 4340 6% 16% 19% 33% 24% 2% 22% 57%<br />
Respondent occupation scale<br />
Self- employed 1876 6% 17% 20% 29% 26% 2% 23% 55%<br />
Managers 2241 3% 11% 18% 37% 30% 1% 14% 67%<br />
Other white collars 2982 5% 16% 21% 34% 22% 2% 21% 56%<br />
Manual workers 5201 7% 21% 19% 33% 18% 2% 28% 51%<br />
House persons 2402 8% 20% 18% 30% 21% 3% 28% 51%<br />
Unemployed 1584 16% 28% 17% 25% 12% 2% 44% 37%<br />
Retired 6106 7% 18% 19% 31% 23% 2% 25% 54%<br />
Students 2341 4% 14% 24% 31% 23% 4% 18% 54%<br />
Subjective urbanisation<br />
Rural village 8005 7% 17% 17% 33% 24% 2% 24% 57%<br />
Small/ mid size town 10627 7% 18% 21% 31% 20% 3% 25% 51%<br />
Large town 6068 7% 20% 19% 29% 23% 2% 27% 52%<br />
EU27 results are purely indicative as it is impossible to anticipate the impact of the accession of these countries on the results.
QA23 Which of these statements comes closest to your view?<br />
Anyone is at risk of poverty at some The risk of poverty is confined to None of these two statements<br />
TOTAL<br />
DK<br />
time in their lives<br />
certain groups of people<br />
(SPONTANEOUS)<br />
EU25 24732 62% 29% 6% 3%<br />
EU27 26755 62% 29% 6% 3%<br />
BE 1009 69% 27% 4% -<br />
CZ 1150 45% 41% 11% 3%<br />
DK 1037 61% 33% 4% 2%<br />
D-W 1000 64% 30% 4% 2%<br />
DE 1504 64% 30% 4% 2%<br />
D-E 504 66% 30% 3% 1%<br />
EE 1000 57% 32% 8% 3%<br />
EL 1000 50% 42% 7% 1%<br />
ES 1000 59% 22% 9% 10%<br />
FR 1012 86% 11% 2% 1%<br />
IE 1000 56% 28% 8% 8%<br />
IT 1038 55% 33% 9% 3%<br />
CY 504 48% 43% 6% 3%<br />
LV 1019 74% 21% 3% 2%<br />
LT 1025 47% 43% 5% 5%<br />
LU 502 74% 22% 3% 1%<br />
HU 1000 74% 19% 6% 1%<br />
MT 500 41% 45% 9% 5%<br />
NL 1020 50% 43% 5% 2%<br />
AT 1029 51% 32% 12% 5%<br />
PL 1000 54% 37% 3% 6%<br />
PT 1004 73% 17% 5% 5%<br />
SI 1019 69% 21% 9% 1%<br />
SK 1003 55% 35% 9% 1%<br />
FI 1028 47% 48% 4% 1%<br />
SE 1014 43% 47% 7% 3%<br />
UK 1315 65% 28% 3% 4%<br />
BG 1023 51% 38% 7% 4%<br />
RO 1000 54% 28% 11% 7%<br />
Sex<br />
Male 11904 60% 31% 6% 3%<br />
Female 12828 64% 27% 5% 4%<br />
Age<br />
15-24 3755 63% 29% 5% 3%<br />
25-39 6468 65% 26% 6% 3%<br />
40-54 6326 65% 27% 5% 3%<br />
55 + 8183 57% 33% 6% 4%<br />
Education (End of)<br />
15 6147 59% 31% 5% 5%<br />
16-19 10175 64% 28% 5% 3%<br />
20+ 5626 63% 30% 5% 2%<br />
Still Studying 2341 62% 29% 5% 4%<br />
Left-Right scale<br />
(1-4) Left 6648 64% 29% 5% 2%<br />
(5-6) Centre 8373 64% 28% 5% 3%<br />
(7-10) Right 4340 58% 34% 5% 3%<br />
Respondent occupation scale<br />
Self- employed 1876 59% 30% 7% 4%<br />
Managers 2241 65% 29% 4% 2%<br />
Other white collars 2982 63% 28% 7% 2%<br />
Manual workers 5201 68% 24% 5% 3%<br />
House persons 2402 63% 26% 7% 4%<br />
Unemployed 1584 66% 28% 4% 2%<br />
Retired 6106 56% 35% 5% 4%<br />
Students 2341 62% 29% 5% 4%<br />
Subjective urbanisation<br />
Rural village 8005 62% 28% 6% 4%<br />
Small/ mid size town 10627 63% 29% 5% 3%<br />
Large town 6068 60% 31% 6% 3%<br />
EU27 results are purely indicative as it is impossible to anticipate the impact of the accession of these countries on the results.
QA24 Do you personally have the feeling that you belong in (OUR COUNTRY) to one of the majority groups or one of minority group in terms of race, religion or culture?<br />
I do not feel I belong to any group<br />
TOTAL Majority group Minority group<br />
DK<br />
(SPONTANEOUS)<br />
EU25 24732 64% 11% 21% 4%<br />
EU27 26755 64% 11% 21% 4%<br />
BE 1009 62% 11% 26% 1%<br />
CZ 1150 74% 7% 18% 1%<br />
DK 1037 65% 4% 29% 2%<br />
D-W 1000 76% 12% 11% 1%<br />
DE 1504 78% 11% 10% 1%<br />
D-E 504 85% 8% 6% 1%<br />
EE 1000 30% 11% 55% 4%<br />
EL 1000 73% 5% 21% 1%<br />
ES 1000 54% 7% 32% 7%<br />
FR 1012 48% 14% 34% 4%<br />
IE 1000 61% 8% 27% 4%<br />
IT 1038 55% 10% 29% 6%<br />
CY 504 79% 2% 18% 1%<br />
LV 1019 44% 11% 38% 7%<br />
LT 1025 80% 7% 6% 7%<br />
LU 502 67% 13% 15% 5%<br />
HU 1000 25% 8% 64% 3%<br />
MT 500 78% 4% 11% 7%<br />
NL 1020 78% 10% 10% 2%<br />
AT 1029 46% 10% 41% 3%<br />
PL 1000 85% 7% 6% 2%<br />
PT 1004 44% 8% 41% 7%<br />
SI 1019 61% 6% 32% 1%<br />
SK 1003 54% 8% 37% 1%<br />
FI 1028 79% 8% 13% -<br />
SE 1014 79% 4% 12% 5%<br />
UK 1315 67% 21% 8% 4%<br />
BG 1023 62% 14% 20% 4%<br />
RO 1000 69% 6% 17% 8%<br />
Sex<br />
Male 11904 64% 11% 21% 4%<br />
Female 12828 64% 11% 21% 4%<br />
Age<br />
15-24 3755 64% 12% 20% 4%<br />
25-39 6468 62% 13% 22% 3%<br />
40-54 6326 66% 12% 20% 2%<br />
55 + 8183 64% 9% 22% 5%<br />
Education (End of)<br />
15 6147 59% 12% 23% 6%<br />
16-19 10175 65% 11% 21% 3%<br />
20+ 5626 68% 10% 20% 2%<br />
Still Studying 2341 65% 11% 20% 4%<br />
Left-Right scale<br />
(1-4) Left 6648 65% 11% 21% 3%<br />
(5-6) Centre 8373 66% 12% 19% 3%<br />
(7-10) Right 4340 70% 10% 18% 2%<br />
Respondent occupation scale<br />
Self- employed 1876 63% 12% 23% 2%<br />
Managers 2241 72% 8% 17% 3%<br />
Other white collars 2982 65% 9% 23% 3%<br />
Manual workers 5201 64% 12% 21% 3%<br />
House persons 2402 60% 13% 23% 4%<br />
Unemployed 1584 60% 18% 18% 4%<br />
Retired 6106 63% 10% 22% 5%<br />
Students 2341 65% 11% 20% 4%<br />
Subjective urbanisation<br />
Rural village 8005 65% 9% 22% 4%<br />
Small/ mid size town 10627 64% 11% 22% 3%<br />
Large town 6068 63% 14% 20% 3%<br />
EU27 results are purely indicative as it is impossible to anticipate the impact of the accession of these countries on the results.
QA25.1 For each of the following statements, please tell me whether you tend to agree or tend to disagree.<br />
People from other ethnic groups are enriching the cultural life of (OUR COUNTRY)<br />
TOTAL Tend to agree Tend to disagree It depends (SPONTANEOUS) DK<br />
EU25 24732 54% 30% 11% 5%<br />
EU27 26755 53% 30% 12% 5%<br />
BE 1009 52% 36% 11% 1%<br />
CZ 1150 38% 43% 16% 3%<br />
DK 1037 68% 24% 6% 2%<br />
D-W 1000 69% 21% 8% 2%<br />
DE 1504 68% 23% 7% 2%<br />
D-E 504 64% 30% 5% 1%<br />
EE 1000 57% 23% 14% 6%<br />
EL 1000 31% 57% 12% -<br />
ES 1000 43% 31% 15% 11%<br />
FR 1012 66% 23% 7% 4%<br />
IE 1000 48% 25% 18% 9%<br />
IT 1038 35% 41% 20% 4%<br />
CY 504 29% 56% 10% 5%<br />
LV 1019 59% 29% 6% 6%<br />
LT 1025 52% 33% 3% 12%<br />
LU 502 51% 25% 18% 6%<br />
HU 1000 41% 36% 17% 6%<br />
MT 500 16% 67% 8% 9%<br />
NL 1020 67% 23% 8% 2%<br />
AT 1029 37% 35% 24% 4%<br />
PL 1000 58% 26% 8% 8%<br />
PT 1004 46% 31% 15% 8%<br />
SI 1019 46% 42% 8% 4%<br />
SK 1003 50% 39% 6% 5%<br />
FI 1028 75% 19% 5% 1%<br />
SE 1014 77% 11% 7% 5%<br />
UK 1315 54% 33% 8% 5%<br />
BG 1023 30% 36% 22% 12%<br />
RO 1000 47% 22% 14% 17%<br />
Sex<br />
Male 11904 54% 30% 12% 4%<br />
Female 12828 54% 30% 10% 6%<br />
Age<br />
15-24 3755 61% 25% 9% 5%<br />
25-39 6468 58% 27% 12% 3%<br />
40-54 6326 58% 29% 10% 3%<br />
55 + 8183 44% 36% 13% 7%<br />
Education (End of)<br />
15 6147 38% 41% 13% 8%<br />
16-19 10175 52% 32% 12% 4%<br />
20+ 5626 70% 19% 9% 2%<br />
Still Studying 2341 66% 22% 9% 3%<br />
Left-Right scale<br />
(1-4) Left 6648 64% 23% 10% 3%<br />
(5-6) Centre 8373 56% 29% 11% 4%<br />
(7-10) Right 4340 47% 40% 10% 3%<br />
Respondent occupation scale<br />
Self- employed 1876 52% 31% 13% 4%<br />
Managers 2241 69% 20% 9% 2%<br />
Other white collars 2982 59% 27% 12% 2%<br />
Manual workers 5201 54% 31% 11% 4%<br />
House persons 2402 47% 33% 12% 8%<br />
Unemployed 1584 56% 30% 10% 4%<br />
Retired 6106 44% 36% 12% 8%<br />
Students 2341 66% 22% 9% 3%<br />
Subjective urbanisation<br />
Rural village 8005 51% 33% 11% 5%<br />
Small/ mid size town 10627 54% 30% 11% 5%<br />
Large town 6068 58% 26% 12% 4%<br />
EU27 results are purely indicative as it is impossible to anticipate the impact of the accession of these countries on the results.
QA25.2 For each of the following statements, please tell me whether you tend to agree or tend to disagree.<br />
The presence of people from other ethnic groups is a cause of insecurity<br />
TOTAL Tend to agree Tend to disagree It depends (SPONTANEOUS) DK<br />
EU25 24732 42% 41% 13% 4%<br />
EU27 26755 42% 41% 13% 4%<br />
BE 1009 40% 43% 17% -<br />
CZ 1150 51% 29% 17% 3%<br />
DK 1037 47% 45% 7% 1%<br />
D-W 1000 39% 50% 10% 1%<br />
DE 1504 40% 50% 9% 1%<br />
D-E 504 45% 48% 7% -<br />
EE 1000 26% 48% 20% 6%<br />
EL 1000 63% 27% 10% -<br />
ES 1000 47% 25% 20% 8%<br />
FR 1012 33% 53% 11% 3%<br />
IE 1000 41% 33% 17% 9%<br />
IT 1038 50% 28% 19% 3%<br />
CY 504 68% 22% 8% 2%<br />
LV 1019 30% 56% 8% 6%<br />
LT 1025 33% 51% 3% 13%<br />
LU 502 30% 43% 22% 5%<br />
HU 1000 38% 38% 17% 7%<br />
MT 500 60% 22% 7% 11%<br />
NL 1020 38% 49% 11% 2%<br />
AT 1029 45% 25% 25% 5%<br />
PL 1000 26% 60% 7% 7%<br />
PT 1004 45% 37% 13% 5%<br />
SI 1019 36% 49% 11% 4%<br />
SK 1003 43% 49% 4% 4%<br />
FI 1028 35% 58% 7% -<br />
SE 1014 44% 36% 15% 5%<br />
UK 1315 53% 34% 8% 5%<br />
BG 1023 37% 34% 19% 10%<br />
RO 1000 27% 42% 15% 16%<br />
Sex<br />
Male 11904 43% 41% 13% 3%<br />
Female 12828 42% 41% 12% 5%<br />
Age<br />
15-24 3755 38% 46% 12% 4%<br />
25-39 6468 40% 44% 14% 2%<br />
40-54 6326 41% 43% 13% 3%<br />
55 + 8183 48% 34% 12% 6%<br />
Education (End of)<br />
15 6147 50% 31% 12% 7%<br />
16-19 10175 44% 40% 13% 3%<br />
20+ 5626 34% 52% 13% 1%<br />
Still Studying 2341 35% 49% 12% 4%<br />
Left-Right scale<br />
(1-4) Left 6648 37% 49% 12% 2%<br />
(5-6) Centre 8373 43% 42% 12% 3%<br />
(7-10) Right 4340 52% 34% 11% 3%<br />
Respondent occupation scale<br />
Self- employed 1876 39% 43% 15% 3%<br />
Managers 2241 33% 53% 12% 2%<br />
Other white collars 2982 40% 42% 16% 2%<br />
Manual workers 5201 42% 42% 13% 3%<br />
House persons 2402 47% 34% 13% 6%<br />
Unemployed 1584 46% 40% 10% 4%<br />
Retired 6106 49% 34% 11% 6%<br />
Students 2341 35% 49% 12% 4%<br />
Subjective urbanisation<br />
Rural village 8005 44% 39% 12% 5%<br />
Small/ mid size town 10627 43% 41% 12% 4%<br />
Large town 6068 40% 44% 13% 3%<br />
EU27 results are purely indicative as it is impossible to anticipate the impact of the accession of these countries on the results.
QA25.3 For each of the following statements, please tell me whether you tend to agree or tend to disagree.<br />
The presence of people from other ethnic groups increases unemployment in (OUR COUNTRY)<br />
TOTAL Tend to agree Tend to disagree It depends (SPONTANEOUS) DK<br />
EU25 24732 46% 40% 9% 5%<br />
EU27 26755 45% 40% 9% 6%<br />
BE 1009 49% 41% 10% -<br />
CZ 1150 60% 29% 9% 2%<br />
DK 1037 33% 60% 4% 3%<br />
D-W 1000 46% 44% 9% 1%<br />
DE 1504 48% 44% 7% 1%<br />
D-E 504 54% 41% 4% 1%<br />
EE 1000 23% 54% 15% 8%<br />
EL 1000 74% 21% 5% -<br />
ES 1000 42% 35% 13% 10%<br />
FR 1012 38% 52% 6% 4%<br />
IE 1000 48% 32% 12% 8%<br />
IT 1038 49% 31% 17% 3%<br />
CY 504 86% 8% 4% 2%<br />
LV 1019 35% 53% 6% 6%<br />
LT 1025 39% 47% 2% 12%<br />
LU 502 42% 39% 12% 7%<br />
HU 1000 48% 34% 12% 6%<br />
MT 500 73% 17% 4% 6%<br />
NL 1020 36% 53% 8% 3%<br />
AT 1029 42% 30% 22% 6%<br />
PL 1000 41% 47% 5% 7%<br />
PT 1004 55% 32% 9% 4%<br />
SI 1019 39% 49% 8% 4%<br />
SK 1003 49% 44% 3% 4%<br />
FI 1028 26% 68% 4% 2%<br />
SE 1014 24% 59% 9% 8%<br />
UK 1315 55% 32% 7% 6%<br />
BG 1023 36% 37% 13% 14%<br />
RO 1000 26% 42% 11% 21%<br />
Sex<br />
Male 11904 46% 42% 9% 3%<br />
Female 12828 46% 39% 9% 6%<br />
Age<br />
15-24 3755 46% 41% 8% 5%<br />
25-39 6468 42% 45% 10% 3%<br />
40-54 6326 45% 43% 9% 3%<br />
55 + 8183 50% 34% 9% 7%<br />
Education (End of)<br />
15 6147 57% 27% 8% 8%<br />
16-19 10175 48% 38% 11% 3%<br />
20+ 5626 32% 57% 9% 2%<br />
Still Studying 2341 42% 44% 8% 6%<br />
Left-Right scale<br />
(1-4) Left 6648 38% 51% 9% 2%<br />
(5-6) Centre 8373 47% 40% 9% 4%<br />
(7-10) Right 4340 53% 36% 8% 3%<br />
Respondent occupation scale<br />
Self- employed 1876 42% 44% 11% 3%<br />
Managers 2241 33% 57% 8% 2%<br />
Other white collars 2982 40% 46% 12% 2%<br />
Manual workers 5201 48% 40% 8% 4%<br />
House persons 2402 48% 34% 10% 8%<br />
Unemployed 1584 54% 34% 8% 4%<br />
Retired 6106 52% 32% 9% 7%<br />
Students 2341 42% 44% 8% 6%<br />
Subjective urbanisation<br />
Rural village 8005 48% 39% 8% 5%<br />
Small/ mid size town 10627 47% 39% 10% 4%<br />
Large town 6068 41% 45% 10% 4%<br />
EU27 results are purely indicative as it is impossible to anticipate the impact of the accession of these countries on the results.
QA25.4 For each of the following statements, please tell me whether you tend to agree or tend to disagree.<br />
We need immigrants to work in certain sectors of our economy<br />
TOTAL Tend to agree Tend to disagree It depends (SPONTANEOUS) DK<br />
EU25 24732 48% 38% 9% 5%<br />
EU27 26755 46% 39% 9% 6%<br />
BE 1009 53% 39% 8% -<br />
CZ 1150 36% 51% 10% 3%<br />
DK 1037 71% 22% 4% 3%<br />
D-W 1000 52% 39% 7% 2%<br />
DE 1504 49% 42% 7% 2%<br />
D-E 504 38% 55% 5% 2%<br />
EE 1000 23% 56% 14% 7%<br />
EL 1000 38% 49% 13% -<br />
ES 1000 56% 23% 12% 9%<br />
FR 1012 62% 29% 5% 4%<br />
IE 1000 57% 23% 12% 8%<br />
IT 1038 41% 36% 18% 5%<br />
CY 504 58% 27% 13% 2%<br />
LV 1019 20% 67% 7% 6%<br />
LT 1025 23% 63% 3% 11%<br />
LU 502 77% 15% 5% 3%<br />
HU 1000 14% 70% 11% 5%<br />
MT 500 20% 65% 9% 6%<br />
NL 1020 60% 33% 4% 3%<br />
AT 1029 41% 35% 18% 6%<br />
PL 1000 39% 48% 5% 8%<br />
PT 1004 45% 38% 10% 7%<br />
SI 1019 48% 44% 5% 3%<br />
SK 1003 15% 77% 2% 6%<br />
FI 1028 62% 31% 5% 2%<br />
SE 1014 68% 17% 7% 8%<br />
UK 1315 48% 40% 7% 5%<br />
BG 1023 5% 66% 11% 18%<br />
RO 1000 15% 54% 11% 20%<br />
Sex<br />
Male 11904 50% 38% 9% 3%<br />
Female 12828 47% 38% 9% 6%<br />
Age<br />
15-24 3755 48% 39% 8% 5%<br />
25-39 6468 48% 40% 9% 3%<br />
40-54 6326 49% 38% 9% 4%<br />
55 + 8183 48% 36% 10% 6%<br />
Education (End of)<br />
15 6147 43% 41% 10% 6%<br />
16-19 10175 45% 42% 9% 4%<br />
20+ 5626 60% 29% 8% 3%<br />
Still Studying 2341 50% 37% 8% 5%<br />
Left-Right scale<br />
(1-4) Left 6648 56% 33% 8% 3%<br />
(5-6) Centre 8373 49% 39% 8% 4%<br />
(7-10) Right 4340 47% 42% 8% 3%<br />
Respondent occupation scale<br />
Self- employed 1876 50% 35% 12% 3%<br />
Managers 2241 61% 30% 6% 3%<br />
Other white collars 2982 53% 35% 10% 2%<br />
Manual workers 5201 44% 44% 9% 3%<br />
House persons 2402 45% 35% 12% 8%<br />
Unemployed 1584 42% 47% 7% 4%<br />
Retired 6106 46% 38% 9% 7%<br />
Students 2341 50% 37% 8% 5%<br />
Subjective urbanisation<br />
Rural village 8005 45% 42% 8% 5%<br />
Small/ mid size town 10627 49% 38% 9% 4%<br />
Large town 6068 52% 34% 10% 4%<br />
EU27 results are purely indicative as it is impossible to anticipate the impact of the accession of these countries on the results.
QA25.5 For each of the following statements, please tell me whether you tend to agree or tend to disagree.<br />
The arrival of immigrants in Europe can efficiently solve the problem of Europe’s ageing population<br />
TOTAL Tend to agree Tend to disagree It depends (SPONTANEOUS) DK<br />
EU25 24732 32% 48% 9% 11%<br />
EU27 26755 31% 47% 10% 12%<br />
BE 1009 30% 58% 10% 2%<br />
CZ 1150 31% 52% 9% 8%<br />
DK 1037 44% 41% 5% 10%<br />
D-W 1000 32% 56% 7% 5%<br />
DE 1504 30% 59% 6% 5%<br />
D-E 504 23% 68% 4% 5%<br />
EE 1000 21% 53% 11% 15%<br />
EL 1000 26% 61% 11% 2%<br />
ES 1000 53% 19% 14% 14%<br />
FR 1012 30% 50% 7% 13%<br />
IE 1000 25% 36% 16% 23%<br />
IT 1038 33% 43% 16% 8%<br />
CY 504 18% 47% 9% 26%<br />
LV 1019 16% 65% 5% 14%<br />
LT 1025 17% 62% 2% 19%<br />
LU 502 35% 36% 15% 14%<br />
HU 1000 18% 60% 12% 10%<br />
MT 500 12% 63% 4% 21%<br />
NL 1020 34% 49% 7% 10%<br />
AT 1029 24% 50% 16% 10%<br />
PL 1000 31% 46% 7% 16%<br />
PT 1004 37% 40% 10% 13%<br />
SI 1019 19% 61% 11% 9%<br />
SK 1003 21% 64% 5% 10%<br />
FI 1028 50% 39% 5% 6%<br />
SE 1014 42% 27% 8% 23%<br />
UK 1315 23% 54% 7% 16%<br />
BG 1023 12% 49% 14% 25%<br />
RO 1000 17% 38% 13% 32%<br />
Sex<br />
Male 11904 33% 48% 10% 9%<br />
Female 12828 31% 47% 9% 13%<br />
Age<br />
15-24 3755 33% 46% 9% 12%<br />
25-39 6468 33% 48% 10% 9%<br />
40-54 6326 33% 49% 9% 9%<br />
55 + 8183 29% 48% 9% 14%<br />
Education (End of)<br />
15 6147 28% 49% 9% 14%<br />
16-19 10175 29% 52% 9% 10%<br />
20+ 5626 39% 43% 10% 8%<br />
Still Studying 2341 38% 40% 10% 12%<br />
Left-Right scale<br />
(1-4) Left 6648 39% 42% 10% 9%<br />
(5-6) Centre 8373 32% 50% 8% 10%<br />
(7-10) Right 4340 28% 55% 9% 8%<br />
Respondent occupation scale<br />
Self- employed 1876 34% 45% 11% 10%<br />
Managers 2241 38% 46% 9% 7%<br />
Other white collars 2982 35% 46% 11% 8%<br />
Manual workers 5201 29% 52% 9% 10%<br />
House persons 2402 32% 44% 9% 15%<br />
Unemployed 1584 30% 53% 7% 10%<br />
Retired 6106 28% 49% 9% 14%<br />
Students 2341 38% 40% 10% 12%<br />
Subjective urbanisation<br />
Rural village 8005 30% 50% 8% 12%<br />
Small/ mid size town 10627 33% 48% 9% 10%<br />
Large town 6068 34% 44% 12% 10%<br />
EU27 results are purely indicative as it is impossible to anticipate the impact of the accession of these countries on the results.
QA26a I am going to show you a card with a list of topics. Thinking of (OUR COUNTRY), please tell me which 3 topics from this list currently concern you the most. (MAX. 3 ANSWERS<br />
The care of<br />
disabled people<br />
The care of the<br />
elderly<br />
Economic<br />
growth<br />
The cost of<br />
living<br />
The willingness<br />
of people to<br />
help others<br />
Integration of<br />
foreigners<br />
TOTAL Pensions Immigration Health care Terrorism<br />
EU25 24732 30% 14% 26% 25% 8% 7% 35% 7% 13% 4%<br />
EU27 26755 30% 14% 28% 24% 8% 7% 36% 8% 13% 4%<br />
BE 1009 26% 11% 27% 13% 14% 11% 35% 14% 14% 4%<br />
CZ 1150 35% 6% 39% 19% 3% 13% 33% 5% 7% 5%<br />
DK 1037 8% 15% 26% 42% 28% 22% 2% 3% 30% 6%<br />
D-W 1000 44% 8% 29% 27% 9% 8% 17% 6% 15% 2%<br />
DE 1504 43% 8% 30% 27% 8% 7% 19% 6% 14% 2%<br />
D-E 504 40% 6% 34% 26% 4% 6% 27% 5% 11% 2%<br />
EE 1000 31% 1% 53% 3% 2% 12% 51% 10% 9% 6%<br />
EL 1000 27% 6% 19% 11% 8% 5% 50% 26% 4% 3%<br />
ES 1000 22% 33% 7% 42% 5% 2% 42% 7% 9% 2%<br />
FR 1012 31% 12% 14% 19% 9% 6% 44% 8% 11% 7%<br />
IE 1000 11% 6% 59% 9% 8% 9% 49% 7% 18% 7%<br />
IT 1038 29% 25% 18% 28% 11% 5% 45% 11% 6% 2%<br />
CY 504 23% 4% 37% 11% 18% 10% 60% 12% 8% 5%<br />
LV 1019 31% 6% 42% 8% 2% 4% 53% 15% 9% 4%<br />
LT 1025 34% 5% 61% 4% 1% 7% 44% 22% 6% 4%<br />
LU 502 22% 4% 16% 16% 12% 7% 24% 11% 11% 5%<br />
HU 1000 39% 2% 52% 4% 1% 5% 59% 17% 6% 2%<br />
MT 500 34% 24% 27% 8% 5% 4% 53% 15% 12% 4%<br />
NL 1020 10% 8% 30% 24% 23% 28% 19% 3% 25% 6%<br />
AT 1029 31% 24% 22% 15% 17% 10% 25% 8% 17% 5%<br />
PL 1000 39% 5% 39% 16% 1% 3% 38% 4% 9% 4%<br />
PT 1004 35% 5% 46% 12% 3% 3% 56% 15% 7% 3%<br />
SI 1019 37% 5% 29% 7% 4% 10% 41% 7% 10% 3%<br />
SK 1003 21% 3% 39% 21% 2% 9% 43% 4% 10% 4%<br />
FI 1028 19% 5% 33% 13% 6% 19% 17% 4% 51% 6%<br />
SE 1014 12% 11% 30% 16% 17% 15% 8% 6% 35% 2%<br />
UK 1315 25% 20% 27% 34% 6% 9% 30% 3% 19% 8%<br />
BG 1023 34% 2% 57% 8% 1% 3% 51% 15% 9% 5%<br />
RO 1000 31% 6% 59% 7% 1% 4% 56% 24% 8% 3%<br />
Sex<br />
Male 11904 30% 16% 23% 24% 9% 7% 34% 8% 11% 4%<br />
Female 12828 30% 13% 28% 25% 7% 8% 36% 7% 15% 5%<br />
Age<br />
15-24 3755 19% 12% 18% 27% 7% 10% 35% 8% 7% 4%<br />
25-39 6468 25% 15% 23% 22% 9% 8% 41% 9% 8% 3%<br />
40-54 6326 34% 14% 27% 22% 8% 8% 34% 8% 12% 4%<br />
55 + 8183 37% 15% 30% 28% 8% 6% 30% 6% 20% 5%<br />
Education (End of)<br />
15 6147 38% 18% 27% 27% 6% 5% 38% 6% 16% 4%<br />
16-19 10175 32% 15% 27% 25% 7% 6% 37% 7% 12% 4%<br />
20+ 5626 24% 11% 25% 22% 12% 11% 31% 9% 13% 4%<br />
Still Studying 2341 16% 11% 20% 25% 8% 10% 30% 8% 9% 4%<br />
Left-Right scale<br />
(1-4) Left 6648 28% 11% 25% 23% 9% 10% 33% 7% 13% 4%<br />
(5-6) Centre 8373 32% 14% 27% 27% 7% 8% 34% 7% 14% 4%<br />
(7-10) Right 4340 29% 20% 27% 25% 11% 7% 31% 8% 14% 4%<br />
Respondent occupation scale<br />
Self- employed 1876 30% 16% 25% 23% 10% 8% 35% 12% 9% 3%<br />
Managers 2241 32% 10% 26% 20% 12% 11% 25% 8% 11% 2%<br />
Other white collars 2982 27% 17% 22% 23% 9% 8% 41% 8% 10% 3%<br />
Manual workers 5201 33% 16% 25% 23% 7% 7% 40% 7% 11% 3%<br />
House persons 2402 30% 16% 25% 30% 6% 6% 39% 7% 12% 5%<br />
Unemployed 1584 24% 11% 22% 25% 7% 6% 37% 6% 9% 5%<br />
Retired 6106 36% 15% 32% 27% 8% 6% 31% 6% 21% 6%<br />
Students 2341 16% 11% 20% 25% 8% 10% 30% 8% 9% 4%<br />
Subjective urbanisation<br />
Rural village 8005 31% 16% 27% 26% 7% 7% 34% 7% 13% 4%<br />
Small/ mid size town 10627 31% 14% 25% 25% 8% 7% 37% 7% 13% 4%<br />
Large town 6068 28% 14% 26% 23% 9% 8% 32% 8% 13% 5%<br />
EU27 results are purely indicative as it is impossible to anticipate the impact of the accession of these countries on the results.
QA26a I am going to show you a card with a list of topics. Thinking of (OUR COUNTRY), please tell me which 3 topics from this list currently concern you the most. (MAX. 3 ANSWERS)<br />
The gap<br />
None of these<br />
between the Transport<br />
The<br />
TOTAL Unemployment Crime<br />
Education<br />
Globalisation (SPONTANEOUS DK<br />
rich and the infrastructure<br />
environment<br />
)<br />
poor<br />
EU25 24732 36% 26% 17% 2% 13% 13% 4% 1% 1%<br />
EU27 26755 35% 25% 17% 2% 13% 13% 4% 1% 1%<br />
BE 1009 34% 19% 16% 3% 19% 18% 6% 1% 0%<br />
CZ 1150 34% 32% 14% 5% 6% 13% 5% 1% -<br />
DK 1037 3% 37% 19% 4% 8% 26% 6% 1% 0%<br />
D-W 1000 46% 20% 31% 0% 10% 8% 6% 0% 0%<br />
DE 1504 47% 20% 32% 0% 10% 8% 5% 0% 0%<br />
D-E 504 53% 19% 33% 1% 11% 7% 5% 1% -<br />
EE 1000 12% 17% 20% 6% 26% 15% 3% 1% 0%<br />
EL 1000 58% 33% 9% 0% 17% 11% 4% 0% -<br />
ES 1000 36% 21% 7% 0% 15% 13% 2% 1% 1%<br />
FR 1012 39% 12% 22% 1% 25% 23% 9% 0% 0%<br />
IE 1000 12% 50% 12% 8% 16% 10% 3% 0% 1%<br />
IT 1038 34% 27% 10% 1% 3% 10% 3% 0% 0%<br />
CY 504 26% 33% 12% 2% 20% 8% 6% - 0%<br />
LV 1019 32% 20% 18% 4% 21% 10% 3% 1% 0%<br />
LT 1025 23% 30% 10% 2% 22% 4% 2% 1% 0%<br />
LU 502 37% 27% 12% 6% 25% 23% 11% 2% 1%<br />
HU 1000 40% 7% 15% 3% 18% 9% 3% 1% 0%<br />
MT 500 29% 19% 5% 1% 19% 18% 4% 0% 1%<br />
NL 1020 5% 31% 25% 4% 18% 24% 3% 0% 0%<br />
AT 1029 40% 19% 17% 3% 7% 9% 6% 0% 0%<br />
PL 1000 53% 32% 18% 2% 8% 3% 1% 0% 2%<br />
PT 1004 52% 19% 10% 1% 17% 6% 2% - 1%<br />
SI 1019 45% 24% 26% 3% 6% 11% 7% 1% 0%<br />
SK 1003 47% 37% 20% 4% 8% 10% 2% 0% 1%<br />
FI 1028 30% 26% 30% 1% 3% 15% 5% 0% 0%<br />
SE 1014 30% 37% 18% 2% 6% 45% 4% 0% 0%<br />
UK 1315 13% 41% 9% 5% 17% 17% 4% 1% 1%<br />
BG 1023 36% 28% 20% 1% 12% 3% 2% 0% 0%<br />
RO 1000 17% 8% 19% 4% 20% 9% 4% 1% 1%<br />
Sex<br />
Male 11904 36% 25% 18% 3% 13% 14% 5% 1% 1%<br />
Female 12828 35% 26% 16% 1% 13% 13% 4% 0% 1%<br />
Age<br />
15-24 3755 45% 27% 17% 2% 21% 17% 4% 1% 1%<br />
25-39 6468 37% 25% 17% 2% 17% 15% 5% 0% 1%<br />
40-54 6326 37% 23% 20% 3% 12% 15% 6% 0% 0%<br />
55 + 8183 29% 27% 15% 1% 8% 9% 3% 1% 1%<br />
Education (End of)<br />
15 6147 34% 27% 13% 1% 6% 6% 3% 1% 1%<br />
16-19 10175 38% 26% 18% 2% 11% 12% 4% 1% 0%<br />
20+ 5626 31% 23% 21% 3% 18% 21% 7% 0% 0%<br />
Still Studying 2341 41% 24% 18% 2% 25% 21% 5% 1% 2%<br />
Left-Right scale<br />
(1-4) Left 6648 36% 21% 24% 1% 14% 19% 6% 1% 0%<br />
(5-6) Centre 8373 34% 27% 16% 3% 13% 13% 4% 0% 1%<br />
(7-10) Right 4340 33% 30% 14% 3% 13% 11% 4% 0% 0%<br />
Respondent occupation scale<br />
Self- employed 1876 29% 25% 17% 3% 14% 17% 7% 1% 0%<br />
Managers 2241 29% 23% 22% 5% 21% 22% 7% 1% 1%<br />
Other white collars 2982 36% 24% 18% 3% 12% 16% 5% 1% 0%<br />
Manual workers 5201 39% 24% 18% 1% 12% 13% 4% 0% 1%<br />
House persons 2402 36% 28% 14% 1% 11% 9% 3% 1% 1%<br />
Unemployed 1584 57% 28% 17% 1% 12% 12% 3% 1% 0%<br />
Retired 6106 29% 27% 15% 1% 8% 8% 3% 1% 1%<br />
Students 2341 41% 24% 18% 2% 25% 21% 5% 1% 2%<br />
Subjective urbanisation<br />
Rural village 8005 36% 25% 16% 2% 12% 12% 5% 1% 1%<br />
Small/ mid size town 10627 37% 25% 18% 2% 12% 14% 4% 0% 0%<br />
Large town 6068 34% 27% 18% 2% 17% 14% 4% 0% 1%<br />
EU27 results are purely indicative as it is impossible to anticipate the impact of the accession of these countries on the results.
QA26b And which 3 topics concern you the most for the next generation? (MAX. 3 ANSWERS)<br />
The care of<br />
disabled people<br />
The care of the<br />
elderly<br />
Economic<br />
growth<br />
The cost of<br />
living<br />
The willingness<br />
of people to<br />
help others<br />
Integration of<br />
foreigners<br />
TOTAL Pensions Immigration Health care Terrorism<br />
EU25 24732 30% 10% 17% 23% 7% 7% 26% 10% 10% 2%<br />
EU27 26755 29% 10% 18% 22% 6% 7% 26% 11% 9% 2%<br />
BE 1009 32% 10% 18% 12% 10% 10% 32% 17% 10% 2%<br />
CZ 1150 40% 5% 21% 27% 4% 13% 23% 8% 8% 3%<br />
DK 1037 9% 14% 19% 39% 17% 23% 6% 8% 16% 3%<br />
D-W 1000 46% 3% 19% 20% 5% 8% 11% 8% 14% 2%<br />
DE 1504 47% 4% 20% 21% 5% 8% 12% 7% 13% 2%<br />
D-E 504 47% 6% 25% 23% 3% 8% 16% 5% 11% 2%<br />
EE 1000 10% 6% 24% 14% 5% 8% 34% 8% 6% 4%<br />
EL 1000 21% 7% 8% 16% 8% 4% 31% 19% 2% 2%<br />
ES 1000 17% 22% 5% 29% 4% 2% 30% 6% 7% 1%<br />
FR 1012 36% 7% 13% 13% 6% 6% 30% 13% 7% 2%<br />
IE 1000 15% 10% 31% 15% 12% 8% 31% 11% 17% 4%<br />
IT 1038 30% 19% 11% 28% 12% 7% 32% 14% 5% 2%<br />
CY 504 10% 3% 7% 14% 20% 9% 38% 15% 6% 1%<br />
LV 1019 8% 9% 23% 15% 2% 5% 28% 21% 5% 2%<br />
LT 1025 10% 11% 38% 8% 2% 7% 29% 29% 4% 2%<br />
LU 502 32% 5% 12% 13% 7% 5% 19% 11% 6% 3%<br />
HU 1000 14% 3% 36% 6% 2% 4% 48% 25% 10% 1%<br />
MT 500 40% 15% 15% 12% 10% 4% 31% 16% 6% 4%<br />
NL 1020 16% 4% 24% 23% 15% 28% 15% 5% 22% 3%<br />
AT 1029 40% 19% 21% 17% 15% 8% 21% 8% 16% 4%<br />
PL 1000 31% 6% 17% 24% 3% 4% 26% 4% 10% 3%<br />
PT 1004 28% 6% 27% 18% 5% 4% 38% 14% 7% 3%<br />
SI 1019 32% 4% 19% 12% 4% 8% 24% 6% 6% 2%<br />
SK 1003 24% 7% 18% 34% 3% 10% 24% 8% 9% 3%<br />
FI 1028 21% 6% 26% 19% 4% 14% 16% 7% 27% 3%<br />
SE 1014 17% 7% 17% 17% 10% 15% 10% 9% 14% 1%<br />
UK 1315 25% 13% 20% 30% 5% 6% 32% 7% 9% 3%<br />
BG 1023 7% 7% 28% 22% 5% 3% 37% 27% 7% 2%<br />
RO 1000 18% 12% 38% 18% 3% 4% 32% 31% 6% 3%<br />
Sex<br />
Male 11904 31% 12% 16% 22% 7% 7% 25% 10% 9% 2%<br />
Female 12828 29% 9% 18% 23% 6% 7% 27% 9% 10% 3%<br />
Age<br />
15-24 3755 23% 9% 14% 24% 6% 9% 27% 9% 8% 3%<br />
25-39 6468 26% 11% 16% 22% 6% 7% 29% 10% 8% 2%<br />
40-54 6326 33% 10% 18% 21% 7% 7% 26% 10% 10% 2%<br />
55 + 8183 34% 10% 18% 24% 7% 7% 23% 9% 11% 3%<br />
Education (End of)<br />
15 6147 32% 11% 17% 24% 6% 6% 28% 9% 10% 2%<br />
16-19 10175 32% 11% 18% 23% 7% 7% 27% 10% 9% 2%<br />
20+ 5626 28% 8% 17% 21% 7% 10% 22% 10% 10% 2%<br />
Still Studying 2341 23% 9% 12% 22% 7% 8% 24% 10% 9% 2%<br />
Left-Right scale<br />
(1-4) Left 6648 30% 9% 17% 20% 7% 9% 23% 9% 10% 2%<br />
(5-6) Centre 8373 32% 9% 18% 23% 6% 7% 26% 10% 10% 2%<br />
(7-10) Right 4340 33% 14% 17% 25% 8% 7% 26% 11% 10% 2%<br />
Respondent occupation scale<br />
Self- employed 1876 28% 10% 15% 25% 8% 7% 25% 11% 8% 2%<br />
Managers 2241 32% 7% 19% 20% 8% 10% 19% 10% 11% 1%<br />
Other white collars 2982 30% 13% 16% 21% 7% 8% 27% 10% 9% 2%<br />
Manual workers 5201 31% 11% 18% 22% 6% 7% 30% 10% 9% 2%<br />
House persons 2402 29% 11% 15% 27% 6% 7% 28% 8% 8% 2%<br />
Unemployed 1584 26% 11% 17% 23% 5% 5% 28% 8% 8% 3%<br />
Retired 6106 34% 10% 19% 23% 7% 7% 24% 9% 12% 3%<br />
Students 2341 23% 9% 12% 22% 7% 8% 24% 10% 9% 2%<br />
Subjective urbanisation<br />
Rural village 8005 30% 11% 16% 24% 6% 7% 25% 10% 10% 2%<br />
Small/ mid size town 10627 32% 10% 17% 22% 7% 8% 26% 10% 9% 2%<br />
Large town 6068 27% 11% 17% 22% 7% 7% 26% 10% 10% 3%<br />
EU27 results are purely indicative as it is impossible to anticipate the impact of the accession of these countries on the results.
QA26b And which 3 topics concern you the most for the next generation? (MAX. 3 ANSWERS)<br />
The gap<br />
None of these<br />
between the Transport<br />
The<br />
TOTAL Unemployment Crime<br />
Education<br />
Globalisation (SPONTANEOUS DK<br />
rich and the infrastructure<br />
environment<br />
)<br />
poor<br />
EU25 24732 40% 25% 16% 1% 18% 24% 6% 1% 3%<br />
EU27 26755 39% 24% 16% 2% 19% 23% 6% 1% 3%<br />
BE 1009 44% 19% 15% 2% 15% 26% 7% 1% 1%<br />
CZ 1150 30% 26% 15% 2% 7% 24% 9% 0% 3%<br />
DK 1037 9% 33% 20% 2% 13% 40% 9% 1% 1%<br />
D-W 1000 49% 20% 31% 1% 19% 18% 6% 0% 1%<br />
DE 1504 49% 20% 30% 1% 19% 17% 6% 0% 1%<br />
D-E 504 50% 23% 27% 1% 17% 15% 7% 1% 1%<br />
EE 1000 19% 31% 19% 2% 33% 25% 7% 1% 5%<br />
EL 1000 66% 38% 16% 0% 22% 23% 10% 0% 0%<br />
ES 1000 38% 19% 7% 1% 20% 27% 4% 2% 9%<br />
FR 1012 53% 11% 16% 1% 25% 35% 11% 0% 2%<br />
IE 1000 19% 35% 14% 9% 17% 23% 10% 0% 5%<br />
IT 1038 43% 29% 10% 1% 6% 17% 3% 0% 1%<br />
CY 504 49% 46% 21% 1% 30% 12% 11% 0% 1%<br />
LV 1019 24% 30% 14% 1% 47% 22% 7% 1% 2%<br />
LT 1025 29% 32% 9% 2% 41% 10% 4% 1% 4%<br />
LU 502 51% 22% 10% 2% 25% 29% 15% 0% 2%<br />
HU 1000 52% 8% 10% 2% 35% 13% 6% 1% 2%<br />
MT 500 34% 18% 9% 1% 23% 21% 8% 1% 5%<br />
NL 1020 11% 26% 22% 3% 18% 41% 6% 0% 1%<br />
AT 1029 39% 20% 17% 2% 8% 14% 7% 0% 1%<br />
PL 1000 41% 33% 17% 1% 15% 12% 4% 0% 7%<br />
PT 1004 48% 22% 12% 2% 25% 21% 3% 0% 4%<br />
SI 1019 43% 29% 25% 2% 14% 22% 11% 1% 2%<br />
SK 1003 30% 34% 24% 2% 12% 27% 8% 1% 3%<br />
FI 1028 25% 29% 25% 1% 8% 35% 7% 0% 1%<br />
SE 1014 37% 29% 20% 2% 10% 63% 8% 0% 2%<br />
UK 1315 24% 38% 7% 3% 23% 28% 7% 1% 3%<br />
BG 1023 33% 28% 22% 2% 23% 12% 6% 0% 5%<br />
RO 1000 22% 12% 21% 3% 31% 14% 5% 1% 3%<br />
Sex<br />
Male 11904 39% 23% 16% 2% 18% 25% 7% 1% 3%<br />
Female 12828 41% 26% 15% 1% 18% 23% 6% 1% 3%<br />
Age<br />
15-24 3755 39% 27% 15% 2% 21% 28% 7% 1% 3%<br />
25-39 6468 39% 25% 17% 2% 21% 28% 6% 1% 2%<br />
40-54 6326 40% 25% 17% 2% 17% 25% 8% 0% 2%<br />
55 + 8183 42% 25% 14% 1% 15% 18% 5% 1% 4%<br />
Education (End of)<br />
15 6147 44% 28% 13% 1% 14% 14% 3% 1% 4%<br />
16-19 10175 42% 26% 16% 1% 18% 21% 6% 1% 2%<br />
20+ 5626 35% 21% 18% 2% 21% 36% 10% 0% 2%<br />
Still Studying 2341 35% 25% 17% 2% 22% 34% 9% 1% 3%<br />
Left-Right scale<br />
(1-4) Left 6648 41% 20% 20% 1% 18% 31% 8% 1% 2%<br />
(5-6) Centre 8373 39% 26% 16% 2% 20% 23% 7% 1% 2%<br />
(7-10) Right 4340 36% 28% 14% 1% 17% 23% 5% 0% 1%<br />
Respondent occupation scale<br />
Self- employed 1876 37% 25% 17% 2% 18% 27% 10% 0% 2%<br />
Managers 2241 32% 21% 18% 3% 23% 38% 8% 0% 2%<br />
Other white collars 2982 40% 23% 15% 2% 18% 30% 7% 1% 2%<br />
Manual workers 5201 42% 25% 16% 1% 18% 22% 6% 0% 3%<br />
House persons 2402 43% 29% 13% 1% 16% 18% 5% 1% 3%<br />
Unemployed 1584 47% 29% 18% 1% 20% 21% 5% 1% 2%<br />
Retired 6106 42% 24% 15% 1% 15% 16% 5% 1% 4%<br />
Students 2341 35% 25% 17% 2% 22% 34% 9% 1% 3%<br />
Subjective urbanisation<br />
Rural village 8005 40% 25% 16% 1% 17% 23% 6% 1% 4%<br />
Small/ mid size town 10627 42% 25% 16% 1% 16% 24% 6% 1% 2%<br />
Large town 6068 37% 25% 16% 2% 22% 25% 7% 1% 3%<br />
EU27 results are purely indicative as it is impossible to anticipate the impact of the accession of these countries on the results.
QA27 Which of the following two opinions comes closest to your view?<br />
Neither (SPONTANEOUS) DK<br />
Universities\ places of higher educ.<br />
must be able to select students on<br />
the basis of their grades and<br />
motivation<br />
Universities\ places of higher educ.<br />
must be open to all students who<br />
have completed the secondary<br />
education, regardless of grades and<br />
TOTAL<br />
motivation<br />
EU25 24732 43% 47% 4% 6%<br />
EU27 26755 42% 47% 4% 7%<br />
BE 1009 55% 38% 6% 1%<br />
CZ 1150 32% 59% 6% 3%<br />
DK 1037 33% 62% 1% 4%<br />
D-W 1000 45% 48% 4% 3%<br />
DE 1504 43% 51% 4% 2%<br />
D-E 504 32% 64% 3% 1%<br />
EE 1000 36% 57% 3% 4%<br />
EL 1000 34% 62% 3% 1%<br />
ES 1000 49% 30% 6% 15%<br />
FR 1012 45% 47% 4% 4%<br />
IE 1000 52% 39% 3% 6%<br />
IT 1038 53% 31% 7% 9%<br />
CY 504 38% 59% 1% 2%<br />
LV 1019 39% 58% 1% 2%<br />
LT 1025 36% 57% 2% 5%<br />
LU 502 52% 38% 4% 6%<br />
HU 1000 23% 63% 9% 5%<br />
MT 500 28% 63% 2% 7%<br />
NL 1020 33% 60% 3% 4%<br />
AT 1029 47% 38% 9% 6%<br />
PL 1000 48% 46% 1% 5%<br />
PT 1004 28% 57% 4% 11%<br />
SI 1019 58% 32% 6% 4%<br />
SK 1003 36% 57% 4% 3%<br />
FI 1028 34% 63% 2% 1%<br />
SE 1014 27% 69% 2% 2%<br />
UK 1315 40% 53% 3% 4%<br />
BG 1023 23% 55% 4% 18%<br />
RO 1000 28% 50% 3% 19%<br />
Sex<br />
Male 11904 43% 47% 4% 6%<br />
Female 12828 43% 47% 4% 6%<br />
Age<br />
15-24 3755 50% 44% 3% 3%<br />
25-39 6468 47% 45% 4% 4%<br />
40-54 6326 44% 48% 4% 4%<br />
55 + 8183 37% 49% 5% 9%<br />
Education (End of)<br />
15 6147 43% 39% 6% 12%<br />
16-19 10175 45% 47% 4% 4%<br />
20+ 5626 38% 56% 4% 2%<br />
Still Studying 2341 50% 46% 2% 2%<br />
Left-Right scale<br />
(1-4) Left 6648 45% 47% 4% 4%<br />
(5-6) Centre 8373 42% 50% 4% 4%<br />
(7-10) Right 4340 38% 55% 4% 3%<br />
Respondent occupation scale<br />
Self- employed 1876 41% 50% 4% 5%<br />
Managers 2241 36% 60% 3% 1%<br />
Other white collars 2982 45% 48% 4% 3%<br />
Manual workers 5201 49% 42% 4% 5%<br />
House persons 2402 46% 42% 4% 8%<br />
Unemployed 1584 48% 41% 6% 5%<br />
Retired 6106 37% 49% 5% 9%<br />
Students 2341 50% 46% 2% 2%<br />
Subjective urbanisation<br />
Rural village 8005 42% 48% 4% 6%<br />
Small/ mid size town 10627 44% 46% 4% 6%<br />
Large town 6068 43% 48% 5% 4%<br />
EU27 results are purely indicative as it is impossible to anticipate the impact of the accession of these countries on the results.