Jefferson County - East-West Gateway Coordinating Council
Jefferson County - East-West Gateway Coordinating Council
Jefferson County - East-West Gateway Coordinating Council

You also want an ePaper? Increase the reach of your titles
YUMPU automatically turns print PDFs into web optimized ePapers that Google loves.
<strong>Jefferson</strong> <strong>County</strong> Hazard Mitigation Plan i<br />
Table of Contents<br />
Section 1.........................................................................................................1<br />
Community Profiles.................................................................................................................. 1<br />
<strong>Jefferson</strong> <strong>County</strong> Profile........................................................................................................... 1<br />
Development/History………………....................................................................................... 1<br />
Geography, Geology and Climate .......................................................................................... 2<br />
Form of Government…........................................................................................................... 6<br />
Community Partnerships ......................................................................................................... 6<br />
Significant Cultural/Social Issues ............................................................................................ 7<br />
Public Awareness ..................................................................................................................... 7<br />
Media Relations........................................................................................................................ 7<br />
Demographic Information ...................................................................................................... 8<br />
Age............................................................................................................................................ 8<br />
Per Capita Income and Persons Below the Federal Poverty Level........................................ 9<br />
Education Levels.....................................................................................................................10<br />
Diversity...................................................................................................................................10<br />
Economy, Employment and Industry...................................................................................11<br />
Labor Force.............................................................................................................................11<br />
Unemployment Rate..............................................................................................................11<br />
Average Wage Rate ...............................................................................................................12<br />
Primary Employers and Industries ........................................................................................12<br />
Access to Employment; Incommuting and Outcommuting..............................................14<br />
Codes/Regulations for Building, Stormwater, Zoning, Fire ................................................14<br />
Existing Community Plans.....................................................................................................15<br />
Land Use Information............................................................................................................15<br />
Development Trends and Annexation..................................................................................16<br />
Floodplain Management.......................................................................................................18<br />
Wetlands Issues......................................................................................................................21<br />
NFIP Participation...................................................................................................................21<br />
Environmental Concerns .......................................................................................................21<br />
Endangered Species, Historic Properties/Districts, Archaeological Sites...........................22<br />
Identified Assets.....................................................................................................................23<br />
Inventory of Critical/Key/Essential Facilities..........................................................................23<br />
Medical Facilities....................................................................................................................23<br />
Long Term Care Facilities.......................................................................................................24<br />
Day Care Centers....................................................................................................................25<br />
Schools....................................................................................................................................27<br />
Government Facilities ............................................................................................................29<br />
Recreation Facilities................................................................................................................32<br />
Inventory of Infrastructure ....................................................................................................36<br />
Roadways/Transportation......................................................................................................36<br />
Railroads.................................................................................................................................37<br />
Airports ...................................................................................................................................38<br />
Public Transportation ............................................................................................................39
<strong>Jefferson</strong> <strong>County</strong> Hazard Mitigation Plan ii<br />
Communications....................................................................................................................39<br />
Water and Sewer Facilities....................................................................................................41<br />
Electricity and Natural Gas....................................................................................................48<br />
Solid Waste Disposal .............................................................................................................50<br />
Law Enforcement...................................................................................................................51<br />
Emergency Services (911) .....................................................................................................51<br />
Emergency Medical Services .................................................................................................52<br />
Fire Protection ........................................................................................................................52<br />
Underground Infrastructure..................................................................................................53<br />
Inventory of Key Industrial/Commercial Employment Facilities .........................................54<br />
Inventory of Housing Structures...........................................................................................55<br />
Number of Dwelling Units....................................................................................................55<br />
Average Unit Cost..................................................................................................................55<br />
Total Inventory of Structures ................................................................................................55<br />
Cities and Villages Profiles……………………………………………………….…………55<br />
Section 2.........................................................................................................1<br />
Risk Assessment ....................................................................................................................... 1<br />
Natural Hazard Identification and Elimination Process ........................................................ 1<br />
Community Wide Hazard Profile and List of Hazards Identified......................................... 1<br />
Flood......................................................................................................................................... 2<br />
Earthquake .............................................................................................................................36<br />
Tornado/Severe Thunderstorm .............................................................................................54<br />
Severe Winter Weather..........................................................................................................69<br />
Drought ..................................................................................................................................77<br />
Heat Wave..............................................................................................................................89<br />
Dam Failure ..........................................................................................................................103<br />
Wildfire .................................................................................................................................115<br />
Multi-Jurisdictional Risk Assessment ..................................................................................120<br />
Worksheets ..………………………………………………………………………………124<br />
Section 3.........................................................................................................1<br />
<strong>Jefferson</strong> <strong>County</strong> Capability Assessment................................................................................ 1<br />
Mitigation Management Policies............................................................................................ 1<br />
Existing Plans............................................................................................................................ 1<br />
Mitigation Programs................................................................................................................ 1<br />
<strong>Jefferson</strong> <strong>County</strong> Capabilities (Organization, Staffing, Training)......................................... 3<br />
Responsibilities and Authorities.............................................................................................. 3<br />
Intergovernmental and Interagency Coordination ............................................................... 4<br />
Vulnerability Assessment of <strong>County</strong> Policies and Development Trends….......................... 4<br />
Commitments to a Comprehensive Mitigation Program..................................................... 4<br />
Laws, Regulations, and Policies Related to Development in Hazard-Prone Areas ............. 4<br />
<strong>County</strong> Laws, Regulations and Policies Related to Hazard Mitigation in General ............. 4<br />
How Local Risk Assessments are Incorporated and Prioritized into Local Planning .......... 5<br />
Current Criteria Used to Prioritize Mitigation Funding......................................................... 5<br />
Integration of Hazard Mitigation with the <strong>County</strong> Department’s Plans……………….…5<br />
How the <strong>County</strong> Determines Cost-Effectiveness of Mitigation Programs………………...5
<strong>Jefferson</strong> <strong>County</strong> Hazard Mitigation Plan iii<br />
Mitigation Funding Options, Including Current and Potential Sources of Federal, State,<br />
Local and Private Funds........................................................................................................... 6<br />
How Governments Meet Requirements for Hazard Mitigation Funding Programs .......... 6<br />
Recommendations for Improvement ..................................................................................... 6<br />
<strong>County</strong> and Municipal Policies and Development Trends.................................................... 7<br />
Funding Sources....................................................................................................................... 7<br />
Worksheets………………………………………………………………………………….13<br />
Section 4.........................................................................................................1<br />
Introduction to Mitigation...................................................................................................... 1<br />
Definition of Mitigation........................................................................................................... 1<br />
Categories of Mitigation ......................................................................................................... 1<br />
Mitigation Versus Preparedness ............................................................................................. 2<br />
Mitigation Versus Response and Recovery ............................................................................ 3<br />
Mitigation Plan Benefits.......................................................................................................... 3<br />
Hazard Mitigation Goals, Objectives, Strategy and Coordination....................................... 3<br />
Evaluation................................................................................................................................. 4<br />
Strategic Implementation......................................................................................................10<br />
Cities with Higher Exposure to <strong>County</strong> Hazards……………………………………….….10<br />
Analysis and Prioritization of Mitigation Actions................................................................11<br />
Monitoring, Evaluating and Updating the Plan..................................................................12<br />
Worksheets ………………………………………………………………………………..16
A Regional Overview All-Hazard Mitigation Plan<br />
SECTION 1<br />
Community Profiles<br />
Natural hazards impact not only the citizens of the <strong>East</strong>-<strong>West</strong> <strong>Gateway</strong> <strong>Council</strong> of<br />
Governments (EWG) planning region, but also their property, the environment and the<br />
economy. Natural hazards, defined here as flooding, windstorms, severe winter storms,<br />
earthquakes, heat waves, drought, dam failure and wildfires, have exposed the region’s<br />
residents and businesses to the financial and emotional costs of recovering after disasters.<br />
The risk associated with hazards increases as more people move to areas affect by hazards.<br />
The inevitability of hazards and growing population and activity within the planning region<br />
create an urgent need to develop strategies, coordinate resources and increase public<br />
awareness to reduce risk and prevent loss from future hazard events. Identifying risks<br />
posed by hazards, as well as developing strategies to reduce the impact of a hazard event<br />
can assist in protecting life and property of citizens and communities. Local residents and<br />
businesses are encouraged to work together to implement a Hazard Mitigation Plan that<br />
addresses the potential impact of hazard events.<br />
Below is a description and profile of <strong>Jefferson</strong> <strong>County</strong> within the EWG planning region.<br />
<strong>County</strong> Profile: <strong>Jefferson</strong> <strong>County</strong><br />
Development/History<br />
<strong>Jefferson</strong> <strong>County</strong> is located in eastern Missouri, just west of the Mississippi River. It is<br />
bordered on the north by St. Louis <strong>County</strong> and the Meramec River, on the south by Ste.<br />
Genevieve and St. Francois Counties, and on the west by Washington and Franklin<br />
Counties. The county is part of the St. Louis Metropolitan Statistical Area as defined by the<br />
United States Census Bureau. The county has an area of about 425,280 acres that includes<br />
about 2,176 acres of water in the Meramec, Mississippi and Big Rivers and other large<br />
impoundments. Interstate I-55 runs north and south through the county. <strong>Jefferson</strong><br />
<strong>County</strong> was separated from St. Louis and St. Genevieve Counties and established in 1818<br />
(effective January 1, 1819). Prior to settlement by Europeans, Native Americans including<br />
the Delaware, Missouri, Osage and Shawnee tribes inhabited the region. Charles III, the<br />
King of Spain, encouraged settlements by offering land grants. John Hildebrand,<br />
recognized as the first settler, settled on Saline Creek in 1774, later known as the Meramec<br />
Settlement. Lead, silica, zinc, barite, limestone and other mineral deposits lured settlers to<br />
the area. The first lead shot tower west of Pennsylvania was erected in 1809 in the<br />
southern part of Herculaneum. Sandstone mined from the St. Peter Sandstone Formation<br />
was used to manufacture glass. See Figure J1 in the back of the Technical Appendix.<br />
The county had a population of 200,101 as of the 2000 Census. There are 89,302<br />
registered voters in <strong>Jefferson</strong> <strong>County</strong> comprising 74.2 percent of the voting age population.<br />
1
2<br />
<strong>Jefferson</strong> <strong>County</strong> – Section 1<br />
There are 59,137 households in the county with an average size of 2.87 persons and the<br />
median age of residents is 30.7 years. Median household income is $32,281 annually. Six<br />
percent of county families and 7.5 percent of the total population have incomes below the<br />
poverty level. There are 1,290 miles of roadways in <strong>Jefferson</strong> <strong>County</strong> with 75 percent<br />
maintained by municipal and county governments, and 25 percent maintained by the state<br />
of Missouri. Approximately 80 percent of workers drive to work alone and 0.3 percent take<br />
public transportation to work.<br />
While urbanization in the northern part of <strong>Jefferson</strong> <strong>County</strong> has been increasing, much of<br />
the remainder of the county retains its rural, small town character. Once predominantly<br />
rural, <strong>Jefferson</strong> <strong>County</strong> has experienced more than 50 years of growth pressure from the St.<br />
Louis area. This growth has influenced the county, putting pressure on existing land uses,<br />
natural resources and infrastructure. In 1997, the increase in sales tax revenues was only<br />
3.27 percent, while for the last three years the increase has averaged over 7 percent per<br />
year. This growth in sales tax increases not only impacts the general revenue monies, but<br />
also has a tremendous effect on the budgets for the Sheriff’s department and the highway<br />
department.<br />
Geography, Geology and Climate<br />
<strong>Jefferson</strong> <strong>County</strong> is divided into seven distinct physiographic regions. From the northeast<br />
to the south these regions include: a small area of Dissected Till Plains, the River Hills, the<br />
Zell Platform, the Burlington Escarpment, the Crystal Escarpment, the Salem Plateau and<br />
the Avon Escarpment. These regions have landscape shapes controlled by separate<br />
geologic units with variable bedding, thickness, weatherability and time of deposition. The<br />
Dissected Till Plains consist of rolling and partially dissected basin with low hills and broad<br />
ridges adjacent to the lower Meramec and Mississippi Rivers. Thick layers of alluvium and<br />
loess have covered glacial till and outwash materials. The River Hills consist of a narrow<br />
band of uplands bounded on the east by the Mississippi River and on the west by the<br />
Burlington Escarpment. The Glaize, Joachim, Plattin, Pomme and Rock Creeks dissect this<br />
area. Ridges and north and east slopes are covered with loess. <strong>West</strong> and south slopes<br />
consist of upper cherty red clays and limestone outcrops on the lower slopes. The Zell<br />
Platform is a small valley with rolling topography east of Selma south to Ste. Genevieve<br />
<strong>County</strong>.<br />
The River Hills are on the east and the Crystal Escarpment is on the west. The Burlington<br />
Escarpment is a band that thins from north to south and borders the River Hills and the<br />
Crystal Escarpment. The Salem Plateau is the largest area in the county and borders the<br />
Crystal Escarpment to the north and east and the Avon Escarpment to the south. The<br />
Avon Escarpment is the highest area in the county located in the southwest corner. The<br />
Salem Plateau is on the north. Major soils in this area are Goss and Wrengart. The highest<br />
point in the county on Vinegar Hill is about 1,060 feet above sea level. The lowest point is<br />
about 385 feet above sea level in the Mississippi River bottoms. Floodplains of the Big,<br />
Meramec and Mississippi Rivers and their tributaries are the most fertile of the county.<br />
Topography varies considerably throughout <strong>Jefferson</strong> <strong>County</strong>. Much of the county can be
A Regional Overview All-Hazard Mitigation Plan<br />
classified as rugged. Large areas, with greater than 20 percent slopes are common<br />
throughout northern and southern portions of the county. The central one-third of the<br />
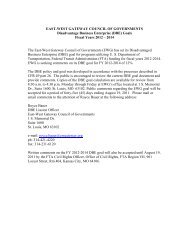
county consists of wider and flatter crests and shallower valleys. The three largest rivers in<br />
<strong>Jefferson</strong> <strong>County</strong> are the Mississippi River, Meramec River and Big River. These waterways<br />
offer commercial and recreational opportunities, but a significant portion of the county is<br />
subject to flooding due to the amount of waterways, as well as fluctuations in water levels.<br />
The Big River drains about 37 percent of the county; the Meramec River drains<br />
approximately 15 percent of the county. Smaller streams draining directly into the<br />
Mississippi River make up about 48 percent of the county. Water from the entire county<br />
flows into Mississippi River. Big River flows into Meramec River, which then flows into<br />
Mississippi River. Both the Joachim and Plattin Rivers flow into the Mississippi River. Refer<br />
to Figure J2 below.<br />
FIGURE J2 MISSOURI TOPOGRAPHY<br />
Source: Missouri Department of Natural Resources<br />
There are 22 geologic formations exposed in <strong>Jefferson</strong> <strong>County</strong>, which range from Cambrian<br />
to Pennsylvanian systems in age (Missouri Geological Survey, 1961). The Cambrian system<br />
has the oldest rocks that crop out, and are composed of massive dolostone. Lead and zinc<br />
ores and barite have been mined from Cambrian formations that occur in areas bordering<br />
Big River and larger creeks in the southern part of the county. The Ordovician system is<br />
exposed in almost three fourths of the county and has had a significant role in the<br />
economic growth and development of the area. Limestone and dolostone quarries have<br />
furnished building stones, aggregate and cement for highways, bridges, and buildings.<br />
Sand mined in the St. Peter Sandston is used by the glass industry.<br />
The Devonian system is represented by a narrow band of sandstone, shale and limestone<br />
that crosses the northeastern part of the county. The Mississippian system is<br />
3
4<br />
<strong>Jefferson</strong> <strong>County</strong> – Section 1<br />
predominantly limestone and cherty limestone. The limestone weathers easily and<br />
produces deep cherty soils (in the northeastern part of the county). The Pennsylvanian<br />
system consists of reddish-brown sandstone and bluish-gray to purple shale found in<br />
sinkholes and vertical bedrock joints. Geologic units consist of flat to gently dipping<br />
bedrock dominated by dolostone, sandstone and limestone formations. Northwestsoutheast<br />
trending folds and faults where bedrock dip is over ten degrees has altered a<br />
slight regional dip of one to two degrees to the northeast. Several zones of high angle<br />
faults that are downthrown are considered to be extensions of the Ste. Genevieve Fault<br />
System. They are the Crystal City anticline, the Plattin Creek anticline, the Roselle<br />
lineament, the Rugley School fault block, the Summit Park structure and the Valles Mines-<br />
Vineland fault zone. A structure known as the Eureka-House Springs anticline has been<br />
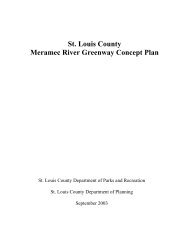
traced from the Mississippi River to near Wright City (McCracken, 1971). The potential for<br />
landslide or slump occurs in areas of the Maquoketa and Warsaw shales. Sinkholes are<br />
numerous in the Kimmswick limestone. Refer to Figure J3 below.<br />
FIGURE J3 GEOLOGIC MAP OF MISSOURI<br />
Source: Missouri Department of Natural Resources<br />
Soils - There are a total of six soil associations in <strong>Jefferson</strong> <strong>County</strong> including the Haynie-<br />
Tice-Waldron Association, the Sonsac-Useful Association, the Wrengart-Goss Association,<br />
the Menfro-Gasconade Association, the Minnith-Pevely Association, and the Haymond-<br />
Freeburg-Horsecreek-Bloomdale Association.<br />
The Haynie-Tice Waldron Association includes zero to two percent slopes, formed in<br />
Mississippian River alluvium. It covers one percent of the county and is present mainly on<br />
natural levees, bottomlands and old meanders. It consists of 48 percent well drained<br />
Haynie soils (silty loam), 29 percent somewhat poorly drained Tice soils (silty loam), 20<br />
percent somewhat poorly drained Waldron soils (silty loam) and three percent minor soils.
A Regional Overview All-Hazard Mitigation Plan<br />
The Sonsac-Useful-Moko Association ranges from three to 55 percent slope. It covers<br />
approximately 58 percent of the county. These soils are most commonly found on narrow<br />
ridgetops, backslopes and summits. The parent materials are loess and residuum. Welldrained<br />
Sonsac soils (gravelly silt loam-well drained) make up 44 percent of the association.<br />
Useful soils (silty loam-moderately well drained) make up 30 percent of the association.<br />
Well-drained Moko soils (stony soils) make up 15 percent of the association and the<br />
remaining 11 percent are minor soils.<br />
The Wrengart-Goss Association ranges from three to 55 percent slope. It covers about 13<br />
percent of the county and consists of soils located on summits, ridgetops, and backslopes.<br />
The parent materials are loess and residuum. The moderately well drained Wrengart soils<br />
(silty loam) make up 47 percent of the association, well-drained Goss soils (cobbly silty<br />
loam) make up 45 percent of the association and eight percent of minor soils make up the<br />
balance.<br />
The Menfro-Gasconade Association ranges from three to 50 percent slope. It covers about<br />
five percent of the county and is located mainly in the summit and backslope areas. Parent<br />
materials consist of loess and residuum. The well-drained Menfro soils (silty loam) make up<br />
69 percent of the association. Excessively well-drained Gasconade soils (rubbly soils) make<br />
up 17 percent and the remaining 14 percent are minor soils.<br />
The Minnith-Pevely Association ranges from three to 50 percent slope. It covers about<br />
eight percent of the county. These soils are commonly found on ridgetops and backslopes.<br />
The parent materials consist of loess and residuum. The moderately well drained Minnith<br />
soils (silty loam) consist of 51 percent of the association. The moderately well drained<br />
Pevely soils (silty loam) make up 32 percent of the association and minor soils make up the<br />
remaining 17 percent.<br />
The Haymond-Freeburg-Horsecreek-Bloomsdale Association ranges from zero to five<br />
percent slope. It covers about 15 percent of the county. It is commonly found in the<br />
floodplains and terraces. The parent material is alluvium. The well-drained Haymond soils<br />
(silty loam) make up 26 percent of the association. The somewhat poorly drained Freeburg<br />
soils (silty loam) make up 25 percent of the association. The well-drained Horsecreek soils<br />
(silty loam) make up 25 percent of the association and the well-drained Bloomsdale soils<br />
(silty loam) makes up about 24 percent of the association. Refer to Figure J4 below.<br />
5
6<br />
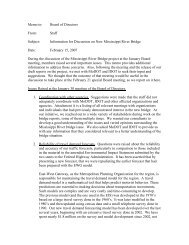
FIGURE J4 SURFICIAL MATERIALS MAP<br />
Source: Missouri Department of Natural Resources<br />
<strong>Jefferson</strong> <strong>County</strong> – Section 1<br />
Climate - Surficial materials in <strong>Jefferson</strong> <strong>County</strong> consist of residuum from cherty limestone<br />
(clay and gravel) up to 50 feet in thickness. These materials are located in the northern half<br />
of the county. Surficial materials in the southern half of the county consist of residuum<br />
from cherty dolomite (clay, silt and gravel). The materials are normally less than ten feet<br />
thick, but can exceed 50 feet in thickness. Surficial materials in the southwest corner of the<br />
county consist of residuum from sandstone and cherty dolomite (clay, silt, sand, gravel and<br />
boulders) and can be up to 200 feet thick.<br />
Form of Government<br />
<strong>Jefferson</strong> <strong>County</strong> is classified as a first class county and has its county seat in Hillsboro. The<br />
county is governed by a three-member <strong>County</strong> Commission led by the Presiding<br />
Commissioner and has 13 municipalities. The county government is divided into the<br />
following departments and divisions: Assessors office, Auditor’s office, Circuit Court Clerk,<br />
Collector of Revenue, <strong>County</strong> Clerk, <strong>County</strong> Commission, Data Processing, Department of<br />
Administration, Economic Development, <strong>Jefferson</strong> <strong>County</strong> Health Center, Juvenile Office,<br />
Land Use Development and Code Enforcement, Parks and Recreation, Public<br />
Administrator’s Office, Public Works, Recorder of Deeds, and the Sheriff’s Department.<br />
Community Partnerships<br />
As part of the EWG region, <strong>Jefferson</strong> <strong>County</strong> collaborates on numerous issues including<br />
infrastructure, law enforcement and emergency services. MoDOT, Franklin, St. Francois,<br />
Washington, Ste. Genevieve and St. Louis Counties collaborate on county lines, as well as<br />
transportation issues where it applies to infrastructure systems across the Meramec Rivers.<br />
Other community partnerships include the Rock Creek Watershed Management Plan group<br />
and the St. Louis-<strong>Jefferson</strong> <strong>County</strong> Solid Waste Management District. <strong>Jefferson</strong> <strong>County</strong><br />
Planning Division, along with the Missouri Natural Resource Conservation Service (NRCS),
A Regional Overview All-Hazard Mitigation Plan<br />
and the Great Rivers Alliance of Natural-Resource Districts (GRAND) are working together<br />
to address watershed plans for <strong>Jefferson</strong> <strong>County</strong>. Organizations that closely participate<br />
with various hazard mitigation activities include <strong>Jefferson</strong> College, <strong>Jefferson</strong> <strong>County</strong> Soil<br />
and Water District, <strong>Jefferson</strong> Online Information Network, and the University of Missouri<br />
Outreach and Extension Office.<br />
Significant Social/Cultural Issues<br />
<strong>Jefferson</strong> <strong>County</strong> is currently experience a population emigration from the St. Louis urban<br />
areas to the county. Many residents in the county wish to preserve the rural atmosphere,<br />
while developing and improving various modes of transportation to the St. Louis urban<br />
area.<br />
Public Awareness<br />
Most of the communities contacted in <strong>Jefferson</strong> <strong>County</strong> have been very responsive to the<br />
Hazard Mitigation Plan initiative. The initial meeting was held on June 13, 2003.<br />
Approximately 100 representatives from the county and communities were invited to learn<br />
about the advantages of developing hazard mitigation plans. A second well-attended<br />
meeting for county residents and interested parties was held on October 22, 2003.<br />
Media Relations<br />
Newspapers published for <strong>Jefferson</strong> <strong>County</strong> are listed below:<br />
St. Louis Post Dispatch/<strong>Jefferson</strong> <strong>County</strong> Suburban Journals<br />
Festus - <strong>Jefferson</strong> <strong>County</strong> Leader<br />
Hillsboro - <strong>Jefferson</strong> <strong>County</strong> Watchman<br />
Arnold - Imperial Rock, <strong>Jefferson</strong> <strong>County</strong> Journal- Leader Publications<br />
Meramec Journal<br />
News Democrat Journal<br />
A variety of radio and television stations are available which include:<br />
Radio Television<br />
KDJR 100.1 FM<br />
KGNA 89.9 FM<br />
KTBJ 89.3 FM<br />
KDHX 88.1 FM KETC-PBS<br />
KEZK 102.5 FM KMOV-CBS<br />
KFUO 99 FM KPLR-Independent/WB<br />
KHITs 96 FM KTVI-Fox<br />
KLOU 103.3 FM KDNL- 30<br />
7
8<br />
KMOX 1120 AM KNLC-24<br />
KNSX 93.3 FM KSDK-NBC<br />
KPNT 105.7 FM <strong>Jefferson</strong> College JC-TV<br />
KSHE 95 FM CNN<br />
KSLQ 104.5 FM MSNBC<br />
KTRS 550 AM BBC<br />
KWMU 90.7 FM Cable Channel 3<br />
KYKY 98 FM<br />
WEW 770 AM<br />
WIL 92 FM<br />
WRTH 1430 AM<br />
WVRV 101 FM<br />
Missouri Digital News (MDN)<br />
KBGM FM 91.1<br />
KJFF AM 1400<br />
KTBJ-FM<br />
Demographic Information<br />
<strong>Jefferson</strong> <strong>County</strong> – Section 1<br />
The population of <strong>Jefferson</strong> <strong>County</strong> has experienced a 421.2 percent change since 1950<br />
and a 15.6 increase in the last decade. See Figure J5 in the back of the Technical Appendix.<br />
Age<br />
According to the 2000 Census, <strong>Jefferson</strong> <strong>County</strong> has a total of 54,784 persons under the<br />
age of 18; 125,116 persons between the age of 18 to 64 and 18,199 persons 65 years of<br />
age and older. <strong>Jefferson</strong> <strong>County</strong> has a younger population and has fewer residents over<br />
the age of 64 years when compared to Missouri statewide population. The median age of<br />
34.9 in <strong>Jefferson</strong> <strong>County</strong> is lower than the 36.0 median age for Missouri. Refer to Table J1<br />
below.<br />
TABLE J1<br />
JEFFERSON COUNTY AGE<br />
DEMOGRAPHICS<br />
AGE CATEGORY NUMBER PERCENT<br />
Under 5 14,280 7.2<br />
Age 5 to 9 15,424 7.8<br />
10 to 14 15,878 8.0<br />
15 to 17 9,659 4.9<br />
18 to 19 5,434 2.7<br />
20 to 24 11,468 5.8<br />
25 to 34 27,290 13.8<br />
35 to 44 35,932 18.1<br />
45 to 54 27,193 13.7<br />
55 to 59 9,932 5.0<br />
60 to 64 7,461 3.8
A Regional Overview All-Hazard Mitigation Plan<br />
TABLE J1<br />
JEFFERSON COUNTY AGE<br />
DEMOGRAPHICS<br />
AGE CATEGORY NUMBER PERCENT<br />
65 to 74 10,702 5.4<br />
75 to 84 5,691 2.9<br />
Over 85 1,755 0.9<br />
Under 18 55,264 27.9<br />
Over 18 142,858 72.1<br />
18 to 64 124,710 63.0<br />
Over 21 135,127 68.2<br />
Over 62 22,482 11.3<br />
Over 65 18,148 9.2<br />
Per Capita Income and Persons Below the Federal Poverty Level<br />
Compared to statewide statistics, most data categories show that <strong>Jefferson</strong> <strong>County</strong> had<br />
higher levels of income and lower levels of poverty. The 2000 Census noted that the per<br />
capita income for <strong>Jefferson</strong> <strong>County</strong> was $19,435, and 13,253 persons were living below<br />
the federal poverty level. Refer to Table J2 and Table J3 below.<br />
TABLE J2 JEFFERSON COUNTY INCOME AND POVERTY LEVEL<br />
CATEGORIES VALUE<br />
Per capita money income, 1999 $19,435<br />
Persons below poverty level, percent, 1999 6.8%<br />
In 2000 <strong>Jefferson</strong> <strong>County</strong> had a per capita personal income (PCPI) of $22,992. This PCPI<br />
ranked 24th in the state and was 84 percent of the state average. The 2000 PCPI reflected<br />
an increase of 6.6 percent from 1999. The 1999-2000 state change was 6.3 percent and<br />
the national change was 6.7 percent.<br />
TABLE J3 POVERTY STATUS IN JEFFERSON COUNTY- 1999<br />
CATEGORY NUMBER PERCENT<br />
Families 2,704 (X)<br />
Percent below poverty level (X) 4.9<br />
With related children under 18 years 2,142 (X)<br />
Percent below poverty level (X) 7.1<br />
With related children under 5 years 1,168 (X)<br />
Percent below poverty level (X) 10.1<br />
Families with female householder, no husband present 1,285 (X)<br />
Percent below poverty level (X) 17.5<br />
With related children under 18 years 1,171 (X)<br />
Percent below poverty level (X) 22.8<br />
With related children under 5 years 575 (X)<br />
Percent below poverty level (X) 35.6<br />
Individuals 13,253 (X)<br />
Percent below poverty level (X) 6.8<br />
9
10<br />
<strong>Jefferson</strong> <strong>County</strong> – Section 1<br />
TABLE J3 POVERTY STATUS IN JEFFERSON COUNTY- 1999<br />
CATEGORY NUMBER PERCENT<br />
18 years and over 8,595 (X)<br />
Percent below poverty level (X) 6.1<br />
65 years and over 1,084 (X)<br />
Percent below poverty level (X) 6.3<br />
Related children under 18 years 4,359 (X)<br />
Percent below poverty level (X) 8.1<br />
Related children 5 to 17 years 2,862 (X)<br />
Percent below poverty level (X) 7.2<br />
Unrelated individuals 15 years and over 4,501 (X)<br />
Percent below poverty level (X) 18.4<br />
Education Levels<br />
The 2000 Census noted that 25,996 individuals had not completed high school, 45,773<br />
persons had completed high school, and 10,650 persons had graduated from college with<br />
a Bachelor’s degree. Refer to Table J4 below.<br />
Diversity<br />
TABLE J4 EDUCATIONAL ATTAINMENT FOR JEFFERSON COUNTY<br />
CATEGORY NUMBER PERCENT<br />
Population 25 years and over 125,956 100.0<br />
Less than 9th grade 8,247 6.5<br />
9th to 12th grade, no diploma 17,749 14.1<br />
High school graduate (includes equivalency) 45,773 36.3<br />
Some college, no degree 30,175 24.0<br />
Associate degree 8,722 6.9<br />
Bachelor's degree 10,650 8.5<br />
Graduate or professional degree 4,640 3.7<br />
Percent high school graduate or higher 79.4 (X)<br />
Percent bachelor's degree or higher 12.1 (X)<br />
According to the 2000 U.S. Census, the majority (98 percent) of <strong>Jefferson</strong> <strong>County</strong> can be<br />
classified as Caucasian. The largest minority, African-American accounts for 1,354 people<br />
(under one percent). The largest ethnic population (just over one percent) of the total<br />
population was Hispanic. According to the 2000 Census, 577 individuals have a Native<br />
American background and 708 have an Asian background. Refer to Table J5.<br />
TABLE J5 JEFFERSON COUNTY DIVERSITY<br />
CATEGORY NUMBER PERCENT<br />
One race 196,248 99.1<br />
White 193,102 97.5<br />
Black or African American 1,354 0.7<br />
American Indian and Alaska Native 577 0.3<br />
Asian 708 0.4<br />
Asian Indian 89 0.0
A Regional Overview All-Hazard Mitigation Plan<br />
TABLE J5 JEFFERSON COUNTY DIVERSITY<br />
CATEGORY NUMBER PERCENT<br />
Chinese 112 0.1<br />
Filipino 199 0.1<br />
Japanese 33 0.0<br />
Korean 88 0.0<br />
Vietnamese 96 0.0<br />
Other Asian 91 0.0<br />
Native Hawaiian and Other Pacific Islander 28 0.0<br />
Native Hawaiian 17 0.0<br />
Guamanian or Chamorro 8 0.0<br />
Samoan 3 0.0<br />
Other Pacific Islander 0 0.0<br />
Some other race 479 0.2<br />
Two or more races 1,851 0.9<br />
Race alone or in combination with one or more other races<br />
White 194,896 98.4<br />
Black or African American 1,709 0.9<br />
American Indian and Alaska Native 1,532 0.8<br />
Asian 1,039 0.5<br />
Native Hawaiian and Other Pacific Islander 86 0.0<br />
Some other race 775 0.4<br />
HISPANIC OR LATINO AND RACE<br />
Total population 198,099 100.0<br />
Hispanic or Latino (of any race) 2,002 1.0<br />
Mexican 1,130 0.6<br />
Puerto Rican 176 0.1<br />
Cuban 41 0.0<br />
Other Hispanic or Latino 655 0.3<br />
Not Hispanic or Latino 196,097 99.0<br />
White alone 191,753 96.8<br />
Economy, Employment and Industry<br />
Labor Force<br />
In 2000, <strong>Jefferson</strong> <strong>County</strong> had a labor force of 104,725 people and an unemployment rate<br />
of 3.2 percent, slightly better than the Missouri unemployment rate of 3.4 percent. In<br />
1990 the unemployment rate was 7.7 percent. This includes an increase of 12,860<br />
employees since 1990. As of 2000, most employed county residents worked in retail,<br />
service, and government sectors. According to the 2000 Census, 112 persons were in the<br />
Armed Forces, 104,613 individuals were in the civilian labor force, 99,837 individuals were<br />
employed, and 4,776 were unemployed. See Table J6 below. A total of 44,488 individuals<br />
were not included in the labor force.<br />
TABLE J6 JEFFERSON COUNTY EMPLOYMENT STATUS<br />
EMPLOYMENT STATUS NUMBER PERCENT<br />
Population 16 years and over 149,213 100.0<br />
11
12<br />
<strong>Jefferson</strong> <strong>County</strong> – Section 1<br />
TABLE J6 JEFFERSON COUNTY EMPLOYMENT STATUS<br />
EMPLOYMENT STATUS NUMBER PERCENT<br />
In labor force 104,725 70.2<br />
Civilian labor force 104,613 70.1<br />
Employed 99,837 66.9<br />
Unemployed 4,776 3.2<br />
Percent of civilian labor force 4.6 (X)<br />
Armed Forces 112 0.1<br />
Not in labor force 44,488 29.8<br />
Females 16 years and over 75,946 100.0<br />
In labor force 48,153 63.4<br />
Civilian labor force 48,133 63.4<br />
Employed 45,699 60.2<br />
Own children under 6 years 16,381 100.0<br />
All parents in family in labor force 10,515 64.2<br />
Average Wage Rate<br />
The average wage rate at the time of the 2000 Census, according to U.S. Department of<br />
Commerce, Bureau of Economic Analysis was $24,470 (based on place of work). The<br />
median wage rate, based on 1999 place of residence data from the U.S. Census, was<br />
$25,332.<br />
Primary Employers and Industries<br />
The top fourteen industries in Franklin <strong>County</strong>, based on 1996 data on employers that have<br />
200 employees or greater, is found in Table J7 below.<br />
TABLE J7 TOP INDUSTRIES IN JEFFERSON COUNTY<br />
NAME ADDRESS CITY EMPLOYEES<br />
<strong>Jefferson</strong> Memorial Hospital PO BOX 350,HWY 61-67 & 55 Festus 850<br />
Doe Run Company 881 Main St. Herculaneum 356<br />
Quality Temps Inc. Arnold 302<br />
Fox School District Arnold 300<br />
Union Pacific 491 N. Main Desoto 300<br />
Ball-Foster Glass Container Co PO Box 729, Hwy 61-67 Pevely 257<br />
Windsor C-I School District 6208 Hwy 61-67 Imperial 255<br />
Union Electric-Rush Island<br />
Power Festus 255<br />
Carondelet Foundry Co Pevely 245<br />
Heizer Aerospace 5841 Hwy 61-67 PO Box 165 Imperial 223<br />
Combustion Engineering, Inc. 3300 State Rd P,PO Box 107 Hematite 213<br />
LMC Industries Inc 100 Manufacturers Drive Arnold 203<br />
<strong>Jefferson</strong> College 1000 Viking Drive Hillsboro 200
A Regional Overview All-Hazard Mitigation Plan<br />
The primary employer sectors include the services industry and the manufacturing industry.<br />
The agriculture and mining sectors employ 556 individuals, the construction industry<br />
employs 10,410 individuals and the manufacturing industry employs 16,563.<br />
Manufacturing is the single largest industry category with 16.6 percent of existing<br />
employment, a five percent increase since 1990. Nevertheless, the national trend of<br />
shrinking manufacturing sector has also occurred in <strong>Jefferson</strong> <strong>County</strong> during the past 10<br />
years. There are 8,632 individuals employed by the transportation, communications and<br />
public utilities industries; 4,045 persons are employed by the wholesale trade; 12,680<br />
persons are employed by the retail trade; 6,701 persons are employed by the finance,<br />
insurance and real estate industry; 37,487 individuals are employed by the services industry<br />
(the largest employer at 30 percent); and 2,763 individuals are employed in the public<br />
administration industry. In addition, <strong>Jefferson</strong> <strong>County</strong> saw an increase of 16.5 percent in<br />
the educational, health and social services sector. Refer to Table J8 for a summary of<br />
<strong>Jefferson</strong> <strong>County</strong> industry types.<br />
TABLE J8 JEFFERSON COUNTY INDUSTRY TYPES<br />
CATEGORY NUMBER PERCENT<br />
Employed civilian population 16 years and over 99,837 100.0<br />
OCCUPATION<br />
Management, professional, and related occupations 23,750 23.8<br />
Service occupations 14,646 14.7<br />
Sales and office occupations 27,984 28.0<br />
Farming, fishing, and forestry occupations 135 0.1<br />
Construction, extraction, and maintenance occupations 14,779 14.8<br />
Production, transportation, and material moving occupations 18,543 18.6<br />
INDUSTRY<br />
Agriculture, forestry, fishing and hunting, and mining 556 0.6<br />
Construction 10,410 10.4<br />
Manufacturing 16,563 16.6<br />
Wholesale trade 4,045 4.1<br />
Retail trade 12,680 12.7<br />
Transportation and warehousing, and utilities 5,921 5.9<br />
Information 2,711 2.7<br />
Finance, insurance, real estate, and rental and leasing 6,701 6.7<br />
Professional, scientific, management, administrative, and waste<br />
management services<br />
7,979 8.0<br />
Educational, health and social services 16,459 16.5<br />
Arts, entertainment, recreation, accommodation and food services 7,206 7.2<br />
Other services (except public administration) 5,843 5.9<br />
Public administration 2,763 2.8<br />
13
14<br />
Access to Employment; Incommuting and Outcommuting<br />
<strong>Jefferson</strong> <strong>County</strong> – Section 1<br />
Approximately twice as many <strong>Jefferson</strong> <strong>County</strong> citizens commuted to work outside their<br />
county of residence, as compared to citizens that worked within the county. According to<br />
the 2000 Census, 32,250 individuals worked within their county of residence, and 1,480<br />
worked outside of their state of residence. See Table J9 below.<br />
TABLE J9 COMMUTING STATISTICS FOR JEFFERSON COUNTY<br />
CATEGORY NUMBER PERCENT<br />
COMMUTING TO WORK<br />
Workers 16 years and over 98,030 100.0<br />
Car, truck, or van -- drove alone 82,666 84.3<br />
Car, truck, or van -- carpooled 11,929 12.2<br />
Public transportation (including taxicab) 205 0.2<br />
Walked 801 0.8<br />
Other means 1,149 1.2<br />
Worked at home 2,081 2.1<br />
Mean travel time to work (minutes) 31.1 (X)<br />
Codes/Regulations for Building, Stormwater, Fire, Zoning<br />
<strong>Jefferson</strong> <strong>County</strong>, as a first class, non-charter county, is authorized under Missouri Revised<br />
Statutes (RSMo 64.815) to prepare and utilize an official Master Plan.<br />
Effective January 4th, 1999, the <strong>County</strong> Commission created the Department of Land Use,<br />
Development, and Code Enforcement. Within this department is the Building Division with<br />
the purpose of enforcing the <strong>Jefferson</strong> <strong>County</strong> Building Codes, which are adopted to<br />
ensure public safety, health, and welfare in so far as they are affected by building<br />
construction. On December 27, 1994 <strong>Jefferson</strong> <strong>County</strong>, under order 12-30-96, adopted a<br />
resolution to establish minimum regulations regarding the design, construction, alteration,<br />
enlargement, repair, demolition and removal in unincorporated areas of the county.<br />
The Building Division was formed in 1967 to enforce the <strong>County</strong> Building Codes. The<br />
adaptation of the 1996 Building Code Ordinance requiring Electrical and Sewer<br />
Registration and Licensing was a significant change to the demands of the Division. The<br />
responsibility for failing septic systems was assigned to the Building Division in 1999 when<br />
the <strong>County</strong> Health Department (staff of eight) could no longer handle the volume of<br />
complaints; this greatly impacting the workload on the Division. Codes that are<br />
administered include: BOCA - 1996 (Building Official & Code Administrators); CABO – 1995<br />
(<strong>Council</strong> of American Building Officials); NEC - 1996 (National Electrical Code NFPA 70);<br />
BOCA-NFPC - 1996 (National Fire Prevention Code); IPC - 1995 (International Plumbing<br />
Code); IMC - 1996 (International Mechanical Code), and the <strong>Jefferson</strong> <strong>County</strong> On-Site<br />
Sewage Ordinance – 1996.<br />
The Code Enforcement Division is another division under the Department of Land Use,<br />
Development, and Code Enforcement. In 1986 the <strong>Jefferson</strong> <strong>County</strong> Commission adopted
A Regional Overview All-Hazard Mitigation Plan<br />
a Solid Waste Ordinance and the Code Enforcement Department is responsible for<br />
enforcing this ordinance. The ordinance establishes standards for the storage,<br />
transportation and disposal of household trash, furniture, appliances, derelict automobiles,<br />
auto parts and other junk and trash. The Department averages more than twenty<br />
investigations per day. More than 10,500 violations of the ordinance have been corrected,<br />
leaving <strong>Jefferson</strong> <strong>County</strong> a cleaner, healthier and more desirable place in which to live.<br />
Another outcome of the ordinance has been the establishment of a recycling office, which<br />
works with recyclers, municipalities, schools and civic organizations to encourage better<br />
waste reduction methods, recycling, and the backyard composting of yard waste. The<br />
Code Enforcement Division also has the responsibility for enforcing the <strong>County</strong> Solid Waste<br />
Ordinance, coordinating solid waste and recycling activities and processing cases involving<br />
Building Codes and the Zoning Order.<br />
Existing Community Plans<br />
The Planning Division within the Department of Land Use, Development and Code<br />
Enforcement conducts the planning efforts for the county government primarily in the area<br />
of land use, but increasingly in the areas of infrastructure and public services. The Division<br />
maintains and implements the <strong>County</strong>'s Zoning Order. This service may include information<br />
on permitted uses for a specific piece of property, building setbacks, current zoning, and<br />
information on processes available to change zoning. This service is generally paid for by<br />
the citizens of <strong>Jefferson</strong> <strong>County</strong> as part of the one-half cent sales tax collected for general<br />
government operations. The Division conducts numerous research efforts on countywide<br />
issues as well as on site-specific issues. This research may include environmental analyses,<br />
project feasibility studies, and reviews of project proposals.<br />
The Planning Division is organized into three sections, each of which reports to the<br />
Manager of the Planning Division. The Current Planning Section is responsible for daily<br />
operations including planning and zoning issues and proposed development. The second<br />
section is the Comprehensive Planning Section and is responsible for long-range planning<br />
functions including watershed management plans, the Master Plan and other special area<br />
or functional plans. The third section is the Technical Operations, which is responsible for<br />
technical operations and inspection efforts of the Division. The Planning Division produces<br />
plans and reports, the Comprehensive Master Plan, program guides and demographics,<br />
maps and statistics. Planning documents released to date include <strong>Jefferson</strong> <strong>County</strong>’s<br />
Master Plan, Rock Creek Watershed Management Plan, <strong>Jefferson</strong> <strong>County</strong> Transportation<br />
Mobility Plan, <strong>Jefferson</strong> <strong>County</strong> Transit Needs Study and the <strong>Jefferson</strong> <strong>County</strong> Economic<br />
Development Plan.<br />
Land Use Information<br />
Land use in <strong>Jefferson</strong> <strong>County</strong>, per EWG data is divided into the following categories:<br />
residential (35,753 acres) commercial (2,491 acres), industrial (2,379 acres), public (4,137<br />
acres), recreational (2,932 acres), transportation, and undeveloped (farmland with 376,217<br />
15
16<br />
<strong>Jefferson</strong> <strong>County</strong> – Section 1<br />
acres). Refer to Figure J6 below that depicts the land use for <strong>Jefferson</strong> <strong>County</strong> (according<br />
to <strong>Jefferson</strong> <strong>County</strong> Planning).<br />
FIGURE J6 JEFFERSON COUNTY LAND USE MAP<br />
Source: <strong>Jefferson</strong> <strong>County</strong> Planning<br />
Development Trends and Annexation<br />
The population of <strong>Jefferson</strong> <strong>County</strong> tripled from 1950 to 1970, with 16.9 percent of the<br />
residents living in incorporated areas. In 1990, the population had increased to 171,380<br />
with 27 percent of the residents living in incorporated areas. The next 25 years are<br />
projected to see a continuation of the growth trend in <strong>Jefferson</strong> <strong>County</strong>. The county will<br />
likely see an increase of population of 11 percent or 22,000 people over the next 10 years<br />
and an increase of almost 28 percent over the next 25 years. <strong>Jefferson</strong> <strong>County</strong> will likely<br />
experience less growth than St. Charles <strong>County</strong>, but more than St. Louis <strong>County</strong>. With the<br />
steady increase in population, the county is faced with ever-increasing environmental<br />
demands. The <strong>Jefferson</strong> <strong>County</strong> Soil and Water Conservation District is assisting with<br />
identifying and addressing problems related to the environment.<br />
The economy in <strong>Jefferson</strong> <strong>County</strong> has improved, as indicated by a growing labor force,<br />
increased employment opportunities and lower unemployment rates. Growth in residential<br />
and commercial building permits has also helped the county prosper. While the rest of the<br />
state has been in a recession, <strong>Jefferson</strong> <strong>County</strong> has had good residential growth.<br />
Residential building permits for 2001 were up over 15 percent. This growth is expected to<br />
continue. <strong>Jefferson</strong> <strong>County</strong> plans to continue responsible growth patterns, while keeping a
A Regional Overview All-Hazard Mitigation Plan<br />
unique identity for <strong>Jefferson</strong> <strong>County</strong>. In addition, the need for a variety of housing options<br />
and concerns exist about increased amount of mobile homes in the county.<br />
Moreover, growth in commercial building permits has helped to balance the economics of<br />
the county. Since 1998, commercial building permits have continued to rise, increasing<br />
108 percent from 1998 to 2001. In 1998, the construction cost of the commercial permits<br />
was 4.6 million dollars, and a major benefit was the size of those commercial operations.<br />
In 2001 the construction costs were 24.1 million dollars, an increase of almost 425<br />
percent.<br />
The local labor market is helping fuel increases in residential permits, and especially<br />
commercial building permits. <strong>Jefferson</strong> <strong>County</strong> will continue to strive to provide more<br />
employment opportunities within the county, for almost 67 percent of the workforce has<br />
jobs outside the <strong>County</strong>. Polls on economic development indicated that efforts should be<br />
made to attract commercial/retail development and to expand the tax base and promote<br />
economic growth. The poll also indicates that growth needs to be planned and financially<br />
responsible for county and that some residents do not want Tax Increment Financing to<br />
assist developers.<br />
Transportation issues center on connectivity; residents want better road conditions but<br />
some residents do not want traffic going through their subdivisions. Some studies have<br />
shown that transit connecting the county to St. Louis would lessen traffic congestion. Bus<br />
service had been provided to St. Louis, but the route was eventually terminated due to<br />
minimal ridership. In 1998, the highway department budget for <strong>Jefferson</strong> <strong>County</strong> was<br />
18.7 million dollars. Of that, 1.4 million dollars was from federal grants. In 2002, the<br />
highway department budget was 33.6 million dollars, an increase of 79 percent. During<br />
these years, <strong>Jefferson</strong> <strong>County</strong> has had an unprecedented amount of monies committed to<br />
state and interstate highways within the county. In the last couple years, and continuing<br />
into 2002, over 100 million dollars worth of highway and bridge projects were started or<br />
had been completed on state and interstate highways within <strong>Jefferson</strong> <strong>County</strong>.<br />
An issue of concern in the county is the lack of communication among different<br />
jurisdictions, infrastructure districts (sewer and water) and community service providers<br />
(police, fire and ambulance), as well as a low level of communication/coordination among<br />
the county and the other entities listed above regarding development of the county.<br />
Other active plans include:<br />
• A wastewater treatment plant<br />
• <strong>Jefferson</strong> <strong>County</strong> Water Authority Plant for drinking water<br />
• Several residential developments, with the City of Pevely projecting almost 400 new<br />
homes and Festus projecting 500 to 1,000 new homes by the end of 2003<br />
• Twin City Levee<br />
17
18<br />
<strong>Jefferson</strong> <strong>County</strong> – Section 1<br />
• Clean Water Study (study will poise <strong>Jefferson</strong> <strong>County</strong> to move forward on pressing<br />
needs of drinking water, stormwater and wastewater management)<br />
The <strong>Jefferson</strong> <strong>County</strong> Master Plan has identified the following five goals pertaining to<br />
trends:<br />
1. Promote growth and development that creates a quality environment, preserves<br />
natural resources and provides community amenities. This goal will 1) include plans<br />
for phased growth in an orderly manner, 2) promote more compact settlement<br />
patterns that maintain overall low densities and preserve rural character of the<br />
county, 3) promote application of site designs that are efficient and sensitive to the<br />
environment, 4) support existing neighborhoods and develop new neighborhoods<br />
that provide quality environments, 5) provide convenient locations for goods and<br />
services, 6) provide economic and physical diversity of housing options, and 7)<br />
ensure maintenance of public safety and protection of public and private property.<br />
2. Create a housing plan for economic development to attract quality development<br />
and jobs to the county.<br />
3. Provide infrastructure and transportation that adequately services the community<br />
and new development.<br />
4. Ensure the maintenance of the environment and open space in an environmentally<br />
sensitive development, especially in large-scale development areas.<br />
5. To provide quality public awareness and high levels of education and<br />
communications regarding planning and development issues.<br />
Floodplain Management<br />
<strong>Jefferson</strong> <strong>County</strong> adopted a new ordinance on April 22, 1999, termed “The <strong>Jefferson</strong><br />
<strong>County</strong>, Missouri Flood Damage Prevention Ordinance.”<br />
The Legislature of the State of Missouri in Section 49.600 RSMo delegated the<br />
responsibility to local governmental units to adopt floodplain management regulations<br />
designed to protect, health, safety and welfare. <strong>Jefferson</strong> <strong>County</strong> adopted the ordinance to<br />
establish and maintain the community’s eligibility for participation in the National Flood<br />
Insurance Program as defined in 44 CFR 59.22(a)(3) and to meet the requirements of 44<br />
CFR 60.3(d). The ordinance applies to lands that are unincorporated and identified as<br />
numbered and unnumbered A zones. <strong>Jefferson</strong> <strong>County</strong> requires that no development shall<br />
be permitted in the zones except through the issuance of a floodplain development permit<br />
granted by the <strong>County</strong> Commission. The <strong>Jefferson</strong> <strong>County</strong> Building Official is the<br />
Floodplain Administrator.<br />
The duties of the Floodplain Administrator include: (1) review of applications for floodplain<br />
development permits to assure that federal, state and local governmental agencies have<br />
given prior approval; (2) ensure sites are safe from flooding and the floodplain<br />
development permit requirements of this ordinance have been satisfied; (3) ensure that<br />
manufactured home parks are safe from flooding; (4) issue floodplain development
A Regional Overview All-Hazard Mitigation Plan<br />
permits; (5) notification of adjacent communities and ensure SEMA/FEMA have been<br />
contacted prior to alteration or relocation of a watercourse; (6) ensure that maintenance is<br />
provided in the altered or relocated portion of the watercourse so that the flood-carrying<br />
capacity is not diminished; (7) verify and maintain records of actual elevations that the new<br />
or substantially improved non-residential structures have been floodproofed; and (8) ensure<br />
that <strong>Jefferson</strong> <strong>County</strong> Building Official obtain certification from registered professional<br />
engineer or architect when floodproofing techniques are utilized for non-residential<br />
structures.<br />
Floodplain development requires a permit with specific information including: (1) a legal<br />
description of the land; (2) description of work to be done; (3) type of use or occupancy for<br />
which work is intended; (4) assessed value of structure and fair market value; (5)<br />
identification if development is in flood fringe or floodway; (6) identification of existing<br />
base flood elevation and elevation of proposed development; and (7) include plans and<br />
signature.<br />
Provisions for flood hazard reduction includes five sections: general standards, specific<br />
standards, manufactured homes, floodway and recreational vehicles. General standards<br />
require that: (1) no development will be granted in any numbered or unnumbered A zones<br />
unless all conditions are satisfied; (2) if flood insurance studies are not available, the<br />
community will obtain and utilize flood data; (3) until a floodway is designated, no new<br />
construction will be permitted in any numbered A zone on the FIRM unless it is<br />
demonstrated that the cumulative effect of the development (and all other surrounding<br />
development) will not increase the water elevation of the base flood more than one foot;<br />
(4) all new construction, improvements and other development will require design or<br />
adequate anchorage; materials resistant to flooding; use of methods that minimize flood<br />
damage; all utility/service facilities designed and located to prevent water from<br />
entering/accumulating in the components from flooding; water supply/sanitary sewage<br />
systems designed to minimize/eliminate infiltration of floodwaters and discharges from<br />
systems into floodwaters located to avoid impairment or contamination; (5) storage,<br />
material, and equipment within special flood hazard area is prohibited, and storage of<br />
other material may be allowed if not subject to major damage by floods; (6) agricultural<br />
structures may be constructed at grade and wet-floodproofed, provided there is no human<br />
occupancy, is of single-wall design, no permanent retail, wholesale or manufacturing use<br />
and a variance has been issued; (7) accessory structures such as parking areas, not larger<br />
than 400 square feet, may be constructed at grade and wet-floodproofed, no human<br />
habitation, is of single wall design and a variance has been issued; (8) hazardous material<br />
storage and handling must be out of the special flood hazard area; and (9) a<br />
nonconforming structure may be continued, subject to: if the structure is destroyed<br />
(including through flooding), it can’t be reconstructed if the cost is more than 50 percent<br />
of the pre-damage market value of the structure.<br />
Specific standards of the floodplain ordinance requires the following: (1) new construction<br />
or substantial improvement of residential structures must have the lowest floor, including<br />
19
20<br />
<strong>Jefferson</strong> <strong>County</strong> – Section 1<br />
the basement, elevated to two feet above the base flood elevation. The building envelope<br />
must be filled to an elevation one foot above base flood elevation; (2) new construction or<br />
substantial improvement of any commercial, industrial or nonresidential structures,<br />
including manufactured homes, must have the lowest floor, including basement elevated<br />
to one foot above the base flood elevation, together with utility and sanitary facilities<br />
floodproofed so that below the base flood elevation, the structure is watertight with walls<br />
impermeable to water with structural components with the capability of resisting<br />
hydrostatics and hydrodynamic loads, an engineer must certify that the structure has met<br />
these standards; and (3) for all new construction and substantial improvements, that all<br />
fully enclosed areas below the lowest floor used only for parking of vehicles, building<br />
access, or storage in an area other than the basement must be designed to equalize<br />
hydrostatic flood forces, and the design must be certified by a registered engineer or<br />
architect.<br />
Manufactured homes to be placed within all unnumbered and numbered A zones on the<br />
community’s FIRM must be installed using methods to minimize flood damage. The<br />
homes must be elevated and anchored to resist movement. These homes must be placed<br />
on elevated permanent foundations so that the lowest floor of the home is elevated two<br />
feet above the base flood elevation and securely attached to prevent movement.<br />
Manufactured homes that are not subject to provisions of Article 4 Section C(2) of the<br />
ordinance must be elevated so that the lowest floor of the home is two feet above the base<br />
flood elevation, or the home chassis is supported by reinforced piers so that there are no<br />
less than 36 inches above the grade and securely attached.<br />
The floodplain ordinance also requires that the community select and adopt a regulatory<br />
floodway, that the community prohibit encroachments (fill, construction) in the floodway,<br />
unless it had demonstrated through standard engineering practices that the encroachment<br />
would not result in flood levels. The community, in unnumbered A zones will obtain and<br />
use base flood elevation data from sources in Article 4, Section A(2).<br />
Recreational vehicles, as stipulated in the floodplain ordinance, can only be placed on sites<br />
within unnumbered and numbered A zones on the community’s FIRM for fewer than 180<br />
consecutive days, and fully licensed for use or meeting the permitting, elevating and<br />
anchoring requirements for manufactured homes.<br />
The floodplain damage prevention ordinance has variance procedures and conditions for<br />
approving floodplain management variances, for agricultural structures, accessory<br />
structures, and penalties for violation of the ordinance.<br />
<strong>Jefferson</strong> <strong>County</strong> has stormwater management plans in place. The Rock Creek Watershed<br />
Management Plan is a comprehensive, small area-planning project being conducted<br />
through a partnership between the <strong>Jefferson</strong> <strong>County</strong> Planning Division, the Missouri<br />
Natural Resource Conservation Service (NRCS), and the Great Rivers Alliance of Natural-<br />
Resource Districts (GRAND). The first of twelve watershed management plans to be<br />
conducted in <strong>Jefferson</strong> <strong>County</strong>, the Rock Creek Watershed Management Plan will address a
A Regional Overview All-Hazard Mitigation Plan<br />
broad range of issues including: land use, site-specific development guidelines, flooding,<br />
and water quality. Funding for the project comes from a Federal Water Quality<br />
Management (604b) grant funded by the Missouri Department of Natural Resources.<br />
The project began in early 1998. Throughout 1998-99, work was focused on the<br />
development of the technical aspects of the plan, including creation of a natural resource<br />
database to be used in the Geographic Information System (GIS), surveying and field work<br />
to establish cross sections of Rock Creek, and aerial mapping to develop 2-foot contour<br />
information for the watershed. This technical phase of the plan will culminate in the<br />
creation of an integrated GIS querying tool, running of computer models to simulate<br />
different storm events to analyze their impacts throughout the watershed, and a reevaluation<br />
of the 100-year floodplain. Subsequent to the technical elements in place in<br />
early 2000, the community involvement phase began. This occurred through several public<br />
meetings in which residents of the watershed were asked to help set priorities for land use<br />
and development guidelines based on the technical information presented by the staff.<br />
Wetlands Issues<br />
The Sierra Club has provided wetlands comments on various projects within <strong>Jefferson</strong><br />
<strong>County</strong>. Included in these comments were concerns about the loss of habitat over 14 miles<br />
of new four-lane highway through rural farms, forests and streams associated with the<br />
Highway 21 project in <strong>Jefferson</strong> <strong>County</strong>.<br />
The United States Corps of Engineers, St. Louis District, issues Nationwide Permits for<br />
wetlands in their jurisdiction within <strong>Jefferson</strong> <strong>County</strong>. In accordance with the St. Louis<br />
District, and District-Designated Waters: for any discharge or excavation activity requiring<br />
authorization, proposed under NWPs 39, 41, 42 and 43, in any ephemeral, intermittent,<br />
and perennial streams in the following Missouri watersheds, the permittee must notify the<br />
District Engineer in accordance with the "Notification" general condition 13 (Federal<br />
Register, 67 FR 2090-2092). This pertains to the following watersheds in <strong>Jefferson</strong> <strong>County</strong>:<br />
Saline/Sugar/Romaine Creeks, Rock Creek, Dulin/Bourne/Heads/Bear Creeks, La Barque<br />
Creek, Glaize Creek, and Joachim/Sandy Creeks.<br />
National Flood Insurance (NFIP) Participation<br />
The National Flood Insurance Policy member number for <strong>Jefferson</strong> <strong>County</strong> is 290808.<br />
Environmental Concerns<br />
The recently completed “<strong>Jefferson</strong> <strong>County</strong> Wastewater Management Report” identifies<br />
septic system failure, including soil types within portions of the county that are not<br />
conducive for on-site wastewater treatment systems and their leaching fields as a concern<br />
in the county. Through the growth and development of strategies identified in the Master<br />
Plan, many of the on-site wastewater treatment system problems can be remedied by the<br />
21
22<br />
<strong>Jefferson</strong> <strong>County</strong> – Section 1<br />
use of public systems that are more reliable and longer lasting. Sensitivity has been given<br />
to topographic considerations because they relate to the health of the watersheds and<br />
watercourses in the region.<br />
Air pollution is a major concern in the St. Louis metropolitan area. Numerous initiatives<br />
continue to improve air quality including: St. Louis Community Air Project, <strong>Gateway</strong> Clean<br />
Air Program, and the St. Louis Regional Clean Air Partnership. Sixteen air qualitymonitoring<br />
stations exist within the metropolitan area that monitors six air pollutants:<br />
carbon monoxide, sulfur dioxide, particulates, lead, carbon dioxide and ozone. The Air<br />
Quality Index (AQI) is a standardized method of reporting air pollution values. Over the<br />
past 25 years, the air quality in St. Louis has greatly improved, and, through the<br />
introduction of controls, ozone levels have significantly decreased.<br />
In 2002, the St. Louis Metropolitan area (Missouri-Illinois) reached a significant air quality<br />
milestone. Based on 2000-2002 air quality monitoring data, the area attained the onehour<br />
standard. On May 12, 2003, the United States Environmental Protection Agency<br />
(USEPA) designated the area as in maintenance of the one-hour standard. However, this is<br />
only one step on the road to cleaner air in the St. Louis region. The area must soon meet<br />
the new eight-hour ozone standard, as well as the fine particulate standard.<br />
Protection and preservation of natural environment is important. This includes air quality,<br />
water quality, streams and topography. Stormwater runoff and land erosion is a<br />
significant issue in <strong>Jefferson</strong> <strong>County</strong>. <strong>Jefferson</strong> <strong>County</strong> plans to prepare land development<br />
policies and regulations to address erosion during land development and construction<br />
process.<br />
A number of hazardous waste facilities are located in <strong>Jefferson</strong> <strong>County</strong>. These sites include:<br />
• Doe Run Company resource recovery facility, located in Herculaneum<br />
• Dow Company hazardous waste facility, located in Pevely, Missouri<br />
• British Nuclear Fuels Ltd., <strong>West</strong>inghouse's parent company, owns a nuclear fuel<br />
plant in Hematite, Missouri; potential for chemical solvents and possible traces of<br />
technetium-99, a radioactive fission product thought to be present during Cold War<br />
activities.<br />
Endangered Species, Historic Properties/Districts, Archaeological Sites<br />
The federal and state listing of endangered species in <strong>Jefferson</strong> <strong>County</strong> includes the Pink<br />
Mucket, Gray Bat, Indiana Bat, Ozark Big Eared Bat, Flathead Chub, Crystal Darter, Bald<br />
Eagle, <strong>East</strong>ern Prairie Fringed Orchid, Peregrine Falcon, Northern Harrier, Lake Sturgeon<br />
and the Red-Cockaded Woodpecker.<br />
In accordance with the National Historic Preservation Act of 1966, the Archaeological and<br />
Historic Preservation Act of 1974 and the Antiquities Act of 1906, information regarding
A Regional Overview All-Hazard Mitigation Plan<br />
specific locations of archaeological sites cannot be released. The Missouri State Historic<br />
Preservation Office (SHPO) within the Outreach Office of MDNR is in the process of setting<br />
up a GIS database that will house archaeological sites in Missouri. Individuals in need of<br />
information may contact the SHPO for information on specific sites. Reference for further<br />
information can be made to Missouri Department of Natural Resources, 1-800-361-4827<br />
or their website at http://www.dnr.mo.gov/shpo/homepage.htm. The Missouri<br />
Archaeological Society’s website is located at http://coas.missouri.edu/mas/ and provides<br />
reference documents on archaeological sites in Missouri.<br />
There are ten sites listed on the national register of historic properties in <strong>Jefferson</strong> <strong>County</strong>.<br />
A list of these are found below and can also be found on the Missouri state website at<br />
http://www.dnr.mo.gov/shpo/<strong>Jefferson</strong>.htm.<br />
Beaumont-Tyson Quarry District, address restricted (10/10/74) (also in St. Louis <strong>County</strong>)<br />
Boemler Archaeological District, address restricted (10/01/74)<br />
Boland Archaeological District, address restricted (10/01/74)<br />
Fletcher, Thomas C., House, Elm St. between 1st & 2nd Sts., Hillsboro (11/19/74)<br />
Greystone-Meissner, Gustave, House, NE of Pevely off US 61/67 (12/31/74); additional<br />
information (3/11/85)<br />
Kimmswick Bone Bed, Mastodon State Historic Site, NW of Imperial, Kimmswick vicinity<br />
(11/05/80)<br />
Leight, Valentine, General Store, 4566 Main St., House Springs (8/18/92)<br />
Moder Archaeological District, address restricted (10/16/74)<br />
Sandy Creek Covered Bridge State Historic Site, 5 mi. N of Hillsboro off US 21 (7/08/70)<br />
Windsor Harbor Road Bridge, Windsor Harbor Rd. at Rock Cr., Kimmswick (9/08/83)<br />
Identified Assets<br />
Inventory of Critical/Key/Essential Facilities<br />
Medical Facilities<br />
Relevant facilities include medical facilities, schools, long-term care facilities, day care<br />
centers and government structures. These facilities represent resources for care and shelter<br />
as well as populations requiring a higher level of care and installations critical to<br />
community services.<br />
The hospitals and other facilities that service <strong>Jefferson</strong> <strong>County</strong> are included in Table J10.<br />
Physician’s offices, clinics, and urgent care centers within the city are too numerous to list<br />
here. See Figures J7 and J8 located in the back of the Technical Appendix.<br />
23
24<br />
<strong>Jefferson</strong> <strong>County</strong> – Section 1<br />
Table J10 JEFFERSON COUNTY MEDICAL FACILITIES<br />
Hospitals and Other Facilities Location Number of Beds<br />
<strong>Jefferson</strong> Memorial Hospital 1400 US Hwy 61, Festus, MO 225<br />
Unity Health Arnold Care Ctr 3619 Richardson Square N.A.<br />
Community Treatment N.A N.A.<br />
Disability Support Systems N.A N.A.<br />
<strong>Jefferson</strong> <strong>County</strong> Support for<br />
the Handicapped<br />
N.A N.A.<br />
<strong>Jefferson</strong> <strong>County</strong> Health Dept N.A N.A.<br />
Long Term Care Facilities<br />
Long-term care facilities are more likely to be impacted in a disaster. These facilities fulfill a<br />
range of needs including retirement, assisted living, intermediate and long term continuing<br />
care. Residents may have mobility and/or cognitive issues that present special problems.<br />
Refer to Table J11 below.<br />
Table J11 LONG TERM CARE FACILITIES IN JEFFERSON COUNTY<br />
FACILITY LOCATION CITY BEDS<br />
Arbor Place Of Festus, Inc 12827 Highway TT Festus 81<br />
Autumn Ridge 300 Autumn Ridge Drive Herculaneum 69<br />
Baisch Nursing Center 3620 Baisch Drive DeSoto 61<br />
Baisch Nursing Center 3620 Baisch Drive DeSoto 18<br />
Cedar Hill Manor 6400 The Cedars Court Cedar Hill 150<br />
Colonial House 122 <strong>East</strong> Pratt Street, PO Box 638 DeSoto 27<br />
Cori Manor 560 Corisande Hill Road Fenton 124<br />
Cori Manor 560 Corisande Hill Road Fenton 22<br />
Country Aire Retirement 2800 Country Aire Estates, PO Box<br />
Home<br />
550<br />
1500 Calvary Church Road, PO Box<br />
DeSoto 51<br />
Crystal Oaks<br />
680<br />
1500 Calvary Church Road, PO Box<br />
Crystal City 60<br />
Crystal Oaks<br />
680 Crystal City 99<br />
Festus Nursing Center 627 <strong>West</strong>wood Drive South Festus 120<br />
Festus Pavillion, Inc 500 Sunshine Drive, PO Box 806 Festus 34<br />
Festus Rest Home 705 Moore Street, PO Box 51 Festus 21<br />
Fountainbleau Nursing<br />
Center 1349 Highway 61, PO Box 700 Festus 74<br />
Fountainbleau Nursing<br />
Center 1349 Highway 61, PO Box 700 Festus 46<br />
Hillcrest Care Center, Inc 1108 Clarke Street DeSoto 120<br />
Keaton Center 120 Mill Street Festus 24<br />
Lakewood Care Center 1797 Lakeview Court, PO Box 552 Pacific 12<br />
Lighthouse Of Festus, Inc<br />
(The) 129 Gray Street, PO Box 606 Festus 25<br />
Loving Care Rest Home, Inc 1107 Clarke Street DeSoto 47<br />
Magnolia Home (The) 204 Grand Avenue Festus 12
A Regional Overview All-Hazard Mitigation Plan<br />
Table J11 LONG TERM CARE FACILITIES IN JEFFERSON COUNTY<br />
FACILITY LOCATION CITY BEDS<br />
My Place Residential Care 23 North Sixth Street Festus 44<br />
Parkview Residential Care 26 Mississippi Avenue, PO Box 494 Crystal City 24<br />
Scenic View RCF 1333 Scenic Drive Herculaneum 23<br />
Scenic View Skilled Care 1333 Scenic Drive Herculaneum 166<br />
South <strong>County</strong> Nursing Home,<br />
Inc 1101 <strong>West</strong> Outer 21 Road Arnold 153<br />
St. Joseph's Hill Infirmary St Joseph Road Eureka 126<br />
Striler's Care Center 134 Gray Street, Box 356 Festus 20<br />
Tanglewood Care Center 1930 Highway F Pacific 12<br />
Twin City Residential Care,<br />
Inc #1 Holding Lane, PO Box 92 Herculaneum 44<br />
Villas (The) 1550 Villas Drive DeSoto 125<br />
Villas (The) 1550 Villas Drive DeSoto 31<br />
Woodland Manor Nursing<br />
Center 100 Woodland Court Arnold 140<br />
Day Care Facilities<br />
Day care centers represent yet another population that needs special consideration,<br />
especially during a disaster situation. Most day care centers cater to children ages two to<br />
five, although some day care centers serve older adults. Those facilities represent<br />
specialized mitigation needs. The following tables show a current population in schools,<br />
day care, preschools and residential facilities. This list of schools and other facilities is<br />
deemed “Facilities Requiring Special Consideration” for evacuation purposes in the<br />
<strong>Jefferson</strong> <strong>County</strong> Emergency Operations Plans. Refer to Table J12 below.<br />
Table J12 DAY CARE FACILITIES FOR JEFFERSON COUNTY<br />
FACILITY LOCATION CITY NUMBER<br />
ABC Preschool Of Arnold 2315 Lonedell Rd Arnold Mo 63010 49<br />
Alpha And Omega Child Care 1107 Clarke St DeSoto Mo 63020 145<br />
Alpha And Omega Child C 429 Maple Ln Pevely Mo 63070 97<br />
Around The World Day C 2125 Kehrt Dr Arnold Mo 63010 59<br />
Aunt Bettys Day Care 5632 Gravois Rd<br />
House Springs Mo 63051 20<br />
Bailey, Kimberly 827 Sheraton Ln<br />
Herculaneum Mo 63048-1538 10<br />
Bailey, Kimberly 827 Sheraton Ln<br />
Herculaneum Mo 63048-1538 10<br />
Beginnings And Beyond 544 Karen Dr Hillsboro Mo 63050 43<br />
Bradley, Patricia 2528 Medford Ln High Ridge Mo 63049-0 10<br />
Bright Beginning Learning 2195 Clark St DeSoto Mo 63020 56<br />
Bright Beginnings Learn 1549 W Main St<br />
Festus Mo 63028 124<br />
Building Blocks Preschool 2500 Tomahawk Dr Arnold Mo 63010 20<br />
Building Blocks Preschool 1340 W Outer 21 Rd Arnold Mo 63010 20<br />
Burkard, Carol 929 Natchez Trce<br />
Bloomsdale Mo 63627 10<br />
Castile, Fern P 6705 Haven Hl<br />
Barnhart Mo 63012 10<br />
Childrens House Of Hills 603 Maple St Hillsboro Mo 63050 50<br />
25
26<br />
<strong>Jefferson</strong> <strong>County</strong> – Section 1<br />
Table J12 DAY CARE FACILITIES FOR JEFFERSON COUNTY<br />
FACILITY LOCATION CITY NUMBER<br />
Childtime Childrens Center 17 Municipal Dr Arnold Mo 63010-1012 144<br />
Childtime Childrens Center 2130 Michigan Ave Arnold Mo 63010 143<br />
Country Kids Child Care 1855 Buena Vista Dr Pacific Mo 63069 10<br />
Desoto Daycare Center 1733 Koch Ln DeSoto Mo 63020 20<br />
Desoto Head Start 300 W Mineral<br />
DeSoto Mo 63020 20<br />
Ditter, Mary F 2205 Parkwood Court Barnhart Mo 63012 10<br />
Emerson, Catherine 132 Southmoore<br />
Hillsboro Mo 63050 10<br />
Ennis, Glenda 5888 Terrace House Springs Mo 63051-0 10<br />
Fenton Play And Learn 1051 Old Gravois Rd Fenton Mo 63026 191<br />
For Kids Only Inc 5432 B Highway 61 67 Imperial Mo 63052 41<br />
Ford, Deborah 2129 Sunswept<br />
High Ridge Mo 63049 10<br />
Gannon, Paula 714 Emil Dr Arnold Mo 63010 10<br />
Haskins, Sue 105 Laverne Fenton Mo 63026 10<br />
Hematite Head Start 3860 Hillsboro Hematite Rd Festus Mo 63028 60<br />
High Ridge Learning Cent 3028 High Ridge Blvd High Ridge Mo 63049-2215 32<br />
House Springs Head Start 4869 Scottsdale House Springs Mo 63051 20<br />
In Two Kids Incorporate 4532 Commerce Ave High Ridge Mo 63049 137<br />
<strong>Jefferson</strong> College Child 1000 Viking Dr Hillsboro Mo 63050 100<br />
<strong>Jefferson</strong> R Seven Preschool 2400 61 Hwy<br />
Festus Mo 630284036 20<br />
Joos, Karen 13520 State Road JJ De Soto Mo 63020-4925 10<br />
Just Us Kids 6008 B Hwy Hillsboro Mo 63050 60<br />
Kids Country Inc 1645 Marriott Ln<br />
Barnhart Mo 63012 93<br />
La Petite Academy 3607 Richardson Sq Arnold Mo 63010 126<br />
Leonard, Karen 8 Robin Ln Fenton Mo 63026-0 10<br />
Lil Thinkers\Big Thinkers 301 Third St Hillsboro Mo 63050 64<br />
Little Dragons Preschool 300 S 3rd St De Soto Mo 630202015 20<br />
Maple Meadows Daycare 510 Maple Meadows Arnold Mo 63010<br />
House Springs Mo 63051-<br />
30<br />
Mini School Of <strong>Jefferson</strong> 6462 Byrnes Mill Rd 1159 99<br />
Miss Cindys Learning Center 1757 Big Bill Rd Arnold Mo 63010 58<br />
New Horizon Day Care Center 5181 Warren Rd<br />
Imperial Mo 63052 99<br />
Peter Rabbit Day Care Center 2176 Tenbrook<br />
Arnold Mo 63010 55<br />
Pfeiffer, Sharon Diane 6509 Old Antonia Rd Imperial Mo 63052 10<br />
Queen Of Apostles Center 800 Montebello Rd Imperial Mo 63052 50<br />
Schmitt, Connie Sue 6003 6th St Imperial Mo 63052 10<br />
Sell, Laura M 2169 Meadow Dr Barnhart Mo 63012 10<br />
Shelby, Holly A 1520 Prehistoric Hill Dr Imperial Mo 63052 10<br />
Soong, Christine 8325 Old Lemay Ferry Rd Barnhart Mo 63012 10<br />
The Gingerbread House 2000 El Lago Ste 7 Arnold Mo 63010 99<br />
Three Rs Professional D 4215 N Highway 21 Imperial Mo 63052 80<br />
Tighe, Margot M 4933 Ferris Ct Imperial Mo 63052 10<br />
Tiny Town Child Care 13197 Timberwood Ln De Soto Mo 63020 20<br />
Tlc Home Day Care 116 N Seventh St Festus Mo 63028 10<br />
Usher, Helen 2235 E Rock Creek Arnold Mo 63010 10<br />
Vance, Jane Ellen 3163 Old Hwy A<br />
Festus Mo 63028 10<br />
Warm Hearts Child Care 4235 Gravois Rd<br />
House Springs Mo 63051 60<br />
Wee Care Learning Center 1500 Calvary Rd<br />
Crystal City Mo 63109 258
A Regional Overview All-Hazard Mitigation Plan<br />
Table J12 DAY CARE FACILITIES FOR JEFFERSON COUNTY<br />
FACILITY LOCATION CITY NUMBER<br />
Windsor Kimmswick Center 6003 Fifth St Kimmswick Mo 63053 24<br />
YMCA <strong>Jefferson</strong> Co Sunrise 4485 Sunrise School Rd De Soto Mo 63020 20<br />
YMCA <strong>Jefferson</strong> <strong>County</strong> Athena Rd De Soto Mo 63020 30<br />
YMCA <strong>Jefferson</strong> <strong>County</strong> 1515 Mid Meadow Ln Festus Mo 63028 40<br />
YMCA <strong>Jefferson</strong> <strong>County</strong> St Marys Ln Festus Mo 63028 50<br />
YMCA of <strong>Jefferson</strong> Co 2400 Hwy 61<br />
Festus Mo 63028 20<br />
YMCA of <strong>Jefferson</strong> <strong>County</strong> 101 Leon Hall Pky Hillsboro Mo 63050 60<br />
YMCA Of <strong>Jefferson</strong> <strong>County</strong> 300 <strong>County</strong> Rd<br />
Pevely Mo 63048 50<br />
YMCA South <strong>County</strong> Branch 2101 Valley Dr House Springs Mo 63051 30<br />
YMCA South <strong>County</strong> Branch Old Gravois Rd House Springs Mo 63051 20<br />
YMCA South <strong>County</strong> Bran High Ridge Blvd High Ridge Mo 63049 30<br />
YMCA South <strong>County</strong> Bran 4630 Brennan Rd High Ridge Mo 63049 20<br />
YMCA South <strong>County</strong> Bran 745 Jeffco Blvd Arnold Mo 63010 49<br />
YMCA South <strong>County</strong> Bran 6992 Rivermont Trl House Springs Mo 63051 45<br />
YMCA South <strong>County</strong> Bran 4525 Four Ridge Rd Imperial Mo 63052 20<br />
YMCA South <strong>County</strong> Bran 2500 Tomahawk Rd Arnold Mo 63010 40<br />
YMCA South <strong>County</strong> Bran 3265 Miller Rd Arnold Mo 63010 70<br />
YMCA South <strong>County</strong> Map 7887 Dittmer Ridge Rd Dittmer Mo 63023 20<br />
Youngsters Learning Pa 3225 Baisch Dr De Soto Mo 63020 68<br />
Schools<br />
More than 73,360 students attend various preschool, public and parochial elementary,<br />
middle, and high schools and one community college in <strong>Jefferson</strong> <strong>County</strong>. There are 15<br />
public school districts in <strong>Jefferson</strong> <strong>County</strong>. Schools represent yet another population that<br />
needs special consideration, especially in a disaster situation. Most schools have students<br />
that range from five through the age of 25. The following Figure J9 and Table J13 show a<br />
current population in schools and location of the districts. Some of the districts overlap<br />
into neighboring counties. This list of schools and other facilities is deemed “Facilities<br />
Requiring Special Consideration” for evacuation purposes in the <strong>Jefferson</strong> <strong>County</strong><br />
Emergency Operations Plans.<br />
FIGURE J9 JEFFERSON COUNTY PUBLIC SCHOOL DISTRICTS<br />
27
28<br />
<strong>Jefferson</strong> <strong>County</strong> – Section 1<br />
Table J13 SCHOOLS IN JEFFERSON COUNTY<br />
Public Schools Location Number of Students<br />
Meramec Valley R-III 126 N Payne St. Pacific 3743<br />
Rockwood R-VI 111 E North, Eureka 22,123<br />
Northwest R-I 2843 Community Lane 7,509<br />
Fox C-6 745 Jeffco Blvd.,<br />
Arnold<br />
11,185<br />
Windsor C-1 6208 Hwy 61-67 2,922<br />
Dunklin R-V 600 Barclay,<br />
Herculaneum<br />
1,471<br />
Hillsboro R-III 20 Hawk Drive,<br />
Hillsboro<br />
3,592<br />
Grandview R-II 11470 Hwy C,<br />
Hillsboro<br />
929<br />
Kingston K-14 Rte 1, Box 1551,<br />
Cadet<br />
872<br />
Sunrise R-IX 4485 Sunrise School<br />
Rd, DeSoto<br />
343<br />
DeSoto 73 221 S. Third, DeSoto 2928<br />
North St. Francois Co. R-I 300 Berry Rd, Bonne<br />
Terre<br />
3,186<br />
<strong>Jefferson</strong> Co. R-VII 1250 Doolin Hollow<br />
Rd, Festus<br />
702<br />
Festus, R-VI 1515 Mid-Meadow<br />
Lane, Festus<br />
2,672<br />
Crystal City 47 1100 Mississippi Ave,<br />
686<br />
Crystal City<br />
Parochial Schools<br />
Christian Outreach School 4440 Outreach Dr.,<br />
Hillsboro<br />
N.A.<br />
Good Shepard Catholic<br />
School<br />
701 Elm, Hillsboro 330<br />
Holy Child Elementary & 2316 Church Rd,<br />
302<br />
Middle School<br />
Arnold<br />
Our Lady’s Catholic School 1550 St. Mary’s Lane,<br />
Festus<br />
323<br />
Our Lady Queen of Peace 4675 Notre Dame<br />
Lane, House Springs<br />
553<br />
Our Saviour Lutheran 900 New Smizer Mill<br />
N.A.<br />
School<br />
Rd, Fenton<br />
Sacred Heart Catholic<br />
School<br />
201 Brierton, Festus 324<br />
St. Anthony’s Catholic 3005 High Ridge Blvd, 365<br />
School<br />
High Ridge<br />
St. Pius X High School 1030 St. Pius Drive,<br />
Festus<br />
811<br />
St. Joseph’s Catholic<br />
School<br />
5th Street, Kimmswick 335<br />
St. John’s Lutheran School 3511 Jeffco Blvd.,<br />
Arnold<br />
196
A Regional Overview All-Hazard Mitigation Plan<br />
Government Facilities<br />
Table J13 SCHOOLS IN JEFFERSON COUNTY<br />
Public Schools Location Number of Students<br />
St. John’s School 4525 Highway 21,<br />
Imperial<br />
N.A.<br />
St. Rose of Lima Catholic<br />
School<br />
523 S. 4th , DeSoto 319<br />
Twin City Christian<br />
Academy<br />
723 Horine Rd, Festus N.A.<br />
Christ the Vine Lutheran<br />
School<br />
310 Central St, Peveley N.A.<br />
Good Shepard Lutheran 2211 Tenbrook Rd 116<br />
Immanuel Christian 19 N 3rd , Festus 65<br />
Hope Lutheran 2308 Gravois, High<br />
Ridge<br />
74<br />
St. Paul’s<br />
Other Schools<br />
465 New Smizer Mill<br />
Rd, Fenton<br />
213<br />
<strong>Jefferson</strong> College 1000 Viking Dr,<br />
Hillsboro<br />
4171<br />
Table J14 below details city, county, state and federal government centers, police stations,<br />
fire stations, ambulance bases and the 911 Emergency Operations Center.<br />
Table J14 GOVERNMENT FACILITIES IN JEFFERSON COUNTY<br />
GOVERNMENT CENTERS-CITY AND<br />
FEDERAL<br />
LOCATION<br />
Office of Job Training 2 Merchants Drive<br />
Department of Agriculture 10820 Hwy 21<br />
Office of Dick Gephardt 998 E Gannon Rd<br />
Recruiting Office 109 Walnut<br />
Barnhart Post Office 1835 Marriot St<br />
Herculaneum Post Office 1234 Commercial Blvd<br />
Cedar Hill Post Office 7050 State Rd BB<br />
Crystal City Post Office 324 Bailey<br />
DeSoto Post Office 950 Boyd<br />
Dittmer Post Office 7768 Gravois Rd<br />
Festus Post Office 109 Walnut<br />
Fletcher Post Office 7682 Old State Rd H<br />
Grubville Post Office Highway Y<br />
Hematite Post Office 3677 State Rd P<br />
Hillsboro Post Office 4620 Yeager Rd<br />
Imperial Post Office 6035 S. Outer Rd<br />
Kimmswick Post Office Front and Market<br />
Liguori Post Office 1 Liguori Rd<br />
Mapaville Post Office 4049 Highway Z<br />
Peveley Post Office N.A.<br />
Richwoods Post Office Highway A<br />
29
30<br />
<strong>Jefferson</strong> <strong>County</strong> – Section 1<br />
Table J14 GOVERNMENT FACILITIES IN JEFFERSON COUNTY<br />
GOVERNMENT CENTERS-CITY AND<br />
FEDERAL<br />
LOCATION<br />
Valle Mines Post Office 3225 State Rd V<br />
Arnold Post Office 1314 Jeffco Blvd<br />
Fenton Post Office 10 Fenton Plaza<br />
High Ridge Post Office 2829 High Ridge Blvd<br />
House Springs Post Office Highway 30<br />
Arnold Recruiting Center 471 Jeffco Blvd<br />
<strong>County</strong> Government Centers<br />
<strong>Jefferson</strong> <strong>County</strong> Court House 300 2nd Street, Hillsboro<br />
<strong>Jefferson</strong> <strong>County</strong> Economic Development<br />
Bldg<br />
725 Maple<br />
<strong>Jefferson</strong> <strong>County</strong> Health Department-<br />
Arnold<br />
<strong>Jefferson</strong> <strong>County</strong> Health Department-<br />
Hillsboro<br />
3838 Jeffco Blvd.<br />
405 2 nd Street<br />
<strong>Jefferson</strong> <strong>County</strong> Parks and Recreation 2800 Community Drive<br />
<strong>Jefferson</strong> <strong>County</strong> Library 3033 High Ridge Blvd<br />
<strong>Jefferson</strong> <strong>County</strong> Library 2101 Jeffco Blvd<br />
<strong>Jefferson</strong> <strong>County</strong> Library 3021 High Ridge<br />
<strong>Jefferson</strong> <strong>County</strong> Library 7479 Metropolitan Blvd<br />
<strong>Jefferson</strong> <strong>County</strong> Juvenile Office 2101 Jeffco Blvd<br />
<strong>Jefferson</strong> <strong>County</strong> Juvenile Office 3857 Gravois Rd<br />
Police<br />
<strong>Jefferson</strong> <strong>County</strong> Sheriff’s Department- 34 Dillion Plaza<br />
North<br />
<strong>Jefferson</strong> <strong>County</strong> Sheriff 300 2 nd St, Hillsboro<br />
<strong>Jefferson</strong> <strong>County</strong> Sheriff-South Hwy 21 & Viking Dr. Hillsboro<br />
<strong>Jefferson</strong> <strong>County</strong> <strong>East</strong> Hwy 61-67 & Windsor Harbor Rd<br />
Arnold 2101 Jeffco Blvd<br />
Byrnes Mill Osage Executive Dr<br />
Cedar Hill 7322 Springdale<br />
Crystal City 130 Mississippi Ave<br />
DeSoto 17 Boyd<br />
Festus 100 Park<br />
Herculaneum 1 Parkwood Ct<br />
Hillsboro 101 Second St<br />
Kimmswick 3 rd and Vine<br />
Olympian Village 205 Kronos Dr<br />
Peveley P.O. Box 304
A Regional Overview All-Hazard Mitigation Plan<br />
Table J14 GOVERNMENT FACILITIES IN JEFFERSON COUNTY<br />
GOVERNMENT CENTERS-CITY AND<br />
FEDERAL<br />
Ambulance Districts<br />
LOCATION<br />
Big River P.O. Box 348, Cedar Hill<br />
Joachim-Plattin Township 619 Collins Dr, Fstus<br />
North <strong>Jefferson</strong> <strong>County</strong> P.O. Box 233, High Ridge<br />
Rock Township P.O. Box 629, Arnold<br />
Valle 12363 Highway 21, Desoto<br />
429 <strong>East</strong> Osage, Pacific<br />
3279 Highway 100, Villa Ridge<br />
Meramec<br />
31768 Highway O, Robertsville<br />
1060 Hwy W<br />
Eureka Fire Protection and Ambulance 1815 W 5<br />
District<br />
th St<br />
3571 Wright Oak School Rd<br />
Fire Departments/Districts<br />
Antonia 3538 Highway M, Imperial<br />
6766 Cedar Hill Rd<br />
8800 Highway 30, Dittmer<br />
Cedar Hill<br />
8790 Byrnes Rd<br />
Crystal City 130 Mississippi Avenue<br />
17 Boyd Street<br />
201 <strong>East</strong> Miller<br />
3610 Highway V<br />
DeSoto<br />
12545 Ware<br />
Dunklin 1987 Highway Z<br />
Eureka 1060 Highway W, Eureka<br />
Goldman 9001 Old Lemay Ferry Rd, Hillsboro<br />
304 Rice Street<br />
Hematite<br />
3067 Meyer Rd<br />
Herculaneum 848 Broad<br />
2839 High Ridge Blvd<br />
1434 Gravois<br />
High Ridge<br />
6969 Wild, House Springs<br />
120 5<br />
Hillsboro<br />
th Street<br />
480 Second St<br />
<strong>Jefferson</strong> <strong>County</strong> Fire Protection District 13000 Highway T, Festus<br />
Mapaville 3701 Mapaville Fire Dept Rd<br />
Pacific 910 <strong>West</strong> Osage, Pacific<br />
1533 Jeffco Blvd, Arnold<br />
1020 Main, Imperial<br />
3540 Londell Rd, Arnold<br />
Rock Community FPD<br />
3889 Miller<br />
Shady Valley FPD 4535 Old Hwy 21, Imperial<br />
1691 S Hwy 141, Fenton<br />
Springdale FPD<br />
2198 Saline Rd, Fenton<br />
Festus 212 N Mill St, 213 N Mill St,<br />
Ridge Street<br />
31
32<br />
<strong>Jefferson</strong> <strong>County</strong> – Section 1<br />
Table J14 GOVERNMENT FACILITIES IN JEFFERSON COUNTY<br />
GOVERNMENT CENTERS-CITY AND<br />
FEDERAL<br />
State Properties<br />
Recreation Facilities<br />
LOCATION<br />
Mapaville State School<br />
Highway A<br />
Region Office 2901 Hwy 61-4 Mi S Festus<br />
Service Bldg 2901 Hwy 61-4 Mi S Festus<br />
Residence 2901 Hwy 61-4 Mi S Festus<br />
Warehouse 2901 Hwy 61-4 Mi S Festus<br />
Service Bldg/Office 20 Mi S St. Louis-Hwy 67<br />
Pit Latrine 5 Mi N Hillsboro-Hwy 21<br />
Tidwell House 20 Mi S St. Louis-Hwy 67<br />
Pit Latrine 20 Mi S St. Louis-Hwy 67<br />
Pit Latrine 20 Mi S St. Louis-Hwy 67<br />
Supt Residence (New) 20 Mi S St. Louis-Hwy 67<br />
Storage Barn 2901 Hwy 61-4 Mi S Festus<br />
Pole Storage 2901 Hwy 61-4 Mi S Festus<br />
Interpretive Museum 20 Mi S St. Louis-Hwy 67<br />
Storage Building 20 Mi S St. Louis-Hwy 67<br />
Open Shelter 20 Mi S St. Louis-Hwy 67<br />
Desoto Armory State Hwy E 63020<br />
Festus Armory Junction Hwy A&P<br />
Unheat. Stor Bldg Desoto State Hwy E 63020<br />
Festus OMS Junction Hwy A&P<br />
Festus Unheat Stor Bldg Junction Hwy A&P<br />
Core Building 10434 State Rd BB<br />
Housing Unit A 10434 State Rd BB<br />
Housing Unit B/C 10434 State Rd BB<br />
Maintenance Building 2 Mi N Hillsboro On Hwy 21<br />
Student Center Building 2 Mi N Hillsboro On Hwy 21<br />
Arts & Science Building 2 Mi N Hillsboro On Hwy 21<br />
Library Learning Center 2 Mi N Hillsboro On Hwy 21<br />
Vocational Technical Building 2 Mi N Hillsboro On Hwy 21<br />
Vo-Prep Building 2 Mi N Hillsboro On Hwy 21<br />
Field House 2 Mi N Hillsboro On Hwy 21<br />
Fine Arts Center 2 Mi N Hillsboro On Hwy 21<br />
Arts And Science 2 Mi N Hillsboro On Hwy 21<br />
Technology Center 2 Mi N Hillsboro On Hwy 21<br />
<strong>Jefferson</strong> College- Arnold 4500 Jeffco Blvd<br />
Child Care Center 2mi N Hillsboro On Hwy 21<br />
Veterinary Technology Facility 2mi N Hillsboro On Hwy 21<br />
<strong>Jefferson</strong> <strong>County</strong> has approximately 145 acres of parks and recreation space for public use.<br />
This is represented in 11 county parks that include hiking trails, passive recreation space,<br />
and fishing and boating opportunities. The <strong>Jefferson</strong> <strong>County</strong> Master Plan noted that,
A Regional Overview All-Hazard Mitigation Plan<br />
based on Missouri Statewide Outdoor Recreation Plan, the supply of parks and recreation<br />
space is significantly low to serve the population of the county and that future<br />
development opportunities should include measures to remedy this situation. Refer to<br />
Table J15 below.<br />
TABLE J15 JEFFERSON COUNTY RECREATIONAL FACILITIES<br />
Big River Saddle Club 10 * * * * * * *<br />
Brown's Ford 2 * * * * *<br />
Cedar Hill 7 * * * * * *<br />
Fletcher House .6 * * * *<br />
High Ridge Civic Center 2 * * * * * * * *<br />
Rockford Beach 8.2 * * * * * * * * *<br />
<strong>Jefferson</strong> Winter Park 40 * * * * * * * *<br />
Morse Mill 10 * * * * * * * *<br />
Pleasant Valley 40 * * * * * * *<br />
Sunridge 6 * * * * * * * *<br />
NW <strong>Jefferson</strong> <strong>County</strong><br />
Sports Complex<br />
20 * * * * *<br />
Morse Mill Park- The Big River is located at Morse Mill Park. Small Mouth Bass,<br />
Crappie, Catfish and other game fish are present in the river. This location can<br />
be used to launch canoes or inner tubes for a 10.9-mile float to Cedar.<br />
Brown’s Ford Park- This facility is located on the Big River. This area produces<br />
some of the best small mouth fishing in the state. A canoe or inner tube can be<br />
launched at the boat ramp and take 18.3-mile trip down to Morse Mill Park.<br />
Cedar Hill Park- This facility provides picnicking, fishing and swimming<br />
opportunities on the Big River. The old mill and dam are overlooking the fast<br />
flowing water dropping over rocks while anglers pull in Crappie and Small<br />
Mouth Bass. This is a good location to launch a canoe or inner tubes for a 9.8mile<br />
float to Rockford Beach.<br />
Fletcher House- Built in 1851 by Thomas E. Fletcher (Missouri's first native-born<br />
Governor, and Friend of the Sixteenth President, Abraham Lincoln), this structure<br />
provides a snap shot of Missouri's past. The Fletcher House is operated as a<br />
33
34<br />
<strong>Jefferson</strong> <strong>County</strong> – Section 1<br />
"House Museum" through the cooperative efforts of the <strong>Jefferson</strong> <strong>County</strong> Parks<br />
and Recreation Department and the Fletcher House Foundation.<br />
High Ridge Civic Center- A wide variety of services provided at the Civic Center.<br />
Activities include dance, martial arts, aerobics, tumbling, clinics, in-line hockey,<br />
hunter training, other community events.<br />
Rockford Beach- Located on the Big River. A dam creates a cascading waterfall.<br />
The river is commonly used for fishing, swimming and boating. Picnic facilities<br />
provide tables, grills and volleyball court.<br />
<strong>Jefferson</strong> <strong>County</strong> Winter Park- Facilities include volleyball courts and picnic tables<br />
over looking the Meramec River. Swimming, personal watercrafts, powerboats<br />
and fishing are welcomed activities.<br />
Pleasant Valley Park Preserve – This park offers 40 acres of secluded areas, wild<br />
flowers, wildlife and walking trails, you will love Pleasant Valley Nature Preserve.<br />
This facility has picnic facilities, playground, or trails. This is the location of<br />
several camps and special events conducted by Civic organizations.<br />
Sunridge Park- This facility has the only tower open to the public and see <strong>East</strong> to<br />
Festus, <strong>West</strong> as far as High Ridge, South to DeSoto and North to Arnold. Shelter<br />
houses, picnic facilities and playground are also available.<br />
Northwest <strong>Jefferson</strong> <strong>County</strong> Sports Complex- The <strong>Jefferson</strong> <strong>County</strong> Parks and<br />
Recreation Department acquired the Northwest <strong>Jefferson</strong> <strong>County</strong> Sports<br />
Complex, formerly the Cedar Hill Ballfields. This 20-acre complex, which currently<br />
provides four baseball fields with backstops, as well as a designated soccer area,<br />
currently is the home of Youth Instructional Soccer Program and Summer Soccer<br />
Camps.<br />
The cities of Arnold, Pevely, Herculaneum, Crystal City, Festus, Hillsboro, and<br />
Byrnes Mill all have city parks. In addition, there is Mastodon State Historic Site<br />
in Imperial and several State Department of Conservation areas.<br />
A visit to Washington State Park is sure to be a memorable experience for<br />
anyone. A favorite attraction here is the Indian rock carvings found in the park.<br />
These carvings, or petroglyphs, are believed to have been made around A.D.<br />
1,000 and give clues to the lives of the prehistoric Indians who once inhabited<br />
this part of Missouri.<br />
Washington State Park retains many of its original buildings constructed in a<br />
rustic architectural style in the 1930s by African-American Civilian Conservation<br />
Corps stonemasons. In addition to a lodge, there are quaint stone hiking<br />
shelters, a picnic pavilion, and the beautifully laid stone slabs that make up the
A Regional Overview All-Hazard Mitigation Plan<br />
1,000 Steps Trail. The three hiking trails at Washington State Park provide every<br />
experience, from an easy stroll with bluff-top views of the river to a vigorous<br />
excursion through 10 miles of rugged Ozark terrain.<br />
Park visitors also can enjoy camping, fishing and swimming -- in a modern pool,<br />
or in the Big River. Available for rental are canoes and comfortable cabins with<br />
fully equipped kitchens.<br />
Due to storm damage, portions of Washington State Park are temporarily closed. Closed<br />
areas include:<br />
• special-use area<br />
• Civilian Conservation Corps shelter<br />
• all hiking trails<br />
Sandy Creek Covered Bridge boasts the picture-perfect appearance of an old red<br />
barn. It was one of six bridges built in 1872 to allow passage from the <strong>Jefferson</strong><br />
<strong>County</strong> seat of Hillsboro to St. Louis.<br />
Mastodon State Historic Site contains an important archaeological and<br />
paleontological site - the Kimmswick Bone Bed. Bones of mastodons and other<br />
now-extinct animals were first found here in the early 1800s. The area gained<br />
fame as one of the most extensive Pleistocene ice age deposits in the country<br />
and attracted scientific interest worldwide.<br />
Archaeological history was made at the site in 1979 when scientists excavated a<br />
stone spear point made by hunters of the Clovis culture (14,000 - 10,000 years<br />
ago) in direct association with mastodon bones. This was the first solid evidence<br />
of the coexistence of people and these giant prehistoric beasts.<br />
Today, the 425-acre property preserves this National Register of Historic Places<br />
site and provides recreational opportunities. A museum tells the natural and<br />
cultural story of the oldest American Indian site one can visit in the state's park<br />
system. A full-size replica of a mastodon skeleton highlights the exhibits. A picnic<br />
area, several trails and a special-use campground offer chances to explore the<br />
land where the lives of Native Americans and mastodons once intertwined.<br />
Gov. Daniel Dunklin's Grave State Historic Site, Herculaneum, houses the grave of<br />
Missouri's fifth governor (1832-1836). The site interprets Dunklin's role as the<br />
Father of Public Schools, and provides a scenic overlook of the Mississippi River.<br />
35
36<br />
Inventory of Infrastructures<br />
<strong>Jefferson</strong> <strong>County</strong> – Section 1<br />
<strong>County</strong> infrastructures include transportation, communications, water/sewer,<br />
electricity and natural gas, solid waste disposal, law enforcement, fire protection,<br />
emergency medical services and emergency management.<br />
Transportation<br />
The road network has a great impact on <strong>Jefferson</strong> <strong>County</strong>. On the eastern side of the<br />
county lies the primary north/south transportation route, Interstate I-55. I-55 connects the<br />
St. Louis region to points north and south. Interstate I-44 lies in the northwest corner of<br />
the county connecting the region to areas southwest and northeast. Internally, a web of<br />
state and county roads connects <strong>Jefferson</strong> <strong>County</strong>. State Highway 61/67 and 21 are the<br />
primary north/south connectors. Highway 30 runs northeast/southwest through the<br />
northwest quadrant of the county. Highways M and MM provide a major eat/west<br />
connection from I-55 and highway 30, in the northern part of the county. The county<br />
lacks major east/west connections south of the M-MM corridor. Narrow county roads<br />
provide indirect access in much of the southern portion of the county. Local roads that<br />
serve subdivisions and neighborhoods are classified as privately owned and dedicated to<br />
public use. Thus, for these subdivisions, the homeowner’s association is responsible for<br />
maintenance. See Figure J10 located in the back of the Technical Appendix.<br />
The <strong>County</strong> Commission convened the Transportation Advisory Committee on September<br />
16, 1999. The overall purpose of the TAC is to serve as the source of long-range planning<br />
and strategies and shared local transportation policy making for <strong>Jefferson</strong> <strong>County</strong>. They will<br />
advise the <strong>County</strong> Commission on funding, administration, and operation of publicly<br />
supported agencies involved in the delivery of services for all modes of transportation, and<br />
they will act as a focal point for cooperation and coordination between all stakeholders in<br />
the delivery of transportation services.<br />
One of the immediate tasks of the Transportation Advisory Committee (TAC) was to<br />
investigate the transportation needs of the elderly, handicapped, Welfare-to-work<br />
population and others with special medical and job service needs. The TAC found that the<br />
transportation needs of these segments of the <strong>Jefferson</strong> <strong>County</strong> population are not being<br />
sufficiently met. The key issues surrounding this finding are: 1) insufficient funding for<br />
current providers; 2) communication between service providers is limited; 3) there is no<br />
mass transit available in the <strong>County</strong>; 4) data on needed services is not available; 5) there is<br />
no standard on data collection; and 6) the <strong>County</strong> is not accessing all the money available<br />
to resource transportation services. All of these issues impact the physically disabled, the<br />
elderly, and others with medical and job service needs.<br />
The TAC has the following short term recommendations to address these issues: 1)<br />
contract a public transit needs study; 2) create a centralized automated information center;<br />
3) expand dialog with mass transit providers; 4) research the availability for potential
A Regional Overview All-Hazard Mitigation Plan<br />
funding sources; and 5) implement strategies based on the findings of the transit needs<br />
study.<br />
Motor Freight Transportation<br />
Approximately 550 motor freight carriers and 148 freight shipping establishments serve<br />
Greater St. Louis. Truck terminals are located throughout Greater St. Louis and are<br />
strategically located near rail, port and pipeline facilities. See Table J16 below.<br />
Railroads<br />
TABLE J16 JEFFERSON COUNTY TRANSPORTATION<br />
Sample of Motor Freight Carriers<br />
ABF Freight Systems Inc. Mabro Corporation<br />
American Freightways Inc. Overnite Transportation Company<br />
Beelman Truck Company Roadway Express Inc.<br />
Cassens Corp. Truck Transport Inc.<br />
CF Motor Freight USF Holland Motor Express<br />
Creech Bros. Truck Lines Inc. Witte Brothers Exchange Inc.<br />
Henry Transportation Inc. Yellow Freight Systems Inc.<br />
The St. Louis region is one of the leading rail centers in the United States with over 5,000<br />
people employed in the rail industry.<br />
Railroads: Class I<br />
Amtrak (Passenger)<br />
Burlington Northern Santa Fe<br />
Canadian National Railway<br />
CSX Transportation<br />
Norfolk Southern<br />
Union Pacific<br />
Railroads: Regional<br />
<strong>Gateway</strong> <strong>West</strong>ern Railroad<br />
Missouri Central Railroad<br />
Railroads: Switching and Terminal<br />
Alton and Southern Railway<br />
Manufacturers Railway Company<br />
Terminal Railroad<br />
Amtrak passenger service is available in the City of St. Louis<br />
37
38<br />
Airports<br />
<strong>Jefferson</strong> <strong>County</strong> – Section 1<br />
TABLE J17 Year 2000 Fourth Quarter St. Louis Metropolitan Region Aircraft<br />
Operations Summary at Public-Use Airports<br />
St. Louis <strong>County</strong>, Missouri<br />
Spirit of St. Louis 47,447<br />
Creve Coeur 9,555<br />
St. Charles <strong>County</strong>, Missouri St. Charles <strong>County</strong>, Smartt 12,045<br />
St. Charles Municipal 9,490<br />
Franklin <strong>County</strong>, Missouri<br />
Sullivan Regional 5,824<br />
Washington Memorial 8,918<br />
St. Clair Regional 3,185<br />
<strong>Jefferson</strong> <strong>County</strong>, Missouri Festus Memorial 3,731<br />
St. Clair <strong>County</strong>, Illinois St. Louis Downtown-Parks* 40,195<br />
Madison <strong>County</strong>, Illinois<br />
St. Louis Regional* 19,435<br />
Shafer Metro-<strong>East</strong> 3,913<br />
Total 163,738<br />
*Aircraft operation estimates reflect activity measured after normal ATC operating hours. This activity, when<br />
combined with ATC traffic counts results in a slightly higher total aircraft operation count for that airport, when<br />
compared to ATC reports.<br />
In addition to the above figures and Table J17, Lambert-St. Louis International<br />
Airport had 4,837general aviation aircraft operations and Mid America Airport in<br />
Illinois had 785 general aviation aircraft operations for a total of 169,360<br />
operations. Figure J11 depicts the regional metropolitan airports.<br />
1 = Creve Coeur<br />
2 = Festus Memorial<br />
3 = <strong>Jefferson</strong> <strong>County</strong> (proposed)<br />
4 = Lambert-St. Louis Intl Airport<br />
FIGURE J11 ST. LOUIS METROPOLITAN AIRPORTS
A Regional Overview All-Hazard Mitigation Plan<br />
5 = MidAmerica<br />
6 = Shafer Metro-<strong>East</strong><br />
7 = St. Charles <strong>County</strong> Smartt<br />
8 = St. Charles Municipal<br />
9 = St. Clair Regional<br />
10 = St. Louis Downtown - Parks<br />
11 = St. Louis Regional<br />
12 = Spirit of St. Louis<br />
13 = Sullivan Regional<br />
14 = Washington Memorial<br />
Public Transportation<br />
Public Transportation for <strong>Jefferson</strong> <strong>County</strong> consists of J.C. Transit (JCT) and OATS.<br />
Attempts in the past have been made to support public transportation from the urban St.<br />
Louis area to <strong>Jefferson</strong> <strong>County</strong>. There does not appear to be a community interest in<br />
utilizing public transportation from <strong>Jefferson</strong> <strong>County</strong> to St. Louis.<br />
Communications<br />
New infrastructures and services are enhancing county residents’ quality of lives. The<br />
following list of communication facilities is not all-inclusive, but represents the major<br />
providers of the county’s communication infrastructure. See Table J18 below.<br />
TABLE J18 COMMUNICATIONS<br />
Access U.S. Advanced Satellite Systems Inc.<br />
Advantage CTI Communications Inc. Advertisenet<br />
AirTouch Paging Alpha Telecommunications LLC<br />
American Paging Inc. American Technology Corporation<br />
AmericaNetworks Angel Technologies Corp.<br />
AnsaRing Corporation Apple A Day Inc. (An)<br />
Arch Communications Inc. Ascom Nexion<br />
Associated Engineered Systems Inc. Astralink Technology Inc.<br />
AT&T (<strong>Jefferson</strong> City Office) AT&T (St. Louis Operations)<br />
AT&T Wireless Services Auto Cellular Inc.<br />
Avtex Corp. Axon Telecom LLC<br />
Barron Communications Inc. BigWideSky<br />
Birch Telecom Black Box Inc.<br />
Brick Network BusComm Inc.<br />
Cable & Wireless Inc. Capital Cellular Inc.<br />
Centergistic Solutions Central Business Communications Inc.<br />
Central District Alarm Inc. Centras Networks Inc.<br />
Charter Pipeline Cingular Wireless Corporation<br />
ClearPages.com CMS Communications Inc.<br />
Com Trol Company Com-Sal Inc.<br />
Communications Technologies Inc. Communitronics Corporation<br />
ComTrol Company Concentric Network- St. Louis<br />
Connell Communications Inc. Continental Cement Company LLC<br />
39
40<br />
<strong>Jefferson</strong> <strong>County</strong> – Section 1<br />
TABLE J18 COMMUNICATIONS<br />
Convergent Communications of St. Louis CoreExpress LLC<br />
CTitek Inc. Custom Cellular Inc.<br />
Cybercon Inc. Cyberedge Technologies<br />
Cybermill Communications Data Wiring & Systems Inc.<br />
Datacomm Research Company Dial-A-Page<br />
Dictaphone Corporation Dielmann & Associates<br />
Dietrich Lockard Group Digitized Communications Systems<br />
Double Eagle LLC Ellington Telephone Co. Inc.<br />
Empire Paging & Cellular Inc. EPC Inc.<br />
ESCO Technologies Inc. Everest Connections Corp.<br />
Everest Global Tech Group LLC Evoke Communications Inc.<br />
Executive Systems Inc. Expressive Tek<br />
Falcon Technologies Inc. Fidelity Communications Company<br />
First Internet Alliance G&D Communications Inc.<br />
<strong>Gateway</strong> City Connections <strong>Gateway</strong> Communications Group<br />
Global Crossing Graybar Electric Company Inc.<br />
GSI Inc. Honeywell Inc.<br />
ICNS Inc. Inlink Corp.<br />
Integrated Design Engineering Inc. Inter-Tel Technology Inc.<br />
Interchange Technologies Inc. Intermedia Communications Inc.<br />
Internet <strong>Gateway</strong> Inc. Intira Corporation<br />
Ionex Telecommunications Inc. Jato Communications Inc.<br />
JBM Electronics Inc. JWC Jurisprudence Wireless Communications<br />
Kataman Communications Kaufman Broadcast Services<br />
Kincaid Studios Kingdom Telephone Company<br />
L&R Paging & Cellular Inc. LaBarge Inc.<br />
Lanier Worldwide Inc. LDD Inc.<br />
New Equipment Inc. Lowry Computer Products<br />
Lucent Technologies Inc. Main Net (The)<br />
Marconi Global Service Marz Inc.<br />
Mastor Telecom Equipment Inc. Maximum Communications<br />
MCI Worldcom McLeod USA Information Technology Systems<br />
Med-Products Healthcare Inc. Metro One Telecommunications Inc.<br />
Metro Tele-Communications Inc. Metropark Communications<br />
Mid-America Telephone Systems Midwest Telecom Resellers Inc.<br />
Mobile Select Systems Inc. Mobilecom<br />
MobileComm Moore Design Group<br />
Mpower Communications MVP Cellular<br />
National Pager Services Inc. Net Impact (The)<br />
Next Wave Communications Corp. Nextel Communications Inc.<br />
Northern Telecom Inc. NorthPoint Communications<br />
Nothing But Net Inc. NuVox Communications Inc.<br />
Omnifax Division of Danka On Hold Studios Plus<br />
ONE Inc. Optitek Inc.<br />
Page Girls Inc. PageNet<br />
Paging Network of St. Louis Partner Communications & Services Inc.<br />
Phoenix Networks Inc. Phone Craft Inc.<br />
Phonetell Technologies Inc. PrivSystems Inc<br />
PSI Net Pulitzer Technologies Inc.<br />
Roberts Wireless Communications LLC Rome Net Solutions
A Regional Overview All-Hazard Mitigation Plan<br />
TABLE J18 COMMUNICATIONS<br />
SAVVIS Communications Corp. Diamond NET ISP Inc.<br />
SBC Advanced Solutions Inc. SecurityLink<br />
Shared Technologies Slingshott Communications<br />
Software Application Professionals Inc. SONACOM IT Partners<br />
Southwestern Bell Telephone Company Spectrum Resources Inc.<br />
Sprint Corporation Sprint PCS<br />
Water/Sewer<br />
<strong>Jefferson</strong> <strong>County</strong> consists of eight public water districts, ten public and six municipal water<br />
districts. Table J19 below represents the wastewater treatment plants and water supply<br />
facilities in <strong>Jefferson</strong> <strong>County</strong>.<br />
Table J19 WASTE WATER TREATMENT PLANTS IN JEFFERSON COUNTY<br />
WASTEWATER TREATMENT FACILITY LOCATION CITY<br />
Quiktrip #611 850 Mcnutt Rd Herculaneum<br />
Sieveking Inc 4636 Waldo Ind Dr High Ridge<br />
MDNR, St. Francois Mountain 2901 Hwy 61 Festus<br />
MMA, Barnhart Quarry 850 Sulfer Springs Road Barnhart<br />
FWI, Festus Quarry 838 VFW Drive Festus<br />
Central Stone Co-Cs 56 3860 Highway M Antonia<br />
H Trautman Quarry 8799 Trautman Quarry Rd Pevely<br />
House Springs Quarry 5200 Hillsboro-House Spg House Springs<br />
Lafarge-Eureka Plant Hwy W, Eureka House Springs<br />
Maclay Concrete Co Plnt#5 1160 Truman Boulevard Festus<br />
Wil-Mix Concrete Products 2219 Henson Farm Road Festus<br />
Arnold Ready Mix-Cedar Hill 8150 South Industrial Dr Cedar Hill<br />
Kleinschmidt Disposal Sit Hwy 67 & CC, 12203 St Rd Crystal City<br />
Concrete Resources Inc 4570 Hallmark Drive, Byrnes Mill House Springs<br />
Larry Church's Festus San 1770 Horine Road Festus<br />
Glen Park Quarry Koch Valley Road Pevely<br />
FWI, Trautman Asphalt 8799 Trautman Quarry Rd Pevely<br />
AAA Zoellner Materials In 5555 Old Hwy 21 Imperial<br />
Arnold Ready Mix Corp-Imp 5920 Hwy 61-67 Imperial<br />
Arnold Ready Mix Corp-Des 1508 Clark Street De Soto<br />
Concrete Resources Inc 10198 Hwy 21 Hillsboro<br />
Arch Johnston Paving/Quarry 646 Johnson Rd Festus<br />
Breckenridge Pevely Plant 8799 Trautman Quarry Rd. Pevely<br />
Pace Construction Company 3860 Hwy M Antonia<br />
Arch Johnston Pave/Quarry 12520 State Route 21 De Soto<br />
Lafarge N America, Jeff Co Hwy 141 & Hwy 21, Pauline Hills Murphy<br />
Eureka Materials Company Eureka Eureka<br />
Simpson Const Mat-Jeffers Hwy 141 Arnold<br />
H Sand & Gravel 2960 Harness Road Festus<br />
Plattin Valley Stables 3511 Plattin Festus<br />
41
42<br />
<strong>Jefferson</strong> <strong>County</strong> – Section 1<br />
Table J19 WASTE WATER TREATMENT PLANTS IN JEFFERSON COUNTY<br />
WASTEWATER TREATMENT FACILITY LOCATION CITY<br />
Plattin Valley Sand-Grav. 3161 Plattin Festus<br />
Dry Creek Sand & Gravel 10265 Hwy C Hillsboro<br />
Crystal City WTP 5 Hug's Landing Crystal City<br />
<strong>Jefferson</strong> College State Hwy 21/Viking Drive Hillsboro<br />
Laclede Gas - Hwy 21 Jeff State Hwy 21 & Viking Dr Hillsboro<br />
Teamsters Loc 688 Health 1230 Abbey Lane Pevely<br />
Lake Tishomingo Prop Owner 5699 Tishomingo Rd. Hillsboro<br />
Hssc, Otto Express Mart Otto Otto<br />
Hidden Valley Swim Pool 17409 Hidden Valley Dr Eureka<br />
Country Club Of Sugar Cr High Ridge High Ridge<br />
Beaumont Scout Swimming High Ridge High Ridge<br />
King Septic Service 8739 Byrnesville Road Cedar Hill<br />
Wallach Septic Serv, Inc 7855 Frances Roesch Rd House Springs<br />
Imperial Pumping 5301 Hwy 21 House Springs<br />
O'Brien Excavating 5430 S Byrnesville Rd House Springs<br />
Jones Plumbing Services 12011 Castle Ranch Rd De Soto<br />
All Weather Sew Serv Inc 4650a Commercial Blvd Hillsboro<br />
Rite Now Septic Cleaning 5634 Gravois House Springs<br />
Boyer Tract Cedar Hill<br />
Dittmer Meat Packing Co 9145 Ridge Road Dittmer<br />
River Cement Co-Selma Plt Highway 61/67 Festus<br />
AmerenUE, Rush Island Pp 100 Big Hollow Road Festus<br />
Doe Run, Herculaneum Smlt 881 Main Street Herculaneum<br />
Ce Nuclear Power, Llc 3300 State Road P Festus<br />
Crystal City Nitrogen Co 1000 Doolin Hollow Rd Festus<br />
De Soto WWTP 5911 Hwy P De Soto<br />
Herculaneum Sew Dist WWTP School Street Herculaneum<br />
Lake Wauwanoka Subd 48 North Lake Drive Hillsboro<br />
Summer Set Subd 43 Monte Rosa Drive De Soto<br />
Corisande Hills Subd Fenton Fenton<br />
Cherry Lane Subd Pevely Pevely<br />
Pevely WWTP Po Box 358 Pevely<br />
Woodridge Apartments 2353 Williams Cr Rd High Ridge<br />
Cedar Hill Utility Lagoon Highway F Cedar Hill<br />
South <strong>County</strong> Nursing Home 1101 <strong>West</strong> Outer 21 Rd Arnold<br />
High Ridge Shopping Cntr High Ridge High Ridge<br />
Grandview R-2 School Dist 11470 Hwy C Hillsboro<br />
Lifestyle Mhp Highway 67 South Festus<br />
<strong>County</strong> Aire Manor Mhp Oakview Dr & Graham Rd Cedar Hill<br />
Hssc, Northwest High Sch House Springs House Springs<br />
M.C.L. Mhp Festus Festus<br />
Sunny Acres Mhp 5836 Antire Rd High Ridge<br />
Lakes Of Deerwood Subd Cedar Hill Cedar Hill<br />
Edgewood Heights Subd 204 Kelly Drive Festus
A Regional Overview All-Hazard Mitigation Plan<br />
Table J19 WASTE WATER TREATMENT PLANTS IN JEFFERSON COUNTY<br />
WASTEWATER TREATMENT FACILITY LOCATION CITY<br />
Brookstone Estates Subd Hwy A Mapaville<br />
Teamsters Loc 688 Health & Medical Camp Pevely<br />
Fawn Meadows Subd Hillsboro Hillsboro<br />
Oak Ridge Trailer Court Goldman Road Hillsboro<br />
Rcsd, Rock Creek Estates PO Box 1060 Imperial<br />
Rcsd, Rhonda Sue Acres PO Box 1060 Imperial<br />
Starlight Apts. Section One High Ridge<br />
Our Lady Queen Of Peace House Springs House Springs<br />
Lake Adelle Sewer Dist 8498 Lake Drive, P.O. Box 230 Cedar Hill<br />
NPSD, Ron Rog Tp Islamorada Drive Fenton<br />
Glaize Crk Sew Dist #1 Sulphur Springs Road Barnhart<br />
Mapa Acres Mhp Meadow Drive Hillsboro<br />
Byrnes Mill Wwtf Byrnes Mill House Springs<br />
Npsd, Archview Subd Henry Drive Imperial<br />
Hillsboro, Oakwood Terrace Oakwood Terrace Subd Hillsboro<br />
Dottie's Apartments 5900-04 Antire Rd High Ridge<br />
RCSD, Godfrey Gardens Ivy Lane Festus<br />
Festus-Crystal City Stp 335 <strong>County</strong> Road Crystal City<br />
Jeff Co Public Library Nw High Ridge High Ridge<br />
Mapaville Meadows Subd St 105 Meadow Lane Festus<br />
<strong>Jefferson</strong> Co Jr College Highway 21 North Hillsboro<br />
RCSD, Spanish Manor Mhp PO Box 1060 Imperial<br />
Crest Manor Mhp Hwy 30 House Springs<br />
Rose Cliff Mhp Highway PP High Ridge<br />
Walker Hill Mhc 4128 Fountain City Road De Soto<br />
Woodglen Apts RR #2 Arnold<br />
Hillsboro Ww Reclam Plnt Hwy BB Hillsboro<br />
Blue Fountain Mhp Highway 61 Festus<br />
Laurel Acres Mhp Antire Rd High Ridge<br />
Sycamore Green Acres Mhp 44 Sycamore Green Acres Dittmer<br />
Koa, Selsor Developmnt Grp Barnhart Barnhart<br />
Athena Elem Sewage Plant 3775 Athena School Road De Soto<br />
Chapel Hill Mhp Hwy 21 Hillsboro<br />
Cedar Trails Mhp Festus Festus<br />
Bel Air Estates Mhp Cedar Hill Cedar Hill<br />
Fisher Commercial Area 6097 S Lakeshore Dr. Hillsboro<br />
Rcsd, <strong>West</strong> Elm Stp 1524 Warren Road Imperial<br />
Parc Greenwood Mhp 3724 Jarvis Hillsboro<br />
Sandia Heights Mhp Subd Hillsboro Hillsboro<br />
Ev's Plaza Shopping Centr 5436 Hwy 21 Imperial<br />
Rcsd, Seckman Valley Wwtp Mayberry Drive Imperial<br />
Rcsd, New Towne Wwtp Arnold Arnold<br />
NPSD, Williams Creek WWTP Harter Farm Road High Ridge<br />
Brookshire Court Apts Highway 21 Arnold<br />
43
44<br />
<strong>Jefferson</strong> <strong>County</strong> – Section 1<br />
Table J19 WASTE WATER TREATMENT PLANTS IN JEFFERSON COUNTY<br />
WASTEWATER TREATMENT FACILITY LOCATION CITY<br />
Selma Village Festus Festus<br />
Verda Vista Apts Old Hwy. 21 Imperial<br />
Sir Thomas Manor Apts Fenton Fenton<br />
Imperial Homes 6207 S Outer Rd Imperial<br />
Lake Tamarac Subd Cedar Hill Cedar Hill<br />
Mockingbird Subdivision Hillsboro Hillsboro<br />
Toulon Heights Subd 2910 Hwy A Festus<br />
Hi-Land Mhc 3355 Lemehl Drive De Soto<br />
Forest Hill Manor Mhp 7948 W Forest Hill Dr Dittmer<br />
NPSD, Pere Cliff Mhp Pere Cliff Drive High Ridge<br />
Paradise Estates Mhp 1-A Paradise Estates Cedar Hill<br />
Opal's Restaurant Hillsboro Hillsboro<br />
El Chaparrel Estates Subd Cedar Hill Cedar Hill<br />
Hydeaway Mhp 1015 Hydeaway Court Fenton<br />
Big Valley Mhc 111 Big Valley Circle Fenton<br />
Baisch Nursing Center 3260 Baisch Drive De Soto<br />
Country Life Acres Subd 7208 Country Life Acres Cedar Hill<br />
Lake Kinippi Subd De Soto De Soto<br />
Green Acres Mhp 4470 Gravois House Springs<br />
Murphy Ann Apts 2208 Gravois High Ridge<br />
Festus, Lambert Hills Subd Lanbert Hills Festus<br />
NPSD, Randolph Hills Jimmy Drive Arnold<br />
Plattin Primary School 2400 Hwy 61 Festus<br />
Dev Serv Of <strong>Jefferson</strong> Cty State Hwy A Mapaville<br />
Meramec Sewer Company Tibet Drive Fenton<br />
Pembroke Park Apartments Pembroke Lane High Ridge<br />
NPSD, Crystal Hills Stf Dogwood Drive High Ridge<br />
Leonard Mobile Home Park 8540 Hwy 21 Hillsboro<br />
Golden Acres Mhp House Springs House Springs<br />
NPSD, Terry Jean Acres WW Terry Jean Acres Fenton<br />
Young Subdivision Young Drive Fenton<br />
Cedar Grove Mhp Cedar Dr Imperial<br />
Maple Grove Elem School 7887 Dittmer Ridge Rd Dittmer<br />
Sunrise R-9 Elem School 4485 Sunrise School Road De Soto<br />
Griffith's First Addition Pevely Pevely<br />
Laddie Boys Restaurant 2595 Highway 61 South Festus<br />
RCSD, Country Club Manor Hwy 21 Imperial<br />
Arbor Place Of Festus 12827 Hwy TT Festus<br />
Twin Gables Mhp 2335 Highway 61 Festus<br />
Arnold-Church Of Nazarene 3651 Telegraph Road Arnold<br />
H R Electronics 6217 Highway PP High Ridge<br />
Mcarthy Homesites #2 Branson Drive Fenton<br />
NPSD, Hwy 141 Stp Flood Drive Fenton<br />
Hilltop Mobile Home Est 9549 <strong>East</strong> Vista Drive Hillsboro
A Regional Overview All-Hazard Mitigation Plan<br />
Table J19 WASTE WATER TREATMENT PLANTS IN JEFFERSON COUNTY<br />
WASTEWATER TREATMENT FACILITY LOCATION CITY<br />
NPSD, Walnut Ridge Stf Walnut Valley Drive High Ridge<br />
Country Air Est/Retiremen Route JJ Valles Mines<br />
Monticello Estates #2 Sub Festus Festus<br />
Engineered Coil Company BA Marlo Coil, 6060 Hwy Pp High Ridge<br />
Cedar Hill Fpd 6766 Cedar Hill Road Cedar Hill<br />
Mdese, Mapaville St Sch Hwy A, Box 58 Mapaville<br />
Elderly Housing Prtnrshp House Springs House Springs<br />
NPSD, Antire Springs Plnt 1411 Horseshoe Bend High Ridge<br />
Rainree Plantation Hillsboro Hillsboro<br />
<strong>Jefferson</strong> Co Pwsd #2 Highway Pp High Ridge<br />
Swiss Lodge Apartments 4740 Tishomingo Road Hillsboro<br />
RCSD, Seckman School Hwy I-55 Imperial<br />
HSSC, House Spgs Mid Sch Hwy MM House Springs<br />
Saint-Gobain Containers Pevely Pevely<br />
HSSC, Echo Valley Est Echo Valley Mhp House Springs<br />
Valle Lake Sewer District 3817 Roberts Dr De Soto<br />
Gas N' Stuff 2599 South Hwy 141 Fenton<br />
Olympian Village Wwtp 205 Kronos Drive De Soto<br />
Caeser's Mhc 2902 Clay Drive De Soto<br />
Lake Virginia Subd E Lag Hematite Hematite<br />
Camp Sunnyhill Adventure 6555 Sunlit Way Dittmer<br />
C. Edward Boyer Prop, Inc Highway 30 & Pp High Ridge<br />
Manderley Court Mhp Hwy 61 Festus<br />
Mapaville Meadows Subd 2 117 Meadow Lane Festus<br />
<strong>Jefferson</strong> Woods Subd 4363 <strong>Jefferson</strong> Drive Hillsboro<br />
Timber Creek Resort 4800 Us Highway 67 De Soto<br />
HSSC, Bear Creek Estates Briarwood Dr House Springs<br />
HSSC, Woodridge Estates House Springs House Springs<br />
Country Trail Estates Mhp Barnhart Barnhart<br />
Austin Trails Isaac Way Cedar Hill<br />
Cedar Hill Util, Sand Cr Hwy 30 Cedar Hill<br />
Hazelwood Court Mhp 9200 Hazelwood Drive Pevely<br />
Victory Christian Felwshp #1 Victory Drive Pevely<br />
Mari-Mar Mhp 7394 Highway 21 Barnhart<br />
Power Model Supply Co. 13260 Summit Dr De Soto<br />
RCSD, Oak Pointe Subd Stp PO Box 1060 Imperial<br />
HSSC, Pine Grove Manor House Springs House Springs<br />
Oakland Manor Mhp Oakland Lane, Hwy Tt Festus<br />
Pioneer Trail Subd 153 Pioneer Trail Hillsboro<br />
Secluded Forest Subd Cedar Hill Cedar Hill<br />
NPSD, Hunning Hills Stp Hunning Hills High Ridge<br />
Byrnes Mill Mhp Byrnes Mill House Springs<br />
Wedgewood Village-Plat 2 Highway Bb Cedar Hill<br />
RCSD, Kimmswick Wwtp 6000 Mississippi Ave Kimmswick<br />
45
46<br />
<strong>Jefferson</strong> <strong>County</strong> – Section 1<br />
Table J19 WASTE WATER TREATMENT PLANTS IN JEFFERSON COUNTY<br />
WASTEWATER TREATMENT FACILITY LOCATION CITY<br />
Meramec Hts Shopng Center Old Hwy 21 & Rock Cr Arnold<br />
Sennawood Village Subd Kellywood Drive Cedar Hill<br />
Arnold Professional Park 2343 Church Road Arnold<br />
Lake Cattails Subdivision Hwy F Pacific<br />
Happy Hollow Mhp Festus Festus<br />
HSSC, Meadow Brook Estate Brookstone Drive House Springs<br />
RCSD, Forest Ridge Subd Imperial Imperial<br />
Greer's Mobile Home Park 10043 Hwy JJ Valles Mines<br />
Natchez Estates Apts Gravois Rd High Ridge<br />
HSSC, Sycamore Spgs Mhp Cripple Creek Rd House Springs<br />
Festus Airport Lagoon Crystal City Crystal City<br />
HSSC, Cedar Spgs Elem Sch House Springs House Springs<br />
Pine Ford Village Mhp Highway H De Soto<br />
NPSD, Country Club Sugar Highway 30 High Ridge<br />
Athena Center Highway V De Soto<br />
Lakewood Trails Tp 63 Lake Trails Hillsboro<br />
Feed My People #1 Miracle Drive High Ridge<br />
Pony Bird Inc Pony Bird Lane Mapaville<br />
RCSD, Suburban Auto Auctn 6405 Hwy 61-67 Imperial<br />
Creekside Retirement Home Po Box 157, 4077 Wedde Rd Barnhart<br />
Sunrise Acres Subd Graham Road Cedar Hill<br />
NPSD, Paradise Valley Oak Bluff Drive High Ridge<br />
Jeff Co Comm For Handicap Baptist Park Rd Mapaville<br />
Cedar Grove Mhp Hwy 30 Dittmer<br />
Lakewood Care Center English Road Pacific<br />
Granada Meadows Wwtp Granada Circle Hillsboro<br />
Tesson Hills Apartments 22 Tesson Hills Arnold<br />
Jeffco Landfill Old Hwy 21 Arnold<br />
Seven Springs/Twin Lakes River Bend Drive High Ridge<br />
Byrnes Mill S Wwtp Lower Byrnes Mill Rd House Springs<br />
Union Pac RR Desoto Car S 491 N Main St De Soto<br />
Berwin Business Center 2093 Highway 67 Festus<br />
Festus,Ashford Place Wwtf Gamel Cemetery Road Festus<br />
Walker Car Wash 12991 Hwy 21 De Soto<br />
Richard Jakoubek Mhp 10031 State Hwy Jj Valles Mines<br />
Festus, Green Brier Est. Camel Cemetery Road Festus<br />
Palisades Village Subd Hwy F Pacific<br />
Mo National Guard-Festus 2740 Highway P<br />
7890 Dittmer Ridge Road, Church<br />
Festus<br />
St Martin's United Church<br />
Of Christ Dittmer<br />
Briarwood Estates Stone Gate Drive De Soto<br />
Festus, Northwoods Stp Gamel Cemetery Road Festus<br />
Festus, Interim <strong>West</strong> Tp Old Hwy "A" Festus<br />
Sand Castle Subdivision Route Z Pevely
A Regional Overview All-Hazard Mitigation Plan<br />
Table J19 WASTE WATER TREATMENT PLANTS IN JEFFERSON COUNTY<br />
WASTEWATER TREATMENT FACILITY LOCATION CITY<br />
Koller-Craft Plastic Prod 1400 S Highway 141 Fenton<br />
Meadowbrook Valley Estate Meadowbrook Valley Dr House Springs<br />
Winterwood Subdivision Lynch Road House Springs<br />
Teen Challenge - St Louis 2650 Appletree Acres High Ridge<br />
Crystal City -Williamsburg Williamsburg Drive Crystal City<br />
HSSC, Miller Crossing Wtf Miller Road House Springs<br />
Persimmon Point Drwbrdg E Round Table Drive Hillsboro<br />
HSSC, Fisher Rd 6140 Fisher Ed House Springs<br />
Lion's Den Outdoor Lrng 3602 Lions Den Dr. Imperial<br />
Unimin Corp-Pevely Sand P 2968 Hwy Pevely<br />
Crystal City 130 Mississippi Ave Crystal City<br />
Desoto 17 Boyd St De Soto<br />
Festus 711 W Main St Festus<br />
Herculaneum #1 Parkwood Court Herculaneum<br />
Hillsboro PO Box 19 Hillsboro<br />
Pevely PO Box 358 Pevely<br />
Cedar Hill Lakes Village 7315 Twin Ridge Cedar Hill<br />
<strong>Jefferson</strong> Co PWSD #1 PO Box 646 Arnold<br />
<strong>Jefferson</strong> Co PWSD #2 195 Old Sugar Creek Rd High Ridge<br />
<strong>Jefferson</strong> Co PWSD #3 1469 Old Highway 21 Arnold<br />
<strong>Jefferson</strong> Co Cons PWSD C-1 Po Box 430 Barnhart<br />
<strong>Jefferson</strong> Co PWSD # 5 13261 State Road Cc De Soto<br />
<strong>Jefferson</strong> Co PWSD # 6 PO Box 218 House Springs<br />
<strong>Jefferson</strong> Co PWSD # 7 PO Box 160 Mapaville<br />
<strong>Jefferson</strong> Co PWSD # 8 PO Box 170 Cedar Hill<br />
<strong>Jefferson</strong> Co PWSD #10 PO Box 910 Imperial<br />
<strong>Jefferson</strong> Co PWSD #12 12301 Highway Tt Festus<br />
Lake Forest Properties PO Box 54 Wentzville<br />
South Shore Water Assn 2395 S Lakeshore Pacific<br />
Briarwood Lake Development 1132 Churchill Rd De Soto<br />
Frimel Water System, Inc 3737 Dennis Dr Imperial<br />
Summerset Subd 43 Monte Rosa Dr De Soto<br />
Ficken Hill Subd PO Box 138 Cedar Hill<br />
Lakewood Hills Subd 5108 Dulin Creek Rd House Springs<br />
Seven Springs Subd PO Box 270251 St Louis<br />
High Ridge Manor Subd 5108 Dulin Creek Rd House Springs<br />
Woodridge Apartments 2404 Williams Creek Rd Apt 84 High Ridge<br />
Scotsdale Subd 5108 Dulin Creek Rd House Springs<br />
Lake Adelle Subd PO Box 26 Cedar Hill<br />
Lake Montowese 3676 S Lakeshore Dr House Springs<br />
Sunrise Lakes Subd PO Box 70 Valles Mines<br />
Meadow Drive Subd 2120 Meadow Dr High Ridge<br />
Valle Lake Subd 3806 Roberts Dr De Soto<br />
Warren Woods Subd 5108 Dulin Creek Rd House Springs<br />
47
48<br />
<strong>Jefferson</strong> <strong>County</strong> – Section 1<br />
Table J19 WASTE WATER TREATMENT PLANTS IN JEFFERSON COUNTY<br />
WASTEWATER TREATMENT FACILITY LOCATION CITY<br />
Frontier Estates 37 Wagonwheel Trail Fenton<br />
Ware Lake Subd 11963 Ware Lake Rd Dittmer<br />
Fairways Water And Sewer Assn. 1825 Deer Run Trail Pacific<br />
Block Six Water Assn 2380 Highway F Pacific<br />
Paradise Valley Subd PO Box 775 High Ridge<br />
Raintree Plantation 1519 Mcnutt Herculaneum<br />
Antire Springs Subd 1453 Creekside High Ridge<br />
Pacific Heights Subd 221 High St Pacific<br />
Big Valley Court 111 Big Valley Circle Fenton<br />
Walker Hill Mhp 4128 Fountain City Rd De Soto<br />
Lakehurst Mhp 2004 Gravois High Ridge<br />
Sycamore Green Acres Mhp 44 Sycamore Green Acres Dittmer<br />
Scenic View Mhp 2 Scenic View Ct Arnold<br />
Woodhurst Mhp 2808 Schumacher Ln High Ridge<br />
Forest Hill Mhp 7948 W Forest Hill Dr Dittmer<br />
Paradise Estates Mhp La Paradise Estates Cedar Hill<br />
Leonards Mobile Home Park 7900 Tower Rd Hillsboro<br />
D & J Mhp 409 Sunshine Dr Festus<br />
Laurel Acres Mhp 2174 Laurel Dr High Ridge<br />
Hilltop Mobile Home Estates 9415 Dorisann Ct Affton<br />
Life Style Mhp 938 Meramec Festus<br />
A & H Country Estates Inc 6118 Jo Drive House Springs<br />
Valle Acres Mhp 1607 Creightonwood High Ridge<br />
Electricity and Natural Gas<br />
Ameren UE operates 18 power-generating plants, with five located in the region and<br />
Illinois Power operates six, with three located in the region. The total capability for all<br />
power plants is 12,769 megawatts. Refer to Figures J 12 and J13 below.<br />
Electricity Deregulation<br />
In late 1997, Illinois lawmakers passed landmark legislation that changed the way<br />
electricity will be bought and sold across the state. Deregulation was phased in for<br />
industrial and commercial customers from October 1999 to May 2002. Electricity<br />
customers are benefiting from the legislation because of new services, additional choices,<br />
and lower prices. Residential customers will be able to take advantage of deregulation<br />
beginning in 2006.<br />
Electricity/Gas Providers<br />
Ameren UE<br />
1901 Chouteau Ave.
A Regional Overview All-Hazard Mitigation Plan<br />
St. Louis, Missouri 63103<br />
314-621-3222<br />
Serves Missouri portion of region<br />
FIGURE J12 AMEREN UE COVERAGE<br />
Source: Ameren UE<br />
Laclede Gas Company<br />
720 Olive Street<br />
St. Louis, Missouri 63101<br />
314-342-0500<br />
Serves Missouri portion of region<br />
FIGURE J13 LACLEDE GAS COVERAGE<br />
Source: Laclede Gas<br />
49
50<br />
Solid Waste Disposal<br />
<strong>Jefferson</strong> <strong>County</strong> – Section 1<br />
<strong>Jefferson</strong> <strong>County</strong> is a part of the St. Louis-<strong>Jefferson</strong> Solid Waste Management District. The<br />
following list identifies those waste providers for the municipalities identified. See Table<br />
J20 below.<br />
Jurisdiction<br />
TABLE J20 SOLID WASTE DISPOSAL<br />
Municipal<br />
Directory Waste Provider Provider Address Provider City<br />
<strong>Jefferson</strong> Arnold Midwest Waste<br />
Midwest Waste,<br />
Waste Mngt, M<br />
& M Hauling<br />
12976 St. Charles<br />
Rock Rd. Bridgeton<br />
12976 St. Charles<br />
Rock Rd Bridgeton<br />
<strong>Jefferson</strong> Byrnes Mill<br />
<strong>Jefferson</strong> Cedar Hill Lakes<br />
City of Crystal<br />
<strong>Jefferson</strong> Crystal City City<br />
Waste<br />
130 Mississippi Ave Crystal City<br />
<strong>Jefferson</strong> De Soto Management<br />
Waste<br />
7320 Hall St St. Louis<br />
<strong>Jefferson</strong> Festus Management 7320 Hall St St. Louis<br />
<strong>Jefferson</strong> Herculaneum Republic Waste 18716 State Hwy 177 Jackson<br />
<strong>Jefferson</strong> Hillsboro Republic Waste 18716 State Hwy 177 Jackson<br />
<strong>Jefferson</strong> Kimmswick<br />
Midwest Waste,<br />
Kraemer<br />
Hauling<br />
12976 St. Charles<br />
Rock Rd Bridgeton<br />
<strong>Jefferson</strong><br />
Olympian<br />
Village Republic Waste 18716 State Hwy 177 Jackson<br />
<strong>Jefferson</strong> Parkdale<br />
Waste<br />
<strong>Jefferson</strong> Pevely Management 7320 Hall St St. Louis<br />
<strong>Jefferson</strong> Scotsdale<br />
Solid Waste<br />
Franklin St. Clair Solutions P.O. Box 228 St. Clair<br />
Franklin Sullivan CWI of Missouri 18716 State Hwy 177<br />
12976 St. Charles<br />
Jackson<br />
Franklin Union Midwest Waste Rock Rd<br />
City of<br />
Bridgeton<br />
Franklin Washington Washington 405 <strong>Jefferson</strong> Washington<br />
In 1989-1990, there were 13 sanitary landfills in the St. Louis metropolitan area (Missouri-<br />
Illinois), which includes the District, with an estimated remaining lifespan of 8.8 years. One<br />
landfill was publicly owned. By 1995-1996, there were seven sanitary landfills in the<br />
region: three in Missouri and four in Illinois. All landfills are now privately owned and<br />
operated. Since 1989-1990, six sanitary landfills have closed and one has been<br />
decommissioned. In the last two years a privately owned landfill in St. Clair <strong>County</strong>, Illinois<br />
has opened. See Table J21 below.
A Regional Overview All-Hazard Mitigation Plan<br />
TABLE J21 2000 LANDFILLS IN REGION<br />
Landfill <strong>County</strong> State<br />
Allied Sanitation - Bridgeton St. Louis Missouri<br />
Fred Weber St. Louis Missouri<br />
Superior Oak Ridge St. Louis Missouri<br />
Allied Sanitation - Roxana Madison Illinois<br />
WMI - Chain of Rocks Madison Illinois<br />
WMI - Milam St. Clair Illinois<br />
WMI - Marissa St. Clair Illinois<br />
Source: The Genesis Group for the St. Louis-<strong>Jefferson</strong> Solid Waste Management District<br />
Law Enforcement<br />
The <strong>Jefferson</strong> <strong>County</strong> Sheriff’s Department includes 196 officers. In addition, Crystal City<br />
has 20 officers, DeSoto has 19 officers, Festus has 29 officers, Hillsboro has 14 officers,<br />
Kimmswick has 6 officers, Pevely has 22 officers, Herculaneum has 17 officers, Byrnes Mill<br />
has 15 officers, Arnold has 46 officers, and Olympian Village has 2 officers. The<br />
departments participate in mutual aid agreements with all incorporated areas within the<br />
county. <strong>Jefferson</strong> <strong>County</strong> officers working in the north zone are headquartered out of High<br />
Ridge. Officers working in the south zone are headquartered out of Hillsboro. Officers<br />
working out of the east zone are headquartered out of Imperial.<br />
Emergency Services (911)<br />
Emergency management for <strong>Jefferson</strong> <strong>County</strong> is conducted and coordinated by the<br />
<strong>Jefferson</strong> <strong>County</strong> Emergency Management & Public Information Office. They protect,<br />
preserve and enhance the quality of life of county residents by working with the<br />
community in managing the mitigation of, preparedness for, response to, and recovery<br />
from natural and technological disasters and intentional destructive acts, staying focused<br />
on the preservation of: the lives and health of citizens, the environment within which they<br />
live, and their property. They accomplish this mission by cooperating with participating<br />
agencies, municipalities, organizations, industries and media, then providing the citizens of<br />
the county with information to prepare for and recover from disasters.<br />
The Department of Administration is primarily responsible for staff functions within the<br />
<strong>County</strong> and consists of two staff offices and three line divisions. The functional areas of the<br />
department are the Office of the Contracts and Grants Administrator, the Office of<br />
Emergency Management and Public Information Administrator, the Division of Human<br />
Resources, the Division of General Services, and the Division of Animal Control. The<br />
address for the Emergency Management Office is the <strong>Jefferson</strong> <strong>County</strong> Courthouse<br />
Basement, 300 Main Street, Hillsboro, MO 63050.<br />
51
52<br />
Emergency Medical Services<br />
<strong>Jefferson</strong> <strong>County</strong> – Section 1<br />
The Joachim-Plattin Ambulance District protects 63000 people living in an area of 180<br />
square miles that operates out of two stations that protect a primarily residential area. The<br />
district is a public department whose members are on a paid status.<br />
Joachim Plattin Ambulance District (JPAD) provides emergency and non-emergency medical<br />
care and transport to the south-eastern region of <strong>Jefferson</strong> <strong>County</strong>, Missouri (approx 30<br />
miles south of St. Louis). JPAD began providing service in September 1975. The district<br />
includes a wide range of demographics from rural farming areas, to small cities and areas<br />
of heavy industry. JPAD spans across nine separate fire districts and five different police<br />
departments (including <strong>Jefferson</strong> <strong>County</strong> Sheriff's Department). As our district continues to<br />
develop, JPAD is ever advancing its services to better meet the needs of the community.<br />
<strong>Jefferson</strong> <strong>County</strong> has seven ambulance districts that include the following:<br />
• Big River Ambulance District: P.O. Box 348, Cedar Hill, MO<br />
• Joachim-Plattin Townships Ambulance District: 619 Collins Drive, Festus, Mo<br />
• North <strong>Jefferson</strong> county Ambulance District: P.O. Box 233, High Ridge, MO<br />
• Rock Township Ambulance District: P.O. Box 629, Arnold, MO<br />
• Valle Ambulance District: 12363 Highway 21, Desoto, MO<br />
• Meramec –Ambulance District- House 1 (Unit 8517) 429 <strong>East</strong> Osage, Pacific MO<br />
63069; House 2 (Unit 8527) 3279 Highway 100, Villa Ridge MO.; House, 31768<br />
Highway O, Robertsville, MO. 63072<br />
• Eureka Fire Protection and Ambulance District– House 1, 1060 Hwy W; House 2,<br />
1815 W 5 th ; House 3, 3571 Wright Oak School Rd.<br />
Fire Protection<br />
The following 19 fire protection districts provide fire services for the county:<br />
• Antonia Fire Protection District<br />
• Cedar Hill Fire Protection District<br />
• Crystal City Volunteer Fire Department<br />
• Desoto City Fire and Rescue<br />
• Desoto Rural Fire Protection District<br />
• Dunklin Fire Protection District<br />
• Eureka Fire Protection District<br />
• Goldman Fire Protection District<br />
• Hematite Fire Protection<br />
• Herculaneum fire Department<br />
• High Ridge Fire Protection District<br />
• Hillsboro Fire Protection District<br />
• <strong>Jefferson</strong> R-7 Fire Protection District
A Regional Overview All-Hazard Mitigation Plan<br />
• Mapaville Fire Protection District<br />
• Pacific Fire Protection District<br />
• Rock Community Fire Protection District<br />
• Shady Valley Fire Protection District<br />
• Springdale Fire Protection District<br />
• Festus Fire Department<br />
The districts that service the <strong>County</strong> provide the following resources in Table J22.<br />
TABLE J22 JEFFERSON COUNTY FIRE PROTECTION RESOURCES<br />
Fire Protection District Stations Vehicles Staff (Professional &<br />
Volunteer)<br />
Antonia 1 4 36<br />
Cedar Hill 3 5 66<br />
Crystal City 1 6 30<br />
DeSoto City 1 2 34<br />
DeSoto Rural 3 12 50<br />
Dunklin 1 6 30<br />
Eureka 1 N.A. 27<br />
Goldman 1 7 33<br />
Hematite 2 6 21<br />
Herculaneum 1 8 20<br />
High Ridge 3 5 58<br />
Hillsboro 2 6 38<br />
<strong>Jefferson</strong> R-7 FPD 1 N.A. 41<br />
Mapaville FPD 1 7 25<br />
Pacific 1 N.A. N.A.<br />
Rock Community FPD 4 9 64<br />
Shady Valley 1 7 29<br />
Springdale 2 6 N.A.<br />
Festus 3 10 42<br />
Underground Infrastructure<br />
Due to homeland security concerns, underground utilities are not mapped in this plan.<br />
According to the Missouri One Call System, Inc. as of April 4, 2003, the following<br />
companies maintain underground utility lines within <strong>Jefferson</strong> <strong>County</strong>. Emergency<br />
information concerning these utility lines in contained in the <strong>County</strong>’s Emergency<br />
Operations Plan. The <strong>Jefferson</strong> <strong>County</strong> Emergency Management director’s telephone<br />
number is 636-797-5381.<br />
The following companies listed in Table J23 have underground lines running through<br />
<strong>Jefferson</strong> <strong>County</strong>:<br />
TABLE J23 UNDERGROUND INFRASTRUCTURE<br />
Ameren UE AT & T Corp<br />
Broadwing Communications Cablevision, LLC<br />
53
54<br />
<strong>Jefferson</strong> <strong>County</strong> – Section 1<br />
TABLE J23 UNDERGROUND INFRASTRUCTURE<br />
Charter Citizens Electric Corp<br />
City of Arnold City of Crystal City<br />
City of DeSoto City of Eureka<br />
City of Festus City of Pevely<br />
Crawford Electric Coop, Inc House Springs Sewer Co.<br />
<strong>Jefferson</strong> Co. Public Works <strong>Jefferson</strong> Co. CPWSD -C-1<br />
<strong>Jefferson</strong> Co. PWSD 1 <strong>Jefferson</strong> Co. PWSD 10<br />
<strong>Jefferson</strong> Co. PWSD 2 <strong>Jefferson</strong> Co. PWSD 3<br />
<strong>Jefferson</strong> Co. PWSD 5 <strong>Jefferson</strong> Co. PWSD 6<br />
<strong>Jefferson</strong> Co. PWSD 7 <strong>Jefferson</strong> Co. PWSD 8<br />
KMB Utility Corp Laclede Gas Company<br />
Level 3 Communications Lightcore (DTI)<br />
MCI Worldcom Metropolitan St. Louis Sewer District<br />
Mississippi River Trans Missouri American Water Co.<br />
Missouri Natural Gas Northeast Public Sewer Dist<br />
Northeast Public Sewer Dist Phillips Pipeline Co.<br />
SBC (Southwestern Bell) Sprint Long Distance<br />
Valle Lake Sewer District<br />
The Missouri One Call utility location telephone number is 1-800-344-7483.<br />
Inventory of Key Industrial, Commercial, and Employment Facilities<br />
Relevant facilities include those that concentrate large groups of people together in a single<br />
location.<br />
Large Industrial/Commercial Centers<br />
Several major manufacturing plants, mixes of national and local companies are located<br />
within <strong>Jefferson</strong> <strong>County</strong>. The RCGA released a list of fifty key employers in the EWG<br />
planning region. None of these employers are included in <strong>Jefferson</strong> <strong>County</strong>. However,<br />
EWG maintains a list with the top 13 employers as of 1996, based on the number of<br />
employees. Below in Table J24 is a list with the cutoff criteria for this report at 200<br />
employees.<br />
TABLE J24 JEFFERSON COUNTY EMPLOYMENT CENTERS<br />
NAME ADDRESS CITY EMPLOYEES<br />
<strong>Jefferson</strong> Memorial Hospital PO Box 350,Hwy61-67 & 55 Festus 850<br />
Doe Run Company 881 Main St. Herculaneum 356<br />
Quality Temps. Inc Arnold 302<br />
Fox School District Arnold 300<br />
Union Pacific 491 N. Main DeSoto 300<br />
Ball-Foster Glass Container Co PO Box 729, Hwy 61-67 Pevely 257<br />
Windsor C-1 School District 6208 Hwy 61-67 Imperial 255<br />
Union Electric Rush Island Power Pl Festus 255<br />
Carondelet Foundry Co. Pevely 245
A Regional Overview All-Hazard Mitigation Plan<br />
TABLE J24 JEFFERSON COUNTY EMPLOYMENT CENTERS<br />
NAME ADDRESS CITY EMPLOYEES<br />
Heizer Aerospace 5841 Hwy 61-67 PO Box 165 Imperial 223<br />
Combustion Engineering Inc. 3300 State Rd PO Box 107 Hematite 213<br />
LMC Industries. Inc. 100 Manufacturers Drive Arnold 203<br />
<strong>Jefferson</strong> College 1000 Viking Drive Hillsboro 200<br />
There are approximately four industrial parks within <strong>Jefferson</strong> <strong>County</strong>. They are included in<br />
Table J25 below.<br />
TABLE J 25 JEFFERSON COUNTY INDUSTRIAL/COMMERCIAL AREAS<br />
JEFFERSON COUNTY ADDRESS NUMBER OF EMPLOYEES<br />
Gannon Retail Area 1146 Gannon Dr 1000<br />
<strong>Jefferson</strong> <strong>County</strong> Plaza N.A.<br />
<strong>Jefferson</strong> Memorial Hosp & Vicinity 900<br />
Convergys & Vicinity 1000<br />
Inventory of Housing Structures<br />
Number of Dwelling Units<br />
In <strong>Jefferson</strong> <strong>County</strong>, according to the 2000 Census, there are a total of 198,099 total<br />
housing units in the community. The number of households has been on the rise.<br />
Between 1980 and 2000 <strong>Jefferson</strong> <strong>County</strong> had an increase of 24,332 households or over<br />
51 percent. The housing in <strong>Jefferson</strong> <strong>County</strong> is relatively new. Eighty percent of the<br />
housing units in the county, 60,526 units, have been built since 1960. The greatest<br />
increase in housing units occurred since 1980 with 33, 664 units (45 percent of the total<br />
units in the past 20 years). Almost 84 percent of the housing units in 2000 were owner<br />
occupied.<br />
Average Unit Cost<br />
The average dwelling unit cost (including rental properties) for <strong>Jefferson</strong> <strong>County</strong> is $91,690.<br />
Total Inventory of Structures<br />
The total <strong>Jefferson</strong> <strong>County</strong> assessed valuation for the year 2000, including both real estate<br />
and personal property was $1,863,308,707. According to Missouri Department of<br />
Revenue. State assessed utilities accounted for $151,536,040.<br />
TABLE J26 Inventory of Structures<br />
Parcel Classification Total Assessed # of Records Average Assessed<br />
Commercial & Agricultural $1,468,600 32 $45,893.75<br />
55
56<br />
<strong>Jefferson</strong> <strong>County</strong> – Section 1<br />
TABLE J26 Inventory of Structures<br />
Parcel Classification Total Assessed # of Records Average Assessed<br />
Commercial & Agricultural & Residential $4,333,900 30 $144,463.33<br />
Agricultural Vacant $2,598,700 1903 $1,365.58<br />
Agricultural $630,400 255 $2,472.16<br />
Commercial $271,718,000 2089 $130,070.85<br />
Commercial Vacant $15,239,400 350 $43,541.14<br />
Residential $1,006,396,400 61942 $16,247.40<br />
Residential Vacant $44,626,200 16819 $2,653.32<br />
Commercial & Residential $43,678,100 602 $72,554.98<br />
Cities and Villages<br />
Below is a listing of the municipalities within <strong>Jefferson</strong> <strong>County</strong>. This information is based<br />
on the results of the capabilities questionnaires sent out to all of the jurisdictions. Included<br />
in this listing is demographic statistics, municipal information on mitigation policies,<br />
programs and regulations, as well as asset data. Blanks in the database indicate that the<br />
municipality did not respond to the question.<br />
Cities and Villages<br />
<strong>Jefferson</strong> <strong>County</strong> unincorporated<br />
Total population 145,820<br />
Classification 1st Class<br />
Leadership structure Commissioner<br />
Median household income, 1999 $48,470<br />
Total housing units 54,506<br />
Housing unit, median year built<br />
Median gross rent $504<br />
Median owner-occupied housing value $102,081<br />
Master plan yes-'03<br />
Emergency Operations Plan yes<br />
Zoning regulations yes<br />
Building regulations BOCA '96<br />
Subdivision regulations yes<br />
Stormwater regulations yes<br />
Floodplain regulations yes- 2'<br />
Water service Water Districts; individual<br />
Sewer service Sewer Districts; individual<br />
Electric service AmerenUE<br />
Natural gas service MO NG<br />
Fire service multiple<br />
Ambulance service multiple<br />
Arnold<br />
Total population 19,965+C427+C1795<br />
Classification City-3rd class
A Regional Overview All-Hazard Mitigation Plan<br />
Cities and Villages<br />
Leadership structure Mayor/<strong>Council</strong><br />
Median household income, 1999 $47,188<br />
Total housing units 7913<br />
Housing unit, median year built 1972<br />
Median gross rent $575<br />
Median owner-occupied housing value $97,500<br />
Master plan yes<br />
Emergency Operations Plan yes<br />
Zoning regulations yes<br />
Building regulations IBC 2000; #7.30<br />
Subdivision regulations yes<br />
Stormwater regulations yes<br />
Floodplain regulations Zoning sec 6;art 5.76-5.97;ord 7.5, sec5-13<br />
Water service PWSD #1<br />
Sewer service PWSD #10<br />
Electric service AmerenUE<br />
Natural gas service Midwest MO Gas<br />
Fire service RockCom FPD<br />
Ambulance service RockTNAD<br />
Byrnes Mill<br />
Total population 1172<br />
Classification City-4th class<br />
Leadership structure Mayor/<strong>Council</strong><br />
Median household income, 1999 $51,211<br />
Total housing units 935<br />
Housing unit, median year built 1985<br />
Median gross rent $484<br />
Median owner-occupied housing value $121,600<br />
Master plan yes-'91<br />
Emergency Operations Plan yes<br />
Zoning regulations yes<br />
Building regulations IBC 2000<br />
Subdivision regulations yes<br />
Stormwater regulations yes<br />
Floodplain regulations yes<br />
Water service PWSD #1; PWSD #10<br />
Sewer service Byrnes Mill<br />
Electric service AmerenUE<br />
Natural gas service Laclede<br />
Fire service High Ridge FPD<br />
Ambulance Big River AD<br />
Cedar Hill Lakes<br />
Total population 229<br />
Classification Village<br />
Leadership structure Bd of trustees<br />
Median household income, 1999 $54,375<br />
Total housing units 95<br />
57
58<br />
Cities and Villages<br />
Housing unit, median year built 1962<br />
Median gross rent $483<br />
Median owner-occupied housing value $67,500<br />
Master plan<br />
Emergency Operations Plan<br />
Zoning regulations<br />
Building regulations<br />
Subdivision regulations<br />
Stormwater regulations<br />
Floodplain regulations<br />
Water service community well; indiviual wells<br />
Sewer service individual<br />
Electric service AmerenUE<br />
Natural gas service none<br />
Fire service Cedar Hill FPD<br />
Ambulance service Big River AD<br />
Crystal City<br />
Total population 4247<br />
Classification City-3rd class<br />
Leadership structure Mayor/<strong>Council</strong><br />
Median household income, 1999 $36,117<br />
Total housing units 1,769<br />
Housing unit, median year built 1955<br />
Median gross rent $452<br />
Median owner-occupied housing value $85,400<br />
Master plan yes<br />
Emergency Operations Plan yes<br />
Zoning regulations yes<br />
Building regulations IBC 2000; #1374<br />
Subdivision regulations yes<br />
Stormwater regulations yes<br />
Floodplain regulations #1096<br />
Water service Crystal City<br />
Sewer service Crystal City<br />
Electric service AmerenUE<br />
Natural gas service MO NG<br />
Fire service Crystal City FD<br />
Ambulance service JPT AD<br />
Desoto<br />
Total population 6375<br />
Classification City-3rd class<br />
Leadership structure Mayor/<strong>Council</strong><br />
Median household income, 1999 $30,725<br />
Total housing units 2741<br />
Housing unit, median year built 1954<br />
Median gross rent $406<br />
Median owner-occupied housing value $67,200<br />
<strong>Jefferson</strong> <strong>County</strong> – Section 1
A Regional Overview All-Hazard Mitigation Plan<br />
Cities and Villages<br />
Master plan yes-'60<br />
Emergency Operations Plan yes<br />
Zoning regulations yes<br />
Building regulations BOCA 2000<br />
Subdivision regulations yes<br />
Stormwater regulations yes<br />
Floodplain regulations yes<br />
Water service Desoto<br />
Sewer service Desoto<br />
Electric service AmerenUE<br />
Natural gas service MO NG<br />
Fire service Desoto F&R<br />
Ambulance service Valle AD<br />
Festus<br />
Total population 9660<br />
Classification City-3rd class<br />
Leadership structure Mayor/<strong>Council</strong><br />
Median household income, 1999 $36,687<br />
Total housing units 4,040<br />
Housing unit, median year built 1966<br />
Median gross rent $474<br />
Median owner-occupied housing value $87,300<br />
Master plan Yes- -'03<br />
Emergency Operations Plan yes<br />
Zoning regulations yes<br />
Building regulations IBC 2000; #716<br />
Subdivision regulations yes<br />
Stormwater regulations yes<br />
Floodplain regulations Chap 11<br />
Water service Festus<br />
Sewer service Festus<br />
Electric service AmerenUE<br />
Natural gas service MO NG<br />
Fire service Festus FD<br />
Ambulance service JPT AD<br />
Herculaneum<br />
Total population 2805<br />
Classification City-4th class<br />
Leadership structure Mayor/<strong>Council</strong><br />
Median household income, 1999 $40,365<br />
Total housing units 1078<br />
Housing unit, median year built 1964<br />
Median gross rent $582<br />
Median owner-occupied housing value $87,400<br />
Master plan<br />
Emergency Operations Plan<br />
Zoning regulations<br />
59
60<br />
Cities and Villages<br />
Building regulations<br />
Subdivision regulations<br />
Stormwater regulations<br />
Floodplain regulations<br />
Water service Herculaneum<br />
Sewer service Herculaneum<br />
Electric service AmerenUE<br />
Natural gas service MO NG<br />
Fire service Herculaneum FD<br />
Ambulance service JPT AD<br />
Hillsboro<br />
Total population 1675<br />
Classification City-4th class<br />
Leadership structure Mayor/<strong>Council</strong><br />
Median household income, 1999 $36,850<br />
Total housing units 620<br />
Housing unit, median year built 1971<br />
Median gross rent $501<br />
Median owner-occupied housing value $93,800<br />
Master plan yes<br />
Emergency Operations Plan yes<br />
Zoning regulations yes<br />
Building regulations yes<br />
Subdivision regulations yes<br />
Stormwater regulations yes<br />
Floodplain regulations yes<br />
Water service Hillsboro<br />
Sewer service Hillsboro<br />
Electric service AmerenUE<br />
Natural gas service MO NG<br />
Fire service Hillsboro FPD<br />
Ambulance service Valle AD<br />
Kimmswick<br />
Total population 94<br />
Classification City-4th class<br />
Leadership structure Mayor/<strong>Council</strong><br />
Median household income, 1999 $54,688<br />
Total housing units 36<br />
Housing unit, median year built pre1940<br />
Median gross rent $650<br />
Median owner-occupied housing value $121,400<br />
Master plan<br />
Emergency Operations Plan<br />
Zoning regulations<br />
Building regulations<br />
Subdivision regulations<br />
Stormwater regulations<br />
<strong>Jefferson</strong> <strong>County</strong> – Section 1
A Regional Overview All-Hazard Mitigation Plan<br />
Cities and Villages<br />
Floodplain regulations<br />
Water service PWSD #10<br />
Sewer service<br />
Electric service AmerenUE<br />
Natural gas service none<br />
Fire service RockCom FPD<br />
Ambulance service RockTNAD<br />
Olympian Village<br />
Total population 669<br />
Classification City-4th class<br />
Leadership structure Mayor/<strong>Council</strong><br />
Median household income, 1999 $41,447<br />
Total housing units 232<br />
Housing unit, median year built 1974<br />
Median gross rent $467<br />
Median owner-occupied housing value $72,800<br />
Master plan<br />
Emergency Operations Plan<br />
Zoning regulations<br />
Building regulations<br />
Subdivision regulations<br />
Stormwater regulations<br />
Floodplain regulations<br />
Water service PWSD #5<br />
Sewer service Olympian Village<br />
Electric service AmerenUE<br />
Natural gas service MO NG<br />
Fire service <strong>Jefferson</strong> R-7 FPD<br />
Ambulance service Valle AD<br />
Parkdale<br />
Total population 205<br />
Classification Village<br />
Leadership structure Bd of Trustees<br />
Median household income, 1999 $52,000<br />
Total housing units 71<br />
Housing unit, median year built 1958<br />
Median gross rent $0<br />
Median owner-occupied housing value $63,900<br />
Master plan<br />
Emergency Operations Plan<br />
Zoning regulations<br />
Building regulations<br />
Subdivision regulations<br />
Stormwater regulations<br />
Floodplain regulations<br />
Water service<br />
Sewer service<br />
61
62<br />
Cities and Villages<br />
Electric service<br />
Natural gas service<br />
Fire service High Ridge FPD<br />
Ambulance service NJC AD<br />
Pevely<br />
Total population 3768<br />
Classification City-4th class<br />
Leadership structure Mayor/<strong>Council</strong><br />
Median household income, 1999 $34,916<br />
Total housing units 1482<br />
Housing unit, median year built 1980<br />
Median gross rent $379<br />
Median owner-occupied housing value $80,200<br />
Master plan yes-'96<br />
Emergency Operations Plan yes<br />
Zoning regulations yes<br />
Building regulations IBC 2000; #958<br />
Subdivision regulations yes<br />
Stormwater regulations yes<br />
Floodplain regulations FEMA model #956<br />
Water service Pevely<br />
Sewer service Pevely<br />
Electric service AmerenUE<br />
Natural gas service MO NG<br />
Fire service Dunklin FPD<br />
Ambulance service JPT AD<br />
Scotsdale<br />
Total population 211<br />
Classification Town<br />
Leadership structure Bd of Trustees<br />
Median household income, 1999 $53,750<br />
Total housing units 68<br />
Housing unit, median year built 1978<br />
Median gross rent $563<br />
Median owner-occupied housing value $95,800<br />
Master plan<br />
Emergency Operations Plan<br />
Zoning regulations<br />
Building regulations<br />
Subdivision regulations<br />
Stormwater regulations<br />
Floodplain regulations<br />
Water service<br />
Sewer service<br />
Electric service<br />
Natural gas service<br />
Fire service Cedar Hill FPD<br />
<strong>Jefferson</strong> <strong>County</strong> – Section 1
A Regional Overview All-Hazard Mitigation Plan<br />
Cities and Villages<br />
Ambulance service Big River AD<br />
63
A Regional Overview All-Hazard Mitigation Plan 1<br />
SECTION 2<br />
Risk Assessment<br />
Hazard Identification and Elimination Process<br />
During the course of this study, many sources were researched for data relating to hazards.<br />
Primary sources included FEMA, SEMA, National Climate Data Center (NCDC) and the<br />
National Oceanic and Atmospheric Administration (NOAA). The U.S. Geological Survey<br />
(USGS) and Center for Earthquake Research and Information (CERI), Central U.S.<br />
Earthquake Consortium (CUSEC) were major sources for earthquake information. MDNR’s<br />
Dam and Reservoir Safety Program provided major information concerning dams.<br />
Additional research was based on data from USACE, National Park Service, National Forest<br />
Service, other departments within Missouri Department of Natural Resources, St. Louis<br />
University, State of Missouri Climatologist, Missouri Department of Conservation, and<br />
University of Missouri, Columbia. Additional sources included county officials; existing<br />
county, regional and state plans, reports on the floods of 1993 and 1995; position papers<br />
on transportation issues and information from local officials and residents. Past State and<br />
federal disaster designations, current Flood Insurance Rate Maps (FIRMS) and available local<br />
mitigation plans were also utilized.<br />
In order to identify the hazards relevant to <strong>Jefferson</strong> <strong>County</strong>, the above information sources<br />
were searched for incidents of all possible hazards occurring within the county. Some<br />
hazards are regional in scope and included in the hazard profiles. Location-specific hazards<br />
not found through the information search were further investigated to determine whether<br />
there would be a future possibility of occurrence. Hazard event histories, repetitive loss<br />
information and conversations with local residents were used to identify relevant hazards.<br />
Community-Wide Hazard Profile and List of Hazards Identified<br />
The largest disaster to impact <strong>Jefferson</strong> <strong>County</strong> in the recent past was the Great Flood of<br />
1993. The loss of homes, businesses and infrastructures, as well as the temporary closing<br />
of some local businesses, contributed to economic losses throughout the <strong>County</strong> and<br />
beyond. Several hazards can affect <strong>Jefferson</strong> <strong>County</strong>. History indicates that <strong>Jefferson</strong><br />
<strong>County</strong> could be at risk of tornadoes and severe thunderstorms, riverine flooding (including<br />
flash flooding), severe winter weather (snow, ice, extreme cold), drought, heat wave,<br />
earthquakes, wildfires and dam failures. Worksheet #1, <strong>Jefferson</strong> <strong>County</strong> Hazard<br />
Identification and Analysis, is included at the end of the Technical Appendix and shows<br />
earthquakes as the hazard with the greatest possible impact. <strong>Jefferson</strong> <strong>County</strong> has<br />
experienced a number of slight tremors from the New Madrid Fault Zone. Disasters ranked<br />
in descending order after earthquakes include flood, dam, severe windstorms, winter<br />
weather, drought, wildfires, and heat wave.
2<br />
<strong>Jefferson</strong> <strong>County</strong> – Section 2<br />
These disasters can precipitate cascading hazards or those hazards caused as a result of<br />
disasters. Cascading hazards could include interruption of power supply, water supply,<br />
business and transportation. Disasters also can cause civil unrest, computer failure and<br />
environmental health hazards. Any of these, alone or in combination, could possibly<br />
impact emergency response activities. Table J27 shows the relationships found between<br />
<strong>Jefferson</strong> <strong>County</strong>’s disasters and categories of possible cascading disasters. Examples of<br />
specific disasters include nuclear power plant damage, hazardous materials release, mass<br />
transportation accidents and disease outbreak due to unsanitary conditions.<br />
Hazards Not Included and Reasons For Elimination<br />
Based on the lack of documented historical occurrence and research, it was determined<br />
that the following hazards would not be evaluated for the purposes of this Hazard<br />
Mitigation Plan: coastal storms, hurricanes, tsunamis, avalanche and volcanic activity.<br />
These hazards do not exist within <strong>Jefferson</strong> <strong>County</strong> due to its geographic location and<br />
geologic conditions.<br />
TABLE J27 CASCADING HAZARDS RESULTING FROM DISASTERS<br />
Disaster<br />
Flood Hazard Profile<br />
Power &<br />
Communications<br />
Interruption<br />
Water Supply<br />
Interruption<br />
Business<br />
Interruption<br />
Civil Unrest<br />
Computer Failure<br />
& Loss of Records<br />
Transportation<br />
Interruption<br />
Health &<br />
Environmental<br />
Hazard<br />
Windstorm X X X X X X X<br />
Flood X X X X X X<br />
Winter X X X X X X<br />
Drought X X<br />
Heat X X X<br />
Earthquake/<br />
Landslide<br />
X X X X X X X<br />
Dams X X X X X X<br />
Fires X X X<br />
X = More than 50% chance of a side effect in the case of a disaster<br />
<strong>Jefferson</strong> <strong>County</strong> is just downstream from two of the largest watersheds/rivers in the<br />
United States, the Mississippi and the Missouri Rivers. <strong>Jefferson</strong> <strong>County</strong> is highly<br />
susceptible to annual flooding events in the spring. Flooding poses a threat to lives and<br />
safety and can cause severe damage to public and private property. With the exception of<br />
fire, floods are the most common and widespread of all disasters. Most communities in<br />
the United States have experienced some kind of flooding, after spring rains, heavy<br />
thunderstorms or winter snow thaws. Refer to Figures J14 and J15 below.
A Regional Overview All-Hazard Mitigation Plan 3<br />
FIGURE J14 FIGURE J15<br />
Satellite image of flooding at Aerial photo along the Mississippi River 1993<br />
Missouri/Mississippi River confluence.<br />
Background<br />
The first step to floodplain management as a nonstructural alternative to flood control was<br />
incorporated into the National Flood Insurance Act of 1968. This was 40 years after the<br />
Flood Control Act of 1928 that authorized the United States Corps of Engineers (USACE) to<br />
control the Mississippi River with dams, levees and diversion channels. This Act authorized<br />
the USACE to undertake a structural approach to reducing flood damages (thus keeping<br />
water from people). After numerous floods, and having spent billions of dollars on floods<br />
and disasters, Congress looked at another approach to reduce flood losses, adding a nonstructural<br />
approach in the National Flood Insurance Act of 1968. This act, called the<br />
National Flood Insurance program (NFIP), required local governments to adopt regulations<br />
governing new development activities in identified flood plains in order to be eligible for<br />
the sale of flood insurance within their jurisdictions.<br />
Description of Hazard<br />
Flooding is a natural event and has been characteristic of rivers throughout history. It<br />
becomes a disaster when it is of such magnitude that both man-made and natural<br />
landforms and human lives are destroyed or seriously damaged (Gaffney). Through<br />
analysis of existing federal Flood Insurance Rate Maps (FIRM) and Flood Insurance Studies,<br />
the Hazard Mitigation Plan Unit of EWG has determined that the counties included in the<br />
EWG planning region including St. Louis <strong>County</strong>, St. Charles <strong>County</strong>, Franklin <strong>County</strong>,<br />
<strong>Jefferson</strong> <strong>County</strong> and the City of St. Louis have 100-year floodplains (in addition to 500year<br />
floodplains) and may be affected by flooding hazards. A variety of factors affect the<br />
type and severity of flooding throughout the planning region, including urban<br />
development and infrastructure and topography.<br />
A flood is defined as an overflow or inundation that comes from a river or other body of<br />
water (Barrows, 1948) and causes or threatens damage or any relatively high streamflow
4<br />
<strong>Jefferson</strong> <strong>County</strong> – Section 2<br />
overtopping the natural or artificial banks in any reach of a stream (Leopold and Maddock,<br />
1954). A flood is defined by the National Flood Insurance Program as: “A general and<br />
temporary condition of partial or complete inundation of two or more acres of normally<br />
dry land area or of two or more properties from:<br />
• Overflow of inland or tidal waters,<br />
• Unusual and rapid accumulation or runoff of surface waters from any source, or<br />
• A mudflow.<br />
Characteristics<br />
Riverine flooding includes headwater, backwater, and interior drainage. Floods can be<br />
slow or fast rising, depending on the intensity of the rainstorms in the watershed over a<br />
certain length of time, or from rapid snowmelt or icemelt. Floods generally develop over a<br />
period of days. During heavy rains from storm systems (including severe thunderstorms),<br />
water flows down the watershed, collecting in, and then overtopping, valley streams and<br />
rivers.<br />
Flash flooding is characterized by rapid accumulation or runoff of surface waters from any<br />
source. This type of flooding can occur within six hours of a rain event, after a dam or<br />
levee failure, or the sudden release of water held by an ice or debris dam. Because flash<br />
flood can develop in just a matter of hours, flash floods can catch people unprepared and<br />
most flood-related deaths result from this type of flooding. Most flash flooding is caused<br />
by slow-moving thunderstorms or heavy rains.<br />
Several factors contribute to both riverine and flash flooding. Two key elements are rainfall<br />
intensity (the rate of rainfall) and duration (length of time that the rainfall lasts). Type of<br />
ground cover, soil type and topography all play important roles in flooding.<br />
Flooding potential is further exacerbated in urban areas (disturbed lands) by the increased<br />
runoff up from two to six times over what would occur on undisturbed terrain. Soils lose<br />
their ability to absorb rain as land is converted from fields or woodlands to buildings and<br />
pavement. During periods of urban flooding, streets become rivers, and basements and<br />
viaducts become death traps as they fill with water.<br />
Floodplains are located in relatively flat lowland areas and adjoin rivers and streams. These<br />
lowland areas adjacent to rivers and stream banks serve to carry excess floodwater during<br />
rapid runoff. The term “base flood” or 100-year flood is the area in the floodplain that is<br />
subject to a one percent or greater chance of flooding in any given year, based on<br />
historical records. A 500-year flood is defined as the area in the floodplain that has a .2%<br />
probability of occurring in any given year. While unlikely, it is possible to have two 100 or<br />
even 500 year floods within years or months of each other. The primary use for these<br />
terms is for the determination of flood insurance rates in flood hazard areas. Using historic<br />
weather and hydrograph data experts derive the estimated rate of flow or discharge of a<br />
river or creek. After extensive study and coordination with Federal and State agencies, this
A Regional Overview All-Hazard Mitigation Plan 5<br />
group recommended that the 1-percent-annual-chance flood (also referred to as the 100year<br />
or “Base Flood”) be used as the standard for the NFIP.<br />
The 1-percent-annual-chance flood was chosen on the basis that it provides a higher level<br />
of protection while not imposing overly stringent requirements or the burden of excessive<br />
costs on property owners. The 1-percent-annual-chance flood (or 100-year flood)<br />
represents a magnitude and frequency that has a statistical probability of being equaled or<br />
exceeded in any given year, or the 100-year flood has a 26 percent (or 1 in 4) chance of<br />
occurring over the life of a 30-year mortgage.<br />
Floodplains are a vital part of a larger entity called a watershed basin. A watershed basin is<br />
defined as all the land drained by a river and its branches. In some cases, flooding may not<br />
be attributed to a river, stream or lake. It may be the combination of excessive rainfall,<br />
snowmelt, saturated ground and inadequate drainage.<br />
Likely Locations<br />
In certain areas of <strong>Jefferson</strong> <strong>County</strong>, steep slopes of the region induce high velocities as the<br />
water flows downhill and downstream, in many cases producing flash flooding conditions.<br />
Because some areas in <strong>Jefferson</strong> <strong>County</strong> are located in low areas, and therefore, often in<br />
the floodplain, floodwaters have the potential to affect or even severely harm portions of<br />
the community, especially if the floodwalls or levees fail.<br />
There are no federal levees on the Missouri side of the Mississippi River; however there are<br />
federal levees on the Illinois side that extend as far south as Ste. Genevieve <strong>County</strong>,<br />
Missouri. During floods, these levees would force higher floodwaters to inundate the<br />
Missouri side of the river. The failure of the federal levees would lower the floodwaters<br />
and reduce the flooding impact on the Missouri side. These conditions that exist in areas<br />
where flash floods are a problem make response operations and evacuation very difficult,<br />
adversely affecting the safety of the residents.<br />
Type of Damage<br />
Damage incurred as a result of flooding includes the inundation of residences,<br />
outbuildings, businesses, churches stormwater, mud, rock, trees, debris, trash, and<br />
chemical pollutants. Depending upon the severity of the flood and the volume and rate of<br />
flow of the water, floodwaters may be capable of carrying vehicles, whole or parts of<br />
buildings, etc. Wherever they reach, floodwaters leave behind layers of thick muddy ooze.<br />
During spring and summer 1993, record flooding inundated much of the upper Mississippi<br />
River Basin. The magnitude of the damages -- in terms of property, disrupted business, and<br />
personal trauma -- was unmatched by any other flood disaster in United States history .<br />
Property damage alone was over $20 billion. Damaged highways and submerged roads<br />
disrupted overland transportation throughout the flooded region. The Mississippi and the<br />
Missouri Rivers were closed to navigation before, during, and after the flooding . Millions
6<br />
<strong>Jefferson</strong> <strong>County</strong> – Section 2<br />
of acres of productive farmland remained under water for weeks during the growing<br />
season. Rills and gullies in many tilled fields and large holes (exceeding 100 feet in depth)<br />
were the result of the severe erosion that occurred throughout the Midwestern United<br />
States farmbelt. The hydrologic effects of extended rainfall throughout the upper<br />
Midwestern United States were severe and widespread. The banks and channels of many<br />
rivers were severely eroded, and sediment was deposited over large areas of the basin's<br />
flood plain. Record flows submerged many areas that had not been affected by previous<br />
floods. Industrial and agricultural areas were inundated, which caused concern about the<br />
transport and fate of industrial chemicals, sewage effluent and agricultural chemicals in the<br />
floodwaters . The extent and duration of the flooding caused numerous levees to fail. One<br />
failed levee on the Raccoon River in Des Moines, Iowa, led to flooding of the city's water<br />
treatment plant. As a result, the city was without drinking water for 19 days.<br />
Hazard Event History<br />
The largest disaster to impact <strong>Jefferson</strong> <strong>County</strong> in recent years was the flood on 1993. Its<br />
size and impact was unprecedented and has been considered the most costly and<br />
devastating flood to ravage the U.S. in modern history. The number of record river levels,<br />
its aerial extent, the number of persons displaced, amount of property damage and the<br />
flood’s duration surpassed all earlier U.S. floods in modern times.<br />
The following gives an account of locations and areas that were affected by the inundation<br />
of water during the 1993 flood. Based on a workshop meeting held on October 17, 2003<br />
with <strong>Jefferson</strong> <strong>County</strong> officials and other community emergency management agencies, the<br />
following locations were specifically identified as locations that become flooded during<br />
various rainfall events. In DeSoto, Joachim Creek and North Main along Cedar Street<br />
became inundated from floodwaters in 1993 and flash flooding near the high school near<br />
Spross Memorial Park on Amvets Drive. In Festus, the community flooded in 1993 and has<br />
experienced problems with storm drainage and creeks. Also in 1993, Rock Creek in<br />
Kimmswick flooded Highway K, which was 33 feet under water and the Highway K Bridge<br />
was 35 feet under water. Other areas of <strong>Jefferson</strong> <strong>County</strong> experienced significant flooding<br />
at the confluence of the Big River and Meramec River, including Highway BB, <strong>West</strong> Old<br />
Highway 21, Highway 61/67 and Highway 55. Several areas in community of Arnold<br />
experienced significant flooding impacts from the 1993 flood, including Twin River Road,<br />
Big Bend Road, Meadow Drive, Riffle Island, State Road BB, and River Bend Acres. <strong>West</strong> of<br />
Pevely on Highway Z between Sandy Creek and Cherry Lane, 1993 floodwaters inundated<br />
the bridge; mitigation for this stretch entailed the raising of the road and replacement of<br />
the bridge. Refer to Figure J16 below.
A Regional Overview All-Hazard Mitigation Plan 7<br />
FIGURE J16 1993 MIDWEST FLOOD<br />
Source: U.S. Army Corps of Engineers<br />
Areas hardest hit by the flooding were along the Mississippi and Meramec Rivers in the<br />
eastern and northern portions of <strong>Jefferson</strong> <strong>County</strong>. The existing levee system (federal levees<br />
along the Illinois side of the Mississippi River) intended to aid in protecting the Illinois side<br />
from the potential of flooding endured extreme pressures from extended duration of the<br />
high river levels. The presence of the Illinois federal levees resulted in the inundation of<br />
floodwaters on the Missouri side of the Mississippi River. Illinois levee failures resulted in<br />
the relief from floodwaters on the Missouri side of the Mississippi River.<br />
During the 1993 flood, commuting was interrupted when various bridges north of the<br />
<strong>Jefferson</strong> <strong>County</strong> area over the Mississippi River were closed due to water flooding Highway<br />
67 to the Alton River Bridge. Commuting was also heavily interrupted when Highway 40-<br />
61 was closed due to the overtopping of the Monarch Levee in Chesterfield, Missouri.<br />
Prolonged flooding on the Highway 40-61 created economic loss and hardship impacts on<br />
the St. Louis metropolitan region. They provided critical access to employment, healthcare,<br />
emergency services, education, retail and commerce activities and transportation of goods<br />
and services. Highway 67 provides critical access to employment, healthcare, emergency<br />
services, education, retail and commerce activities and transportation of goods and<br />
services.<br />
Approximately 138 homes were bought out as a result of flooding in <strong>Jefferson</strong> <strong>County</strong>.<br />
FEMA estimated the total dollar loss for housing units alone was $3,483,868 for <strong>Jefferson</strong><br />
<strong>County</strong> as of January 9, 2001. While some households carried adequate flood insurance
8<br />
<strong>Jefferson</strong> <strong>County</strong> – Section 2<br />
on their dwellings, about 82% of the dwellings in the affected areas were either<br />
underinsured or not insured for flood. Unfortunately this left a portion of the county’s<br />
labor force homeless for a period of time, adding to the economic loss. From the Disaster<br />
Declaration of 1993 (DR-0995), <strong>Jefferson</strong> <strong>County</strong> received $1,527,199 in public assistance.<br />
From the 1995 disaster (DR-1054), <strong>Jefferson</strong> <strong>County</strong> received $89,928 in public assistance.<br />
From the 2000 disaster (DR-1328), <strong>Jefferson</strong> <strong>County</strong> received $483,511.22 in individual<br />
assistance, $473,000 in SBA assistance and $574,002.26 in public assistance. From the<br />
2002 disaster (R-1412), <strong>Jefferson</strong> <strong>County</strong> received $31,192.35 in individual assistance and<br />
$20,000 in SBA assistance. In the 2003 disaster (DR-1463), <strong>Jefferson</strong> <strong>County</strong> received<br />
$2,082,045.99 in individual assistance, $3,411,600 in SBA assistance and $353,632.20 in<br />
public.<br />
The U.S. Army Corps of Engineers produced a set of maps showing damage estimates for<br />
the 1993 flood. According to the maps, <strong>Jefferson</strong> <strong>County</strong> damages included:<br />
Greater than $10 million in commercial properties damages<br />
Between $1 and $5 million in public facilities damages<br />
Between $1 and $5 million in residential damages<br />
Greater than $10 million in transportation system damage<br />
Between $500,000 and $10 million in utilities damages<br />
Greater than $1 million is emergency expenses<br />
Data were collected for seven specific areas of damages and costs and for one general<br />
area. The specific areas collected were residential, commercial/industrial, public facilities,<br />
transportation, utilities, agriculture and emergency services. The general area was an<br />
attempt to cover what might be thought of as secondary costs of the flooding. These were<br />
the costs of buyout, mitigation, mission, unemployment assistance and crisis counseling.<br />
For all categories of damages that included structures, the attempt was made to get<br />
numbers of structures damaged, extent of that damage, and the extent of damage to any<br />
contents. For revenue-generating activities, an attempt was made to find the extent of<br />
revenues lost. Within agriculture, the acres damaged for various crops were sought. For the<br />
transportation sector, miles of roads and railroads damaged were sought.<br />
Although buyout and relocation costs were typically received from local officials, very few<br />
counties in any District have this variable reported. These costs are typically included in the<br />
mitigation costs rather than presented separately.<br />
Mitigation costs were derived from the FEMA DSRs, from SBA reports and from Housing<br />
and Urban Development (HUD) officials. In most cases, the mitigation costs were well<br />
reported and include monies that went for buyouts.<br />
Unemployment costs, including both unemployment and food aid assistance costs, were<br />
derived from FEMA and USDA reports.
A Regional Overview All-Hazard Mitigation Plan 9<br />
FIGURE J17 COMMERCIAL AND INDUSTRIAL<br />
Source: U.S. Army Corps of Engineers<br />
The commercial variable included all commercial and industrial damages for the particular<br />
area. The figures for all parts of the commercial/industrial damages were derived from<br />
FEMA, SBA, and state and local sources. Refer to Figure J17 above.<br />
The equipment damages for both commercial and industrial are found in the commercial<br />
equipment damages variable. These estimates come from FEMA, SBA and local sources.<br />
Commercial and industrial revenues lost were grouped under the commercial variable.<br />
These estimates come from SBA and local sources.<br />
FIGURE J18 PUBLIC FACILITIES<br />
Source: U.S. Army Corps of Engineers
10<br />
<strong>Jefferson</strong> <strong>County</strong> – Section 2<br />
FEMA Damage Survey Reports (DSRs) and local sources were used for the various<br />
categories of damage to public facilities. The variables included under this category were<br />
number of and damages to public structures, public equipment damage, costs of public<br />
restoration and debris clearance, damages to parks and recreation facilities, and damages<br />
to water control facilities. The latter variable was drawn from U.S. Department of<br />
Agriculture and Corps sources as well as those sources used for the other public variables.<br />
Refer to Figure J18 above.<br />
FIGURE J19 RESIDENTIAL PROPERTIES<br />
Source: U.S. Army Corps of Engineers<br />
The residential data gathered were numbers of residences damaged, structure damage and<br />
content damage. This category included residential damage figures for both structure and<br />
content unseparated. Refer to Figure J19 above.<br />
FIGURE J20 TRANSPORTATION<br />
Source: U.S. Army Corps of Engineers
A Regional Overview All-Hazard Mitigation Plan 11<br />
Variables for railroad damages were miles of lines flooded, amount of damages, and<br />
revenues lost. These were determined by contacting the private railroad companies, local<br />
officials, and the Federal Railroad Administration. The revenues lost depended upon the<br />
cooperation of the railroad companies, information that was not always forthcoming.<br />
Refer to Figure J20 above.<br />
Variables for trucking damages were the number of trucking companies experiencing<br />
damage, the amount of damages, and revenues lost. Damages were determined by<br />
contact with the companies involved. Only in Kansas City and St. Louis Districts were<br />
damages in this category reported.<br />
Damages to airports included numbers of airports damaged, amounts of that damage, and<br />
revenues lost by airports. These variables were acquired from the Federal Aviation<br />
Administration and local officials.<br />
Transportation damages were also acquired on miles of roads flooded, traffic rerouting<br />
costs, and damages to roads and bridges. Information was gathered from local and state<br />
officials and from the FEMA DSRs.<br />
FIGURE J21 UTILITIES DAMAGES<br />
Source: U.S. Army Corps of Engineers<br />
The utilities damages covered water, sewer, electric and general utilities. Data regarding<br />
utilities damage was sought from state departments of natural resources or environmental<br />
protection, the FEMA DSRs and local officials. Very few answers were obtained as to<br />
numbers of water facilities damaged. Names of some water facilities, evidently those that<br />
suffered some damage, are included in the records. Numbers of water customers affected<br />
and dollar amounts of water facilities damage were more frequently reported. Very few<br />
areas reported lost water revenues. Refer to Figure J21 above.<br />
More information is available on sewerage systems as both the numbers damaged and the<br />
dollar amounts of that damage are available.
12<br />
<strong>Jefferson</strong> <strong>County</strong> – Section 2<br />
Flood damages to the electrical power distribution system were collected through<br />
discussions with local, regional and state officials, the FEMA DSRs and officials of the<br />
involved electric companies. Variables are presented for number of companies affected,<br />
number of customers affected, dollar damages to the companies and revenues lost. The<br />
final utilities variable, utility systems - general, was a catchall variable but was specifically<br />
used in the St. Louis District counties to report gas utility company damages. That<br />
information was obtained from gas company officials. Otherwise, the FEMA DSRs were the<br />
primary sources for utility damages not specifically assignable.<br />
FIGURE J22 EMERGENCY EXPENSES<br />
Source: U.S. Army Corps of Engineers<br />
The two emergency cost variables are the emergency preparedness and response costs and<br />
the evacuation costs. The former was primarily derived from the FEMA DSRs, with<br />
supplemental data coming from some local and regional officials. The latter variable came<br />
from these same sources, as well as the Red Cross and FEMA Disaster Field Offices. The<br />
final variable, crisis counseling, was derived from FEMA reports and state sources. Refer to<br />
Figure J22 above.<br />
According to the Department of Economic Development and Department of Labor and<br />
Industrial Relations, employment impact and the occurrence of the 1993 floods did not<br />
show a direct correlation in the <strong>Jefferson</strong> <strong>County</strong> area. July, August, September, October<br />
and November’s unemployment rate are as follows: 6.6, 6.4, 5.4, 5.2, and 5.1,<br />
respectively. The region was just recovering from a recession and the rates reflect a higher<br />
than normal unemployment rate due to the recession. The decrease in the unemployment<br />
rate from August to September was the result of the student population going back to<br />
school. In addition, manufacturing industries were closed for up to two weeks and<br />
incurred damages.
A Regional Overview All-Hazard Mitigation Plan 13<br />
Infrastructure problems included contaminated wells, collapsed wells, destroyed pumping<br />
equipment, failed sewage treatment facilities or private septic systems, contaminated<br />
ground and drinking water, sewage backups and treatment facilities seriously purged by<br />
the floodwaters.<br />
Frequency of Occurrence<br />
The <strong>East</strong>-<strong>West</strong> <strong>Gateway</strong> <strong>Council</strong> of Governments planning region has many river and small<br />
tributaries in both the unincorporated and incorporated areas that are susceptible to<br />
flooding. Major floods have affected the citizens of the planning region as early as 1785.<br />
Table J28 below illustrates major flood events on the Mississippi and Meramec Rivers. In<br />
1993, 1994 and 2001, major flood events occurred in the planning region and<br />
surrounding areas. There have been 14 major flood events since 1785. The history of river<br />
crest levels along the Mississippi River north of <strong>Jefferson</strong> <strong>County</strong> at St. Louis helps to<br />
illustrate the risk, severity and repetitiveness and along the Meramec River.<br />
TABLE J28 MISSISSIPPI AND MERAMEC RIVER FLOOD STAGES NEAR JEFFERSON<br />
COUNTY<br />
Station Stage (Flood Stage 30 ft) Date<br />
Mississippi River at St. Louis 42.0 4/1/1785<br />
Mississippi River at St. Louis 40.3 7/2/1947<br />
Mississippi River at St. Louis 40.2 7/22/1951<br />
Mississippi River at St. Louis 43.23 4/28/1973<br />
Mississippi River at St. Louis 39.27 12/7/1982<br />
Mississippi River at St. Louis 39.0 5/4/1983<br />
Mississippi River at St. Louis 33.8 4/24/1984<br />
Mississippi River at St. Louis 33.5 4/8/1985<br />
Mississippi River at St. Louis 39.13 10/9/1986<br />
Mississippi River at St. Louis 49.58 8/1/1993<br />
Mississippi River at St. Louis 36.6 4/15/1994<br />
Mississippi River at St. Louis 41.89 5/221995<br />
Mississippi River at St. Louis 35.35 6/2/1996<br />
Mississippi River at St. Louis 34.79 6/10/2001<br />
Station Stage (Flood Stage 18 ft) Date<br />
Meramec River at Eureka 33.4 4/14/1979<br />
Meramec River at Eureka 42.9 12/6/1982<br />
Meramec River at Eureka 36.6 5/3/1983<br />
Meramec River at Eureka 31.3 2/26/1985<br />
Meramec River at Eureka 26.8 4/2/1985<br />
Meramec River at Eureka 29.2 6/21/1985<br />
Meramec River at Eureka 34.6 11/22/1985<br />
Meramec River at Eureka 25.1 12/29/1987<br />
Meramec River at Eureka 25.2 5/28/1990<br />
Meramec River at Eureka 35.9 9/26/1993<br />
Meramec River at Eureka 35.6 11/17/1993<br />
Meramec River at Eureka 30.4 5/20/1995<br />
Meramec River at Eureka 29.9 4/30/1996<br />
Meramec River at Eureka 26.33 5/11/2002
14<br />
<strong>Jefferson</strong> <strong>County</strong> – Section 2<br />
TABLE J28 MISSISSIPPI AND MERAMEC RIVER FLOOD STAGES NEAR JEFFERSON<br />
COUNTY<br />
Station Stage (Flood Stage 16 ft) Date<br />
Meramec River at Valley Park 34.4 2/1/1916<br />
Meramec River at Valley Park 39.73 12/6/1982<br />
Meramec River at Valley Park 33 5/3/1983<br />
Meramec River at Valley Park 28.5 2/26/1985<br />
Meramec River at Valley Park 24.3 4/1/1985<br />
Meramec River at Valley Park 26 6/21/1985<br />
Meramec River at Valley Park 31.7 11/22/1985<br />
Meramec River at Valley Park 22.2 10/5/1986<br />
Meramec River at Valley Park 22.8 12/29/1987<br />
Meramec River at Valley Park 22.5 5/29/1990<br />
Meramec River at Valley Park 32.4 9/26/1993<br />
Meramec River at Valley Park 37.4 4/14/1994<br />
Meramec River at Valley Park 29.3 5/21/1995<br />
Meramec River at Valley Park 24 5/8/2000<br />
Meramec River at Valley Park 24.2 5/11/2002<br />
Station Stage (Flood Stage at 24 ft) Date<br />
Meramec River at Arnold 38.9 4/28/1973<br />
Meramec River at Arnold 38 4/16/1979<br />
Meramec River at Arnold 43.9 12/6/1982<br />
Meramec River at Arnold 39.8 5/4/1983<br />
Meramec River at Arnold 35.7 2/27/1985<br />
Meramec River at Arnold 36.2 11/22/1985<br />
Meramec River at Arnold 36.4 10/9/1986<br />
Meramec River at Arnold 32.9 5/20/1990<br />
Meramec River at Arnold 34.3 4/18/1993<br />
Meramec River at Arnold 45.3 8/1/1993<br />
Meramec River at Arnold 33.9 11/18/1993<br />
Meramec River at Arnold 41.7 4/14/1994<br />
Meramec River at Arnold 41.1 5/21/1994<br />
Meramec River at Arnold 36.7 5/18/2002<br />
Station Stage (Flood Stage 16 ft) Date<br />
Big River at Byrnes Mill 30.2 8/21/1915<br />
Big River at Byrnes Mill 24.37 5/27/1990<br />
Big River at Byrnes Mill 29.37 9/25/1993<br />
Big River at Byrnes Mill 27.61 11/16/1993<br />
Big River at Byrnes Mill 21.55 4/30/1994<br />
Big River at Byrnes Mill 20.08 4/24/1996<br />
Big River at Byrnes Mill 15.31 5/15/1996<br />
Big River at Byrnes Mill 17.72 11/27/1996<br />
Big River at Byrnes Mill 16.08 1/29/1997<br />
Big River at Byrnes Mill 19.99 2/28/1997<br />
Big River at Byrnes Mill 20.65 6/23/1997<br />
Big River at Byrnes Mill 22.44 5/7/2000<br />
Big River at Byrnes Mill 17.9 12/19/2001<br />
Big River at Byrnes Mill 22.5 5/10/2002<br />
Source: NOAA
A Regional Overview All-Hazard Mitigation Plan 15<br />
Since 1979 there have been 14 major flood events on the Meramec River at Eureka. Since<br />
1916, there have been 14 major flood events on the Meramec River at Valley Park. Since<br />
1973, there have been 14 major floods on the Meramec River at Arnold and 14 major<br />
floods on the Meramec at Byrnes Mill. The properties in and near the floodplains of the<br />
planning region <strong>Jefferson</strong> <strong>County</strong> are subject to flooding events almost annually. Since<br />
flooding is such a pervasive problem throughout the county, many residents have<br />
purchased flood insurance to help recover form losses incurred from flooding events, have<br />
sold property, or have rebuilt structures to reflect construction standards. Flood insurance<br />
covers only the improved land, or the actual building structures. Although flood insurance<br />
assists in recovery, it can provide an inappropriate sense of protection from flooding.<br />
Many residents and businesses that have flood damage rebuilt in the same vulnerable<br />
areas, only to be flooded again. These properties are termed repetitive loss properties and<br />
are very troublesome because they continue to expose lives and valuable property to<br />
flooding hazards. Local governments, as well as federal agencies such as FEMA, recognize<br />
this problem of floodplain insurance and attempt to remove the risk from repetitive loss<br />
properties though projects such as acquiring land and relocating homes or by elevating the<br />
structures.<br />
Continued repetitive loss claims from flood events lead to an increased amount of damage<br />
caused by floods, higher insurance rates, and contribute to the rising cost of taxpayerfunded<br />
disaster relief for flood victims.<br />
Intensity or Strength<br />
The largest disaster to impact <strong>Jefferson</strong> <strong>County</strong> in recent years was the flood in 1993. Its<br />
size and impact was unprecedented and has been considered the most costly and<br />
devastating flood to ravage the U.S. in modern history, as evidenced by Table J28 above.<br />
The number of record river levels, its aerial extent, the number of persons displaced,<br />
amount of property damage and its duration surpassed all earlier U.S. floods in modern<br />
times. In the 2001 flood, a total of $1.9 billion dollars in damage and costs and at least<br />
three deaths over a 14-state area including Missouri occurred. In the 1993 flood<br />
approximately $21 billion dollars in damage and costs and 50 deaths resulted (NOAA). In<br />
a report from the NCDC (Technical Report No. 2000-02), from events dating from 1980 to<br />
1999, sites that in the 1997 flooding, 9 states including Missouri were impacted and an<br />
estimated $1 billion dollars in damage and costs and 11 deaths resulted. The report also<br />
stated that floods at the second most likely type of weather event to occur (based on 46<br />
weather events from 1980 to 1999).<br />
Lives Lost, Injuries, Property Damage, Economic Losses/Other Losses<br />
Due to flooding of many of the major roadways and interstates, 'commuting' distances<br />
grew from several miles to over 200 miles in some instances. Many of the bridges crossing<br />
the Mississippi were destroyed or damaged by the flooding. From July 16-20, there were<br />
no bridge crossings over a 212-mile span between Burlington, Iowa and St. Louis, Missouri.<br />
Also, there was no Mississippi River traffic over a 585-mile span from Cairo, Illinois through
16<br />
<strong>Jefferson</strong> <strong>County</strong> – Section 2<br />
St. Louis, Missouri to St. Paul, Minnesota from late June through early August, resulting in<br />
over 5,000 loaded barges being halted, and an estimated $3 million per day in lost<br />
revenue. Similarly, the Missouri River was closed from late June through early August over<br />
a 535-mile span stretching from its confluence with the Mississippi River to near Sioux City,<br />
Iowa. Eleven commercial airports were closed at one time or another due to the flooding.<br />
Also, railway traffic was devastated, with over 4000 miles of track either flooded or idled,<br />
and over $200 million in estimated losses.<br />
Well over 20 million acres were flooded, covering parts of nine states. More than 50,000<br />
homes were damaged or destroyed, and over 85,000 residents had to evacuate their<br />
homes. More than 75 small towns near the rivers were completely flooded and had to be<br />
abandoned or relocated. Some of the flooding occurred as levees collapsed after being<br />
weakened by constant pressure from rising water levels. However, some levees, such as<br />
the 52-foot 'wall' protecting St. Louis, held back the rising waters. It is interesting to note<br />
that the St. Louis levee was built to a level 9 feet higher than the previous record crest for<br />
the Mississippi River, but less than 3 feet higher than the 49.6-foot crest recorded on<br />
August 1. Over 6,500 National Guard members were called in to assist in levee work. A<br />
recent report on the various levees on the Mississippi and Missouri Rivers indicates the<br />
following:<br />
Over 16,000 square miles of farmland were flooded, and crop losses exceeded $5 billion.<br />
Many farm animals, such as cattle, perished in the rising waters. Total crop losses due to<br />
flooding or saturated fields exceeded 35 million acres. The national soybean yield was<br />
forecast to be 13 percent below 1992’s level, while the national corn yield was down by 22<br />
percent. Soybean prices moved to 4- year highs on July 10, 1993 due to the damage<br />
assessments.<br />
Overall damage estimates exceeded $12 billion. Local power plants were damaged in<br />
many cities, with electrical service lost as a result (including 45,000 people without power<br />
in Des Moines). Business districts were flooded in Davenport, Dubuque, Burlington, and<br />
many other smaller towns.<br />
The Missouri River, normally no more than a half-mile wide, expanded to 5-6 miles wide<br />
north of St. Joseph, Missouri, and 8-10 miles wide east of Kansas City. Just north of St.<br />
Louis, it reached 20 miles wide near its confluence with the Mississippi, as the merging of<br />
the 2 rivers occurred 20 miles north of their normal point of confluence. As a result,<br />
almost half of the 620 square miles of St. Charles <strong>County</strong>, Missouri were underwater.<br />
Four hundred and four counties in the Midwest were declared federal disaster areas<br />
including 62% of Missouri counties. The waters in some areas remained above flood stage<br />
for many weeks, and receded rather slowly. Many locations experienced not one, but two<br />
record crests during the flooding. Mississippi River watershed 1993 precipitation was the<br />
greatest since 1895 for the following periods: July, June-July, May-July, and April-July.
A Regional Overview All-Hazard Mitigation Plan 17<br />
Over 1,000 flood warnings and statements, five times the normal, were issued to notify the<br />
public and need-to-know officials of river levels. In St. Louis, river levels were nearly 20 feet<br />
above flood stage, the highest in the city’s 150-year history. The 52-foot St. Louis Flood<br />
wall, built to handle the volume of the 1844 flood, was able to keep the 1993 flood out<br />
with just over two feet to spare. On the Missouri River it was estimated that nearly all of<br />
the 700 privately built agricultural levees were overtopped or destroyed. Navigation on the<br />
Mississippi and Missouri River had been closed since early July resulting in a loss of $2<br />
million (1993) dollars per day in commerce.<br />
The Mississippi River at St. Louis crested at 49.6 feet on August 1, nearly 20 feet above<br />
flood stage and had a peak flow rate of 1.08 million cubic feet per second. The old record<br />
was 43.2 feet in 1973. Some locations on the Mississippi River were in flood for almost<br />
200 days while locations on the Missouri neared 100 days of flooding. On the Mississippi<br />
River, Grafton, Illinois recorded flooding for 195 days, Clarksville, Missouri for 187 days,<br />
Winfield, Missouri for 183 days, Hannibal, Missouri for 174 days, and Quincy, Illinois for<br />
152 days. The Missouri River was above flood stage for 62 days in <strong>Jefferson</strong> City, Missouri,<br />
77 days at Hermann, Missouri and for 94 days at St. Charles in the St. Louis metropolitan<br />
area. On October 7, 103 days after it began, the Mississippi River at St. Louis finally<br />
dropped below flood stage.<br />
According to the U.S. Army Corps of Engineers (as noted in the NOAA National Weather<br />
Service disaster survey report) 40 of 229 federal levees and 1,043 of 1,347 non-federal<br />
levees were over-topped or damaged. Every breeched levee contributed to the amount of<br />
floodwater flowing outside the main drainages. The flood eroded more than 600 billion<br />
tons of topsoil and deposited great amounts of sand and silt on valuable farmland. In large<br />
areas inundated by the flood, the harvest of 1993 was a total loss and some farmers lost<br />
any chance for a 1994 harvest.<br />
At St. Louis, the first spring flooding on the Mississippi River was recorded April 8, cresting<br />
at 0.2 feet above flood stage and lasting only that day. The Mississippi rose above flood<br />
stage again on April 11 and stayed above flood stage until May 24. The city got a respite<br />
as the Mississippi stayed below flood stage May 24 to June 26. On June 27, the Mississippi<br />
again went above flood stage and did not drop below flood stage until October 7—a total<br />
of 146 days above flood stage. The Mississippi River was above the old record flood stage<br />
for more than three weeks at St. Louis from mid July to mid August. Prior to 1993, the<br />
historic flood of record on the Mississippi River at St. Louis had been 43.2 feet, recorded<br />
April 28, 1973. That record was broken July 21, 1993, with a level of 46.9 feet and broken<br />
again 11 days later with a record stage of 49.58 feet on Aug. 1. St. Louis is located near<br />
the confluence of the Missouri, Illinois and Mississippi rivers, all of which were in flood at<br />
the same time.<br />
From April through October, 1993, flooding of the Upper Mississippi River and the<br />
Missouri River caused a national catastrophe, interrupting transcontinental commerce for<br />
many weeks, including rail, highway and barge traffic. Tremendous outlays of local, state<br />
and federal dollars to aid recovery of people and property created major financial
18<br />
<strong>Jefferson</strong> <strong>County</strong> – Section 2<br />
hardships. By the year’s end, nearly every county in Missouri had been declared a<br />
Presidential Disaster Area at least once. In the three 1993 Presidential Disaster Declarations<br />
for Missouri, some counties were declared all three times. Flood stage records were broken<br />
at nearly every Missouri recording location along the Upper Mississippi and Missouri Rivers.<br />
The historic flood (before the period of recording gages) nearest to the magnitude of the<br />
1993 flooding was the flood in 1844.<br />
Locations/Areas Affected<br />
Owners of repetitive loss properties clearly have knowledge that there is a highly likely<br />
chance of being flooded in future rain events. The largest single drain on flood insurance<br />
reserve funds is repetitive claims from repetitive loss properties (Galloway report). Missouri<br />
ranks first among non-coastal states in repetitive losses. Missouri has 3,268 repetitive loss<br />
buildings that have resulted in 10,038 loss claims.<br />
During the 1993 flood the following gives an account of <strong>Jefferson</strong> <strong>County</strong> areas that were<br />
affected by the inundation. Based on a workshop meeting with <strong>Jefferson</strong> <strong>County</strong> and<br />
other community emergency management agencies held on October 17, 2003, the<br />
following locations were specifically identified as locations that become flooded during<br />
various rainfall events. In DeSoto, Joachim Creek and North Main along Cedar Street<br />
became inundated from floodwaters in 1993 and flash flooding near the high school near<br />
Spross Memorial Park on Amvets Drive. In Festus, the community during the 1993 floods,<br />
the community experienced problems with storm drainage and creeks. In Kimmswick, Rock<br />
Creek flooded Highway K. During the 1993 flood Highway K was 33 feet under water and<br />
the Highway K Bridge was 35 feet under water. Other areas of <strong>Jefferson</strong> <strong>County</strong><br />
experienced significant flooding at the confluence of the Big River and Meramec River,<br />
Highway BB, <strong>West</strong> Old Highway 21, Highway 61/67 and Highway 55. The community of<br />
Arnold experienced significant flooding impacts from the 1993 flood. Areas flooded<br />
included Twin River Road, Big Bend Road, Meadow Drive, Riffle Island, State Road BB, and<br />
River Bend Acres. <strong>West</strong> of Pevely on Highway Z between Sandy Creek and Cherry Lane, in<br />
1993, floodwaters inundated the bridge; mitigation for this stretch entailed the raising of<br />
the road, property buyouts and replacement of the bridge.<br />
In Festus, all but one of the north-south roads and most of the major streets in the<br />
community were closed due to the 1993 floodwaters including 61/67 and Highway A. The<br />
community was inundated by floodwaters for approximately 5 months during this major<br />
flood event.<br />
Pevely was impacted only slightly during the 1993 flood, according to Ron Thomure.<br />
Pevely is located about ½ to 1 mile west of the Mississippi River. Ancient Oaks subdivision,<br />
located in the southwest portion of the community was affected when floodwaters from<br />
nearby Sandy Creek inundated the sewage treatment system (lagoon) for the subdivision.<br />
Further, in 1993 west of Pevely along Highway Z, Sandy Creek flooded the roadway. The<br />
Missouri Department of Transportation subsequent to the flooding event raised the<br />
roadbed and replaced the bridge above the 100-year event. As a result of the 1993 flood,
A Regional Overview All-Hazard Mitigation Plan 19<br />
Pevely is placing one of their lift stations at a higher elevation to prevent impacts from<br />
flooding. There were no buyouts from the 1993 or subsequent flooding events.<br />
Repetitive losses for <strong>Jefferson</strong> <strong>County</strong>, as indicated by SEMA are identified below in Table<br />
J29. Specifically in the Arnold area, seven repetitive loss properties including the following<br />
were bought out as a result of the 1993 and 1995 floods totaling $361,109.57.<br />
7179 Twin River Road<br />
8927 Big Bend Road<br />
1388 Meadow Drive<br />
7384 Riffle Island<br />
7354 State Road BB<br />
2940 River Bend Acres<br />
2934 River Bend Acres<br />
In Festus, there was approximately $2 million dollars in losses from the 1993 flood; Crystal<br />
City had approximately $1 million in losses. Over the years, residents moved away from the<br />
low-lying areas. After the 1993 flood destroyed the community wastewater treatment<br />
plant, Festus has, through assistance from the Missouri State Revolving Fund rebuilt a $6<br />
million dollar wastewater treatment plant.<br />
TABLE J29 JEFFERSON COUNTY REPETITIVE LOSS PROPERTIES<br />
COMMUNITY NAME Mitigated? Insured? CITY TOTAL PAID<br />
Arnold, City Of No No Arnold 97,761.57<br />
Arnold, City Of No No Arnold 37,010.65<br />
Arnold, City Of No No Arnold 44,431.42<br />
Arnold, City Of No No Arnold 52,179.30<br />
Arnold, City Of No No Arnold 119,214.09<br />
Arnold, City Of No No Arnold 19,244.26<br />
Arnold, City Of No No Arnold 152,400.03<br />
Arnold, City Of No Yes Arnold 23,548.40<br />
Arnold, City Of No Yes Arnold 125,103.25<br />
Arnold, City Of No No Arnold 26,203.16<br />
Arnold, City Of No No Arnold 101,637.39<br />
Arnold, City Of No Yes Arnold, 62,807.25<br />
Arnold, City Of No No Arnold 6,360.78<br />
Arnold, City Of No No Arnold 29,875.47<br />
Arnold, City Of No No Arnold 3,079.31<br />
Arnold, City Of No No Arnold 24,490.75<br />
Arnold, City Of No Yes Arnold 44,503.28<br />
Arnold, City Of No Yes Arnold 124,486.64<br />
Arnold, City Of No No Arnold 51,548.04<br />
Arnold, City Of No Yes Arnold 29,726.36<br />
Arnold, City Of No No Arnold 69,597.08<br />
Arnold, City Of Yes No Arnold 5,721.93
20<br />
<strong>Jefferson</strong> <strong>County</strong> – Section 2<br />
TABLE J29 JEFFERSON COUNTY REPETITIVE LOSS PROPERTIES<br />
COMMUNITY NAME Mitigated? Insured? CITY TOTAL PAID<br />
Arnold, City Of Yes No Arnold 8,186.18<br />
Arnold, City Of Yes No Arnold 4,730.72<br />
Arnold, City Of Yes No Arnold 32,301.25<br />
Arnold, City Of Yes No Arnold 30,726.03<br />
Arnold, City Of Yes No Arnold 19,500.87<br />
Arnold, City Of Yes No Arnold 48,835.83<br />
Arnold, City Of Yes No Arnold 39,302.22<br />
Arnold, City Of Yes No Arnold 47,294.71<br />
Arnold, City Of Yes No Arnold 31,219.27<br />
Arnold, City Of Yes No Arnold 8,212.46<br />
Arnold, City Of Yes No Arnold 21,132.78<br />
Arnold, City Of Yes No Arnold 82,849.58<br />
Arnold, City Of Yes No Arnold 80,125.32<br />
Arnold, City Of Yes No Arnold 21,728.28<br />
Arnold, City Of Yes No Arnold 64,254.49<br />
Arnold, City Of Yes No Arnold 22,403.26<br />
Arnold, City Of Yes No Arnold 3,238.36<br />
Arnold, City Of Yes No Arnold Park 12,249.19<br />
Arnold, City Of Yes No Arnold 40,486.31<br />
Arnold, City Of Yes No Arnold 113,839.25<br />
Arnold, City Of Yes No <strong>Jefferson</strong> City 25,124.82<br />
Arnold, City Of Yes No Arnold 21,818.17<br />
Arnold, City Of Yes No Arnold 67,906.80<br />
Arnold, City Of Yes No Arnold 46,797.48<br />
Arnold, City Of Yes No Arnold 128,463.45<br />
Arnold, City Of Yes No Arnold 11,333.40<br />
Arnold, City Of Yes No Arnold 67,342.67<br />
Arnold, City Of Yes No Arnold 39,209.97<br />
Arnold, City Of Yes No Arnold 42,033.69<br />
Arnold, City Of Yes No Arnold 19,117.71<br />
Arnold, City Of Yes No Arnold 92,073.22<br />
Arnold, City Of Yes No Arnold 69,063.19<br />
Arnold, City Of Yes No Arnold 33,118.40<br />
Arnold, City Of Yes No Arnold 141,215.67<br />
Arnold, City Of Yes No Arnold 94,657.58<br />
Arnold, City Of Yes No Arnold 73,979.47<br />
Arnold, City Of Yes No Arnold 111,399.09<br />
Arnold, City Of Yes No Arnold 52,068.75<br />
Arnold, City Of Yes No Arnold 54,981.77<br />
Arnold, City Of Yes No Arnold 54,577.34<br />
Arnold, City Of Yes No Arnold 73,173.80<br />
Arnold, City Of Yes No Arnold 104,901.78<br />
Arnold, City Of Yes No Arnold 73,380.56<br />
Arnold, City Of Yes No Arnold 83,725.04
A Regional Overview All-Hazard Mitigation Plan 21<br />
TABLE J29 JEFFERSON COUNTY REPETITIVE LOSS PROPERTIES<br />
COMMUNITY NAME Mitigated? Insured? CITY TOTAL PAID<br />
Arnold, City Of Yes No Arnold 110,007.45<br />
Arnold, City Of Yes No Arnold 141,079.49<br />
Arnold, City Of Yes No Arnold 47,108.70<br />
Arnold, City Of Yes No Arnold 66,999.91<br />
Arnold, City Of Yes No Arnold 69,476.14<br />
Arnold, City Of Yes No Arnold 57,354.08<br />
Arnold, City Of Yes No Arnold 28,978.38<br />
Arnold, City Of Yes No Arnold 32,294.82<br />
Arnold, City Of Yes No Arnold 38,896.38<br />
Arnold, City Of Yes No Arnold 26,035.06<br />
Arnold, City Of Yes No Arnold 41,650.86<br />
Arnold, City Of Yes No Arnold 37,500.00<br />
Arnold, City Of Yes No Arnold 31,062.00<br />
Arnold, City Of Yes No Arnold 13,195.62<br />
Arnold, City Of Yes No Arnold 122,243.70<br />
Arnold, City Of Yes No Arnold 48,591.92<br />
Arnold, City Of Yes No Arnold 25,605.39<br />
Arnold, City Of Yes No Arnold 30,040.00<br />
Arnold, City Of Yes No Arnold 64,488.15<br />
Arnold, City Of Yes No Arnold 4,857.55<br />
Arnold, City Of Yes No Arnold 70,103.68<br />
Arnold, City Of Yes No Arnold 22,434.93<br />
Arnold, City Of Yes No Arnold 47,038.81<br />
Arnold, City Of Yes No Arnold 127,125.01<br />
Arnold, City Of Yes No Arnold 27,133.27<br />
Arnold, City Of Yes No Arnold 30,729.53<br />
Arnold, City Of Yes No Arnold 29,348.70<br />
Arnold, City Of Yes No Arnold 100,528.31<br />
Arnold, City Of Yes No Arnold 85,677.11<br />
Arnold, City Of Yes No Arnold 10,665.97<br />
Arnold, City Of Yes No Arnold 55,128.00<br />
Arnold, City Of Yes No Arnold 22,859.69<br />
Arnold, City Of Yes No Arnold 87,632.43<br />
Arnold, City Of Yes No Arnold 25,615.52<br />
Arnold, City Of Yes No Arnold 35,235.03<br />
Arnold, City Of Yes No Arnold 15,041.00<br />
Arnold, City Of Yes No Arnold 16,435.61<br />
Arnold, City Of Yes No Arnold 5,435.21<br />
Arnold, City Of Yes No Arnold 19,888.16<br />
Arnold, City Of Yes No Arnold 61,953.53<br />
Arnold, City Of Yes No Arnold 8,480.14<br />
Arnold, City Of Yes No Arnold 70,509.28<br />
Arnold, City Of Yes No Arnold 97,429.45<br />
Arnold, City Of Yes No Arnold 26,577.40
22<br />
<strong>Jefferson</strong> <strong>County</strong> – Section 2<br />
TABLE J29 JEFFERSON COUNTY REPETITIVE LOSS PROPERTIES<br />
COMMUNITY NAME Mitigated? Insured? CITY TOTAL PAID<br />
Arnold, City Of Yes No Arnold 30,213.20<br />
Arnold, City Of Yes No Arnold 116,662.69<br />
Arnold, City Of Yes No Arnold 93,021.42<br />
Arnold, City Of Yes No Arnold 32,031.18<br />
Arnold, City Of Yes No Arnold 43,823.70<br />
Arnold, City Of Yes No Arnold 22,748.09<br />
Arnold, City Of Yes No Arnold 60,620.88<br />
Arnold, City Of Yes No Arnold 51,030.53<br />
Arnold, City Of Yes No Arnold 13,794.08<br />
Arnold, City Of Yes No Arnold 69,984.07<br />
Arnold, City Of Yes No Arnold 91,833.59<br />
Arnold, City Of Yes No Arnold 88,976.45<br />
Arnold, City Of Yes No Arnold 13,960.00<br />
Arnold, City Of Yes No Arnold 16,863.69<br />
Arnold, City Of Yes No Arnold 33,972.33<br />
Arnold, City Of Yes No Arnold 36,734.61<br />
Arnold, City Of Yes No Arnold 14,736.23<br />
Arnold, City Of Yes No Arnold 32,743.86<br />
Arnold, City Of Yes No Arnold 14,329.50<br />
Arnold, City Of Yes No Arnold 65,311.53<br />
Arnold, City Of Yes No Arnold 40,119.86<br />
Arnold, City Of Yes No Arnold 48,775.29<br />
Arnold, City Of Yes No Arnold 32,579.95<br />
Arnold, City Of Yes No Arnold 59,807.60<br />
Arnold, City Of Yes No Arnold 35,856.64<br />
Arnold, City Of Yes No Arnold 50,893.27<br />
Arnold, City Of Yes No Arnold 62,445.00<br />
Arnold, City Of Yes No Arnold 4,882.00<br />
Arnold, City Of Yes No Arnold 170,862.29<br />
Arnold, City Of Yes No O’Fallon 10,014.32<br />
Arnold, City Of Yes No Arnold 16,650.64<br />
Arnold, City Of Yes No Arnold 67,243.12<br />
Arnold, City Of Yes No Arnold 60,286.01<br />
Arnold, City Of Yes No Arnold 41,441.56<br />
Arnold, City Of Yes No Arnold 42,372.83<br />
Arnold, City Of Yes No Arnold 54,384.44<br />
Crystal City, City Of No No Crystal City 14,482.95<br />
Crystal City, City Of No No Crystal City 7,181.99<br />
Crystal City, City Of No No Festus 3,642.80<br />
Crystal City, City Of No No Crystal City 33,848.28<br />
Crystal City, City Of No No Crystal City 42,513.30<br />
Crystal City, City Of No Yes Crystal City 41,688.82<br />
Crystal City, City Of No No Crystal City 8,299.79<br />
Crystal City, City Of No No Crystal City 147,576.76
A Regional Overview All-Hazard Mitigation Plan 23<br />
TABLE J29 JEFFERSON COUNTY REPETITIVE LOSS PROPERTIES<br />
COMMUNITY NAME Mitigated? Insured? CITY TOTAL PAID<br />
Crystal City, City Of No Yes Crystal City 220,489.68<br />
Crystal City, City Of No Yes Crystal City 46,561.36<br />
Crystal City, City Of No No Crystal City 115,109.86<br />
Crystal City, City Of No Yes Crystal City 30,458.74<br />
Crystal City, City Of No No Crystal City 8,723.64<br />
Crystal City, City Of No No Crystal City 43,046.50<br />
Crystal City, City Of No No Crystal City 6,320.76<br />
Crystal City, City Of No No Crystal City 47,845.80<br />
Crystal City, City Of No No Crystal City 39,160.32<br />
Crystal City, City Of No No Crystal City 7,629.78<br />
Crystal City, City Of No No Crystal City 31,682.52<br />
Crystal City, City Of No No Crystal City 44,424.85<br />
Crystal City, City Of No No Crystal City 75,156.13<br />
Crystal City, City Of No No Crystal City 40,587.34<br />
Crystal City, City Of No No Crystal City 20,611.87<br />
Crystal City, City Of No No Crystal City 13,011.16<br />
Crystal City, City Of No No Crystal City 39,233.51<br />
Crystal City, City Of No Yes Crystal City 27,508.54<br />
Crystal City, City Of No Yes Crystal City 6,237.81<br />
Crystal City, City Of No No Crystal City 164,193.26<br />
Crystal City, City Of No Yes Crystal City 93,417.91<br />
Crystal City, City Of No No Crystal City 13,478.49<br />
Crystal City, City Of No Yes Crystal City 30,581.60<br />
Crystal City, City Of No No Crystal City 70,690.39<br />
Crystal City, City Of No No Crystal City 401,513.52<br />
Crystal City, City Of No No Arnold 24,312.80<br />
Crystal City, City Of No No Crystal City 55,173.32<br />
Crystal City, City Of No No Crystal City 32,276.65<br />
Crystal City, City Of No No Crystal City 135,387.09<br />
Crystal City, City Of No No Crystal City 49,703.54<br />
Crystal City, City Of No Yes Crystal City 396,323.48<br />
Crystal City, City Of No No Crystal City 43,038.49<br />
Crystal City, City Of No Yes Crystal City 27,055.90<br />
Crystal City, City Of No Yes Crystal City 46,447.55<br />
Crystal City, City Of No No Crystal City 47,927.08<br />
Crystal City, City Of Yes No Crystal City 5,941.24<br />
Crystal City, City Of Yes No Crystal City 35,807.75<br />
Crystal City, City Of Yes No Crystal City 2,203.80<br />
Crystal City, City Of Yes No Crystal City 35,777.98<br />
Crystal City, City Of Yes No Crystal City 4,059.19<br />
Crystal City, City Of Yes No Crystal City 25,297.15<br />
Festus, City Of No Yes Festus 38,124.31<br />
Festus, City Of No Yes Festus 18,358.87<br />
Festus, City Of No Yes Festus 47,313.17
24<br />
<strong>Jefferson</strong> <strong>County</strong> – Section 2<br />
TABLE J29 JEFFERSON COUNTY REPETITIVE LOSS PROPERTIES<br />
COMMUNITY NAME Mitigated? Insured? CITY TOTAL PAID<br />
Festus, City Of No No Festus 88,600.00<br />
Festus, City Of No Yes Festus 102,916.05<br />
Festus, City Of No Yes Festus 26,636.91<br />
Festus, City Of No Yes Festus 84,816.28<br />
Festus, City Of No Yes Festus 112,522.92<br />
Festus, City Of No No Festus 83,380.49<br />
Festus, City Of No No Festus 46,051.07<br />
Festus, City Of No No Festus 10,519.71<br />
Festus, City Of No Yes Festus 8,343.68<br />
Festus, City Of Yes No Festus 25,898.64<br />
Herculaneum, City Of No No Herculaneum 36,052.51<br />
Herculaneum, City Of No No Herculaneum 43,448.80<br />
Herculaneum, City Of No No Herculaneum 66,225.95<br />
Herculaneum, City Of No No Herculaneum 7,009.50<br />
Herculaneum, City Of No No Herculaneum 6,121.50<br />
Herculaneum, City Of No Yes Herculaneum, 43,526.99<br />
Herculaneum, City Of No No Herculaneum 27,176.97<br />
<strong>Jefferson</strong> <strong>County</strong>* No No Cedar 11,303.81<br />
<strong>Jefferson</strong> <strong>County</strong>* No No Eureka 8,478.85<br />
<strong>Jefferson</strong> <strong>County</strong>* No No DeSoto 19,785.49<br />
<strong>Jefferson</strong> <strong>County</strong>* No No Eureka 14,157.94<br />
<strong>Jefferson</strong> <strong>County</strong>* No No Eureka 40,281.00<br />
<strong>Jefferson</strong> <strong>County</strong>* No No Eureka 35,069.42<br />
<strong>Jefferson</strong> <strong>County</strong>* No No Eureka 9,283.78<br />
<strong>Jefferson</strong> <strong>County</strong>* No No Eureka 24,310.70<br />
<strong>Jefferson</strong> <strong>County</strong>* No No Eureka 14,774.67<br />
<strong>Jefferson</strong> <strong>County</strong>* No No Eureka 23,821.23<br />
<strong>Jefferson</strong> <strong>County</strong>* No No Cedar Hill 18,381.50<br />
<strong>Jefferson</strong> <strong>County</strong>* No No House Springs 4,533.83<br />
<strong>Jefferson</strong> <strong>County</strong>* No No Cedar Hill 3,548.67<br />
<strong>Jefferson</strong> <strong>County</strong>* No No Cedar Hill 46,172.03<br />
<strong>Jefferson</strong> <strong>County</strong>* No No Arnold 55,930.14<br />
<strong>Jefferson</strong> <strong>County</strong>* No No High Ridge 3,264.28<br />
<strong>Jefferson</strong> <strong>County</strong>* No Yes Fenton 36,387.61<br />
<strong>Jefferson</strong> <strong>County</strong>* No Yes Fenton 80,447.76<br />
<strong>Jefferson</strong> <strong>County</strong>* No No Eureka 93,762.34<br />
<strong>Jefferson</strong> <strong>County</strong>* No No House Springs 34,822.13<br />
<strong>Jefferson</strong> <strong>County</strong>* No No Eureka Mo 31,648.38<br />
<strong>Jefferson</strong> <strong>County</strong>* No No Cedar 3,717.36<br />
<strong>Jefferson</strong> <strong>County</strong>* No No Hillsboro 14,642.34<br />
<strong>Jefferson</strong> <strong>County</strong>* No No Hillsboro 9,483.10<br />
<strong>Jefferson</strong> <strong>County</strong>* No Yes Fenton 58,246.38<br />
<strong>Jefferson</strong> <strong>County</strong>* No No Fenton 56,367.62<br />
<strong>Jefferson</strong> <strong>County</strong>* No No Eureka 53,051.88
A Regional Overview All-Hazard Mitigation Plan 25<br />
TABLE J29 JEFFERSON COUNTY REPETITIVE LOSS PROPERTIES<br />
COMMUNITY NAME Mitigated? Insured? CITY TOTAL PAID<br />
<strong>Jefferson</strong> <strong>County</strong>* No Yes Eureka 27,237.40<br />
<strong>Jefferson</strong> <strong>County</strong>* No No Barnhart 4,961.24<br />
<strong>Jefferson</strong> <strong>County</strong>* No No Eureka Gardens 18,942.25<br />
<strong>Jefferson</strong> <strong>County</strong>* No No Pevely 31,060.54<br />
<strong>Jefferson</strong> <strong>County</strong>* No Yes Fenton 16,908.91<br />
<strong>Jefferson</strong> <strong>County</strong>* No No Fenton 47,381.79<br />
<strong>Jefferson</strong> <strong>County</strong>* No No Cedar Hill 88,414.33<br />
<strong>Jefferson</strong> <strong>County</strong>* No No Eureka 8,741.34<br />
<strong>Jefferson</strong> <strong>County</strong>* No No Imperial 53,447.39<br />
<strong>Jefferson</strong> <strong>County</strong>* No Yes Eureka 31,820.57<br />
<strong>Jefferson</strong> <strong>County</strong>* No No Eureka 68,673.13<br />
<strong>Jefferson</strong> <strong>County</strong>* No No Venton Jeffe 63,252.51<br />
<strong>Jefferson</strong> <strong>County</strong>* No No High Ridge 63,311.25<br />
<strong>Jefferson</strong> <strong>County</strong>* No No Eureka 70,419.61<br />
<strong>Jefferson</strong> <strong>County</strong>* No No St Louis 11,409.02<br />
<strong>Jefferson</strong> <strong>County</strong>* No No Eureka 52,407.00<br />
<strong>Jefferson</strong> <strong>County</strong>* No No Cedar Hill 26,688.23<br />
<strong>Jefferson</strong> <strong>County</strong>* No Yes Cedar Hill 34,586.90<br />
<strong>Jefferson</strong> <strong>County</strong>* No No Eureka 17,509.14<br />
<strong>Jefferson</strong> <strong>County</strong>* No No Eureka 33,363.24<br />
<strong>Jefferson</strong> <strong>County</strong>* No No Eureka 20,037.00<br />
<strong>Jefferson</strong> <strong>County</strong>* No Yes Eureka 41,911.76<br />
<strong>Jefferson</strong> <strong>County</strong>* No No Eureka 46,852.89<br />
<strong>Jefferson</strong> <strong>County</strong>* No Yes Eureka 21,457.08<br />
<strong>Jefferson</strong> <strong>County</strong>* No Yes Eureka 9,865.04<br />
<strong>Jefferson</strong> <strong>County</strong>* No No Eureka 15,501.73<br />
<strong>Jefferson</strong> <strong>County</strong>* No No Hillsboro 28,141.50<br />
<strong>Jefferson</strong> <strong>County</strong>* No Yes Hillsboro 30,170.11<br />
<strong>Jefferson</strong> <strong>County</strong>* No No Hillsboro 80,847.46<br />
<strong>Jefferson</strong> <strong>County</strong>* No No Cedar Hill 46,137.50<br />
<strong>Jefferson</strong> <strong>County</strong>* No No Hillsboro 12,708.67<br />
<strong>Jefferson</strong> <strong>County</strong>* No No Hillsboro 46,986.24<br />
<strong>Jefferson</strong> <strong>County</strong>* No No <strong>Jefferson</strong> Co 16,212.70<br />
<strong>Jefferson</strong> <strong>County</strong>* No Yes Hillsboro 60,487.35<br />
<strong>Jefferson</strong> <strong>County</strong>* No No Hillsboro 45,538.14<br />
<strong>Jefferson</strong> <strong>County</strong>* No No Hillsboro 32,903.68<br />
<strong>Jefferson</strong> <strong>County</strong>* No Yes Hillsboro 14,448.00<br />
<strong>Jefferson</strong> <strong>County</strong>* No Yes Morse Mill 32,935.97<br />
<strong>Jefferson</strong> <strong>County</strong>* No No Hillsboro 51,375.61<br />
<strong>Jefferson</strong> <strong>County</strong>* No Yes Hillsboro 87,849.38<br />
<strong>Jefferson</strong> <strong>County</strong>* No Yes Hillsboro 66,855.79<br />
<strong>Jefferson</strong> <strong>County</strong>* No Yes Eureka 46,127.61<br />
<strong>Jefferson</strong> <strong>County</strong>* No No House Springs 279,000.00<br />
<strong>Jefferson</strong> <strong>County</strong>* No Yes House Springs 19,699.93
26<br />
<strong>Jefferson</strong> <strong>County</strong> – Section 2<br />
TABLE J29 JEFFERSON COUNTY REPETITIVE LOSS PROPERTIES<br />
COMMUNITY NAME Mitigated? Insured? CITY TOTAL PAID<br />
<strong>Jefferson</strong> <strong>County</strong>* No No Hillsboro 21,523.46<br />
<strong>Jefferson</strong> <strong>County</strong>* No No Dittmer 10,074.90<br />
<strong>Jefferson</strong> <strong>County</strong>* No Yes <strong>Jefferson</strong> 5,186.08<br />
<strong>Jefferson</strong> <strong>County</strong>* No No Crystal City 81,632.45<br />
<strong>Jefferson</strong> <strong>County</strong>* No No <strong>Jefferson</strong> 12,908.18<br />
<strong>Jefferson</strong> <strong>County</strong>* No No <strong>Jefferson</strong> Cty 9,514.84<br />
<strong>Jefferson</strong> <strong>County</strong>* No No Cedar Hill 7,309.80<br />
<strong>Jefferson</strong> <strong>County</strong>* No No House Springs 24,361.60<br />
<strong>Jefferson</strong> <strong>County</strong>* No No Crystal City 21,600.00<br />
<strong>Jefferson</strong> <strong>County</strong>* No Yes House Springs 18,265.81<br />
<strong>Jefferson</strong> <strong>County</strong>* No Yes House Springs 27,292.04<br />
<strong>Jefferson</strong> <strong>County</strong>* No No Arnold 25,579.70<br />
<strong>Jefferson</strong> <strong>County</strong>* No No Eureka 74,461.27<br />
<strong>Jefferson</strong> <strong>County</strong>* No Yes House Springs 22,387.47<br />
<strong>Jefferson</strong> <strong>County</strong>* No No House Springs 13,935.90<br />
<strong>Jefferson</strong> <strong>County</strong>* No Yes House Springs 54,351.71<br />
<strong>Jefferson</strong> <strong>County</strong>* No No <strong>Jefferson</strong> 6,543.35<br />
<strong>Jefferson</strong> <strong>County</strong>* No No Fenton 7,805.28<br />
<strong>Jefferson</strong> <strong>County</strong>* No No St Louis 15,169.77<br />
<strong>Jefferson</strong> <strong>County</strong>* No No Crystal City 41,731.11<br />
<strong>Jefferson</strong> <strong>County</strong>* No No Cedar Hill 17,849.59<br />
<strong>Jefferson</strong> <strong>County</strong>* No No Hillsboro 18,382.04<br />
<strong>Jefferson</strong> <strong>County</strong>* No No Cedar Hill 8,309.87<br />
<strong>Jefferson</strong> <strong>County</strong>* No No Cedar Hill 15,912.65<br />
<strong>Jefferson</strong> <strong>County</strong>* No No Byrnes Mill 5,548.83<br />
<strong>Jefferson</strong> <strong>County</strong>* No No Fenton 82,862.30<br />
<strong>Jefferson</strong> <strong>County</strong>* No No Fenton 32,702.36<br />
<strong>Jefferson</strong> <strong>County</strong>* No No Fenton 33,484.45<br />
<strong>Jefferson</strong> <strong>County</strong>* No Yes Fenton 50,850.81<br />
<strong>Jefferson</strong> <strong>County</strong>* No No Morse Mill 5,224.81<br />
<strong>Jefferson</strong> <strong>County</strong>* No No Fenton 36,103.00<br />
<strong>Jefferson</strong> <strong>County</strong>* No No Fenton 11,757.85<br />
<strong>Jefferson</strong> <strong>County</strong>* No No Fenton 63,318.61<br />
<strong>Jefferson</strong> <strong>County</strong>* No No Fenton 10,664.81<br />
<strong>Jefferson</strong> <strong>County</strong>* No No Fenton 19,887.11<br />
<strong>Jefferson</strong> <strong>County</strong>* No No House Springs 2,633.32<br />
<strong>Jefferson</strong> <strong>County</strong>* No No St Louis 23,335.10<br />
<strong>Jefferson</strong> <strong>County</strong>* No Yes Eureka 53,693.50<br />
<strong>Jefferson</strong> <strong>County</strong>* No No Eureka 43,984.72<br />
<strong>Jefferson</strong> <strong>County</strong>* No No Eureka 28,065.61<br />
<strong>Jefferson</strong> <strong>County</strong>* No No Eureka 25,803.58<br />
<strong>Jefferson</strong> <strong>County</strong>* No No Eureka 44,382.48<br />
<strong>Jefferson</strong> <strong>County</strong>* No No Arnold 97,977.30<br />
<strong>Jefferson</strong> <strong>County</strong>* No Yes Arnold 6,599.71
A Regional Overview All-Hazard Mitigation Plan 27<br />
TABLE J29 JEFFERSON COUNTY REPETITIVE LOSS PROPERTIES<br />
COMMUNITY NAME Mitigated? Insured? CITY TOTAL PAID<br />
<strong>Jefferson</strong> <strong>County</strong>* No Yes Eureka 12,455.63<br />
<strong>Jefferson</strong> <strong>County</strong>* No No Eureka 35,780.66<br />
<strong>Jefferson</strong> <strong>County</strong>* No Yes Eureka 50,761.86<br />
<strong>Jefferson</strong> <strong>County</strong>* No No 2,687.03<br />
<strong>Jefferson</strong> <strong>County</strong>* No Yes Eureka 53,936.44<br />
<strong>Jefferson</strong> <strong>County</strong>* No No DeSoto 23,051.96<br />
<strong>Jefferson</strong> <strong>County</strong>* No No House Springs 5,122.80<br />
<strong>Jefferson</strong> <strong>County</strong>* No No Cedar Hill 5,407.33<br />
<strong>Jefferson</strong> <strong>County</strong>* No No Cedar Hill 45,026.43<br />
<strong>Jefferson</strong> <strong>County</strong>* No Yes Cedar Hill 30,965.75<br />
<strong>Jefferson</strong> <strong>County</strong>* No No House Springs 13,317.96<br />
<strong>Jefferson</strong> <strong>County</strong>* No No Morse Mill 47,104.31<br />
<strong>Jefferson</strong> <strong>County</strong>* No No Eureka 41,070.79<br />
<strong>Jefferson</strong> <strong>County</strong>* No No Eureka 27,340.95<br />
<strong>Jefferson</strong> <strong>County</strong>* No Yes Fenton 137,747.33<br />
<strong>Jefferson</strong> <strong>County</strong>* No No Fenton 47,133.69<br />
<strong>Jefferson</strong> <strong>County</strong>* No No <strong>Jefferson</strong> 12,511.24<br />
<strong>Jefferson</strong> <strong>County</strong>* No Yes Eureka 16,005.12<br />
<strong>Jefferson</strong> <strong>County</strong>* No No Eureka 15,031.65<br />
<strong>Jefferson</strong> <strong>County</strong>* No No Eureka 12,386.35<br />
<strong>Jefferson</strong> <strong>County</strong>* No No House Springs 8,949.68<br />
<strong>Jefferson</strong> <strong>County</strong>* No No 634 Willman Rd 26,806.93<br />
<strong>Jefferson</strong> <strong>County</strong>* No No Cedar Hill 38,805.14<br />
<strong>Jefferson</strong> <strong>County</strong>* No Yes Barnhart 155,866.52<br />
<strong>Jefferson</strong> <strong>County</strong>* No No Arnold 28,142.37<br />
<strong>Jefferson</strong> <strong>County</strong>* No Yes Fenton 41,760.70<br />
<strong>Jefferson</strong> <strong>County</strong>* No No Fenton 35,812.30<br />
<strong>Jefferson</strong> <strong>County</strong>* No No Fenton 74,810.54<br />
<strong>Jefferson</strong> <strong>County</strong>* No Yes Fenton 34,894.33<br />
<strong>Jefferson</strong> <strong>County</strong>* No No Fenton 9,037.02<br />
<strong>Jefferson</strong> <strong>County</strong>* No No Cedar Hill 8,507.19<br />
<strong>Jefferson</strong> <strong>County</strong>* No No Cedar Hill 4,930.84<br />
<strong>Jefferson</strong> <strong>County</strong>* No No Cedar Hill 9,999.81<br />
<strong>Jefferson</strong> <strong>County</strong>* No Yes Barnhart 89,013.20<br />
<strong>Jefferson</strong> <strong>County</strong>* No No Imperial 16,238.54<br />
<strong>Jefferson</strong> <strong>County</strong>* No No Barnhart 232,608.55<br />
<strong>Jefferson</strong> <strong>County</strong>* No No Pevely 21,215.26<br />
<strong>Jefferson</strong> <strong>County</strong>* No Yes House Springs 30,259.82<br />
<strong>Jefferson</strong> <strong>County</strong>* No Yes Arnold 13,620.76<br />
<strong>Jefferson</strong> <strong>County</strong>* No No Imperial 62,952.44<br />
<strong>Jefferson</strong> <strong>County</strong>* No No St Louis 21,873.06<br />
<strong>Jefferson</strong> <strong>County</strong>* No Yes Barnhart 2,877.49<br />
<strong>Jefferson</strong> <strong>County</strong>* No No St Louis 27,403.42<br />
<strong>Jefferson</strong> <strong>County</strong>* No Yes Arnold 12,249.63
28<br />
<strong>Jefferson</strong> <strong>County</strong> – Section 2<br />
TABLE J29 JEFFERSON COUNTY REPETITIVE LOSS PROPERTIES<br />
COMMUNITY NAME Mitigated? Insured? CITY TOTAL PAID<br />
<strong>Jefferson</strong> <strong>County</strong>* No No Arnold 5,217.15<br />
<strong>Jefferson</strong> <strong>County</strong>* No No Arnold 36,132.11<br />
<strong>Jefferson</strong> <strong>County</strong>* No No Arnold 4,067.50<br />
<strong>Jefferson</strong> <strong>County</strong>* No No Arnold 59,812.47<br />
<strong>Jefferson</strong> <strong>County</strong>* No No House Springs 9,997.61<br />
<strong>Jefferson</strong> <strong>County</strong>* No Yes Arnold 53,017.75<br />
<strong>Jefferson</strong> <strong>County</strong>* No No Morse Mill 45,252.12<br />
<strong>Jefferson</strong> <strong>County</strong>* No No Hillsboro 5,505.87<br />
<strong>Jefferson</strong> <strong>County</strong>* No Yes House Springs 9,688.43<br />
<strong>Jefferson</strong> <strong>County</strong>* No No <strong>Jefferson</strong> City 5,917.30<br />
<strong>Jefferson</strong> <strong>County</strong>* No No Eureka 12,865.00<br />
<strong>Jefferson</strong> <strong>County</strong>* No No Waukesha 36,537.27<br />
<strong>Jefferson</strong> <strong>County</strong>* No No Fenton 48,489.51<br />
<strong>Jefferson</strong> <strong>County</strong>* No No Hillsboro 5,370.48<br />
<strong>Jefferson</strong> <strong>County</strong>* No No Barnhart 8,956.23<br />
<strong>Jefferson</strong> <strong>County</strong>* No Yes Antonia 14,725.59<br />
<strong>Jefferson</strong> <strong>County</strong>* No No House Springs 76,263.11<br />
<strong>Jefferson</strong> <strong>County</strong>* No No High Ridge 17,992.00<br />
<strong>Jefferson</strong> <strong>County</strong>* No No Arnold 60,101.93<br />
<strong>Jefferson</strong> <strong>County</strong>* No Yes Arnold 5,947.52<br />
<strong>Jefferson</strong> <strong>County</strong>* No No Eureka 19,142.81<br />
<strong>Jefferson</strong> <strong>County</strong>* No No <strong>Jefferson</strong> 33,513.86<br />
<strong>Jefferson</strong> <strong>County</strong>* No No Eureka 49,578.46<br />
<strong>Jefferson</strong> <strong>County</strong>* No No Festus 40,345.62<br />
<strong>Jefferson</strong> <strong>County</strong>* No No Eureka 38,150.41<br />
<strong>Jefferson</strong> <strong>County</strong>* No No Dittmer 64,733.27<br />
<strong>Jefferson</strong> <strong>County</strong>* No No Eureka 32,744.21<br />
<strong>Jefferson</strong> <strong>County</strong>* No No Imperial 51,585.78<br />
<strong>Jefferson</strong> <strong>County</strong>* No No Cedar Hill 41,396.82<br />
<strong>Jefferson</strong> <strong>County</strong>* No No Cedar Hill 2,627.72<br />
<strong>Jefferson</strong> <strong>County</strong>* No No Cedar Hill 41,103.27<br />
<strong>Jefferson</strong> <strong>County</strong>* No No Cedar Hill 54,568.69<br />
<strong>Jefferson</strong> <strong>County</strong>* No No Cedar Hill 30,459.32<br />
<strong>Jefferson</strong> <strong>County</strong>* No No Morse Mill 75,731.51<br />
<strong>Jefferson</strong> <strong>County</strong>* No No Eureka 24,963.14<br />
<strong>Jefferson</strong> <strong>County</strong>* No Yes Eureka 11,612.69<br />
<strong>Jefferson</strong> <strong>County</strong>* No No Eureka 21,140.40<br />
<strong>Jefferson</strong> <strong>County</strong>* No No Eureka 16,334.20<br />
<strong>Jefferson</strong> <strong>County</strong>* No No Eureka 9,724.70<br />
<strong>Jefferson</strong> <strong>County</strong>* No No Eureka 6,874.72<br />
<strong>Jefferson</strong> <strong>County</strong>* No No Dittmer 16,905.36<br />
<strong>Jefferson</strong> <strong>County</strong>* No Yes Dittmer 27,742.71<br />
<strong>Jefferson</strong> <strong>County</strong>* No No Dittmer 30,609.48<br />
<strong>Jefferson</strong> <strong>County</strong>* No No Eureka 8,105.41
A Regional Overview All-Hazard Mitigation Plan 29<br />
TABLE J29 JEFFERSON COUNTY REPETITIVE LOSS PROPERTIES<br />
COMMUNITY NAME Mitigated? Insured? CITY TOTAL PAID<br />
<strong>Jefferson</strong> <strong>County</strong>* No No Eureka 34,829.21<br />
<strong>Jefferson</strong> <strong>County</strong>* No No Eureka 77,301.31<br />
<strong>Jefferson</strong> <strong>County</strong>* No No Eureka 34,978.43<br />
<strong>Jefferson</strong> <strong>County</strong>* No No Cedar Hill 53,545.71<br />
<strong>Jefferson</strong> <strong>County</strong>* No No Dittmer 12,113.50<br />
<strong>Jefferson</strong> <strong>County</strong>* No No <strong>Jefferson</strong> 21,694.70<br />
<strong>Jefferson</strong> <strong>County</strong>* No No Eureka 26,756.33<br />
<strong>Jefferson</strong> <strong>County</strong>* No No Eureka 188,979.73<br />
<strong>Jefferson</strong> <strong>County</strong>* No No Eureka 41,783.77<br />
<strong>Jefferson</strong> <strong>County</strong>* No No Hillsboro 29,854.69<br />
<strong>Jefferson</strong> <strong>County</strong>* No Yes Fenton St Louis 25,048.42<br />
<strong>Jefferson</strong> <strong>County</strong>* No Yes Fenton 47,650.03<br />
<strong>Jefferson</strong> <strong>County</strong>* No No Eureka 28,069.75<br />
<strong>Jefferson</strong> <strong>County</strong>* No No House Springs 94,470.90<br />
<strong>Jefferson</strong> <strong>County</strong>* No Yes Cedar Hill 34,638.00<br />
<strong>Jefferson</strong> <strong>County</strong>* No No <strong>Jefferson</strong> City 97,584.24<br />
<strong>Jefferson</strong> <strong>County</strong>* No No High Ridge 18,307.06<br />
<strong>Jefferson</strong> <strong>County</strong>* No No Mo 13,783.47<br />
<strong>Jefferson</strong> <strong>County</strong>* No No Cedar Hill 5,076.06<br />
<strong>Jefferson</strong> <strong>County</strong>* No Yes Cedar Hill 49,716.59<br />
<strong>Jefferson</strong> <strong>County</strong>* No No 63016 5,725.09<br />
<strong>Jefferson</strong> <strong>County</strong>* No No Cedar Hl 4,821.09<br />
<strong>Jefferson</strong> <strong>County</strong>* No No Fenton 86,360.55<br />
<strong>Jefferson</strong> <strong>County</strong>* No No Fenton 73,151.71<br />
<strong>Jefferson</strong> <strong>County</strong>* No Yes Fenton 47,155.17<br />
<strong>Jefferson</strong> <strong>County</strong>* No Yes Fenton 60,581.79<br />
<strong>Jefferson</strong> <strong>County</strong>* No Yes Fenton 105,948.21<br />
<strong>Jefferson</strong> <strong>County</strong>* No Yes Fenton, 43,074.34<br />
<strong>Jefferson</strong> <strong>County</strong>* No Yes Fenton 28,051.82<br />
<strong>Jefferson</strong> <strong>County</strong>* No No Barnhart 227,363.97<br />
<strong>Jefferson</strong> <strong>County</strong>* No No Morse Mill 56,764.03<br />
<strong>Jefferson</strong> <strong>County</strong>* No No Dittmer 59,590.68<br />
<strong>Jefferson</strong> <strong>County</strong>* No No <strong>Jefferson</strong> <strong>County</strong> 15,878.44<br />
<strong>Jefferson</strong> <strong>County</strong>* No No <strong>Jefferson</strong> Ct. 4,797.69<br />
<strong>Jefferson</strong> <strong>County</strong>* No No <strong>Jefferson</strong> Ct. 39,318.98<br />
<strong>Jefferson</strong> <strong>County</strong>* No No Cedar Hill 23,826.30<br />
<strong>Jefferson</strong> <strong>County</strong>* No No Cedar Hl 55,102.64<br />
<strong>Jefferson</strong> <strong>County</strong>* No Yes House Springs 26,705.98<br />
<strong>Jefferson</strong> <strong>County</strong>* No No House Springs 74,499.23<br />
<strong>Jefferson</strong> <strong>County</strong>* No Yes House Springs 66,486.73<br />
<strong>Jefferson</strong> <strong>County</strong>* No No Barnhart, Mo 32,004.83<br />
<strong>Jefferson</strong> <strong>County</strong>* No Yes Osage City 27,073.30<br />
<strong>Jefferson</strong> <strong>County</strong>* No No House Springs 63,985.24<br />
<strong>Jefferson</strong> <strong>County</strong>* No No Cedar Hill 29,173.00
30<br />
<strong>Jefferson</strong> <strong>County</strong> – Section 2<br />
TABLE J29 JEFFERSON COUNTY REPETITIVE LOSS PROPERTIES<br />
COMMUNITY NAME Mitigated? Insured? CITY TOTAL PAID<br />
<strong>Jefferson</strong> <strong>County</strong>* No No Cedar Hills 28,529.11<br />
<strong>Jefferson</strong> <strong>County</strong>* No No Cedar Hill 45,474.07<br />
<strong>Jefferson</strong> <strong>County</strong>* No No Cedar Hill 61,603.84<br />
<strong>Jefferson</strong> <strong>County</strong>* No No Cedar Hill 13,320.72<br />
<strong>Jefferson</strong> <strong>County</strong>* No No Cedar Hill 5,897.97<br />
<strong>Jefferson</strong> <strong>County</strong>* No No Cedar Hill 14,958.05<br />
<strong>Jefferson</strong> <strong>County</strong>* No Yes Cedar Hill 3,351.71<br />
<strong>Jefferson</strong> <strong>County</strong>* No No Cedar Hill 4,899.25<br />
<strong>Jefferson</strong> <strong>County</strong>* No No Cedar Hill 102,396.90<br />
<strong>Jefferson</strong> <strong>County</strong>* No No Cedar Hill 14,537.42<br />
<strong>Jefferson</strong> <strong>County</strong>* No No Cedar Hills 8,606.64<br />
<strong>Jefferson</strong> <strong>County</strong>* No No Cedar Hill 17,832.50<br />
<strong>Jefferson</strong> <strong>County</strong>* No No Cedar Hill 31,895.82<br />
<strong>Jefferson</strong> <strong>County</strong>* No No Eureka 18,100.31<br />
<strong>Jefferson</strong> <strong>County</strong>* No Yes Desoto, 12,221.78<br />
<strong>Jefferson</strong> <strong>County</strong>* No No Cedar Hill 100,989.59<br />
<strong>Jefferson</strong> <strong>County</strong>* No Yes Cedar Hill 11,850.07<br />
<strong>Jefferson</strong> <strong>County</strong>* No Yes Desoto 8,463.43<br />
<strong>Jefferson</strong> <strong>County</strong>* No No Cedar Hill 34,893.80<br />
<strong>Jefferson</strong> <strong>County</strong>* No Yes Dittmer 50,989.61<br />
<strong>Jefferson</strong> <strong>County</strong>* No Yes Dittmer 5,362.57<br />
<strong>Jefferson</strong> <strong>County</strong>* No No Dittmer 119,615.09<br />
<strong>Jefferson</strong> <strong>County</strong>* No No Dittmer 27,117.96<br />
<strong>Jefferson</strong> <strong>County</strong>* No No Cedar Hill 84,785.90<br />
<strong>Jefferson</strong> <strong>County</strong>* No No Cedar Hill 13,103.30<br />
<strong>Jefferson</strong> <strong>County</strong>* No No N Rge 5e 25,053.75<br />
<strong>Jefferson</strong> <strong>County</strong>* No No Dellwood 22,935.89<br />
<strong>Jefferson</strong> <strong>County</strong>* No Yes Cedar Hill 300,138.13<br />
<strong>Jefferson</strong> <strong>County</strong>* No No <strong>Jefferson</strong> 32,969.04<br />
<strong>Jefferson</strong> <strong>County</strong>* No No Cedar Hill 41,301.24<br />
<strong>Jefferson</strong> <strong>County</strong>* No No <strong>Jefferson</strong> Co 8,760.58<br />
<strong>Jefferson</strong> <strong>County</strong>* No Yes Eureka 38,888.63<br />
<strong>Jefferson</strong> <strong>County</strong>* No No Cedar Hill 73,465.98<br />
<strong>Jefferson</strong> <strong>County</strong>* No No Cedar Hill 5,662.55<br />
<strong>Jefferson</strong> <strong>County</strong>* No No <strong>Jefferson</strong> 19,689.25<br />
<strong>Jefferson</strong> <strong>County</strong>* No No Cedar Hill 35,774.39<br />
<strong>Jefferson</strong> <strong>County</strong>* No No Cedar Hill 10,917.50<br />
<strong>Jefferson</strong> <strong>County</strong>* No No Cedar Hills 20,939.54<br />
<strong>Jefferson</strong> <strong>County</strong>* No No Oakville 22,369.06<br />
<strong>Jefferson</strong> <strong>County</strong>* No No Cedar Hill 9,094.38<br />
<strong>Jefferson</strong> <strong>County</strong>* No Yes Eureka 26,068.58<br />
<strong>Jefferson</strong> <strong>County</strong>* No No Eureka 69,660.05<br />
<strong>Jefferson</strong> <strong>County</strong>* No No Eureka 53,675.71<br />
<strong>Jefferson</strong> <strong>County</strong>* No No Eureka 17,205.66
A Regional Overview All-Hazard Mitigation Plan 31<br />
TABLE J29 JEFFERSON COUNTY REPETITIVE LOSS PROPERTIES<br />
COMMUNITY NAME Mitigated? Insured? CITY TOTAL PAID<br />
<strong>Jefferson</strong> <strong>County</strong>* No No Eureka Mo 20,675.62<br />
<strong>Jefferson</strong> <strong>County</strong>* No No Eureka 35,196.27<br />
<strong>Jefferson</strong> <strong>County</strong>* No No Eureka 21,741.05<br />
<strong>Jefferson</strong> <strong>County</strong>* No Yes Eureka 4,959.92<br />
<strong>Jefferson</strong> <strong>County</strong>* No No Eureka 26,043.32<br />
<strong>Jefferson</strong> <strong>County</strong>* No No Eureka, Mo 21,655.24<br />
<strong>Jefferson</strong> <strong>County</strong>* No Yes Eureka 60,948.22<br />
<strong>Jefferson</strong> <strong>County</strong>* No Yes Eureka 18,106.67<br />
<strong>Jefferson</strong> <strong>County</strong>* No No Eureka 55,476.44<br />
<strong>Jefferson</strong> <strong>County</strong>* No No Eureka 36,003.15<br />
<strong>Jefferson</strong> <strong>County</strong>* No No Eureka 10,037.77<br />
<strong>Jefferson</strong> <strong>County</strong>* No Yes Eureka 18,785.60<br />
<strong>Jefferson</strong> <strong>County</strong>* No No Eureka 19,374.63<br />
<strong>Jefferson</strong> <strong>County</strong>* No No High Ridge 22,180.53<br />
<strong>Jefferson</strong> <strong>County</strong>* No Yes Eureka 140,161.30<br />
<strong>Jefferson</strong> <strong>County</strong>* No Yes Eureka 152,247.38<br />
<strong>Jefferson</strong> <strong>County</strong>* No No Eureka 20,312.62<br />
<strong>Jefferson</strong> <strong>County</strong>* No No <strong>Jefferson</strong> 7,610.68<br />
<strong>Jefferson</strong> <strong>County</strong>* No Yes Barnhart Mo 68,150.09<br />
<strong>Jefferson</strong> <strong>County</strong>* No No St Louis 4,896.23<br />
<strong>Jefferson</strong> <strong>County</strong>* No Yes Cedar Hill 26,281.32<br />
<strong>Jefferson</strong> <strong>County</strong>* No No Cedar Hill 29,666.07<br />
<strong>Jefferson</strong> <strong>County</strong>* No Yes Cedar Hill, Mo 32,593.62<br />
<strong>Jefferson</strong> <strong>County</strong>* No Yes Arnold 68,397.48<br />
<strong>Jefferson</strong> <strong>County</strong>* No No Ariuclid 26,255.40<br />
<strong>Jefferson</strong> <strong>County</strong>* No No Cedar Hill 34,234.32<br />
<strong>Jefferson</strong> <strong>County</strong>* No No Dittmer, Mo 13,758.77<br />
<strong>Jefferson</strong> <strong>County</strong>* No No Eureka 57,716.31<br />
<strong>Jefferson</strong> <strong>County</strong>* No Yes Eureka 23,656.74<br />
<strong>Jefferson</strong> <strong>County</strong>* No No Eureka 38,037.43<br />
<strong>Jefferson</strong> <strong>County</strong>* No No Fenton 41,892.28<br />
<strong>Jefferson</strong> <strong>County</strong>* No Yes Eureka 22,622.71<br />
<strong>Jefferson</strong> <strong>County</strong>* No Yes Eureka 64,015.08<br />
<strong>Jefferson</strong> <strong>County</strong>* No No Eureka 75,160.25<br />
<strong>Jefferson</strong> <strong>County</strong>* No No Eureka 21,996.18<br />
<strong>Jefferson</strong> <strong>County</strong>* No No Kimmswick 121,233.68<br />
<strong>Jefferson</strong> <strong>County</strong>* No No Byrnes Mill 20,553.28<br />
<strong>Jefferson</strong> <strong>County</strong>* No No Dittmer 118,772.29<br />
<strong>Jefferson</strong> <strong>County</strong>* No No Cedar Hill 16,485.48<br />
<strong>Jefferson</strong> <strong>County</strong>* No No Cedar Hill Mo 130,206.74<br />
<strong>Jefferson</strong> <strong>County</strong>* No No Cedar Hill 57,621.42<br />
<strong>Jefferson</strong> <strong>County</strong>* No No Fenton 13,953.86<br />
<strong>Jefferson</strong> <strong>County</strong>* No No Dittmer 21,602.32<br />
<strong>Jefferson</strong> <strong>County</strong>* No No Eureka Gdns Jef 42,493.79
32<br />
<strong>Jefferson</strong> <strong>County</strong> – Section 2<br />
TABLE J29 JEFFERSON COUNTY REPETITIVE LOSS PROPERTIES<br />
COMMUNITY NAME Mitigated? Insured? CITY TOTAL PAID<br />
<strong>Jefferson</strong> <strong>County</strong>* No Yes Cedar Hill 191,030.44<br />
<strong>Jefferson</strong> <strong>County</strong>* No No Imperial 27,127.61<br />
<strong>Jefferson</strong> <strong>County</strong>* No No Barnhart 97,826.56<br />
<strong>Jefferson</strong> <strong>County</strong>* No No Barnhart 15,021.01<br />
<strong>Jefferson</strong> <strong>County</strong>* Yes No Arnold 125,583.84<br />
<strong>Jefferson</strong> <strong>County</strong>* Yes No Arnold 16,100.00<br />
<strong>Jefferson</strong> <strong>County</strong>* Yes No Arnold 63,632.55<br />
<strong>Jefferson</strong> <strong>County</strong>* Yes No Eureka 63,123.44<br />
<strong>Jefferson</strong> <strong>County</strong>* Yes No House Springs 54,264.75<br />
<strong>Jefferson</strong> <strong>County</strong>* Yes No Fenton 10,000.00<br />
<strong>Jefferson</strong> <strong>County</strong>* Yes No Fenton 59,181.52<br />
<strong>Jefferson</strong> <strong>County</strong>* Yes No Eureka 23,913.66<br />
<strong>Jefferson</strong> <strong>County</strong>* Yes No Eureka 22,072.72<br />
<strong>Jefferson</strong> <strong>County</strong>* Yes No Barnhart 149,234.30<br />
<strong>Jefferson</strong> <strong>County</strong>* Yes No Hillsboro 61,550.67<br />
<strong>Jefferson</strong> <strong>County</strong>* Yes No Eureka 22,237.04<br />
<strong>Jefferson</strong> <strong>County</strong>* Yes No Imperial 29,291.55<br />
<strong>Jefferson</strong> <strong>County</strong>* Yes No Cedar Head 13,649.99<br />
<strong>Jefferson</strong> <strong>County</strong>* Yes No Hillsboro 9,122.75<br />
<strong>Jefferson</strong> <strong>County</strong>* Yes No Eureka 57,614.90<br />
<strong>Jefferson</strong> <strong>County</strong>* Yes No Eureka 16,920.94<br />
<strong>Jefferson</strong> <strong>County</strong>* Yes No Riverhaven 12,199.33<br />
<strong>Jefferson</strong> <strong>County</strong>* Yes No Eureka 39,207.94<br />
<strong>Jefferson</strong> <strong>County</strong>* Yes No Eureka 66,981.18<br />
<strong>Jefferson</strong> <strong>County</strong>* Yes No Eureka 84,028.46<br />
<strong>Jefferson</strong> <strong>County</strong>* Yes No Eureka 38,871.96<br />
Total 25,278,987.09<br />
Source: SEMA<br />
Other areas that are in the 100 and 500-year floodplain that are susceptible to flooding<br />
include the following areas within <strong>Jefferson</strong> <strong>County</strong>:<br />
DeSoto<br />
Joachim Creek flash flooding along Cedar St. & near high school<br />
Valley St. Culvert flooding<br />
N. Main St. Artery<br />
Festus<br />
Flooding on Highway BB<br />
Flooding on Highway W. Old 21<br />
Flooding on Highway 61/67<br />
Flooding on Highway 55
A Regional Overview All-Hazard Mitigation Plan 33<br />
Kimmswick<br />
Rock Creek floods Hwy K under 33 feet of water.<br />
Seasonal Pattern<br />
The <strong>East</strong>-<strong>West</strong> <strong>Gateway</strong> <strong>Council</strong> of Governments planning region (namely, <strong>Jefferson</strong><br />
<strong>County</strong>) typically obtains most of its wet weather in the spring months (April, May, June<br />
and July). Seasonal patterns are depicted on the Table J30 below.<br />
TABLE J30 SEASONAL FLOODING PATTERNS IN NEAR<br />
JEFFERSON COUNTY ALONG MISSISIPPI RIVER<br />
Month Number of Events<br />
January 0<br />
February 0<br />
March 0<br />
April 5<br />
May 2<br />
June 2<br />
July 2<br />
August 1<br />
September 0<br />
October 1<br />
November 0<br />
December 1<br />
Therefore, the floodplain areas are highly likely to experience one or more flood events<br />
during the months of April through July.<br />
Speed Of Onset And /Or Existing Warning Systems<br />
Depending upon the weather forecasts, the speed of onset of flash floods can be almost<br />
instantaneous. Existing warning systems are issued by the National Weather Service and<br />
the local media (television stations, the Weather Channel and local radio stations); USACE,<br />
USGS river stages warnings are given that enable communities to plan for flood events.<br />
The National Weather Service prepares its forecasts and other services in collaboration with<br />
agencies like the U.S. Geological Survey, U.S. Bureau of Reclamation, U.S. Army Corps of<br />
Engineers, Natural Resource Conservation Service, National Park Service, ALERT Users<br />
Group, Bureau of Indian Affairs, and many state and local emergency managers across the<br />
country.<br />
Hazard Map for Flood Events<br />
Refer to Figures J23 and J24 (located in the Technical Appendix) that depict the areas of<br />
the county susceptible to the 100 and 500-year floods.
34<br />
Statement of Probable Future Severity<br />
<strong>Jefferson</strong> <strong>County</strong> – Section 2<br />
According to SEMA’s Severity Ratings Table, the 1993 floods would qualify as critical.<br />
During the 1993 floods, some facilities were closed for more than 24 hours. Other flood<br />
events had minimal impact on quality of life, no critical facilities or services were shut down<br />
for more than 24 hours, and property damage for the county was about 11%. Therefore,<br />
the probable severity of future floods could range from critical in the floodplain areas to<br />
negligible in the areas outside of the floodplains.<br />
Statement of Probable Risk<br />
Flooding in <strong>Jefferson</strong> <strong>County</strong> is likely to occur in the future. <strong>Jefferson</strong> <strong>County</strong> faces two<br />
major factors for flooding. First, the land that forms <strong>Jefferson</strong> <strong>County</strong> is included the area<br />
that drains to the Mississippi and Meramec River. Secondly, according to the FIRM, 11% of<br />
the land for the <strong>Jefferson</strong> <strong>County</strong> lies within the 100-year floodplain. The majority of that<br />
land lies adjacent to the Mississippi River levees and the Meramec River. The Mississippi<br />
River has experienced 14 major flood events since 1785. The Meramec River has<br />
experienced 15 flood events in the last 22 years.<br />
Statement of Next Disaster’s Likely Adverse Impact on the Community<br />
The next flood to invade <strong>Jefferson</strong> <strong>County</strong> would follow the pattern of the 1993 floods.<br />
However, post-1993 mitigation measures already have been tested in the 1995 and 2001<br />
flooding along the Mississippi and Meramec River. Despite high river levels, damages were<br />
relatively minimal due to relocation of many homes and businesses. Adverse impacts of<br />
future Mississippi and Meramec River floods are discussed below.<br />
Without Mitigation Measures:<br />
Life: Limited<br />
Property: Limited<br />
Emotional: Limited<br />
Financial: Limited<br />
Comments: The above impacts assume conditions at the time of the 1993 floods over<br />
the entire county. Impacts within the floodplain would be catastrophic; impacts outside of<br />
the floodplain would be negligible.<br />
With Mitigation Measures:<br />
Life: Negligible<br />
Property: Negligible<br />
Emotional: Negligible<br />
Financial: Negligible<br />
Comments: Mitigation measures have already begun in the wake of the 1990s floods.<br />
Further mitigation measures should be directed at improving land use practices and<br />
redesigning vulnerable highways.
A Regional Overview All-Hazard Mitigation Plan 35<br />
Recommendation<br />
In 1996, MDNR/DGLS, Dick Gaffney prepared a Flood Analysis Report, based on four<br />
documents: The Report and Recommendations of the Governor’s Task Force on Flood Plain<br />
Management on behalf of Governor Carnahan, July, 1994; The Floods of ’93, State of<br />
Missouri -- The Federal Interagency Hazard Mitigation Team, Report For the Three<br />
Presidential Disaster Declarations in Missouri, April, 1994, as set up by FEMA under 1988<br />
Stafford Act; Sharing the Challenge: Floodplain Management into 21 st Century -- The<br />
Report of the Interagency Floodplain Management Review Committee to the<br />
Administration (Whitehouse) Floodplain Management Task Force; A Blueprint for Change,<br />
June, 1994 and National Flood Policy in Review-1994 by Association of State Floodplain<br />
Managers (ASFPM). Recommendations made by these documents are summarized below:<br />
All four post-flood reports recommend that the state should take an active role in<br />
flood plain management, determine state flood plain management, determine state<br />
flood plain management policy and implement it.<br />
The reports generally agreed that the hydrology of the Missouri and the Mississippi<br />
rivers should be reviewed, with the possible result that base flood elevations should<br />
be recalculated and new flood maps issued.<br />
The encouragement of participation in the National Flood Insurance Program, both<br />
by communities and individual property owners was stressed to the point that<br />
recommendations stated that post-flood disaster assistance to those not insured<br />
should be limited, reduced or withheld. The problems of mortgage lenders and<br />
borrowers were addressed and escrow of premiums for flood insurance was<br />
emphasized.<br />
Maintaining flood insurance purchase requirements behind levee protection works<br />
was recommended. Further, it was recommended that the state develop a<br />
definition of market value to assure compliance with flood insurance regulations,<br />
dealing with substantial damages.<br />
Levees, levee districts, levee protection systems, state levee permits, levee<br />
construction criteria, levee repairs and levee heights were addressed by the four<br />
reports as a result of the levee failures in the 1993 flooding. More state<br />
involvement in this topic was universally recommended, especially with regard to<br />
oversight and permits. These recommendations imply that it is critical with respect<br />
to property owners and their lives that the flood stages remain stable (does not<br />
fluctuate as a result of levees built upstream). The aggregate result will be to<br />
increase the flood danger by increasing the height and velocity of river flow during<br />
floods.<br />
Greater environmental sensitivity and increased state government involvement in<br />
flood plain matters was stressed in the post-flood reports. Public health and safety<br />
during flood events was also stressed, especially in regard to hazardous materials.<br />
Government agencies should inventory their property to determine their<br />
vulnerability to future flooding.<br />
Federal agencies should collaborate on an assessment of effectiveness of stream<br />
gauging network and flood forecasting/models.
36<br />
<strong>Jefferson</strong> <strong>County</strong> – Section 2<br />
Insurance should be purchased behind levees to protect citizens against future flood<br />
losses.<br />
Need of a state definition of market value due to 1) NFIP rules not providing a<br />
definition and 2). FEMA not abiding by its definition of market value.<br />
Remove substantially and repetitively damaged structures from flood plains.<br />
Acquire easements on lands through Emergency Wetlands Reserve program,<br />
Conservation Reserve program, USFW.<br />
Ensure that placement/security of hazardous materials on floodplains is done.<br />
Earthquake Hazard Profile<br />
Background<br />
The State of Missouri established the Missouri Seismic Safety Commission (MSSC) through<br />
the authority of the Seismic Safety Commission Act also known as (RSMo) Sections 44.225<br />
through 44.237, the main office being within SEMA. The purpose of MSSC is to review<br />
Missouri’s current preparedness for major earthquakes and to make recommendations to<br />
mitigate their impact. MSSC developed a 1997 plan titled A Strategic Plan for Earthquake<br />
Safety that documented successes, opportunities and concerns including<br />
recommendations: 1) that educational efforts continue to be developed and expanded and<br />
that the MSSC take the lead; 2) that continued and increased cooperation of State agencies<br />
with nationally funded programs (National Science Foundation funding the Mid-America<br />
Earthquake Center); 3) that stable State funding be provided for the Missouri earthquake<br />
mitigation and preparedness program; 4) that SEMA review and recommend hiring a<br />
person to train and tract the Community Emergency Response Teams [CERT]; and 5) to<br />
assess the impact of National Hazard Earthquake Reduction Program maps on the state<br />
and that scientific investigations be conducted to evaluate assumptions upon which maps<br />
are based.<br />
The MSSC prepared the A Strategic Plan for Earthquake Safety as the result of a legislative<br />
mandate, Senate Bill No. 142 in 1993. The MSCC is similar to Utah’s Seismic Safety<br />
Commission. This plan will aid in projecting goals, initiatives and priorities. The MSCC<br />
notes that preparation following the Strategic Plan will yield significant reduction in<br />
fatalities, casualties, damaged structures, business failures and state infrastructure losses<br />
from earthquakes and will reduce the impact from other hazards. Key issues identified by<br />
MSSC are: 1) Earthquake threat is real. Addressing the problem now will yield significant<br />
long-term benefits; 2) Reduction of earthquake risk required combined efforts of<br />
individuals, businesses, industry, professional and volunteer organizations and all levels of<br />
government [promote adoption and enforcement of appropriate building codes]; 3)<br />
Strategies identified in the report for reducing earthquake risk can be implemented<br />
through proactive, voluntary community participation; others will require legislation or<br />
funding, [promote community emergency response teams-CERTs, 4) MSSC accepts<br />
responsibilities to advance earthquake planning and mitigation in state at outlined in plan.
A Regional Overview All-Hazard Mitigation Plan 37<br />
Objectives include: 1) increase earthquake awareness and education, 2) reduce earthquake<br />
hazard through mitigation, 3) create response efforts that are well-coordinated, fast,<br />
efficient to reduce injury, loss of life and property destruction, 4) improve recovery from<br />
seismic event [identify earthquake resistant shelters], 5) assess earthquake hazard [develop<br />
response team to evaluate post-earthquake effects].<br />
Description<br />
Earthquake is a term used to describe both sudden slip on a fault, and the resulting ground<br />
shaking and radiated seismic energy caused by the slip, or by volcanic or magmatic activity,<br />
or other sudden stress changes in the earth. The Earth’s crust is made up of large plates,<br />
also known as tectonic plates. These plates are the large, thin, relatively rigid plates that<br />
move relative to one another on the outer surface of the Earth. Plate tectonics involves the<br />
formation, lateral movement, interaction, and destruction of the lithospheric plates (The<br />
lithosphere is the outer solid part of the earth, including the crust and uppermost mantle.<br />
The lithosphere is about 100 km thick, although its thickness is age dependent (older<br />
lithosphere is thicker). The lithosphere below the crust is brittle enough at some locations<br />
to produce earthquakes by faulting, such as within a subducted oceanic plate). Much of<br />
Earth's internal heat is relieved through this process and many of Earth's large structural<br />
and topographic features are consequently formed. Continental rift valleys (the nearby<br />
New Madrid Fault Zone is considered a buried rift valley) and vast plateaus of basalt are<br />
created at plate break up when magma ascends from the mantle to the ocean floor,<br />
forming new crust and separating midocean ridges. Plates collide and are destroyed as<br />
they descend at subduction zones to produce deep ocean trenches, strings of volcanoes,<br />
extensive transform faults, broad linear rises, and folded mountain belts. Earth's<br />
lithosphere presently is divided into eight large plates with about two dozen smaller ones<br />
that are drifting above the mantle at the rate of 5 to 10 centimeters (2 to 4 inches) per<br />
year. There are eight large plates; the New Madrid Fault Zone is located in the North<br />
American Plate.<br />
Earthquake induced landslides and dam failure/levee failure are secondary earthquake<br />
hazards that occur from ground shaking. Damage resulting from landslides is similar to<br />
that from earthquakes. Damage resulting from dam failure/levee failure is similar to that<br />
with flash flooding.
38<br />
FIGURE J25 LANDSLIDE POTENTIAL<br />
Source: United States Geological Survey<br />
<strong>Jefferson</strong> <strong>County</strong> – Section 2<br />
Landslides constitute a major geologic hazard because they are widespread, occurring in all<br />
50 states, and cause $1-2 billion in damages and more than 25 fatalities on average each<br />
year. Landslides pose serious threats to highways and structures that support fisheries,<br />
tourism, timber harvesting, mining, and energy production as well as general<br />
transportation. Landslides commonly occur with other major disasters such as earthquakes<br />
and floods that exacerbate relief and reconstruction efforts and expanded development<br />
and other land use has increased the incidence of landslide disasters. Refer to Figure J25<br />
above and J26 (located in the back of the Technical Appendix).<br />
Landslides and other types of earth movements including sinkhole and mine shaft collapse<br />
have occurred in the St. Louis metropolitan. The Warsaw Formation and the Maquoketa<br />
Shale are the two geologic strata present in the region in which landslides occur. The<br />
Warsaw is about 80 to 100 feet thick and is very shaley in these counties. The Maquoketa<br />
Shale is a thinly laminated, clayey silty, calcareous or dolomitic shale and ranges in<br />
thickness locally between 0 to 20 feet. Unstable shales are subject to lateral movement,<br />
especially if the natural slope is disturbed by construction. A foreseeable consequence of<br />
construction in this geologic setting would be disturbance of natural moisture drainage on<br />
the slope that could lubricate the shales interlayered with limestone. The resultant loss of<br />
resistance to lateral movement in the shale beds would have a tendency to accelerate the<br />
downhill creep of associated limestone beds that could be followed by a landslide. Table<br />
J33 below summarizes landslide, sinkhole and underground mine shaft earth movements<br />
in the St. Louis metropolitan region, including <strong>Jefferson</strong> <strong>County</strong>. In its early history, areas<br />
in <strong>Jefferson</strong> <strong>County</strong> had been mined for silica and limestone, and has a lead smelter located<br />
in Herculaneum.<br />
The enormous damages from landslides can be reduced. The primary objective of the<br />
Landslide Hazards Program is to reduce long-term losses from these hazards by improving<br />
our understanding of the causes of ground failure and suggesting mitigation strategies.
A Regional Overview All-Hazard Mitigation Plan 39<br />
The term landslide includes a wide range of ground movement, such as rock falls, deep<br />
failure of slopes, and shallow debris flows. Although gravity acting on an over steepened<br />
slope is the primary reason for a landslide, there are other contributing factors:<br />
• erosion by rivers, glaciers, or ocean waves create oversteepened slopes<br />
• rock and soil slopes are weakened through saturation by snowmelt or heavy rains<br />
• earthquakes create stresses that make weak slopes fail<br />
• earthquakes of magnitude 4.0 and greater have been known to trigger landslides<br />
• volcanic eruptions produce loose ash deposits, heavy rain, and debris flows<br />
• excess weight from accumulation of rain or snow, stockpiling of rock or ore, from<br />
waste piles, or from man-made structures may stress weak slopes to failure and<br />
other structures<br />
Slope materials that become saturated with water may develop a debris flow or mud flow.<br />
The resulting slurry of rock and mud may pick up trees, houses, and cars, thus blocking<br />
bridges and tributaries causing flooding along its path. Features that might be noticed<br />
prior to major landsliding:<br />
• Springs, seeps, or saturated ground in areas that have not typically been wet before.<br />
• New cracks or unusual bulges in the ground, street pavements or sidewalks.<br />
• Soil moving away from foundations.<br />
• Ancillary structures such as decks and patios tilting and/or moving relative to the<br />
main house.<br />
• Tilting or cracking of concrete floors and foundations.<br />
• Broken water lines and other underground utilities.<br />
• Leaning telephone poles, trees, retaining walls or fences<br />
• Offset fence lines.<br />
• Sunken or down-dropped road beds.<br />
• Rapid increase in creek water levels, possibly accompanied by increased turbidity<br />
(soil content).<br />
• Sudden decrease in creek water levels though rain is still falling or just recently<br />
stopped.<br />
• Sticking doors and windows, and visible open spaces indicating jambs and frames<br />
out of plumb.<br />
Characteristics<br />
The characteristics of earthquakes include the rolling or shaking of the surface of the<br />
ground, landslides, liquefaction and amplification. The severity of these hazards depends<br />
on several factors, including soil and slope conditions, proximity to the fault, earthquake<br />
magnitude and type of earthquake.
40<br />
Likely Locations<br />
<strong>Jefferson</strong> <strong>County</strong> – Section 2<br />
Earthquakes occur all the time all over the world, both along plate edges and along faults.<br />
Most earthquakes occur along the edge of the oceanic and continental plates. Likely<br />
locations of earthquakes that would affect <strong>Jefferson</strong> <strong>County</strong> would come from the New<br />
Madrid Fault Zone, the Wabash Valley Fault and the fault zones in the vicinity of<br />
Farmington (including Big River Fault and the St. Genevieve Fault Zone) because of their<br />
close proximity and the geologic setting of <strong>Jefferson</strong> <strong>County</strong>.<br />
Type of Damage<br />
Buildings on poorly consolidated and thick soils will typically have more damage than<br />
buildings located on consolidated soils and bedrock. Soils and soft sedimentary rocks near<br />
the earth’s surface and landfills can modify ground shaking caused by earthquakes. One of<br />
these modifications is amplification. Amplification increases the magnitude of the seismic<br />
waves generated by the earthquake. The amount of amplification is influenced by the<br />
thickness of geologic materials and their physical properties. Buildings and structures built<br />
on soft and unconsolidated soils can face greater risk. Damage on buildings can range<br />
from minor foundation cracks to complete leveling of the structure. Refer to Figures J27<br />
and J28 below. Building contents can be broken from being knocked onto the floor or<br />
being crushed by the ceiling, walls and floor failing. Dams and levees have the potential to<br />
fail, resulting in the flooding of downstream regions including residentially populated<br />
areas.<br />
Liquefaction occurs when ground shaking causes wet granular soils to change from a solid<br />
state to a liquid state. This results in the loss of soil strength and the soil’s ability to<br />
support weight. Buildings and their occupants are at risk when the ground can no longer<br />
support these structures. Damage from liquefaction can destroy the buildings and the<br />
foundations the buildings rest on. Liquefaction has been documented from the New<br />
Madrid Fault Zone earthquake activity.<br />
According to Dr. Robert Herrmann, geophysicist with St. Louis University’s Earthquake<br />
Center, the St. Louis Metropolitan region is 150 miles or so from the New Madrid Fault<br />
Zone. He noted that if there was an earthquake of magnitude 6.6 or so, <strong>Jefferson</strong> <strong>County</strong><br />
would feel it; a lot of the damage would be minor, and not many collapses. If there was<br />
an earthquake of magnitude 8, there would be a good bit of damage, but the region<br />
would not be leveled.<br />
Earthquakes and landslides have the potential to destroy roads, bridges, buildings<br />
(especially older buildings constructed of masonry or those buildings that are not designed<br />
to seismic standards), utilities (including those that are not designed to seismic standards)<br />
and other critical facilities (including those that are not designed to seismic standards).<br />
Earthquake induced landslides are secondary earthquake hazards that occur from ground<br />
shaking. Damage resulting from landslides is similar to that from earthquakes.
A Regional Overview All-Hazard Mitigation Plan 41<br />
FIGURE J27 INTERIOR DAMAGE FIGURE J28 EXTERIOR DAMAGE<br />
Hazard Event History<br />
Source for both photographs: United States Geological Survey website<br />
The central Mississippi Valley has more earthquakes than any other part of the United<br />
States east of the Rocky Mountains. The region was struck by three of the most powerful<br />
earthquakes in United States history. These magnitude 8 quakes, centered near the town<br />
of New Madrid (Missouri), devastated the surrounding region and rang church bells 1,000<br />
miles away in Boston. The scars that those great earthquakes made on the landscape<br />
remain-the quakes locally changed the course of the Mississippi River and created Reelfoot<br />
Lake, which covers an area of more than 10 square miles in northwestern Tennessee. In<br />
recent decades, earth scientists have collected evidence that strong earthquakes in the<br />
central Mississippi Valley have occurred repeatedly in the geologic past. Small earthquakes<br />
occur in the region frequently. Scientists refer to the area in which most of these quakes<br />
occur as the New Madrid seismic zone (NMSZ). The New Madrid Seismic zone lies within<br />
the central Mississippi Valley, extending from northeast Arkansas, through southeast<br />
Missouri, western Tennessee, and western Kentucky to southern Illinois. Historically, this<br />
area has been the site of some of the largest earthquakes in North America. Between 1811<br />
and 1812, four catastrophic earthquakes, with magnitude estimates greater than 7.0,<br />
occurred during a three month period. Hundreds of aftershocks followed over a period of<br />
several years. The largest earthquakes to have occurred since then were on January 4,<br />
1843 and October 31, 1895 with magnitude estimates of 6.0 and 6.2 respectively. In<br />
addition to these events, seven events of magnitude 5.0 and greater have occurred in the<br />
area. Instruments were installed in and around this area in 1974 to closely monitor seismic<br />
activity. Since then, more than 4000 earthquakes have been located, most of which are<br />
too small to be felt. On average one earthquake per year will be large enough to be felt in<br />
the area.<br />
The most recent earthquake event affecting the <strong>East</strong>-<strong>West</strong> <strong>Gateway</strong> planning region was<br />
on June 6, 2003. The epicenter of the 4.0 magnitude earthquake was 4 miles southeast of<br />
Blandville, Kentucky and residents in the surrounding area felt the tremor. While impacts<br />
of this quake were inconsequential, Missouri has had three of the largest earthquakes in<br />
the contiguous United States; the three ranking #1, #2 and #4 in magnitude ranging
42<br />
<strong>Jefferson</strong> <strong>County</strong> – Section 2<br />
from 7.9 to 8.1. Projected losses, based on losses from recent earthquake activity in Loma<br />
Prieta, California, losses exceeded $6 billion dollars with over 28,000 homes and businesses<br />
destroyed and 63 lives lost and 3800 injuries in the event of a magnitude 6 earthquake.<br />
Earthquakes pose a serious threat to many Missouri communities. Local governments,<br />
planners, and engineers must consider the threat as they seek to balance development and<br />
risk. Identifying locations susceptible to seismic activity generated by nearby faults,<br />
adopting strong policies and implementing measures and using other mitigation<br />
techniques are essential to reducing risk from seismic hazards in the <strong>East</strong>-<strong>West</strong> <strong>Gateway</strong><br />
planning region. Table J31 below depicts the history of the large earthquakes in the<br />
region.<br />
TABLE J31 THE LARGEST EARTHQUAKES IN CONTIGUOUS U.S.<br />
Location Date Time UTC Magnitude<br />
1. New Madrid, Missouri 1811 12 16 08:15 UTC 8.1<br />
2. New Madrid, Missouri 1812 02 07 09:45 UTC 8<br />
3. Fort Tejon, California 1857 01 09 16:24 UTC 7.9<br />
4. New Madrid, Missouri 1812 01 23 15:00 UTC 7.8<br />
5. Imperial Valley, California 1892 02 24 07:20 UTC 7.8<br />
6. San Francisco, California 1906 04 18 13:12 UTC 7.8<br />
7. Owens Valley, California 1872 03 26 10:30 UTC 7.6<br />
8. Gorda Plate, California 1980 11 08 10:27 UTC 7.4<br />
9. N Cascades, Washington 1872 12 15 05:40 UTC 7.3<br />
10. California - Oregon Coast 1873 11 23 05:00 UTC 7.3<br />
11. Charleston, South Carolina 1886 09 01 02:51 UTC 7.3<br />
12. <strong>West</strong> of Eureka, California 1922 01 31 13:17 UTC 7.3<br />
13. Kern <strong>County</strong>, California 1952 07 21 11:52 UTC 7.3<br />
14. Hebgen Lake, Montana 1959 08 18 06:37 UTC 7.3<br />
Table J32 below illustrates seismic events from various eastern Missouri seismic sampling<br />
facilities that have been documented by St. Louis University and Southeast Missouri State<br />
University, CERI and CUSEC. To better understand the earthquake hazard, the scientific<br />
community has looked at historical records. Historical earthquake records can be divided<br />
into pre-instrumental and the instrumental period. In the absence of instruments, the<br />
detection of earthquakes is based on observations and felt reports, and is dependent upon<br />
population density and distribution. Newspapers and books from various cities around the<br />
nation (list) provide a good source of historical documentation of the 1811-1812<br />
earthquake. The seismic risk is more severe today than in the past because population is<br />
increasing.<br />
DATE OF SEISMIC<br />
EVENT<br />
TABLE J32 HISTORICAL EARTHQUAKE EVENTS<br />
SEISMIC EVENT MAGNITUDE OF<br />
SEISMIC EVENT<br />
FREQUENCY 1<br />
December 16, 1811 Earthquake occurred 195 miles south of<br />
EWG region<br />
8.0 -<br />
February 7, 1812 Earthquake occurred 165 miles south of<br />
EWG region<br />
8.2 1<br />
June 9, 1838 Earthquake occurred 60 miles south of 5.7 26
A Regional Overview All-Hazard Mitigation Plan 43<br />
DATE OF SEISMIC<br />
EVENT<br />
TABLE J32 HISTORICAL EARTHQUAKE EVENTS<br />
SEISMIC EVENT MAGNITUDE OF<br />
SEISMIC EVENT<br />
FREQUENCY 1<br />
January 4, 1843<br />
EWG region*<br />
Earthquake occurred 231 miles south of<br />
EWG region*<br />
6.0 7<br />
October 8, 1857 Earthquake occurred 51 miles south of<br />
EWG region*<br />
5.3 14<br />
October 31, 1895 Earthquake occurred 135 miles south of<br />
EWG region*<br />
6.2 38<br />
August 21, 1905 Earthquake occurred 138 miles south of<br />
EWG region*<br />
4.8 10<br />
April 9, 1917 Earthquake occurred 51 miles south of<br />
EWG region*<br />
5.0 12<br />
June 29, 1947 Earthquake occurred 33 miles south of<br />
EWG region*<br />
4.2 30<br />
April 9, 1955 Earthquake occurred 42 miles south of<br />
EWG region*<br />
4.5 8<br />
November 25, 1956 Earthquake occurred 120 miles south of<br />
EWG region*<br />
4.4 1<br />
October 20, 1965 Earthquake occurred 71 miles south of<br />
EWG region*<br />
4.8 9<br />
November 9, 1968 Earthquake occurred 100 miles south of<br />
EWG region*<br />
5.5 3<br />
September 20, 1978 Earthquake occurred 4.7 miles south of<br />
EWG region**<br />
3.1 10<br />
February 5, 1994 Earthquake occurred 101 miles south** 4.2 16<br />
January 15, 1998 Earthquake occurred 13 miles south of<br />
EWG region**<br />
2.4 4<br />
June 6, 2003 Earthquake occurred 10 miles southeast 4.0 5<br />
of Cairo, Ill; felt here<br />
Source:* Earthquake History of the United States;<br />
** Cooperative New Madrid Seismic Network Earthquake Bulletin, St. Louis<br />
University (Compiled by M. Whittington, Earthquake Center, St. Louis<br />
University)<br />
*** USGS Earthquake Hazard Program<br />
1 Number of years between seismic events<br />
TABLE J33 LANDSLIDE, SINKHOLE AND UNDERGROUND MINE SHAFT EARTH<br />
MOVEMENTS IN ST. LOUIS METROPOLITAN REGION<br />
LOCATION TYPE INSPECTION DATE<br />
Mehville Sinkhole collapse 3/17/91<br />
Arnold Landslide 12/16/94<br />
Grubville Sinkhole collapse 8/8/67<br />
<strong>Jefferson</strong> <strong>County</strong> Landslide 7/9/68<br />
Fenton Landslide 6/14/71<br />
High Ridge Sinkhole collapse 10/3/74<br />
Herculaneum Sinkhole collapse 11/23/83<br />
House Springs Sinkhole collapse 4/6/78<br />
Imperial Landslide 5/19/83<br />
<strong>Jefferson</strong> <strong>County</strong> Landslide N.A.
44<br />
<strong>Jefferson</strong> <strong>County</strong> – Section 2<br />
Herculaneum Landslide 2/25/85<br />
Imperial Landslide 6/12/90<br />
Hillsboro Underground mine shaft 3/27/91<br />
Sulfur Springs Landslide 4/18/97<br />
Imperial Landslide 7/14/98<br />
House Springs Rock Collapse 12/19/2002<br />
Green Jade Estates, <strong>Jefferson</strong> <strong>County</strong> Landslide 5/27/90<br />
Franklin <strong>County</strong> Sinkhole collapse 5/6/76<br />
Franklin <strong>County</strong> Sinkhole collapse 3/5/82<br />
Stanton Sinkhole collapse 2/8/94<br />
Franklin <strong>County</strong> Sinkhole collapse 1/2/92<br />
Franklin <strong>County</strong> Sinkhole collapse 7/31/90<br />
Washington Underground mine shaft N.A.<br />
Sullivan Sinkhole collapse 12/23/97<br />
Franklin <strong>County</strong> Sinkhole collapse 3/23/93<br />
St. Charles <strong>County</strong> Sinkhole collapse 12/14/77<br />
St. Charles <strong>County</strong> Sinkhole collapse 6/29/77<br />
Source: Missouri Department of Natural Resources<br />
Frequency of Occurrence<br />
Seismic scientists cannot predict the frequency of occurrence, although some have tried.<br />
Iben Browning predicted the onset of large-scale seismic events on December 3, 1990.<br />
However, his prediction was inaccurate. Since 1811, (182 years) there have been 16<br />
recorded earthquake events occurring in a random frequency as can be seen on Table J32<br />
above. While estimates of the recurrence intervals of the large 1811-1812 earthquakes are<br />
about 500-1000 years, smaller, but still destructive earthquakes are event more likely. The<br />
recurrence interval for a magnitude-6 earthquake is about 100 years. The last such<br />
earthquake was in 1895 near Charleston, Missouri.<br />
Another earthquake as powerful as the great quakes of 1811-12 may not occur for many<br />
years. However, scientists estimate that there is a 9-in-10 chance of a magnitude 6 to 7<br />
tremblor occurring in the NMSZ within the next 50 years. Because of differences in the<br />
geology east and west of the Rocky Mountains, the effects of a magnitude 7 quake in the<br />
mid-continent United States could be far worse than those of the 1989 magnitude 7 Loma<br />
Prieta, California, earthquake.<br />
In response to this threat, the USGS has been spearheading an effort to understand the<br />
causes of earthquakes in the Mississippi Valley. Initiated in the 1980's, this ongoing<br />
cooperative endeavor among universities, private agencies, state governments, and Federal<br />
agencies has two goals--to evaluate the level of the earthquake hazard and to help reduce<br />
the risk to lives and property from future quakes in the region. The USGS is currently<br />
working with the Missouri and Illinois geological surveys to study soil conditions in and<br />
around the <strong>East</strong>-<strong>West</strong> <strong>Gateway</strong> planning region. They are utilizing soil samples from<br />
borings taken from public construction projects such as highways, bridges and sewers.<br />
This study will last about five years.
A Regional Overview All-Hazard Mitigation Plan 45<br />
With respect to earth movements including landslides, sinkhole and mineshaft collapse,<br />
these incidents have occurred on a fairly frequent basis; over 27 reports were made to the<br />
Missouri Geological Survey over a period of 36 years.<br />
Intensity or Strength<br />
Recent research suggests that the New Madrid Fault Zone is capable of producing<br />
magnitude 8 earthquakes. Contemporary newspaper accounts of the 1811-1812<br />
Mississippi Valley earthquake sequence are used to construct a generalized isoseismal map<br />
of the first of three principal shocks of the sequence, that of December 16, 1811.<br />
Earthquakes can be measured by intensity or by magnitude. The Richter magnitude scale<br />
was developed in 1935 by Charles F. Richter of the California Institute of Technology as a<br />
mathematical device to compare the size of earthquakes. The magnitude of an earthquake<br />
is determined from the logarithm of the amplitude of waves recorded by seismographs.<br />
Adjustments are included for the variation in the distance between the various<br />
seismographs and the epicenter of the earthquakes. On the Richter Scale, magnitude is<br />
expressed in whole numbers and decimal fractions. For example, a magnitude 5.3 might be<br />
computed for a moderate earthquake, and a strong earthquake might be rated as<br />
magnitude 6.3. Because of the logarithmic basis of the scale, each whole number increase<br />
in magnitude represents a tenfold increase in measured amplitude; as an estimate of<br />
energy, each whole number step in the magnitude scale corresponds to the release of<br />
about 31 times more energy than the amount associated with the preceding whole<br />
number value. The Richter Scale is not used to express damage. An earthquake in a<br />
densely populated area which results in many deaths and considerable damage may have<br />
the same magnitude as a shock in a remote area that does nothing more than frighten the<br />
wildlife. Large-magnitude earthquakes that occur beneath the oceans may not even be felt<br />
by humans.<br />
The Mercalli Scale is based on observable earthquake damage. From a scientific<br />
standpoint, the Richter scale is based on seismic records while the Mercalli is based on<br />
observable data that can be subjective. Thus, the Richter scale is considered scientifically<br />
more objective and therefore more accurate. For example a level I-V on the Mercalli scale<br />
would represent a small amount of observable damage. At this level doors would rattle,<br />
dishes break and weak or poor plaster would crack. As the level rises toward the larger<br />
numbers, the amount of damage increases considerably. The higher number, 12,<br />
represents total damage. Refer to Figure J30.<br />
Intensity scales, like the Modified Mercalli Scale measure the amount of shaking at a<br />
particular location. So the intensity of an earthquake will vary depending on where you<br />
are. Sometimes earthquakes are referred to by the maximum intensity they produce.<br />
Magnitude scales, like the Richter magnitude, measure the size of the earthquake at its<br />
source. They do not depend on where the measurement was made. The intensity of earth<br />
movements including landslides, sinkhole and mineshaft collapse in the St. Louis
46<br />
<strong>Jefferson</strong> <strong>County</strong> – Section 2<br />
Metropolitan area are not as intense and widespread as the landslides in the western<br />
portion of the U.S. Earth movements in the St. Louis Metropolitan area are usually<br />
localized.<br />
Lives Lost, Injuries, Property Damage, Economic Losses/Other Losses<br />
Another earthquake as powerful as the great quakes of 1811-12 may not occur for many<br />
years. Because of differences in the geology east and west of the Rocky Mountains, the<br />
effects of a magnitude 7 quake in the mid-continent United States could be far worse than<br />
those of the 1989 magnitude 7 Loma Prieta, California, earthquake. That quake, which<br />
struck the San Francisco Bay region during the World Series, killed 63 people and caused<br />
$6 billion of property damage. Property damage could range from minor cracks in<br />
structures to complete destruction. Infrastructure including roads, bridges, water and gas<br />
lines may rupture, resulting in an abrupt halt to electricity, heat/cooling source,<br />
communication, transportation, rescue and emergency response services. Ruptured gas<br />
lines and power lines could potentially cause explosions and fires. Cascading emergencies<br />
such as these will compound the initial disaster. Lives lost, injuries, property damage and<br />
economic losses could potentially be in the same range as the earthquake that struck San<br />
Francisco.<br />
Landslides constitute a major geologic hazard because they are widespread, occurring in all<br />
50 states, and cause $1-2 billion in damages and more than 25 fatalities on average each<br />
year. Landslides pose serious threats to highways and structures that support fisheries,<br />
tourism, timber harvesting, mining, and energy production as well as general<br />
transportation. Landslides commonly occur with other major disasters such as earthquakes<br />
and floods that exacerbate relief and reconstruction efforts and expanded development<br />
and other land use has increased the incidence of landslide disasters.<br />
Locations/Areas Affected<br />
Refer to Figure J29 below that depicts the Peak Acceleration (%g) with a 10% probability of<br />
exceedance within 50 years within the EWG planning region. As can be seen, <strong>Jefferson</strong><br />
<strong>County</strong> lies in four peak acceleration zones running northeast to southwest ranging from a<br />
low of 7 in the northwestern corner to almost 15 %g of severity in the southeastern corner<br />
of the county.
A Regional Overview All-Hazard Mitigation Plan 47<br />
FIGURE J29 PEAK ACCELERATION<br />
Source: United States Geological Survey<br />
Franklin <strong>County</strong> lies in five peak acceleration zones running northeast to southwest ranging<br />
from a high of almost 9 in the southeastern corner to a low of 4%g of severity in the<br />
northwestern corner. St. Charles <strong>County</strong> lies within four peak acceleration zones running<br />
northeast to southwest ranging from a high of 8 in the easternmost portion of the county<br />
to a low of about 5%g severity in the northwestern corner of the county. St. Louis <strong>County</strong><br />
lies in four peak acceleration zones running northeast to southwest ranging from a high of<br />
15 in the southeastern portion to a low of about 7%g severity in the northern and western<br />
portions of the county. St. Louis city lies in two peak acceleration zones ranging between<br />
9 (almost entire portion of the city) and 15%g severity (in the very southern portion of the<br />
city).<br />
The locations of recorded landslides, sinkholes, and mineshaft collapse in the St. Louis<br />
Metropolitan region is summarized in Table J33 above.
48<br />
Seasonal Pattern<br />
FIGURE J30 MODIFIED MERCALLI SCALE<br />
<strong>Jefferson</strong> <strong>County</strong> – Section 2<br />
There is no data that supports the relationship between the occurrence of earthquakes and<br />
seasonal weather patterns.<br />
There is data that supports the relationship between the occurrence of landslides, sinkhole<br />
and mineshaft collapse and seasonal weather patterns. Rainfall events would introduce<br />
moisture into the earth and geologic strata, thus creating the potential for earth<br />
movement.<br />
Speed of Onset And/Or Existing Warning Systems<br />
Earthquake prediction is a future possibility. Just as the Weather Bureau now predicts<br />
hurricanes, tornadoes, and other severe storms, the National Earthquake Information<br />
Center (NEIC) may one day issue forecasts on earthquakes. Earthquake research was<br />
stepped up after the Alaska shock in 1964. Today, the U.S. Geological Survey (USGS) and
A Regional Overview All-Hazard Mitigation Plan 49<br />
other federal and state agencies, as well as universities and private institutions are<br />
conducting research. Earthquake prediction may some day become a reality, but only after<br />
much more is learned about earthquake mechanisms. The speed of onset is immediate.<br />
See Table J34 below.<br />
TABLE J34 FREQUENCY OF OCCURRENCES OF EARTHQUAKES<br />
DESCRIPTOR MAGNITUDE ANNUAL AVERAGE<br />
Great 8 and higher 1 ¹<br />
Major 7 - 7.9 17 ²<br />
Strong 6 - 6.9 134 ²<br />
Moderate 5 - 5.9 1319 ²<br />
Light (estimated) 4 - 4.9 13,000<br />
Minor (estimated) 3 - 3.9 130,000<br />
Very Minor (estimated) 2 - 2.9 1,300,000<br />
¹ Based on observations since 1900.<br />
² Based on observations since 1990.<br />
The USGS estimates that several million earthquakes occur in the world each year.<br />
Many go undetected because they hit remote areas or have very small magnitudes.<br />
The NEIC now locates about 50 earthquakes each day, or about 20,000 a year.<br />
Map of Hazards<br />
Figure J31 below shows earthquakes that have occurred in the proximity of the St. Louis<br />
Metropolitan area. Also please refer to Figure J26 (located in the back of the Technical<br />
Appendix) that depicts areas that are susceptible to earthquakes. Areas outside of the soil<br />
liquefaction zone will most likely be impacted from an earthquake, but probably to a lesser<br />
degree. The figure also shows regions in the St. Louis metropolitan area that would be<br />
predisposed to earth movements including landslides, sinkhole and mine shaft collapse.<br />
FIGURE J31 EARTHQUAKES IN MISSOURI<br />
Source: United States Geological Survey
50<br />
Statement of Probable Future Severity<br />
<strong>Jefferson</strong> <strong>County</strong> – Section 2<br />
The magnitudes of the historic earthquakes listed above in the New Madrid Fault Zone<br />
range from 2.4 to 8.2. These most recent earthquakes did not affect <strong>Jefferson</strong> <strong>County</strong>.<br />
The United States Geological Survey and the Center for Earthquake Research and<br />
Information at the University of Memphis (CERI) have issued a new forecast. The estimated<br />
probability of a magnitude 6.0 or greater earthquake is 25-40% through the year 2053.<br />
The January estimates show a 7-10% chance of magnitudes between 7.5 and 8.0 in a 50year<br />
period through 2053. The probability of an earthquake event is rated as moderate<br />
and the severity is rated as high.<br />
MODIFIED MERCALLI INTENSITY SCALE<br />
MMI VALUE FULL DESCRIPTION<br />
I People do not feel any earth movement<br />
II Felt by persons at rest, on upper floors of tall buildings<br />
III Felt by people indoors. Hanging objects swing back and forth.<br />
Vibration from the earthquake may seem like the passing of light<br />
trucks. May not be recognized as an earthquake.<br />
IV Hanging objects swing. Vibration may seem like he passing of heavy<br />
trucks or a jolt, like heavy ball striking the walls. Parked vehicles may<br />
rock noticeably. Windows, dishes, doors may rattle and glasses clink.<br />
In the upper range of IV, walls of wood frame buildings may creak.<br />
V Almost everyone feels movement whether inside or outdoors.<br />
Sleeping people are awakened. Liquids in containers are disturbed;<br />
some are spilled. Small unstable objects are displaced or overturned.<br />
Doors swing, close or open. Shutters, pictures on the wall move.<br />
VI Felt by all; some are frightened and take cover. People have difficulty<br />
walking due to motion. Objects fall from shelves and dishes,<br />
glassware and ceramics may be broken. Pictures fall off walls.<br />
Furniture moves or is overturned. Weak plaster and masonry cracked.<br />
Damage slight in poorly constructed buildings. Trees, bushes shaken<br />
visibly or are heard rustling.<br />
VII People have difficulty standing. Drivers on the road feel their cars<br />
shaking. Furniture may be overturned and broken. Loose bricks fall<br />
from buildings a masonry walls and cracks in plaster and masonry<br />
may appear. Weak chimneys may break at the roofline. Damage is<br />
slight to moderate in well-built structures; considerable in poorly<br />
constructed buildings and facilities.<br />
VIII Drivers have trouble steering. Tall structures such as towers,<br />
monuments may twist and fall. Wood frame houses that are not<br />
bolted to their foundations may shift and sustain serious damage.<br />
Damage is slight to moderate in well-constructed buildings,<br />
considerable in poorly constructed buildings. Branches are broken
A Regional Overview All-Hazard Mitigation Plan 51<br />
and fall from trees. Changes occur in flow or temperature of springs<br />
and wells. Cracks appear in wet ground and steep slopes.<br />
IX Masonry structures and poorly constructed buildings suffer serious<br />
damage or collapse. Frame structures, if not bolted, shift off<br />
foundations. Serious damage to reservoirs. Underground pipes<br />
broken. Conspicuous cracks in the ground. In alluvial areas, sand and<br />
mud ejected and sand craters are formed.<br />
X Some well built wooden structures destroyed; most masonry and<br />
frame structures destroyed with foundations.<br />
XI Few, if any masonry structures remaining standing. Bridges<br />
destroyed. Rails bent greatly. Serious damage to dams, dikes and<br />
embankments. Large landslides occur. Water thrown on the banks of<br />
canals, rivers and lakes<br />
XII Damage total. Line of sight and level are distorted. Objects thrown<br />
in air.<br />
According to the SEMA map above, <strong>Jefferson</strong> <strong>County</strong> is at a risk for a Level VII impact on<br />
the Modified Mercalli Intensity Scale from a 7.6 earthquake. Secondary effects of such an<br />
earthquake could include fire, building collapse, utility disruption, flooding, hazardous<br />
materials release, environmental impacts and economic disruptions and losses. Based on<br />
the projected Earthquake Intensities map and the Modified Mercalli damage scale, the<br />
future probably severity for each level is shown below.<br />
Modified Mercalli Levels I-V Negligible<br />
Modified Mercalli Levels VI Limited<br />
Modified Mercalli Levels VII Critical<br />
Modified Mercalli Levels VII-XIII Catastrophic<br />
Landslides have been categorized by the USGS based on incidence and susceptibility. After<br />
discussions with Missouri Geological Survey, there are have been no categories developed<br />
for landslide, sinkhole and underground mine collapse.<br />
Statement of Probable Risk/Likeliness of Future Occurrence<br />
<strong>Jefferson</strong> <strong>County</strong>, as well as other counties in the <strong>East</strong>-<strong>West</strong> <strong>Gateway</strong> <strong>Council</strong> of<br />
Governments planning region and the Midwest, is located in proximity to the New Madrid<br />
Fault Zone. The other fault zones mentioned above including the Wabash and faults in the<br />
vicinity of Farmington are also known to produce earthquakes in recent history, with a<br />
lesser magnitude and intensity. Instruments were installed in and around this area in 1974<br />
to closely monitor seismic activity. Since then, more than 4000 earthquakes have been<br />
located, most of which are too small to be felt. On average one earthquake per year will<br />
be large enough to be felt in the area.<br />
The magnitudes of the historic earthquakes listed above in the New Madrid Fault Zone<br />
range from 2.4 to 8.2. Based on the history of the New Madrid Fault Zone, the estimated
52<br />
<strong>Jefferson</strong> <strong>County</strong> – Section 2<br />
probability of a magnitude 6.0 or greater earthquake is 25-40% through the year 2053.<br />
The January estimates show a 7-10% chance of magnitudes between 7.5 and 8.0 in a 50year<br />
period through 2053.<br />
Probable Risk of Modified Mercalli Levels<br />
I-V Highly Likely<br />
VI Highly Likely<br />
VII Highly Likely<br />
VIII-XIII Likely<br />
Landslides have been categorized by the USGS based on incidence and susceptibility.<br />
These categories are found below. The probable risk of future occurrence in the St. Louis<br />
metropolitan area would be ranked as low, less than 1.5% of the area involved, with a<br />
moderate susceptibility and low incidence.<br />
Landslide Incidence<br />
Low- less than 1.5% of area involved<br />
Moderate- 1.5% to 15% of area involved<br />
High- Greater than 15% of area involved<br />
Landslide Susceptibility/Incidence<br />
Moderate susceptibility/low incidence<br />
High susceptibility/low incidence<br />
High susceptibility/moderate incidence<br />
In the USGS Map, Figure J25, susceptibility is not indicated with the same or lower<br />
incidence. Susceptibility to landsliding was defined as the probable degree of response or<br />
the rocks and soils to natural or artificial cutting or loading of slopes, or to anomalously<br />
high precipitation. High, moderate, and low susceptibility are delimited by the same<br />
percentages used in classifying the incidence of landsliding. Some generalization was<br />
necessary at the map scale and several small areas of high incidence and susceptibility were<br />
slightly exaggerated.<br />
Statement of Next Disaster’s Likely Adverse Impact on Community<br />
The next disaster’s likely adverse impact on <strong>Jefferson</strong> <strong>County</strong> could be critical in terms of<br />
amount of damage to infrastructure (utilities, communications) buildings, deaths and other<br />
cascading disasters including fire and explosions from natural gas and oil pipeline ruptures.<br />
At the time of the New Madrid earthquake in 1811-1812, St. Louis and other major cities<br />
in the central U.S. were sparsely settled and there were few man-made structures. Today,<br />
this region is home to millions of people, including the populations of large cities, such as
A Regional Overview All-Hazard Mitigation Plan 53<br />
St. Louis, Missouri, and Memphis, Tennessee. A repeat today of the earthquakes of 1811-<br />
12 would cause widespread loss of life and billions of dollars in property damage. The<br />
potential for the recurrence of such earthquakes and their impact today on densely<br />
populated cities in and around the seismic zone has generated much research devoted to<br />
understanding earthquakes. By closely monitoring the earthquake activity, scientists can<br />
hope to understand their causes, recurrence rates, ground motion and disaster mitigation.<br />
Earthquakes pose a serious threat to many Missouri communities. Local governments,<br />
planners, and engineers must consider the threat as they seek to balance development and<br />
risk. Identifying locations susceptible to seismic activity generated by nearby faults,<br />
adopting strong policies and implementing measures and using other mitigation<br />
techniques are essential to reducing risk from seismic hazards in the <strong>East</strong>-<strong>West</strong> <strong>Gateway</strong><br />
<strong>Coordinating</strong> <strong>Council</strong> planning region.<br />
Based on the January 2003 estimates, <strong>Jefferson</strong> <strong>County</strong> is at most risk for Modified Mercalli<br />
Level VII (7.6 level) as likely adverse impacts. However, due to the geologic setting in<br />
<strong>Jefferson</strong> <strong>County</strong> in terms of alluvial soils along the Missouri River, Level VIII should be used<br />
for planning purposes. The possible effects at Level VIII are shown below.<br />
Without Mitigation Measures<br />
Life Critical<br />
Property Critical<br />
Emotional Critical<br />
Financial Critical<br />
Comments <strong>Jefferson</strong> <strong>County</strong> is considered a high-risk area for damages from an<br />
earthquake as a result of the population density, condition of existing buildings and<br />
infrastructure and the geologic setting.<br />
With Mitigation Measures<br />
Life Limited<br />
Property Limited<br />
Emotional Critical<br />
Financial Limited<br />
Comments With mitigation measures in place, this will assist with current and future<br />
construction. Older masonry buildings will still be at risk.<br />
Landslide, Sinkhole and Underground Mine Collapse Mitigation Measures<br />
The next disaster’s likely adverse impact on <strong>Jefferson</strong> <strong>County</strong> could be limited to negligible<br />
in terms of amount of damage to infrastructure (utilities, communications) buildings,<br />
deaths and other cascading disasters including fire and explosions from natural gas and oil<br />
pipeline ruptures. These types of hazards occur on a much smaller scale than do<br />
earthquakes. The affected area may include one or two homes in a subdivision that have<br />
been constructed on a failing hillside, or on the side of a sinkhole or mine tunnel. Clearly,<br />
there are mitigation measures that can be taken to reduce or eliminate the risk of future
54<br />
<strong>Jefferson</strong> <strong>County</strong> – Section 2<br />
impact of the destruction of homes and structures located in areas that are predisposed to<br />
these types of hazards.<br />
Without Mitigation Measures<br />
Life Limited<br />
Property Limited<br />
Emotional Limited<br />
Financial Limited<br />
Comments none<br />
With Mitigation Measures<br />
Life Negligible<br />
Property Negligible<br />
Emotional Negligible<br />
Financial Negligible<br />
Comments none<br />
Recommendation<br />
Increased education, concern and subsequent action can reduce the potential effects of<br />
earthquakes can be done in conjunction with preparations for other hazards. A program<br />
that recognizes the risk of flooding, landslides and other dangers that incorporate<br />
earthquake issues will be of most benefit to citizens. Individuals and government have<br />
roles in reducing earthquake hazards. Individuals can reduce their own vulnerability by<br />
taking actions in their own households. Local government can take action to lower the<br />
threat through the proper use of poor sites, assuring that vital or important structures<br />
(police, fire, school buildings) resist hazards and developing infrastructures in a way that<br />
decreases risk. State agencies and legislature can assist the other levels of action and<br />
provide incentives for minimizing hazards.<br />
Communities and developers coordinate with NRCS, Division of Geology and Resource<br />
Assessment regarding appropriate sitings of subdivisions and other structures.<br />
Tornado/Severe Thunderstorm Hazard Profile<br />
Background<br />
When severe storms hit a community, they leave behind a distinctive trail. Toppled trees,<br />
damaged buildings and cars, downed power lines crossing roadways and widespread<br />
power outages are signs that a storm has struck. After such events, it can take<br />
communities weeks to return to normal. These storms result in costly structural damages,<br />
personal injury, property damage and death. Tornado intensity is determined by using the
A Regional Overview All-Hazard Mitigation Plan 55<br />
F-Scale (Fujita 1981), as listed in Storm Data. This study follows the accepted nomenclature<br />
that F2 and F3 tornadoes are strong and F4 are violent.<br />
Ostby (1993) found that the occurrence of weak tornadoes (F0-F1) has shown a dramatic<br />
increase since 1980, while the number of strong and violent tornadoes have either<br />
remained steady or decreased. Reasons for this include improved verification efforts by<br />
local NWS offices and the marked increase in storm chasing. Since strong and<br />
violent tornadoes produce a more stable long-term data set, these categories were the<br />
main focus of this study.<br />
Description of Hazard<br />
A tornado is a vortex of rapidly rotating air that must be in contact with the ground. This<br />
means that to be a tornado, the swirling winds must be at the surface, capable of doing<br />
damage. If there is debris (dust and other objects swirling in the winds), it is definitely a<br />
tornado, even if there is no visible funnel cloud. If there is no debris with a funnel cloud,<br />
then it might be a tornado but one cannot be certain that it is (or is not). A tornado can<br />
move over a surface with few objects to be picked up and swirled about, or one may not<br />
be able to see all the way to the surface beneath a funnel cloud because of intervening<br />
hills, trees, or buildings. All funnel clouds should be treated as if they are tornadoes, unless<br />
one can be certain that they will not touch down. See Figure J32 below.<br />
FIGURE J32 VIEW OF TORNADIC THUNDERSTORM<br />
Source: NOAA<br />
When storms influence a large area, the chances for significant hazards increase. The<br />
majority of windstorms in a convective system are of marginal severity, with only isolated<br />
events reaching high intensity. The most threatening situation would be for a very intense<br />
convective wind event that also affected a large area. It appears that a few times each year<br />
in North America, extreme convective wind events of this sort do occur. To date, no such<br />
storm has struck a major city during a vulnerable time (e.g., the morning or evening rush<br />
hours). However, it is only a matter of time until this sort of unfortunate concatenation<br />
actually occurs. Given that the area affected can approach that of a tropical cyclone's<br />
damage swath, and certainly far exceeds that affected during a tornado outbreak (while
56<br />
<strong>Jefferson</strong> <strong>County</strong> – Section 2<br />
not being as intense, of course), it is uncomfortable to imagine the potential devastation.<br />
When such storms are accompanied by large hail (e.g., > 5 cm in diameter), the damage<br />
potential soars to even greater heights than when the wind occurs alone. The occurrence<br />
of hail has resulted in some of the costliest storms in United States history; coupling a fall<br />
of large hail with winds approaching 50 m s -1 could produce incredible damage in a<br />
populated area. Of course, economic losses to agriculture from such storms are already<br />
high, but do not attract much public attention, and such losses would be very difficult to<br />
mitigate with a 20-30 min warning. Nevertheless, major property losses can result when<br />
such storms cover a large area.<br />
A timely forecast may not be able to do much to mitigate the property loss, but could<br />
reduce the casualties. It appears possible to forecast these extreme events with some skill,<br />
but further research needs to be done to test the existing hypothesis about the interaction<br />
between the convective storm and its environment that produces the extensive swath of<br />
high winds.<br />
Convective wind events are a hazard to societies the world over, doing considerable<br />
damage and occasionally generating many casualties. Most convection produces some<br />
straight-line wind as a result of outflow generated by the convective downdraft, and so<br />
anyone living in convection-prone areas of the world has experienced this phenomenon.<br />
On rare occasions, the intensity of the wind achieves the potential for doing damage.<br />
Whether or not damage actually occurs is the dependent on having structures in the path<br />
of the wind that can sustain damage. Although engineered structures typically are quite<br />
resistant to wind damage, many homes and outbuildings are quite vulnerable to damage<br />
from even relatively modest windstorms. In the United States, it is assumed that the<br />
potential for wind damage begins at around 56 miles per hour. Of course, considerable<br />
damage occurs in situations where there was no anemometer, and so wind damage is<br />
graded according to its character: e.g., damage to tree limbs is considered non-severe, but<br />
uprooted trees are considered to represent a severe event. Refer to Figures J33, J34, and<br />
J35 below.<br />
Various human activities place people at risk from convective winds, notably aircraft<br />
operations and recreation. Most casualties from convective windstorms in the United<br />
States arise from such situations. Given the high vulnerability of aircraft operations during<br />
takeoff and landing procedures (the aircraft are operating on the margins of their flight<br />
"envelope" during such times); it does not take a particularly intense event from a<br />
meteorological standpoint to create many casualties. Commercial aircraft are less<br />
vulnerable than private aircraft, but their high occupancy means that rare events can have<br />
a large impact on casualty figures. Recreational boating also can account for many<br />
casualties in relatively modest windstorms, whereas most commercial craft are unlikely to<br />
be affected by marginal convective wind events.
A Regional Overview All-Hazard Mitigation Plan 57<br />
Characteristics<br />
SEVERE THUNDERSTORMS<br />
FIGURE J33 FIGURE J34<br />
Source: NOAA Source: NOAA<br />
Hail Flooding<br />
FIGURE J35<br />
Source: NOAA<br />
Lightening<br />
Severe windstorms range in type from downdrafts to tornadoes. The most frequent<br />
surface winds in Missouri originate from the west and southwest. These winds are<br />
associated with storms moving into the region from Kansas and Oklahoma. Tornadoes<br />
range in size and severity. The dimensions of the storm can be measured by the size of the<br />
damage path. It is important to note that the "average" can be misleading, since most<br />
tornadoes are small. The typical tornado damage path is about one or two miles, with a<br />
width of about 50 yards. The largest tornado path widths can exceed one mile, and the<br />
smallest widths can be less than 10 yards. Widths can vary considerably during a single<br />
tornado, because the size of the tornado can change considerably during its lifetime. Path<br />
lengths can vary from what is basically a single point to more than 100 miles. Note that<br />
tornado intensity (the peak wind speeds) is not necessarily related to the tornado size.<br />
Detailed statistics about the time a tornado is on the ground are not available. This time<br />
can range from an instant to several hours. Typically, ground time is roughly five minutes<br />
or so. Detailed statistics about forward speed of tornadoes are not available. Movement<br />
can range from virtually stationary to more than 60 miles per hour, typical storms move at<br />
roughly 10-20 miles per hour.
58<br />
Likely Locations<br />
<strong>Jefferson</strong> <strong>County</strong> – Section 2<br />
Whenever and wherever conditions are right, tornadoes are possible, but they are most<br />
common in the central plains of North America, east of the Rocky Mountains and west of<br />
the Appalachian Mountains. Refer to Figure J36 for a map of the U.S. that identifies the<br />
wind speeds in various regions; the study area has a high likelihood of severe winds. The<br />
map depicts those areas within the planning region that have experienced tornadoes.<br />
Statistically, <strong>Jefferson</strong> <strong>County</strong> has had 23 tornadoes. St. Charles <strong>County</strong> with 35 tornadoes<br />
has had the most tornado outbreaks, with St. Louis <strong>County</strong> second with 28. St. Louis City<br />
has the least with nine. However, these statistics do not necessarily predict future likely<br />
locations of tornadoes since St. Louis and St. Charles Counties cover larger areas of land.<br />
Type of Damage<br />
FIGURE J36 WIND ZONES<br />
Source: FEMA<br />
The damage from tornadoes comes from the strong winds they contain. It is generally<br />
believed that tornadic wind speeds can be as high as 300 mph in the most violent<br />
tornadoes. Wind speeds that high can cause automobiles to become airborne, rip ordinary<br />
homes to shreds, and turn broken glass and other debris into lethal missiles. The biggest<br />
threat to living creatures (including humans) from tornadoes is from flying debris and from<br />
being tossed about in the wind. It was once thought that the low pressure in a tornado<br />
contributed to the damage by making buildings "explode" but this is no longer believed to<br />
be true. Tornadoes are classified according to the F-Scale developed by Theodore Fujita.<br />
The F-scale ranks tornadoes according to wind speed, and the severity of damage caused<br />
within the wind speed ranges. Table J35 below shows the Fujita Tornado Measurement<br />
Scale.<br />
TABLE J35 FUJITA TORNADO MEASUSREMENT SCALE<br />
Category F0 Gale Tornado (40-70 mph) Light damage. Some damage to chimneys;<br />
break branches off trees; push over shallow<br />
Category F1 Moderate tornado (73-112<br />
mph)<br />
rooted trees; damage to sign boards<br />
Moderate damage. The lower limit is the<br />
beginning of hurricane wind speed; peel<br />
surface off roofs; mobile homes pushed off<br />
foundations or overturned; moving autos
A Regional Overview All-Hazard Mitigation Plan 59<br />
TABLE J35 FUJITA TORNADO MEASUSREMENT SCALE<br />
foundations or overturned; moving autos<br />
Category F2 Significant tornado (113-157<br />
mph)<br />
pushed off roads<br />
Considerable damage. Roofs torn off frame<br />
houses; mobile homes demolished; boxcars<br />
pushed over; large trees snapped or<br />
uprooted; light-object missiles generated.<br />
Category F3 Severe tornado (158-206 mph) Severe damage. Roofs and some walls torn<br />
off well-constructed houses; trains<br />
overturned; most trees in forest uprooted;<br />
Category F4 Devastating tornado (207-260<br />
mph)<br />
Category F5 Incredible tornado (261-318<br />
mph)<br />
cars lifted off ground and thrown.<br />
Devastating damage. Well- constructed<br />
houses leveled; structure with weak<br />
foundation blown off some distance; cars<br />
thrown and large missiles generated.<br />
Incredible damage. Strong frame houses<br />
lifted off foundations and carried<br />
considerable distance to disintegrate;<br />
automobile-sized missiles fly through the air<br />
in excess of 100 yards; trees debarked;<br />
incredible phenomena will occur.<br />
Figures J37 through J41 below depict the Fujita Scale as described in Table J35 above.<br />
FIGURE J37 FIGURE J38<br />
F1 F2<br />
FIGURE J39 FIGURE J40<br />
F3 F4
60<br />
Hazard Event History<br />
FIGURE J41<br />
F5<br />
<strong>Jefferson</strong> <strong>County</strong> – Section 2<br />
The tornado categorized as an F-4 that hit St. Louis on May 27, 1896 was third on the list<br />
of 10 top weather events of the century. This storm killed 255 people and injured 1,000.<br />
The estimated damage from these storms totals $1.365 million dollars. Missouri is<br />
considered to be in the top ten lists for total number of tornadoes and number of killer<br />
tornadoes (ranking number seven).<br />
Since 1950,according to the NCDC, <strong>Jefferson</strong> <strong>County</strong> has had 23 tornadoes, three of which<br />
have resulted in 48 injuries and five deaths. The estimated damage from these storms cost<br />
approximately $9.7 million dollars. The most recent tornado in May 2003 in <strong>Jefferson</strong><br />
<strong>County</strong> resulted in one death and approximately $1million dollars in damage. The<br />
tornadoes occurred between April and December. <strong>Jefferson</strong> <strong>County</strong> has had one F3<br />
tornado in 1981. Tornado occurrences are found in Table J36.<br />
TABLE J36 JEFFERSON COUNTY TORNADO OCCURRENCES<br />
1961 TO 2003<br />
Location or <strong>County</strong> Date Time Type Mag 1 Dth 2 Inj 3 PrD 4 CrD 5<br />
1 <strong>Jefferson</strong> 05/06/1961 1615 Tornado F1 0 0 25K 0<br />
2 <strong>Jefferson</strong> 05/07/1961 1615 Tornado F1 0 0 3K 0<br />
3 <strong>Jefferson</strong> 09/04/1965 1930 Tornado F1 0 0 3K 0<br />
4 <strong>Jefferson</strong> 05/28/1967 1650 Tornado F2 0 0 25K 0<br />
5 <strong>Jefferson</strong> 06/10/1967 1700 Tornado F2 0 0 25K 0<br />
6 <strong>Jefferson</strong> 10/24/1967 1055 Tornado F1 0 0 25K 0<br />
7 <strong>Jefferson</strong> 04/03/1968 1800 Tornado F1 0 0 25K 0<br />
8 <strong>Jefferson</strong> 05/15/1968 1940 Tornado F1 0 0 25K 0<br />
9 <strong>Jefferson</strong> 06/04/1973 2100 Tornado F1 0 0 0K 0<br />
10 <strong>Jefferson</strong> 07/27/1976 1330 Tornado F1 0 0 0K 0<br />
11 <strong>Jefferson</strong> 05/12/1978 1700 Tornado F 0 0 250K 0<br />
12 <strong>Jefferson</strong> 04/22/1981 1754 Tornado F3 1 0 2.5M 0<br />
13 <strong>Jefferson</strong> 07/20/1981 1448 Tornado F1 0 0 3K 0<br />
14 <strong>Jefferson</strong> 12/02/1982 2030 Tornado F1 0 0 250K 0<br />
15 <strong>Jefferson</strong> 11/09/1984 1710 Tornado F0 0 0 0K 0<br />
16 Cedar Hill To 04/15/1994 0352 Tornado F0 0 0 500K 5K
A Regional Overview All-Hazard Mitigation Plan 61<br />
TABLE J36 JEFFERSON COUNTY TORNADO OCCURRENCES<br />
1961 TO 2003<br />
Location or <strong>County</strong> Date Time Type Mag 1 Dth 2 Inj 3 PrD 4 CrD 5<br />
17 Ottoville To 04/15/1994 0405 Tornado F0 0 0 50K 1K<br />
18 Barnhart To 04/15/1994 0412 Tornado F1 0 0 5.0M 5K<br />
19 Crystal City 04/26/1994 2035 Tornado F0 0 0 5K 0<br />
20 De Soto 04/16/1995 1549 Funnel<br />
Cloud<br />
N/A 0 0 0 0<br />
21 De Soto 04/16/1995 1557 Tornado F0 0 0 0K 0<br />
22 Ware 05/06/2003 06:25<br />
PM<br />
Tornado F0 0 0 0 0<br />
23 De Soto 05/06/2003 06:30<br />
PM<br />
Tornado F0 0 0 0 0<br />
TOTALS:<br />
1Magnitude 1 0 8.713M 11K<br />
2 Death<br />
3 Injuries<br />
4 Property Damage<br />
5 Crop Damage<br />
Source: NCDC<br />
Additional data on significant <strong>Jefferson</strong> <strong>County</strong> thunderstorms (downbursts, lightening,<br />
hail, heavy rains and wind) indicated a total impact of $877,000 in property damages from<br />
113 storm events between 1950 and 2002. Severe thunderstorms and high winds are<br />
summarized on Table J37 below.<br />
Location or<br />
<strong>County</strong><br />
TABLE J37 JEFFERSON COUNTY WINDSTORM OCCURRENCES<br />
1960 TO 2003<br />
Date Time Type Mag 1 Dth 2 Inj 3 PrD 4 CrD 5<br />
1 <strong>Jefferson</strong> 05/16/1960 1500 Tstm Wind 0 0 0 0 0<br />
2 <strong>Jefferson</strong> 06/24/1962 1230 Tstm Wind 0 0 0 0 0<br />
3 <strong>Jefferson</strong> 07/01/1966 1430 Tstm Wind 50 0 0 0 0<br />
4 <strong>Jefferson</strong> 06/10/1967 1612 Tstm Wind 70 0 0 0 0<br />
5 <strong>Jefferson</strong> 08/09/1970 0110 Tstm Wind 0 0 0 0 0<br />
6 <strong>Jefferson</strong> 05/26/1973 2035 Tstm Wind 0 0 0 0 0<br />
7 <strong>Jefferson</strong> 07/09/1973 1530 Tstm Wind 0 0 0 0 0<br />
8 <strong>Jefferson</strong> 08/12/1973 1530 Tstm Wind 0 0 0 0 0<br />
9 <strong>Jefferson</strong> 12/04/1973 0330 Tstm Wind 0 0 0 0 0<br />
10 <strong>Jefferson</strong> 04/03/1974 1241 Tstm Wind 0. 0 0 0 0<br />
11 <strong>Jefferson</strong> 06/09/1974 0155 Tstm Wind 0 0 0 0 0<br />
12 <strong>Jefferson</strong> 06/09/1974 0200 Tstm Wind 0 0 0 0 0<br />
13 <strong>Jefferson</strong> 06/09/1974 0210 Tstm Wind 0 0 0 0 0<br />
14 <strong>Jefferson</strong> 06/09/1974 0210 Tstm Wind 0 0 0 0 0<br />
15 <strong>Jefferson</strong> 03/07/1975 0015 Tstm Wind 0 0 0 0 0<br />
16 <strong>Jefferson</strong> 03/07/1975 0030 Tstm Wind 0 0 0 0 0<br />
17 <strong>Jefferson</strong> 07/31/1976 0332 Tstm Wind 0 0 0 0 0<br />
18 <strong>Jefferson</strong> 06/21/1977 2222 Tstm Wind 0 0 0 0 0<br />
19 <strong>Jefferson</strong> 04/07/1980 2225 Tstm Wind 0 0 0 0 0<br />
20 <strong>Jefferson</strong> 07/02/1980 1420 Tstm Wind 0 0 0 0 0
62<br />
Location or<br />
<strong>County</strong><br />
<strong>Jefferson</strong> <strong>County</strong> – Section 2<br />
TABLE J37 JEFFERSON COUNTY WINDSTORM OCCURRENCES<br />
1960 TO 2003<br />
Date Time Type Mag 1 Dth 2 Inj 3 PrD 4 CrD 5<br />
21 <strong>Jefferson</strong> 07/03/1980 0245 Tstm Wind 69 0 0 0 0<br />
22 <strong>Jefferson</strong> 10/17/1980 0330 Tstm Wind 0 0 0 0 0<br />
23 <strong>Jefferson</strong> 04/03/1981 2255 Tstm Wind 0 0 0 0 0<br />
24 <strong>Jefferson</strong> 04/03/1981 2300 Tstm Wind 0 0 0 0 0<br />
25 <strong>Jefferson</strong> 06/02/1981 1345 Tstm Wind 61 0 0 0 0<br />
26 <strong>Jefferson</strong> 04/16/1982 1930 Tstm Wind 0 0 0 0 0<br />
27 <strong>Jefferson</strong> 04/16/1982 1930 Tstm Wind 50 0 0 0 0<br />
28 <strong>Jefferson</strong> 04/16/1982 1940 Tstm Wind 0 0 0 0 0<br />
29 <strong>Jefferson</strong> 06/08/1982 0837 Tstm Wind 0 0 0 0 0<br />
30 <strong>Jefferson</strong> 06/15/1982 1341 Tstm Wind 0 0 0 0 0<br />
31 <strong>Jefferson</strong> 12/02/1982 2055 Tstm Wind 0 0 0 0 0<br />
32 <strong>Jefferson</strong> 06/27/1983 1705 Tstm Wind 0 0 0 0 0<br />
33 <strong>Jefferson</strong> 07/24/1983 1758 Tstm Wind 0 0 0 0 0<br />
34 <strong>Jefferson</strong> 08/22/1983 1518 Tstm Wind 0 0 0 0 0<br />
35 <strong>Jefferson</strong> 10/04/1983 1510 Tstm Wind 0 0 0 0 0<br />
36 <strong>Jefferson</strong> 03/15/1984 1903 Tstm Wind 0 0 0 0 0<br />
37 <strong>Jefferson</strong> 05/25/1984 1830 Tstm Wind 0 0 0 0 0<br />
38 <strong>Jefferson</strong> 09/08/1984 1730 Tstm Wind 0 0 0 0 0<br />
39 <strong>Jefferson</strong> 07/31/1985 2250 Tstm Wind 52 0 0 0 0<br />
40 <strong>Jefferson</strong> 08/06/1985 1350 Tstm Wind 52 0 0 0 0<br />
41 <strong>Jefferson</strong> 05/21/1987 1752 Tstm Wind 0 0 0 0 0<br />
42 <strong>Jefferson</strong> 07/05/1987 1230 Tstm Wind 0 0 0 0 0<br />
43 <strong>Jefferson</strong> 07/05/1987 1235 Tstm Wind 52 0 0 0 0<br />
44 <strong>Jefferson</strong> 04/05/1988 1845 Tstm Wind 61 0 0 0 0<br />
45 <strong>Jefferson</strong> 05/08/1988 1700 Tstm Wind 52 0 0 0 0<br />
46 <strong>Jefferson</strong> 06/08/1988 1700 Tstm Wind 0 0 0 0 0<br />
47 <strong>Jefferson</strong> 11/15/1988 2105 Tstm Wind 52 0 0 0 0<br />
48 <strong>Jefferson</strong> 03/11/1990 2230 Tstm Wind 61 0 0 0 0<br />
49 <strong>Jefferson</strong> 06/13/1991 1500 Tstm Wind 0 0 0 0 0<br />
50 <strong>Jefferson</strong> 06/15/1991 1930 Tstm Wind 0 0 0 0 0<br />
51 <strong>Jefferson</strong> 08/03/1991 1530 Tstm Wind 0 0 0 0 0<br />
52 <strong>Jefferson</strong> 08/03/1991 1740 Tstm Wind 0 0 0 0 0<br />
53 <strong>Jefferson</strong> 08/08/1991 1612 Tstm Wind 0 0 0 0 0<br />
54 <strong>Jefferson</strong> 11/29/1991 2150 Tstm Wind 0 0 0 0 0<br />
55 <strong>Jefferson</strong> 06/24/1992 1745 Tstm Wind 0 0 0 0 0<br />
56 <strong>Jefferson</strong> 07/10/1992 1915 Tstm Wind 0 0 0 0 0<br />
57 <strong>Jefferson</strong> 09/07/1992 2218 Tstm Wind 52 0 0 0 0<br />
58 De Soto 04/25/1993 0015 Thunderstorm<br />
Winds<br />
N/A 0 0 0 0<br />
59 De Soto 04/25/1993 0015 Thunderstorm<br />
Winds<br />
N/A 0 0 50K 0<br />
60 High Ridge 08/23/1993 1730 Thunderstorm<br />
Winds<br />
N/A 0 0 5K 0<br />
61 Cedar Hill 04/26/1994 2325 Thunderstorm N/A 0 0 5K 0<br />
Winds<br />
62 Regional 04/18/1995 0830 High Winds 0 0 0 700K 0<br />
63 Victoria 05/18/1995 1110 Thunderstorm N/A 0 0 0 0
A Regional Overview All-Hazard Mitigation Plan 63<br />
Location or<br />
<strong>County</strong><br />
TABLE J37 JEFFERSON COUNTY WINDSTORM OCCURRENCES<br />
1960 TO 2003<br />
Date Time Type Mag 1 Dth 2 Inj 3 PrD 4 CrD 5<br />
64 Otto 07/04/1995 1412<br />
Winds<br />
Thunderstorm<br />
Winds<br />
N/A 0 0 0K 0<br />
65 St. Louis 07/04/1995 1500 Thunderstorm N/A 0 0 1K 0<br />
City<br />
Winds<br />
66 Hillsboro 04/19/1996 04:30 PM Tstm Wind 55 0 0 0 0<br />
67 Regional 04/28/1996 08:00 AM High Wind 61 0 0 0 0<br />
68 Arnold 07/19/1996 07:00 PM Tstm Wind 55 0 0 0 0<br />
69 Pevely 07/19/1996 07:20 PM Tstm Wind 55 0 0 0 0<br />
70 Regional 04/05/1997 03:00 PM High Wind 50 0 0 0 0<br />
71 Regional 04/30/1997 01:00 PM High Wind 45 0 0 0 0<br />
72 Byrnes Mill 05/25/1997 07:45 PM Tstm Wind 50 0 0 0 0<br />
73 De Soto 05/25/1997 08:00 PM Tstm Wind 50 0 0 0 0<br />
74 De Soto 06/21/1997 06:20 PM Tstm Wind 61 0 0 100K 0<br />
75 Hillsboro 03/27/1998 05:25 PM Tstm Wind 50 0 0 0 0<br />
76 Arnold 07/22/1998 06:30 PM Tstm Wind 61 0 0 5K 0<br />
77 Hillsboro 11/10/1998 04:00 AM Tstm Wind 56 0 0 0 0<br />
78 Dittmer 06/08/1999 02:40 PM Tstm Wind 55 0 0 0 0<br />
79 Arnold 07/09/1999 06:10 PM Tstm Wind 52 0 0 0 0<br />
80 High Ridge 06/24/2000 01:20 PM Tstm Wind 52 0 0 0 0<br />
81 Cedar Hill 09/11/2000 10:48 PM Tstm Wind 56 0 0 0 0<br />
82 House Spgs 09/11/2000 10:58 PM Tstm Wind 56 0 0 0 0<br />
83 Hillsboro 09/11/2000 11:10 PM Tstm Wind 56 0 0 0 0<br />
84 Imperial 09/11/2000 11:10 PM Tstm Wind 56 0 0 0 0<br />
85 Regional 02/25/2001 12:00 AM High Wind 40 0 0 0 0<br />
86 Regional 03/13/2001 09:00 AM High Wind 45 kts. 0 0 0 0<br />
87 Cedar Hill 07/18/2001 01:05 PM Tstm Wind 55 kts. 0 0 0 0<br />
88 Hillsboro 07/18/2001 01:15 PM Tstm Wind 55 kts. 0 0 0 0<br />
89 Imperial 09/08/2001 09:15 PM Tstm Wind 55 kts. 0 0 0 0<br />
90 Arnold 09/08/2001 09:29 PM Tstm Wind 55 kts. 0 0 0 0<br />
91 Regional 03/09/2002 06:00 AM High Wind 43 kts. 0 0 0 0<br />
92 Hillsboro 05/07/2002 02:55 AM Tstm Wind 55 kts. 0 0 0 0<br />
93 Festus 05/07/2002 03:00 AM Tstm Wind 55 kts. 0 0 0 0<br />
94 Hillsboro 05/07/2002 03:00 AM Tstm Wind 55 kts. 0 0 0 0<br />
95 De Soto 07/03/2002 02:35 PM Tstm Wind 55 kts. 0 0 10K 0<br />
96 High Ridge 07/10/2002 01:47 PM Tstm Wind 55 kts. 0 0 0 0<br />
97 Cedar Hill 07/10/2002 01:50 PM Tstm Wind 55 kts. 0 0 0 0<br />
98 Hillsboro 07/10/2002 02:00 PM Tstm Wind 55 kts. 0 0 0 0<br />
99 Festus 07/10/2002 02:10 PM Tstm Wind 55 kts. 0 0 0 0<br />
100 Cedar Hill 07/22/2002 06:45 PM Tstm Wind 55 kts. 0 0 0 0<br />
101 High<br />
Ridge<br />
07/22/2002 06:49 PM Tstm Wind 55 kts. 0 0 0 0<br />
102 Otto 07/22/2002 06:55 PM Tstm Wind 55 kts. 0 0 0 0<br />
103 De Soto 05/06/2003 06:30 PM Tstm Wind 75 kts. 0 0 0 0<br />
104 De Soto 05/06/2003 06:47 PM Tstm Wind 87 kts. 0 0 0 0<br />
105 Crystal<br />
City<br />
05/06/2003 07:05 PM Tstm Wind 60 kts. 0 0 0 0
64<br />
Location or<br />
<strong>County</strong><br />
<strong>Jefferson</strong> <strong>County</strong> – Section 2<br />
TABLE J37 JEFFERSON COUNTY WINDSTORM OCCURRENCES<br />
1960 TO 2003<br />
Date Time Type Mag 1 Dth 2 Inj 3 PrD 4 CrD 5<br />
106<br />
Herculaneum<br />
05/06/2003 07:05 PM Tstm Wind 60 kts. 0 0 0 0<br />
107 Pevely 05/06/2003 07:05 PM Tstm Wind 60 kts. 0 0 0 0<br />
108 Imperial 06/10/2003 04:50 PM Tstm Wind 60 kts. 0 0 0 0<br />
109 Arnold 06/10/2003 05:00 PM Tstm Wind 55 kts. 0 0 0 0<br />
110 Barnhart 06/10/2003 05:00 PM Tstm Wind 60 kts. 0 0 0 0<br />
111 Arnold 07/18/2003 09:10 AM Tstm Wind 55 kts. 0 0 0 0<br />
112 High<br />
Ridge<br />
07/18/2003 09:10 AM Tstm Wind 55 kts. 0 0 0 0<br />
113 House<br />
Spgs<br />
07/18/2003 09:10 AM Tstm Wind 55 kts. 0 0 0 0<br />
TOTALS: 0 0 877K 0<br />
1Magnitude- measured in knots<br />
2 Death<br />
3 Injuries<br />
4 Property Damage<br />
5 Crop Damage<br />
Source: NCDC<br />
Frequency of Occurrence<br />
The frequency of severe windstorms and tornadoes is difficult to predict. See Figure J42<br />
below. They usually occur mostly during the spring and summer; the tornado season<br />
comes early in the south and later in the north because spring comes later in the year as<br />
one moves northward. Storms usually occur during the late afternoon and early evening,<br />
but they have been known to occur in every state in the United States, on any day of the<br />
year, and at any hour. Table J38 below depicts tornado occurrences are most commonly<br />
seen in the spring months. In the southern states, tornado frequency peaks in March<br />
through May; while in the northern states, peak frequency is during the summer months.<br />
Along the gulf coast, a secondary tornado maximum occurs during the fall. In the western<br />
states, the total number of tornadoes is higher than indicated. Sparse population reduces<br />
the number reported. The map illustrates months of peak tornado activity by state (1950-<br />
1991). (NOAA/NWS)
A Regional Overview All-Hazard Mitigation Plan 65<br />
January<br />
FIGURE J42 TORNADO OCCURRENCES<br />
Source: NOAA<br />
TABLE J38 OCCURRENCES OF TORNADOES IN JEFFERSON COUNTY<br />
FROM 1950 TO 1998<br />
February<br />
Intensity or Strength<br />
March<br />
April<br />
May<br />
June<br />
0 0 0 8 7 2 2 0 1 1 1 1<br />
Storms in <strong>Jefferson</strong> <strong>County</strong> range from F0 to F4. There have been no recorded F5 storms.<br />
Refer to Table J39 and Figure J43 below.<br />
TABLE J39 STORM INTENSITIES FOR JEFFERSON COUNTY<br />
JURISDICTIONS F0 F1 F2 F3 F4 Total<br />
St. Louis City 0 2 3 2 2 9<br />
St. Louis <strong>County</strong> 2 8 11 5 2 28<br />
St. Charles <strong>County</strong> 6 10 11 7 1 35<br />
<strong>Jefferson</strong> <strong>County</strong> 5 11 4 2 1 23<br />
Franklin <strong>County</strong> 6 6 8 0 0 20<br />
Total 19 37 37 16 6 115<br />
Lives Lost, Injuries, Property Damage, Economic Losses/Other Losses<br />
Even though only about 10% of tornadoes are significant, these tornadoes are responsible<br />
for the majority of deaths caused by tornadoes in the country, with violent tornadoes<br />
claiming 67% of the total casualties. Furthermore, the US suffers millions of dollars in<br />
damage costs in the aftermath of such events- an important consideration for the<br />
insurance industry.<br />
July<br />
August<br />
September<br />
October<br />
November<br />
December
66<br />
<strong>Jefferson</strong> <strong>County</strong> – Section 2<br />
<strong>Jefferson</strong> <strong>County</strong> has had 23 tornadoes, three of which have resulted in 48 injuries and<br />
five deaths. The estimated damage from these storms cost approximately $9.7 million<br />
dollars. The most recent tornado in May 2003 located in Desoto, <strong>Jefferson</strong> <strong>County</strong> resulted<br />
in one death and approximately $1million dollars in damage. Missouri is considered to be<br />
in the top ten lists for total number of tornadoes and number of killer tornadoes (ranking<br />
number seven).<br />
Locations/Areas Affected<br />
FIGURE J43 TORNADOES<br />
Source: NOAA; U.S. data<br />
Based on available data, there is no predictable pathway for tornadoes and windstorms to<br />
follow. In general, however, these storms run in a southwest to northeast direction.<br />
Figure J44 below depicts the distribution of storms across the planning region. Based upon<br />
Table J39 above, one can see that each jurisdiction has had multiple tornadoes. <strong>Jefferson</strong><br />
<strong>County</strong> has had the third largest number of storms in the EWG planning region.<br />
FIGURE J44 TORNADO STORM DAMAGE HISTORY FROM 1950 TO 2001<br />
Source: NOAA
A Regional Overview All-Hazard Mitigation Plan 67<br />
Seasonal Pattern<br />
Tornadoes occur mostly during the spring and summer; the tornado season comes early in<br />
the south and later in the north because spring comes later in the year as one moves<br />
northward. Tornadoes and storms usually occur during the late afternoon and early<br />
evening, but they have been known to occur in every state in the United States, on any day<br />
of the year, and at any hour.<br />
Based on Table J38, in <strong>Jefferson</strong> <strong>County</strong>, most of the storms occurred in the month of April<br />
with 8 tornadoes. May had a total of 7 tornadoes, both June and July had 2, and<br />
September, October, November and December had 1 each per month.<br />
Speed of Onset And/Or Existing Warning Systems<br />
Tornadoes and other severe windstorms can occur instantly. The National Oceanic and<br />
Atmospheric Agency and other agencies (National Weather Service) have prioritized the<br />
research and understanding of the development of these types of storms in order to<br />
protect citizens and their property. As a result of this research, Doppler Radar was<br />
developed. Doppler Radar research was started in the 1950s by the Weather Radar<br />
Laboratory. At about the same time, research was beginning on severe storms through the<br />
National Severe Storms Project. In late 1963 the NSSL was formed to continue and<br />
enhance these two efforts. By the 1970's it was clear that Doppler Radar would greatly<br />
benefit the National Weather Service and could help to provide much-improved severe<br />
thunderstorm and tornado warnings.<br />
The new Radar, or NEXRAD for Next Generation Radar (officially WSR-88D), provides<br />
forecasters with a detailed look at storms through reflectivity and velocity displays.<br />
Reflectivity indicates rainfall or precipitation intensity and velocity displays the speed and<br />
direction of the winds within the storm.<br />
Through the Doppler Effect, a physical phenomenon marked by a change in frequency<br />
depending on the motion of an object toward or away from a point, the radar can give a<br />
picture of the winds within a storm. If, within a small area, high winds toward the radar<br />
are adjacent to high winds away from the radar, a circulation has developed and<br />
forecasters prepare to issue a warning. With this capability, tornado warning lead times<br />
have increased in the last 10 years from less than 5 minutes to nearly 12 minutes (NWS).<br />
Phased Array Radar - NSSL will soon begin adapting SPY-1 radar technology for use in<br />
spotting severe weather.<br />
The mission of the Severe Weather Warning Applications and Technology Transfer (SWAT)<br />
team is to develop severe weather warning applications and transfer them to users to<br />
enhance their capability to warn of severe weather. There are two focus groups within<br />
SWAT:
68<br />
<strong>Jefferson</strong> <strong>County</strong> – Section 2<br />
• National Weather Service Focus Group Staff Listing (SWAT-NWS)<br />
• Federal Aviation Administration Focus Group Staff Listing (SWAT-FAA)<br />
Map of Hazards<br />
Refer to Figure J45 (located in the back of the Technical Appendix) that depicts those areas<br />
in <strong>Jefferson</strong> <strong>County</strong> that are susceptible to severe windstorms.<br />
Statement of Probable Future Severity<br />
Based on the previous twenty-three events in the <strong>Jefferson</strong> <strong>County</strong>, the future probable<br />
severity is shown below.<br />
Future Probable Severity By F-Scale<br />
F0 Negligible<br />
F1 Limited<br />
F2 Limited<br />
F3 Critical<br />
F4 Catastrophic<br />
F5 Catastrophic<br />
Statement of Probable Risk<br />
The risk of tornadoes in <strong>Jefferson</strong> <strong>County</strong> is moderate with twenty-three tornadoes.<br />
Surrounding counties such as St. Louis <strong>County</strong>, St. Charles and <strong>Jefferson</strong> <strong>County</strong> have<br />
greater numbers: 28, 35 and 23, respectively. By nature, tornadoes strike randomly. Based<br />
in information from the National Oceanic and Atmospheric Administration, tornadoes<br />
occur between five to seven times per 10,000 square miles per year and downbursts occur<br />
between 14 to 17 times per 10,000 square miles per year within the EWG planning region.<br />
There are between 40 to 60 thunderstorm days per year and approximately five to eight<br />
annual events of hail per 10,000 square miles within the EWG planning region. These<br />
figures are different from the Federal Emergency Management agency (FEMA) data. FEMA<br />
indicates that there are between six to ten tornadoes per 1,000 square miles in the EWG<br />
planning region. Refer to Table J40 below for risk.<br />
TABLE J40 TORNADO RISK<br />
F# Events Risk Probable Risk of<br />
Occurrence<br />
By F-Scale<br />
F0 22% F0 Likely<br />
F1 48% F1 Likely<br />
F2 17% F2 Likely<br />
F3 9% F3 Possible<br />
F4 4% F4 Possible<br />
F5 0 F5 Unlikely
A Regional Overview All-Hazard Mitigation Plan 69<br />
Statement of Next Disaster’s Likely Adverse Impact on the Community<br />
Tornadoes have enormous power and destructive ability. Injuries, property damage and<br />
risk of death remain high. Technological advances that facilitate earlier warning, combined<br />
with public education and improved construction techniques, provide the opportunity for<br />
reductions in the number of injuries, reduction in property damage and loss of life. Based<br />
on history from 198 years, the likely adverse impact of future <strong>Jefferson</strong> <strong>County</strong> tornado and<br />
thunderstorm events is shown below. The next tornado or severe windstorm will most<br />
likely have a detrimental impact on the community in terms of injuries, property damage<br />
(up to millions dollars in damages from property damage) and death, based upon the past<br />
historic storm events. This is due to the dense population of residents and workers who<br />
live and work in the planning region, as well as the construction methods and standards<br />
used.<br />
Without Mitigation Measures<br />
Life Catastrophic<br />
Property Catastrophic<br />
Emotional Catastrophic<br />
Financial Catastrophic<br />
Comments: None<br />
With Mitigation Measures<br />
Life Limited<br />
Property Limited<br />
Emotional Limited<br />
Financial Limited<br />
Comments: None<br />
Recommendations<br />
That the <strong>County</strong> Hazard Mitigation Planning Committee initiate a mitigation activity to<br />
convince county residents to construct Tornado Saferooms to help reduce the loss of life<br />
caused by tornadoes.<br />
Severe Winter Weather Hazard (Snow, Ice and Extreme Cold) Profile<br />
Description<br />
Winter weather is different than other hazards such as dam failure or tornadoes in that the<br />
hazard tends to occur over a much larger area, often times affecting areas from several<br />
counties to multiple states. Winter weather includes heavy snow, ice, freezing rain/sleet<br />
and extreme cold temperatures.
70<br />
Characteristics<br />
<strong>Jefferson</strong> <strong>County</strong> – Section 2<br />
Snow can range from blizzard conditions to snow flurries and can accumulate to several<br />
inches, resulting in dangerous driving conditions. Ice conditions including sleet and<br />
freezing rain can result in roadways being covered in sheets of ice and ice jams resulting in<br />
flooding. Sleet usually bounces when hitting a surface and does not stick to objects;<br />
however, it can accumulate like snow and cause a hazard to motorists. Freezing rain is rain<br />
that falls onto a surface with a temperature below freezing; this causes it to freeze to<br />
surfaces, such as trees, cars, and roads, forming a glaze of ice. Even small accumulations of<br />
ice can cause a significant hazard. An ice storm occurs when freezing rain falls and freezes<br />
immediately on impact. Heavy accumulations of ice can bring down trees, electrical wires,<br />
telephone poles and lines, and communication towers. Communications and power can be<br />
disrupted for days while utility companies work to repair the extensive damage.<br />
Sometimes winter storms are accompanied by strong winds creating blizzard conditions<br />
with blinding wind-driven snow, severe drifting and dangerous wind chill. Strong winds<br />
with these intense storms and cold fronts can knock down trees, utility poles and power<br />
lines. Extreme cold often accompanies a winter storm or is left in its wake. Prolonged<br />
exposure to the cold can cause frostbite or hypothermia and become life-threatening.<br />
Infants and elderly people are most susceptible to extremely cold weather conditions. What<br />
constitutes extreme cold and its effect varies across different areas of the United States. In<br />
areas unaccustomed to winter weather, near freezing temperatures are considered<br />
"extreme cold." Freezing temperatures can cause severe damage to citrus fruit crops and<br />
other vegetation. Pipes may freeze and burst in homes that are poorly insulated or without<br />
heat. In the north, below zero temperatures may be considered as "extreme cold." Long<br />
cold spells can cause rivers to freeze, disrupting shipping, and Ice jams may form and lead<br />
to flooding.<br />
Heavy snow can immobilize a region and paralyze a city, stranding commuters, stopping<br />
the flow of supplies, and disrupting emergency and medical services. Accumulations of<br />
snow can collapse buildings and knock down trees and power lines. In rural areas, homes<br />
and farms may be isolated for days, and unprotected livestock may be lost. The cost of<br />
snow removal, repairing damages, and loss of business can have large economic impacts<br />
on cities and towns.<br />
Extreme cold temperatures are ranked based upon a wind chill chart that figures the<br />
temperature on how the wind and cold feel on exposed skin. As the wind increases, heat is<br />
carried away from the body at a faster rate, driving down the body temperature. Frostbite,<br />
hypothermia and death can result from winter weather. Seventy percent of snow injuries<br />
result from vehicle accidents, 25% occur in people getting caught in the weather. Cold<br />
injuries occur to 50% of people over 60 years old, 75% happen to males and 20% occur in<br />
the home.
A Regional Overview All-Hazard Mitigation Plan 71<br />
Likely Locations<br />
Winter weather in the St. Louis region moves in an east to west direction. Late winter<br />
storms that have a tendency to be intense tend to generate in the southwest portion of the<br />
United States and move northeast, dependent upon the meteorology and the storm track.<br />
Winter weather is different that other hazards such as tornadoes in that the hazard tends<br />
to occur over a much larger area, often times affecting from several counties to multiple<br />
states.<br />
Type of Damage<br />
Types of damage that could occur in the EWG planning region results in property damage,<br />
as well and injury and death to individuals. Each year dozens of people die due to<br />
exposure to cold. In addition, vehicle accidents and fatalities, fires due to dangerous use of<br />
heaters and other winter weather fatalities (heart attacks from shoveling snow, for<br />
example) result in a threat. Threats such as hypothermia and frostbite can lead to the loss<br />
of fingers and toes or cause permanent kidney, pancreas, liver damage and death. People<br />
can become trapped in their homes and cars without utilities or assistance. Other damage<br />
can include rooftop collapse (as a result of the inability of the roofs to withstand the<br />
weight of a heavy snowfall event), automobile accidents and downed power lines/power<br />
outages from ice storms. Heavy snow can strand commuters, close airports, stop the flow<br />
of supplies and disrupt emergency and medical services. Livestock may be lost on farms.<br />
The cost of snow and debris removal, repairing damages and the loss of business can have<br />
a severe impact on the region.<br />
Hazard Event History<br />
St. Louis City<br />
Injuries/Damage<br />
St. Louis <strong>County</strong><br />
Injuries/Damage<br />
St. Charles <strong>County</strong><br />
Injuries/Damage<br />
<strong>Jefferson</strong> <strong>County</strong><br />
Injuries/Damage<br />
Franklin<br />
<strong>County</strong><br />
Injuries/Damage<br />
TABLE J41 JEFFERSON COUNTY WINTER STORMS<br />
1994<br />
2*<br />
15/500K<br />
2*<br />
15/500K<br />
2*<br />
15/500K<br />
1<br />
500K<br />
2*<br />
15/500K<br />
1995<br />
3*<br />
/.3 M<br />
3*<br />
/.3M<br />
5*<br />
/2.7M<br />
3*<br />
/.3 M<br />
5*<br />
/2.7M<br />
1996<br />
1997<br />
1998<br />
1999<br />
2000<br />
2001<br />
2002<br />
2003<br />
Total<br />
3* 4 3 2* 4 1 4 1 27<br />
3*<br />
3*<br />
2*<br />
3*<br />
4<br />
4<br />
4<br />
4<br />
4<br />
4<br />
4<br />
3<br />
2*<br />
2*<br />
3*<br />
2*<br />
4<br />
4<br />
3<br />
3<br />
1<br />
1<br />
1<br />
0<br />
4<br />
4<br />
4<br />
4<br />
2<br />
2<br />
1<br />
1<br />
35<br />
31<br />
26<br />
27
72<br />
<strong>Jefferson</strong> <strong>County</strong> – Section 2<br />
TABLE J41 JEFFERSON COUNTY WINTER STORMS<br />
1994<br />
Total<br />
9<br />
Injuries/Damage 15/500K<br />
* Denotes ice storm event<br />
• Source NCDC/NOAA<br />
1995<br />
19<br />
/2.7M<br />
1996<br />
1997<br />
1998<br />
1999<br />
2000<br />
2001<br />
2002<br />
2003<br />
14 20 18 11 18 4 20 7<br />
Data from Table J41was provided by the NCDC within NOAA. The report query noted that<br />
the data represent ice and snow events between January 1, 1950 and February 28, 2003.<br />
However, no dates prior to 1994 were displayed in the query results. It is for this reason<br />
that the data provided in Table J41 and J42 above and below should be used with limited<br />
reliability in depicting all events, related injuries and property damage during this time<br />
frame. The numbers in the table denote the number of winter storms that occurred in<br />
each year listed. The winter storms listed include snow and ice events. In a personal<br />
communication with NOAA (Scott Stevens), NOAA stated that it does not track winter<br />
weather to the same degree it has for severe Midwest spring storms. This is mainly due to<br />
the fact that winter weather and winter storms are more "subjective" and this kind of<br />
information has not been summarized (graphically or otherwise). The Aviation Weather<br />
Service, a part of the NOAA maintains a list of historic weather facts. The database noted<br />
that on November 6, 1951, St. Louis received 12.5 inches of snow, and on January 31,<br />
1982, regions surrounding St. Louis received 25 inches of snow and left approximately<br />
4,000 motorists stranded for two days.<br />
Frequency of Occurrence<br />
NOAA weather data shows that winter weather most commonly occurs in January (44% of<br />
storms occurred in this month), followed by December (22%). Records show that<br />
temperatures drop to zero or below an average of two or three days per year, and<br />
temperatures as cold as 32 degrees or lower occur less than 25 days in most years.<br />
Snowfall has averaged a little over 18 inches per winter season, and snowfall of an inch or<br />
less is received on five to ten days in most years.<br />
TABLE J42 JEFFERSON COUNTY WINTER STORMS<br />
Location or <strong>County</strong> Date Type Mag Dth Inj PrD CrD<br />
1. Regional 02/22/1994 Glaze/ice Storm N/A 0 15 0 0<br />
2 Regional 04/05/1994 Winter Storm N/A 0 0 500K 0<br />
3 Regional 01/06/1995 Glaze Ice N/A 0 0 0.3M 1K<br />
4 Regional 12/08/1995 Snow N/A 0 0 0 0<br />
5 Regional 12/18/1995 Winter Storm N/A 0 0 0 0<br />
6 Regional 01/02/1996 Winter Storm N/A 0 0 0 0<br />
7 Regional 01/03/1996 Winter Storm N/A 0 0 0 0<br />
8 Regional 11/25/1996 Ice Storm N/A 0 0 0 0<br />
9 Regional 01/08/1997 Winter Storm N/A 0 0 0 0<br />
Total
A Regional Overview All-Hazard Mitigation Plan 73<br />
TABLE J42 JEFFERSON COUNTY WINTER STORMS<br />
Location or <strong>County</strong> Date Type Mag Dth Inj PrD CrD<br />
10 Regional 01/15/1997 Winter Storm N/A 0 0 0 0<br />
11 Regional 01/27/1997 Winter Storm N/A 0 0 0 0<br />
12 Regional 04/10/1997 Winter Storm N/A 0 0 0 0<br />
13 Regional 01/12/1998 Winter Storm N/A 0 0 0 0<br />
14 Regional 03/08/1998 Winter Storm N/A 0 0 0 0<br />
15 Regional 12/21/1998 Winter Storm N/A 0 0 0 0<br />
16 Regional 01/01/1999 Winter Storm N/A 0 0 0 0<br />
17 Regional 01/13/1999 Ice Storm N/A 0 0 0 0<br />
18 Regional 01/17/2000 Winter Storm N/A 0 0 0 0<br />
19 Regional 01/28/2000 Winter Storm N/A 0 0 0 0<br />
20 Regional 03/11/2000 Winter Storm N/A 0 0 0 0<br />
21 Regional 12/13/2000 Heavy Snow N/A 0 0 0 0<br />
22 Regional 01/26/2001 Winter Storm N/A 0 0 0 0<br />
23 Regional 02/25/2002 Winter Storm N/A 0 0 0 0<br />
24 Regional 03/25/2002 Winter Storm N/A 0 0 0 0<br />
25 Regional 12/04/2002 Winter Storm N/A 0 0 0 0<br />
26 Regional 12/24/2002 Winter Storm N/A 0 0 0 0<br />
27 Regional 02/23/2003 Winter Storm N/A 0 0 0 0<br />
Total 15 800K 500<br />
Intensity or Strength<br />
Winter storms in the EWG planning region, as compared to winter storms to the north and<br />
west, are relatively mild. Severe winter weather is rare. Based on records maintained from<br />
1900 through 2002, the region has experienced total annual snowfall over the average of<br />
18 inches per year. Of these years, only six years experienced annual snowfall of over 40<br />
inches. In the queries requested from NOAA, storm magnitudes were not reported.<br />
Lives Lost, Injuries, Property Damage, Economic Losses/Other Losses<br />
Based on queries for St. Louis City, St. Louis <strong>County</strong>, St. Charles <strong>County</strong>, <strong>Jefferson</strong> <strong>County</strong><br />
and Franklin <strong>County</strong> to NOAA, no deaths were reported due to winter storms. However,<br />
fifteen injuries were noted from 1994 to 2003 and property damage totaled $800,000.<br />
No other information was available from NOAA.<br />
Winter storms are considered deceptive killers because most deaths are indirectly related to<br />
the storm. People die in traffic accidents on icy roads and of hypothermia from prolonged<br />
exposure to cold. Everyone is potentially at risk during winter storms. The actual threat<br />
depends on the specific situation. Recent observations indicate the following:<br />
• Related to ice and snow:<br />
o About 70% occur in automobiles.<br />
o About 25% are people caught out in the storm.<br />
• Related to exposure to cold:<br />
o 50% are people over 60 years old.
74<br />
o Over 75% are males.<br />
o About 20% occur in the home.<br />
<strong>Jefferson</strong> <strong>County</strong> – Section 2<br />
There are a variety of transportation impacts due to cold weather. Diesel engines are<br />
stressed and often fuel gels in extreme cold weather impacting trucking and rail traffic.<br />
Rivers and lakes freeze, stopping barge and ship traffic. Subsequent ice jams threaten<br />
bridges and can close major highways. Cold temperatures take their toll on vehicle<br />
batteries. Shear cold temperatures stress metal bridge structures. Transportation losses for<br />
the winter of 1976 -77 came to $6.5 billion (in 1980 dollars) (NOAA, 1982).<br />
Cold temperature impacts on agriculture are frequently discussed in terms of frost and<br />
freeze impacts early or late in growing seasons. Absolute temperature and duration of<br />
extreme cold can have devastating effects on trees and winter crops as well. Prolonged<br />
cold snaps can impact livestock not protected from the frigid temperatures. In the winter<br />
of 1983-84, a single cold snap around Christmas destroyed over $1 billion of the citrus<br />
crop in Florida. Louisiana lost 80% of its citrus crop. Tennessee estimated $15 million in<br />
agriculture losses. Texas experienced hundreds of millions of dollars in crop damage<br />
(NOAA, 1983).<br />
Energy consumption rises significantly during extreme cold weather. In the winter of 1976-<br />
77 additional energy consumption cost $3.8 billion (1980 dollars). This includes increase<br />
costs of electricity, fuel oil, and coal.<br />
Extreme cold temperatures can cause significant ground freezing problems, especially if<br />
there is little snow cover. Buried water pipes can burst causing massive ice problems and<br />
loss of water pressure in metropolitan areas. This poses a variety of public health and<br />
public safety problems. One case of a broken water main in Denver, Colorado forced the<br />
entire evacuation in sub-zero temperatures of the medically fragile patients of the Veteran's<br />
Hospital. Other cases of broken water mains have shut down subway systems and financial<br />
centers.<br />
Schools often close during extreme cold snaps to protect the safety of children who wait<br />
for school buses.<br />
Locations/Areas Affected<br />
Winter weather in the St. Louis region moves in an east to west direction. Late winter<br />
storms that have a tendency to be intense tend to generate in the southwest portion of the<br />
United States and move northeast, dependent upon the meteorology and the storm track.<br />
Winter weather is different than other hazards such as tornadoes in that the hazard tends<br />
to occur over a much larger area, often times affecting from several counties to multiple<br />
states.
A Regional Overview All-Hazard Mitigation Plan 75<br />
Seasonal Pattern<br />
Being in the northern hemisphere, Missouri’s geographic location has the potential to<br />
experience severe winter weather during the months of December through February,<br />
although winter weather has been known to also occur in mid-November and into March.<br />
Speed Of Onset And/Or Existing Warning Systems<br />
Winter weather typically does not hit the region without warning. The NOAA Weather<br />
Radio, commercial radio, and television track and announce the latest winter storm<br />
watches, warnings, and advisories. The National Weather Service sets up winter weather<br />
warnings in stages of severity. These warnings are found below.<br />
WIND CHILL ADVISORY:<br />
Notice that wind chill conditions will be present and to dress appropriately<br />
WINTER STORM WATCH:<br />
Severe winter conditions, such as heavy snow and/or ice, are possible within<br />
the next day or two. Prepare.<br />
WINTER STORM WARNING:<br />
Severe winter conditions have begun or are about to begin in your area. Stay<br />
indoors!<br />
BLIZZARD WARNING:<br />
Snow and strong winds will combine to produce a blinding snow (near zero<br />
visibility), deep drifts, and life-threatening wind chill. Seek refuge<br />
immediately<br />
WINTER WEATHER ADVISORY:<br />
Winter weather conditions are expected to cause significant inconveniences<br />
and may be hazardous. If caution is exercised, these situations should not<br />
become life- threatening. The greatest hazard is often to motorists.<br />
FROST/FREEZE WARNING:<br />
Below freezing temperatures are expected and may cause significant damage<br />
to plants, crops, or fruit trees. In areas unaccustomed to freezing<br />
temperatures, people who have homes without heat need to take added<br />
precautions.<br />
Map of Hazards<br />
Refer to Figure J45, located in the back of the Technical Appendix, for a map depicting<br />
potential regions of <strong>Jefferson</strong> <strong>County</strong> that are susceptible to severe winter weather.<br />
Statement of Probable Future Severity<br />
The probable future severity of severe winter weather will most likely be similar to the<br />
climatologic past. Based on the climatic history of <strong>Jefferson</strong> <strong>County</strong>, winter weather and
76<br />
<strong>Jefferson</strong> <strong>County</strong> – Section 2<br />
extreme cold events are highly likely to occur. The future probably severity for each<br />
category of winter events is shown below:<br />
Winter Event Probable Severity<br />
Heavy Snow Limited<br />
Ice Event Critical<br />
Extreme Cold Critical<br />
Statement of Probable Risk/Likeliness of Future Occurrence<br />
Based upon <strong>Jefferson</strong> <strong>County</strong>’s climatic history, there is a highly likely risk of impacts in the<br />
county due to severe winter weather.. Based in information from the National Oceanic and<br />
Atmospheric Administration and FEMA, severe winter weather occurs between two to<br />
three times per year in the EWG planning region. NOAA has data from EWG planning<br />
region indicating that during the winter months the probability of measurable snowfall<br />
ranges between 91 and 100 percent, depending on the reporting weather station.<br />
Records show that temperatures drop to zero or below an average of two or three days per<br />
year, and temperatures as cold as 32 degrees or lower occur less than 25 days in most<br />
years. The coldest day reported in the region from 1941 through 2001 was minus 18<br />
degrees Fahrenheit on January 20, 1985. Snowfall has averaged a little over 18 inches per<br />
winter season, and snowfall of an inch or less is received on five to ten days in most years.<br />
Winter Event Probable Risk<br />
Heavy Snow Likely<br />
Ice Event Likely<br />
Extreme Cold Likely<br />
Statement of Next Disaster’s Likely Adverse Impact on Community<br />
The next severe winter storm will possibly have a detrimental impact on the community in<br />
terms of injuries, property damage and death, based upon the past historic storm events.<br />
This is due to the dense population of residents and workers who live and work in the<br />
planning region. Based on recent history, the likely impact on <strong>Jefferson</strong> <strong>County</strong> is shown<br />
below.<br />
Without Mitigation Measures<br />
Life Catastrophic<br />
Property Critical<br />
Emotional Catastrophic<br />
Financial Critical<br />
Comments: none<br />
With Mitigation Measures<br />
Life Limited<br />
Property Limited<br />
Emotional Limited
A Regional Overview All-Hazard Mitigation Plan 77<br />
Financial Limited<br />
Comments Public education about winter hazards and health dangers can reduce<br />
deaths and injuries<br />
Recommendation<br />
Mitigation activities for <strong>Jefferson</strong> <strong>County</strong> should include the education of its workers and<br />
residents about prevention of injuries and deaths from severe winter weather.<br />
Drought Hazard Profile<br />
Description<br />
Drought is defined as the deficiency of precipitation over an extended period of time,<br />
usually a season or more. This deficiency results in a water shortage for some activity,<br />
group or environmental sector. Drought should be considered relative to some long-term<br />
average condition of balance between precipitation and evapotranspiration (i.e.,<br />
evaporation + transpiration) in a particular area, a condition often perceived as “normal”.<br />
It is also related to the timing (i.e., principal season of occurrence, delays in the start of the<br />
rainy season, occurrence of rains in relation to principal crop growth stages) and the<br />
effectiveness (i.e., rainfall intensity, number of rainfall events) of the rains. Other climatic<br />
factors such as high temperature, high wind, and low relative humidity are often<br />
associated with drought in many regions of the world and can significantly aggravate its<br />
severity.<br />
Drought should not be viewed as merely a physical phenomenon or natural event. Its<br />
impacts on society result from the interplay between a natural event (less precipitation than<br />
expected resulting from natural climatic variability) and the demand people place on water<br />
supply. Human beings often exacerbate the impact of drought. Recent droughts in both<br />
developing and developed countries and the resulting economic and environmental<br />
impacts and personal hardships have underscored the vulnerability of all societies to this<br />
hazard.<br />
There are two main kinds of drought definitions: conceptual and operational. Conceptual<br />
definitions, formulated in general terms, help people understand the concept of drought.<br />
Drought is a protracted period of deficient precipitation resulting in extensive damage to<br />
crops, resulting in loss of yield. Conceptual definitions may also be important in<br />
establishing drought policy. For example, Australian drought policy incorporates an<br />
understanding of normal climate variability into its definition of drought. The country<br />
provides financial assistance to farmers only under “exceptional drought circumstances,”<br />
when drought conditions are beyond those that could be considered part of normal risk<br />
management. Declarations of exceptional drought are based on science-driven<br />
assessments. Previously, when drought was less well defined from a policy standpoint and
78<br />
<strong>Jefferson</strong> <strong>County</strong> – Section 2<br />
less well understood by farmers, some farmers in the semiarid Australian climate claimed<br />
drought assistance every few years.<br />
Operational definitions help define the onset, severity, and end of droughts. No single<br />
operational definition of drought works in all circumstances, and this is a big part of why<br />
policy makers, resource planners, and others have more trouble recognizing and planning<br />
for drought than they do for other disasters. In fact, most drought planners now rely on<br />
mathematic indices to decide when to start implementing water conservation or drought<br />
response measures.<br />
In the early 1980s, research by Donald A. Wilhite, director of the National Drought<br />
Mitigation Center, and Michael H. Glantz, of the National Center for Atmospheric<br />
Research, uncovered more than 150 published definitions of drought. The definitions<br />
reflect differences in regions, needs, and disciplinary approaches. Wilhite and Glantz<br />
categorized the definitions in terms of four basic approaches to measuring drought:<br />
meteorological, hydrological, agricultural, and socioeconomic. The first three approaches<br />
deal with ways to measure drought as a physical phenomenon. The last approach to<br />
measuring drought deals with drought in terms of supply and demand, tracking the effects<br />
of water shortfall as it ripples through socioeconomic systems.<br />
Meteorological drought is usually an expression of precipitation’s departure from normal<br />
over some period of time. These definitions are usually region-specific, and presumably<br />
based on a thorough understanding of regional climatology. Meteorological measurements<br />
are the first indicators of drought.<br />
Agricultural drought occurs when there is not enough soil moisture to meet the needs of a<br />
particular crop at a particular time. Agricultural drought happens after meteorological<br />
drought but before hydrological drought. Agriculture is usually the first economic sector to<br />
be affected by drought. Agricultural drought links various characteristics of meteorological<br />
(or hydrological) drought to agricultural impacts, focusing on precipitation shortages,<br />
differences between actual and potential evapotranspiration, soil water deficits, reduced<br />
ground water or reservoir levels, and so forth. Plant water demand depends on prevailing<br />
weather conditions, biological characteristics of the specific plant, its stage of growth, and<br />
the physical and biological properties of the soil. A good definition of agricultural drought<br />
should be able to account for the variable susceptibility of crops during different stages of<br />
crop development, from emergence to maturity. Deficient topsoil moisture at planting may<br />
hinder germination, leading to low plant populations per hectare and a reduction of final<br />
yield. However, if topsoil moisture is sufficient for early growth requirements, deficiencies<br />
in subsoil moisture at this early stage may not affect final yield if subsoil moisture is<br />
replenished as the growing season progresses or if rainfall meets plant water needs.<br />
Hydrological drought refers to deficiencies in surface and subsurface water supplies. It is<br />
measured as streamflow and as lake, reservoir, and groundwater levels. There is a time lag<br />
between lack of rain and less water in streams, rivers, lakes, and reservoirs, so hydrological<br />
measurements are not the earliest indicators of drought. When precipitation is reduced or
A Regional Overview All-Hazard Mitigation Plan 79<br />
deficient over an extended period of time, this shortage will be reflected in declining<br />
surface and subsurface water levels. Hydrological drought is associated with the effects of<br />
periods of precipitation (including snowfall) shortfalls on surface or subsurface water<br />
supply (i.e., streamflow, reservoir and lake levels, ground water). The frequency and severity<br />
of hydrological drought is often defined on a watershed or river basin scale. Although all<br />
droughts originate with a deficiency of precipitation, hydrologists are more concerned with<br />
how this deficiency plays out through the hydrologic system. Hydrological droughts are<br />
usually out of phase with or lag the occurrence of meteorological and agricultural<br />
droughts. It takes longer for precipitation deficiencies to show up in components of the<br />
hydrological system such as soil moisture, streamflow, and ground water and reservoir<br />
levels. As a result, these impacts are out of phase with impacts in other economic sectors.<br />
For example, a precipitation deficiency may result in a rapid depletion of soil moisture that<br />
is almost immediately discernible to agriculturalists, but the impact of this deficiency on<br />
reservoir levels may not affect hydroelectric power production or recreational uses for many<br />
months. Also, water in hydrologic storage systems (e.g., reservoirs, rivers) is often used for<br />
multiple and competing purposes (e.g., flood control, irrigation, recreation, navigation,<br />
hydropower, wildlife habitat), further complicating the sequence and quantification of<br />
impacts. Competition for water in these storage systems escalates during drought and<br />
conflicts between water users increase significantly.<br />
Hydrological Drought and Land Use<br />
Although climate is a primary contributor to hydrological drought, other factors such as<br />
changes in land use (e.g., deforestation), land degradation, and the construction of dams<br />
all affect the hydrological characteristics of the basin. Because regions are interconnected<br />
by hydrologic systems, the impact of meteorological drought may extend well beyond the<br />
borders of the precipitation-deficient area. For example, meteorological drought may<br />
severely affect portions of the northern Rocky Mountains and northern Great Plains region<br />
of the United States. However, since the Missouri River and its tributaries drain this region<br />
to the south, there may be significant hydrologic impacts downstream. Similarly, changes<br />
in land use upstream may alter hydrologic characteristics such as infiltration and runoff<br />
rates, resulting in more variable streamflow and a higher incidence of hydrologic drought<br />
downstream. Bangladesh, for example, has shown an increased frequency of water<br />
shortages in recent years because land use changes have occurred within the country and<br />
in neighboring countries. Land use change is one of the ways human actions alter the<br />
frequency of water shortage even when no change in the frequency of meteorological<br />
drought has been observed.<br />
For the purposes of drought response planning, all three categories (meteorologic,<br />
hydrologic and agriculture) can be regarded as equivalent, since each one relates to the<br />
occurrence of drought to water shortfalls in some component of the hydrologic cycle. The<br />
most commonly used drought severity indicators are the Palmer Drought Severity Index<br />
(PDSI) and the Crop Moisture Index. These are published by NOAA and the USDA. The<br />
PDSI is more widely used than any other single indicator. It provides a standardized means<br />
of depicting drought severity throughout the US. It measures the departure of water
80<br />
<strong>Jefferson</strong> <strong>County</strong> – Section 2<br />
supply (in terms of precipitation and stored soil moisture) from demand (the amount of<br />
water required to recharge soil and keep rivers, lakes and reservoirs at normal levels). By<br />
relating these figures to the previous regional index a continuous stream of data is created<br />
reflecting long-term wet or dry tendencies.<br />
Socioeconomic drought occurs when physical water shortage starts to affect people,<br />
individually and collectively.<br />
Missouri has six regions that display similar climatic characteristics. For each region,<br />
drought severity can be determined according to the following Table J43:<br />
TABLE J43 PALMER<br />
CLASSIFICATIONS<br />
Palmer Classifications<br />
4.0 or more extremely wet<br />
3.0 to 3.99 very wet<br />
2.0 to 2.99 moderately wet<br />
1.0 to 1.99 slightly wet<br />
0.5 to 0.99 incipient wet spell<br />
0.49 to -0.49 near normal<br />
-0.5 to -0.99 incipient dry spell<br />
-1.9 to -1.99 mild drought<br />
-2.0 to -2.99 moderate drought<br />
-3.0 to -3.99 severe drought<br />
-4.0 or less extreme drought<br />
St. Louis City, St. Louis, St. Charles and Franklin counties are included in the northeast<br />
Region 2 that displays similar climatic characteristics. <strong>Jefferson</strong> <strong>County</strong> is included in the<br />
southeast Region 5. See Figure J46 below.
A Regional Overview All-Hazard Mitigation Plan 81<br />
Characteristics<br />
Figure J46 MISSOURI DROUGHT REGIONS<br />
Source: Missouri Department of Natural Resources<br />
Drought characteristics include economic, social and environmental. This report will touch<br />
on economic and environmental impacts. The 1930s drought’s direct effect is most often<br />
remembered as agricultural. Deficient rainfall, high temperatures, and high winds, as well<br />
as insect infestations and dust storms that accompanied these conditions damaged many<br />
crops. Although records focus on other problems, the lack of precipitation would also<br />
have affected wildlife and plant life, and would have created water shortages for domestic<br />
needs. The severity and aerial coverage of the event played a part in making the 1930s<br />
drought the widely accepted drought of record for the United States.<br />
Likely Locations<br />
According to the Palmer Index, Missouri is broken up into six climate divisions. Franklin, St<br />
Charles, St. Louis City and St. Louis Counties are all found in the southeastern section of<br />
climate Division 2. <strong>Jefferson</strong> <strong>County</strong> is in the northeast corner of climate Division 5. Based<br />
on the NDMC historic drought mapping of Regions 2 and 5, the most common area for<br />
drought conditions to occur is within Region 2 (including St. Louis City, St. Louis, St.<br />
Charles, and Franklin counties).<br />
The State of Missouri has State Drought Plans in place. Missouri’s plan is such that it<br />
divides the state into three regions according to their susceptibility to drought depending
82<br />
<strong>Jefferson</strong> <strong>County</strong> – Section 2<br />
on the characteristics of surface and ground water supplies. Regions were judged to have<br />
slight, moderate or high susceptibility to drought. Poor groundwater resources, surface<br />
water supplies that become inadequate during extended drought and inadequate irrigation<br />
water supplies characterize areas within Region C, considered to have severe drought<br />
vulnerability. This region includes most of St. Louis <strong>County</strong> just south of the juncture of the<br />
Missouri and Mississippi Rivers. Areas in this region are designated as "Priority Drought<br />
Management Areas”. Areas within western St. Charles <strong>County</strong>, southern Franklin <strong>County</strong><br />
and most of central/western <strong>Jefferson</strong> <strong>County</strong> are included in Region B: Moderate<br />
Susceptibility to Drought. Areas along the Mississippi and Missouri River valley floodplain<br />
areas in the counties in this study are within Region A: Slight Susceptibility.<br />
Information obtained from the Missouri Drought Response Plan (Water Resources Report<br />
No. 44) has a map that depicts a similar concept of drought susceptibility. However, the<br />
NDMC and the Missouri Plan are not in total agreement on common areas of drought.<br />
The Missouri Drought Response Plan divides the state into three categories based on a<br />
slight, moderate or high susceptibility to drought. The Missouri Plan depicts St. Louis City<br />
as having a high susceptibility to drought, and St. Louis, Franklin, <strong>Jefferson</strong>, St. Charles<br />
Counties with a moderate susceptibility to drought. Certain Region A areas in St. Charles,<br />
St. Louis, and Franklin Counties that are underlain by alluvial sands and gravels have a low<br />
susceptibility to drought.<br />
The plan complements and supports the State Consolidated Plan and the State Emergency<br />
Operations Plan. Actions within the drought plan are triggered when the Palmer Drought<br />
Index reaches certain levels. The Drought Assessment Committee (DAC), chaired by the<br />
Director of the Department of Natural Resources, is activated in the Drought Alert Stage.<br />
The DAC then activates the Impact Task Forces, which cover the following topics:<br />
agriculture, natural resources and environmental recreation, water supplies, wastewater,<br />
health, social, economic and post drought evaluation.<br />
Type of Damage<br />
The drought of 1988-89 cost the U. S. an estimated $39 billion. To provide perspective,<br />
estimated damages of the record flood of 1993 were in the range of $20 billion. The<br />
social and economic costs of drought are substantial. Given the extent to which the U. S.<br />
relies on acceptable water supply for health and well- being, the need for advanced<br />
drought planning is obvious. Types of damage can include the increasing incidence of<br />
range fires, causing injuries and devastation to properties, depletion of groundwater<br />
supplies (residents being requested to cut water usage), poor crop growth, and a decrease<br />
in hay for cattle (overgrazing) conditions. A shortage of hay forces ranchers to sell cattle at<br />
low prices and food prices increase due to lower production levels for milk, meat, produce,<br />
and other foodstuffs. Drought also results in reduced revenues from recreational areas,<br />
environmental damages (endangered species were affected, erosion of landscapes),<br />
contaminant levels in surface and groundwater rise due to decrease in volume of stream<br />
flow, loss in revenues from agriculturally related industries such as harvesting, trucking, and
A Regional Overview All-Hazard Mitigation Plan 83<br />
food processing (reduced irrigation water led to a reduction in vegetable production, with<br />
concomitant losses in jobs and income).<br />
There are no official estimates of the total losses and damages from the 1996 drought.<br />
Given the $5 billion in impacts that occurred in Texas, total regional impacts could be<br />
safely estimated in the $10–15 billion range, although it is difficult to quantify many social<br />
and environmental impacts. What was remarkable to many was the significant level of<br />
regional vulnerability, the diversity of impacts, and the lack of preparedness to respond to<br />
many of these impacts. Many of the states in this region have now initiated longer-term<br />
planning efforts directed at improving mitigation and preparedness<br />
Hazard Event History<br />
Some of the worst droughts on record to affect Region 2 occurred in 1901-02, 1913-14,<br />
1930-31, 1934, 1936, 1940-41, 1953-56, 1963-64, 1980-81, 1988-89 and 1999-2000.<br />
The 1953-56 drought is considered to be the worst on record for Region 2.<br />
Droughts on record to affect Region 5 occurred in 1900-09, 1940-49, 1950-59, 1964-66<br />
and 1980. The drought from 1954-56 was the worst on record for Region 5. Table J44<br />
below shows the Big River level stage during drought conditions.<br />
TABLE J44 RIVER LEVEL STAGES IN DROUGHT CONDITIONS IN JEFFERSON<br />
COUNTY<br />
Station Stage (Flood Stage 16 ft) Date<br />
Big River at Byrnes Mill 1.5 8/30/1936<br />
1.5 9/13/2000<br />
1.4 10/05/2001<br />
An overall excellent drought resource on the Internet is the National Drought Mitigation<br />
Center (NDMC). The NDMC provides historical drought information for the U.S. from 1895<br />
through current. Linking to the following address will provide drought information:<br />
http://www.drought.unl.edu/whatis/what.htm<br />
Table J45 identifies, using the Palmer Drought Severity Index, the monthly average for the<br />
period of record for the study area.<br />
TABLE J45 PALMER DROUGHT SEVERITY INDEX MONTHLY<br />
AVERAGE FOR PERIOD OF RECORD<br />
1895 TO 1995<br />
Month Division 2 Division 5<br />
January -0.06 -0.04<br />
February -0.42 -0.94<br />
March -0.66 -1.16<br />
April -0.99 -1.70<br />
May -1.23 -1.62
84<br />
<strong>Jefferson</strong> <strong>County</strong> – Section 2<br />
TABLE J45 PALMER DROUGHT SEVERITY INDEX MONTHLY<br />
AVERAGE FOR PERIOD OF RECORD<br />
1895 TO 1995<br />
June -1.17 0.57<br />
July 1.24 1.64<br />
August 1.68 1.65<br />
September 1.48 -0.40<br />
October 0.65 -0.93<br />
November 0.81 0.30<br />
December 2.37 1.79<br />
Quantifying a drought is very difficult. The Palmer Index is the most widely known product.<br />
The United States government adopted the Palmer Index as its drought indicator back in<br />
the 1960's and continues to do so today, despite some of its weaknesses.<br />
Within the past few years, the National Drought Mitigation Center has created a U.S.<br />
drought map that utilizes numerous indicators to determine the severity of a drought.<br />
These indicators include the Palmer Index, Crop Moisture Index, Standardized Precipitation<br />
Index, Percent of Normal Rainflow, Daily Streamflow, Snowpack, Soil Moisture, Vegetative<br />
Index, and Fire Danger Classifications. There is also a lot of subjectivity that goes into the<br />
map. The drought authors take heavily into consideration the input they receive from local<br />
experts in terms of the impacts that are being felt.<br />
Frequency of Occurrence<br />
The National Drought Mitigation Center has developed a graphic historic representation of<br />
the frequency of occurrence of areas within the upper Mississippi River Basin experiencing<br />
severe to extreme drought from 1895 to 1995. The graph below depicts the percentage of<br />
areas of the upper Mississippi River Basin that were impacted by drought, including climatic<br />
zones 2 and 5. Based on the NCDC 1980 report, heat and drought events result in the<br />
highest damage (in the range of 120 billion dollars from 1980 to 1999 based on 46<br />
weather related events) when compared to other natural weather hazards. See Figure J47<br />
below.<br />
FIGURE J47 SEASONAL DROUGHT
A Regional Overview All-Hazard Mitigation Plan 85<br />
Intensity or Strength<br />
The Palmer Drought Severity Index can be utilized to determine the intensity or strength of<br />
droughts. Table J45 above lists the average monthly Palmer Drought Severity Index from<br />
1895 to 1995 for Regions 2 (St. Louis City, St. Louis <strong>County</strong>, St. Charles <strong>County</strong>, Franklin<br />
<strong>County</strong>) and 5 (<strong>Jefferson</strong> <strong>County</strong>).<br />
Lives Lost, Injuries, Property Damage, Economic Losses/Other Losses<br />
The drought of 1988-89 cost the U.S. an estimated $39 billion. To provide perspective,<br />
estimated damages of the record flood of 1993 were in the range of $12-$16 billion. The<br />
social and economic costs of drought are substantial. Given the extent to which the U.S.<br />
relies on acceptable water supply for health and well- being, the need for advanced<br />
drought planning is obvious.<br />
Although the 1988–89 drought was the most economically devastating disaster in the<br />
history of the United States (Riebsame et al., 1991), a close second is undoubtedly the<br />
series of droughts that affected large portions of the United States in the 1930’s.<br />
Determining the direct and indirect costs associated with this period of droughts is a<br />
difficult task because of the broad impacts of drought, the event’s close association with<br />
the Great Depression, the fast revival of the economy with the start of World War II, and<br />
the lack of adequate economic models for evaluating losses at that time. However, broad<br />
calculations and estimates can provide valuable generalizations of the economic impact of<br />
the 1930s drought. In 1937, the Works Progress Administration (WPA) reported that<br />
drought was the principal reason for economic relief assistance in the Great Plains region<br />
during the 1930s (Link et al., 1937). Federal aid to the drought-affected states was first<br />
given in 1932, but the first funds marked specifically for drought relief were not released<br />
until the fall of 1933. In all, assistance may have reached $1 billion (in 1930s dollars) by the<br />
end of the drought (Warrick et al., 1980).
86<br />
<strong>Jefferson</strong> <strong>County</strong> – Section 2<br />
According to the WPA, three-fifths of all first-time rural relief cases in the Great Plains area<br />
were directly related to drought, with a disproportionate amount of cases being farmers<br />
(68%) and especially tenant farmers (70% of the 68%). However, it is not known how<br />
many of the remaining cases (32%) were indirectly affected by drought. The WPA report<br />
also noted that 21% of all rural families in the Great Plains area were receiving federal<br />
emergency relief by 1936 (Link et al., 1937); the number was as high as 90% in hard-hit<br />
counties (Warrick, 1980). Thus, even though the exact economic losses are not known for<br />
this time period, they were substantial enough to cause widespread economic disruption<br />
that affected the entire nation.<br />
The Palmer Drought Severity Index relates climate and weather to prolonged and abnormal<br />
soil moisture deficiencies affecting water sensitive economies in the US. The index is useful<br />
in delineating disaster areas and indicating the availability of irrigation water supplies,<br />
reservoir levels, range conditions, amount of stock water, and potential intensity of forest<br />
fires.<br />
Seasonal Pattern<br />
Based on Table J45 above from Regions 2 and 5, a trend emerges of mild drought<br />
occurring from January through May from the period of record from 1895 to 1995.<br />
Speed of Onset And/Or Existing Warning Systems<br />
By nature, drought occurs very slowly. Existing warning systems have been developed by<br />
Missouri Department of Natural Resources (Missouri Drought Response Plan). Mr. Steve A.<br />
McIntosh is the contact person for drought in Missouri. The function of the plan is to assist<br />
in the response, monitoring and prediction, communication, and planning in the event of a<br />
drought. The plan provides for operations and administrative procedures that activate the<br />
Drought Assessment Committee, Impact Task Forces, Governor's Drought Executive<br />
Committee, and the State Emergency Operations Center. The Governor's declaration<br />
empowers state agencies to implement water shortage emergency actions. The statute or<br />
authority that regulates this activity is the State Water Resources Plan (Revised statutes of<br />
Missouri Chapters 640.415). The primary agencies involved in drought activities include:<br />
Missouri Dept. of Natural Resources (primary), Missouri Dept. of Agriculture, Missouri Dept.<br />
of Public Safety, Missouri Dept. of Conservation, Missouri Dept. of Social Services,<br />
University of Missouri-Columbia, DOC, USDA, US Army, DOI, EPA, and FEMA. The drought<br />
plan serves the following groups: water supply systems of individual ranchers and farmers,<br />
local governments, federal agencies, domestic water users, health care facilities, public uses<br />
such as electric power generation, firefighting, key military facilities, communications, and<br />
wastewater systems.<br />
As a part of the plan, monthly drought monitoring (consisting of water monitoring data<br />
and weather data) is provided to the State Emergency Management Agency by the<br />
Department of Natural Resources and the National Weather Service. MDNR utilizes the<br />
Palmer Drought Index as a trigger to determine drought phases and actions to be taken.
A Regional Overview All-Hazard Mitigation Plan 87<br />
Palmer greater than or equal to -1.0: Phase 1 (Advisory Phase)<br />
Palmer -1.0 to -2.0: Phase 2 (Drought Alert)<br />
Palmer -2.0 to -4.0: Phase 3 (Conservation Phase)<br />
Palmer less than or equal to -4.0: Phase 4 (Possible Local Rationing Phase)<br />
Once the data demonstrates that there is a Phase 2 drought condition, the Water<br />
Resources Program Director declares drought alert for any region of the state and the<br />
Director of the Department of Natural Resources may activate and chair the Drought<br />
Assessment Committee (DAC). The DAC then activates the Impact Task Forces that include<br />
the following Departments:<br />
Agriculture<br />
Natural Resources and Environmental Recreation<br />
Water Supplies and Wastewater<br />
Health<br />
Social<br />
Economic<br />
Post Drought Evaluation<br />
The state drought plan still has unmet needs at federal, state, local levels. These needs<br />
include changes from customer or "provider" perspective: 1) lack of U.S. coordinated<br />
response to meld with state response plan, 2) need for state climatologist to be available<br />
for consultation, and 3) lack of a permanent source or mechanism of drought response<br />
and mitigation funds at the federal or state level.<br />
There are program limitations to the state drought plan: 1) early stages are voluntary<br />
conservation measures, 2) state mitigation grant or loan funds are limited and may be<br />
available only through mechanisms not well coordinated with emergency response plan.<br />
Map of Hazards<br />
Figure J48 below depicts the percent of time the various regions spent in severe and<br />
extreme drought conditions from 1895 to 1995. This is defined as the percentage of time<br />
when the Palmer Drought Severity Index was less than or equal to –3.0. Refer to Figure J45<br />
(located in the back of the Technical Appendix) for another map of the hazard area.
88<br />
Statement of Probable Future Severity<br />
FIGURE J48 PALMER DROUGH INDEX<br />
<strong>Jefferson</strong> <strong>County</strong> – Section 2<br />
Utilizing MDNR’s drought response system as outlined above, the probable severity levels<br />
of future drought are as follows.<br />
Phase Probable Severity<br />
Phase 1 Negligible<br />
Phase 2 Limited<br />
Phase 3 Critical<br />
Phase 4 Critical<br />
Statement of Probable Risk/Likeliness of Future Occurrence<br />
The probable risk or likeliness of future occurrences of drought will most likely be similar to<br />
the climatologic past. However, the past number and severity of events is not necessarily a<br />
predictor of future occurrences. Based on information from the National Oceanic and<br />
Atmospheric Administration and FEMA, droughts occur approximately every 10 years in the<br />
EWG planning region.<br />
Phase Probable Risk<br />
Phase 1 Likely<br />
Phase 2 Likely<br />
Phase 3 Possible<br />
Phase 4 Possible
A Regional Overview All-Hazard Mitigation Plan 89<br />
Statement of Next Disaster’s Likely Adverse Impact on Community<br />
The next drought will possibly have a detrimental impact on the community in terms of<br />
agricultural (lawns), economic (social) and environmental based upon the past historic<br />
drought events.<br />
Without Mitigation Measures<br />
Life Negligible<br />
Property Limited<br />
Emotional Limited<br />
Financial Critical<br />
Comments None<br />
With Mitigation Measures<br />
Life Negligible<br />
Property (crop damage) Negligible<br />
Emotional Limited<br />
Financial Limited<br />
Comments Education of city residents on watering restrictions of<br />
lawns<br />
Recommendation<br />
Education of city residents on watering restrictions of lawns.<br />
Heat Wave Hazard Profile<br />
Description<br />
Heat wave is defined as a prolonged period of excessive heat and humidity: more than 48<br />
hours of high heat (90 o F or higher) and high humidity (80 percent relative humidity or<br />
higher) are expected. The National Weather Service steps up its procedures to alert the<br />
public during these periods of excessive heat and humidity. Based on the NCDC 1980<br />
report, heat and drought events result in the highest damage (in the range of $120 billion<br />
from 1980 to 1999 based on 46 weather related events) when compared to other natural<br />
weather hazards.<br />
Although heat waves are not often taken as seriously as other forms of severe weather, the<br />
mortality from these weather events in the U. S. from 1979 to 1998 is greater than the<br />
number of lives claimed by lightning, hurricanes, tornadoes, floods, and earthquakes<br />
combined (National Center for Environmental Health). Even during a normal year without<br />
a catastrophic heat wave, the National Weather Service claims that an average of about<br />
175 people succumb to summer heat. This number does not include the number of excess<br />
deaths of people already in poor health, whose deaths may have been advanced by<br />
exposure to extreme heat. Despite the presence of improving technology (e.g., air
90<br />
<strong>Jefferson</strong> <strong>County</strong> – Section 2<br />
conditioning, architectural design, and improved accuracy in weather forecasting), heat<br />
waves continue to take many lives. From the early 20th century to the present time,<br />
Americans have experienced a significant rise in the cost of property damage from severe<br />
weather events, while at the same time the number of lives lost has decreased.<br />
Unfortunately, it appears that heat waves have not followed the same trend.<br />
Like all other major weather events, we cannot prevent a heat wave from developing. We<br />
should, however, give serious consideration to how our communities deal with heat waves<br />
when they occur. In addition, there are a number of other reasons why we should care<br />
about how we deal with heat waves. First, it is often the case that many fatalities during<br />
even the most severe heat waves occur after the first day of extreme heat. This means that<br />
there is time to help people who do not have, or cannot afford, air conditioning. People in<br />
the U. S. over 65 years old are especially vulnerable to extreme heat, and this population is<br />
expected to grow in the very near future.<br />
Heat waves of the past have often been more intense in urban areas. This is a real problem<br />
because Americans are continuously migrating to urban areas. This trend suggests that<br />
more people would be at risk when a heat wave occurs in the region, power companies<br />
would be heavily stressed trying to keep more people cool, and "urban heat islands" (urban<br />
areas where heat is retained by a high density of man-made structures) would be created,<br />
or enhanced if they already existed in the region.<br />
Scientists have observed that the average global temperature increased by the end of the<br />
20th century. As global warming continues it could increase the probability of more<br />
frequent and more intense heat waves. This poses an even greater problem for northern<br />
cities in the U.S., where people are not accustomed to long periods of high heat. Finally,<br />
there are a few other societal impacts to be considered such as: water usage (heat waves<br />
often occur during droughts), urban pollution building up during heat waves, and the<br />
economic impact of keeping millions of people cool.<br />
This paper will focus on past heat waves that recently occurred (within the past 6 years)<br />
impacting U. S. cities in the Midwest and the Northeast. The first topic that will be assessed<br />
is how were certain cities in the Midwest and the Northeast impacted by severe heat<br />
waves. Next, the paper will examine how different cities dealt with heat waves in order to<br />
reduce the health impacts to the population. The development of heat warning systems or<br />
upgrading existing heat warning systems will be examined in order to determine the<br />
effectiveness of the systems in saving people's lives. Finally, this study will attempt to<br />
provide more ideas that could help reduce the impacts of heat waves in the cities of the<br />
Midwest, the Northeast, and could possibly be applied to other cities across the U.S.<br />
Social conditions are major players in the hazards posed by heat waves. People most<br />
affected by heat waves are the elderly who live alone in poor, high crime neighborhoods in<br />
the city. These people often keep their windows closed to prevent break-ins and they often<br />
cannot leave to go to a cooling center.
A Regional Overview All-Hazard Mitigation Plan 91<br />
In addition, there are still problems with getting heat wave information out to all members<br />
of the public. Often, as with any nature disaster impacted a city, it is not considered that<br />
many U.S. cities have large communities of Spanish-speaking people and groups of other<br />
foreign speaking citizens. Furthermore, some families living in inner city apartments do<br />
have air conditioners, but do not use them because they do not realize that the<br />
government will subsidize the extra cost to run the air conditioners during times when a<br />
heat warning is in effect.<br />
Because problems still exist when dealing with heat waves in U.S. cities at the community<br />
level, further solutions should come from the community level. In the case of Philadelphia,<br />
both the NWS and Department of Public Health cooperate to reduce heat wave impacts,<br />
and in Chicago the city government and human services departments also work hard to<br />
reduce impacts. However, what we have learned from these studies is that further solutions<br />
may come from community organizations working to reduce heat wave impacts. For<br />
example, if people are afraid to leave their homes to go to cooling centers, members of a<br />
community organization who are less at risk from heat could watch their homes while they<br />
are gone. It would also be easier for community-based organizations to conduct the doorto-door<br />
checks on people for two reasons. First, these people live in the community and<br />
are not going out of their way to a strange neighborhood. Second, they take some of the<br />
burden off the city human services departments so they can tend to other problems<br />
associated with the heat wave. Once mobilized, a community heat wave response<br />
organization can also work with the city human services departments. An example of this<br />
can be seen in San Leandro, California's "Triad Alliance" where community-based<br />
organizations, emergency management departments, and the city government work<br />
together to mitigate disasters associated with earthquakes. In the case of heat waves, the<br />
city government or mayor's office could still facilitate the registering of people for wellbeing<br />
checks, but then distribute the lists of people to be checked to the community<br />
organizations.<br />
The challenge with developing community heat wave response organizations is finding<br />
enough dedicated members to assist during heat waves or keeping the organization<br />
prepared and ready to mobilize during the warmer parts of the year in U.S. cities. This is a<br />
challenge because, as stated in the beginning of this paper, heat waves are different in<br />
nature than other forms of severe weather or disasters. During heat waves, aside from<br />
occasional power outages and buckling of some roads, peoples' daily lives continue as<br />
normal. People go to work or school, fitness-focused people exercise out in the heat, and<br />
kids play outside. The impact on more vulnerable citizens is not obvious and the<br />
community may not recognize and aid those most in need. More people may start to care<br />
and form community heat wave response organizations if they are educated on how<br />
hazardous heat waves can be. Increased awareness could increase peoples' involvement the<br />
next time a heat wave threatens their community. As far as "who" should make up the<br />
organization, everyone from youngest to oldest should get involved. Elderly who are in<br />
good health should also get involved in these organizations and often have to time to<br />
contribute to mobilizing a community organization during a heat wave. Also, there are<br />
many people at risk who would often refuse to leave their homes with a stranger checking
92<br />
<strong>Jefferson</strong> <strong>County</strong> – Section 2<br />
up on them, but might be convinced by a close friend or neighbor to go to a cooler place<br />
during a heat wave.<br />
Education programs could also be given in schools. Children and young adults can<br />
participate in the community organizations and become aware of the risks of excessive<br />
heat exposure to young people (for example, overexertion during excessive heat periods).<br />
Of course, some younger people and employers would have to make sacrifices during a<br />
heat wave to put work aside and mobilize the community organizations to deal with the<br />
situation. Looking at a whole city during a heat wave, we can compare it to a person.<br />
When there is excessive heat a doctor would probably tell a person to rest and "take it<br />
easy." The same could be said for a city as a whole, continue to function, but to slow down<br />
during a heat wave and allow communities to come together to keep their people safe<br />
during a heat wave. Chicago Mayor Richard M. Daley mentioned the importance of the<br />
whole city's cooperation in his 1996 Summer Heat Preparedness Speech: "I want to<br />
continue to stress, however, that the city's efforts alone cannot prevent the tragedies<br />
related to extreme heat. We need everyone to get involved." (Daley 1996).<br />
Extreme heat is a hazard that could rapidly increase in magnitude in the 21 st century. The<br />
increasingly urbanization of the world’s population results in increasing numbers of<br />
vulnerable people. Global warming also dictates a need to improve heat wave mitigation<br />
and response systems.<br />
Heat kills by taxing the human body beyond its abilities. In a normal year, about 175<br />
Americans succumb to the demands of summer heat. Among the large continental family<br />
of hazards, only the cold of winter--not lightning, hurricanes, tornadoes, floods, or<br />
earthquakes-- takes a greater toll. In the 40-year period from 1936 through 1975, nearly<br />
20,000 people were killed in the United States by the effects of heat and solar radiation. In<br />
the disastrous heat wave of 1980, more then 1,250 people died. These are just the direct<br />
casualties of heat waves. No one can know how many more deaths are advanced by heat<br />
wave weather--how many diseased or aging hearts cannot without the added stress<br />
imposed by extreme heat.<br />
North American summers are hot; most summers see heat waves in one section or another<br />
of the United States. <strong>East</strong> of the Rockies, and especially in the St. Louis Metropolitan area,<br />
they tend to combine both high temperature and high humidities, although some of the<br />
worst heat waves have been catastrophically dry.<br />
In response to the tragic death toll of 1980, the National Weather Service (NWS) has<br />
stepped up its efforts to more effectively alert the general public and appropriate<br />
authorities to the hazards of heat waves.<br />
Based on the latest research findings, the NWS has devised the "Heat Index"(HI),<br />
(sometimes referred to as the "apparent temperature"). The HI, given in degrees F, is an<br />
accurate measure of how hot it really feels when the relative humidity (RH) is added to the<br />
actual air temperature.
A Regional Overview All-Hazard Mitigation Plan 93<br />
To find the HI, look at the Heat Index Chart in Figure J49 below. As an example, if the air<br />
temperature is 95 degrees F (found on the left side of the chart) and the RH is 55% (found<br />
at the top of the chart), the HI- or how hot it really feels-- is 110 degrees F. This is at the<br />
intersection of the 95-degree row and the 55% column.<br />
FIGURE J49 HEAT INDEX<br />
Source: National Weather Service<br />
The stagnant atmospheric conditions of a heat wave trap pollutants in urban areas and<br />
add the stresses of severe pollution to the already dangerous affects of hot weather,<br />
creating a health problem of undiscovered dimensions. A map of heat related deaths in St.<br />
Louis during 1966, for example, shows a heavier concentration in the crowded alleys and<br />
towers of the inner city, where air quality would also be poor during a heat wave.<br />
The high inner-city death rates also result from poor access to air-conditioned rooms. While<br />
air-conditioning may be a luxury in normal times, it can be a lifesaver during heat wave<br />
conditions. The cost of cool air moves steadily higher, adding what appears to be a cruel<br />
economic side to heat wave fatalities. Indications from the 1978 Texas heat wave suggest<br />
that some elderly people on fixed incomes, many of them in buildings that could not be<br />
ventilated without air conditioning, found the cost too high, turned off their units, and<br />
ultimately succumbed to the stresses of heat.<br />
Characteristics<br />
Slow and silent, a heat wave does not descend upon a city with the fury of a tornado,<br />
hurricane, or a winter storm. It moves over an area as a large, deep air mass with<br />
descending air, retarding the development of any significant precipitation that would<br />
provide relief to the ground surface's rising temperatures. As this air mass moves slowly or<br />
just sits over one area for days or even weeks, its rising surface temperatures begin to take<br />
its toll on the people who are trapped in it.
94<br />
Likely Locations<br />
<strong>Jefferson</strong> <strong>County</strong> – Section 2<br />
Heat wave weather in the St. Louis region slowly descends into the area. Heat wave<br />
weather is different that other hazards such as tornadoes in that the hazard tends to occur<br />
over a much larger area, often times affecting from several counties to multiple states.<br />
Type of Damage<br />
Heat kills by taxing the human body beyond its abilities. Normally, the body has ways of<br />
keeping itself cool, by letting heat escape through the skin, and by evaporating sweat<br />
(perspiration). If the body does not cool properly, the victim may suffer a heat-related<br />
illness. Anyone can be susceptible although the very young and very old are at greater risk.<br />
Heat-related illnesses can become serious or even deadly if unattended. Damage to the<br />
body ranges from heat cramps to death.<br />
• Heat Cramps: Heat cramps are muscular pains and spasms due to heavy exertion.<br />
They usually involve the abdominal muscles or the legs. It is generally thought that<br />
the loss of water and salt from heavy sweating causes the cramps.<br />
• Heat Exhaustion: Heat exhaustion is less dangerous than heat stroke. It typically<br />
occurs when people exercise heavily or work in a warm, humid place where body<br />
fluids are lost through heavy sweating. Fluid loss causes blood flow to decrease in<br />
the vital organs, resulting in a form of shock. With heat exhaustion, sweat does not<br />
evaporate as it should, possibly because of high humidity or too many layers of<br />
clothing. As a result, the body is not cooled properly. Signals include cool, moist,<br />
pale, flushed or red skin; heavy sweating; headache; nausea or vomiting; dizziness;<br />
and exhaustion. Body temperature will be near normal.<br />
• Heat Stroke: Also known as sunstroke, heat stroke is life-threatening. The victim's<br />
temperature control system, which produces sweating to cool the body, stops<br />
working. The body temperature can rise so high that brain damage and death may<br />
result if the body is not cooled quickly. Signals include hot, red and dry skin;<br />
changes in consciousness; rapid, weak pulse; and rapid, shallow breathing. Body<br />
temperature can be very high--sometimes as high as 105 o F.<br />
Hazard Event History<br />
St. Louis Metropolitan area experienced a heat wave in July 1980. It was the first real<br />
prolonged period of extreme heat for the metropolitan area since 1966 when 246<br />
individuals were reported as heat deaths. The heat began around the 4th of July. By July<br />
12th, it was apparent that there was a very real crisis in the City of St. Louis. Emergency<br />
Medical Services (EMS) crews were finding dead or very ill persons in many areas of the<br />
city. Most were elderly persons living alone and many had been dead for several days<br />
before being discovered. City officials recommended to Mayor Vincent C. Schoemehl, Jr.,<br />
that a heat emergency be declared. The Governor mobilized the National Guard and sent it<br />
to St. Louis to search door-to-door for victims. The Army Reserve supplied portable air-
A Regional Overview All-Hazard Mitigation Plan 95<br />
conditioning to non-air-conditioned parts of City Hospital. The American Red Cross opened<br />
emergency shelters.<br />
In August, a team of researchers from the U.S. Centers for Disease Control was sent to St.<br />
Louis and Kansas City, Missouri, to find out why, when the July 1980 heat wave affected a<br />
quarter of the country (the southeast), the death rates were excessively high in these two<br />
cities. A case-control study outlined the reasons found and the risk factors for heat illness<br />
and death in two articles published in the Journal of the American Medical Association in<br />
June 1982.<br />
Early in l981, city officials and representatives began meeting to form an organization to<br />
prevent the crisis of 1980 from happening again. Harriet Woods organized the first<br />
community-wide meeting in December l981 after an announced cut in federal energy<br />
assistance funds. This was the beginning of Operation Weather Survival (OWS).<br />
At the same time, the St. Louis City Department of Health and Hospitals put together a<br />
heat illness prevention plan, titled "The Lion in Summer," that included a slide/sound show<br />
and speakers (health educators and EMS personnel) that was marketed to community and<br />
senior citizens' groups throughout the summer of l981 and again in 1982. The guiding<br />
force behind this plan was George E. Wettach, MD, Medical Director for the St. Louis EMS.<br />
Heat and cold illnesses were also made reportable, first by the St. Louis City Health<br />
Commissioner Helen Bruce, MD, and eventually by the Missouri Department of Health.<br />
By 1982, health officials in the City of St. Louis and St. Louis <strong>County</strong> had developed a joint<br />
plan to monitor summer temperatures that would quickly warn citizens of anticipated<br />
periods of excessive heat. This was done through the Wet Bulb Glove Temperature that was<br />
used in St. Louis until 1997 when the protocol was changed at the request of the National<br />
Weather Service (NWS) to reflect the terminology used across the nation by the NWS.<br />
OWS began as a formal contract in 1982 between the City and several social service<br />
agencies to provide necessary assistance during periods of extreme heat or cold. It<br />
eventually became a broad group of public health, government, human service, utilities,<br />
and for-profit companies and agencies that worked together to prevent illness or death<br />
from either extreme heat or cold. In l996, a more formal structure was initiated to assure<br />
the continuation of the organization because of many changes in the community and a<br />
drop in attendance at meetings. OWS is staffed by the United Way and now includes all<br />
the major counties in Missouri and Illinois that are considered part of the Metropolitan St.<br />
Louis area.<br />
St. Louis region experienced additional heat waves in l993, 1988 and in 1995 without<br />
again experiencing death rates close to the total of 113 in 1980. The major challenges of<br />
the ongoing heat illness prevention program are, first, reaching the truly isolated elderly,<br />
high risk person who has no meaningful interaction with anyone, and second, convincing<br />
many seniors that they are at risk and that air-conditioning will save lives.
96<br />
<strong>Jefferson</strong> <strong>County</strong> – Section 2<br />
The major programs of heat illness prevention through NWS, in addition to the monitoring,<br />
warning, education and data collection system of the health departments, are:<br />
• A very successful air-conditioner loan program, funded by Union Electric Company<br />
(now Ameren UE). The window air-conditioners are loaned, installed and<br />
maintained for individuals who apply to the program with a medical "prescription."<br />
At least 50 new air-conditioners are purchased each year.<br />
• A program to weatherize homes for low-income elderly and disabled persons.<br />
• Programs to provide energy assistance for low-income elderly and disabled persons.<br />
• Information and referral for help, including home visits to high-risk individuals and<br />
transportation to services, by a number of agencies.<br />
• Emergency shelter through the St. Louis Homeless Network.<br />
• Monitoring of weather by representatives of the National Weather Service.<br />
• A free telephone reassurance program offered to all high-risk individuals during<br />
declared periods of unusual heat or cold by a for-profit company, called TelAssure.<br />
• A system of neighborhood institutions, primarily senior citizen centers, that offers<br />
air-conditioned relief from the heat for the hottest part of the day.<br />
• A well-informed media in St. Louis that provide invaluable assistance with<br />
dissemination of needed information throughout the community.<br />
Refer to Table J46 for a history of heat wave occurrences.<br />
TABLE J46 TOP TEN CONSECUTIVE DAYS WITH TEMPERATURES 90<br />
DEGREES OR HIGHER IN ST. LOUIS METROPOLITAN AREA<br />
DATES CONSECUTIVE DAYS TEMPERATURE RANGES<br />
June-August, 1980 28+ days 100+<br />
July 2-July 29, 1936 28 days 108<br />
July 20- August 11, 1941 23 days N.A.<br />
July 11- July 31, 1916 21 days N.A.<br />
August 8-August 28, 1936 21 days 108<br />
June 17-July 7, 1954 21 days 110-115<br />
July 15- August 30, 1901 20 days 100+<br />
June 28-July 17, 1921 20 days N.A.<br />
July 8-July 26, 1934 19 days 108-111<br />
July 2- July 20, 1937 19 days N.A.<br />
June 19-July 6, 1901 18 days 106-107<br />
August 3- August 9, 1930 7 days 100+<br />
July 27- August 2, 1953 7 days 100+<br />
July 9- July 14, 1966 6 days 100+<br />
June 27- July 1, 1931 5 days 100<br />
Frequency of Occurrence<br />
Heat waves are sporadic phenomena that occur throughout the United States. Frequency,<br />
intensity, and duration of heat waves, however, vary drastically from year to year. As can<br />
be seen from the Table J46 above, there have been 14 periods of heat waves ranging from<br />
a minimum of five consecutive days to a maximum of 28 days, all over 90 degrees.
A Regional Overview All-Hazard Mitigation Plan 97<br />
Intensity or Strength<br />
Heat waves are sporadic phenomena that occur throughout the United States and<br />
specifically the St. Louis metropolitan area. Frequency, intensity, and duration of heat<br />
waves, however, vary drastically from year to year. The highest temperature documented<br />
during the longest heat wave of 28 days was 108 degrees.<br />
Lives Lost, Injuries, Property Damage, Economic Losses/Other Losses<br />
Compared to other meteorological hazards that pose threats to property and human<br />
health (e.g., floods, hurricanes, and tornadoes), heat waves rank first as the cause of<br />
human mortality. Extremes of heat have a broad and far-reaching set of impacts on the<br />
nation. These include significant loss of life and illness, economic costs in transportation,<br />
TABLE J47 HEAT MORBIDITY IN ST. LOUIS METROPOLITAN REGION<br />
Year St. Louis City St. Louis <strong>County</strong> Outstate MO TOTAL<br />
1989 13 0 5 18<br />
1990 6 2 5 13<br />
1991 4 4 2 10<br />
1992 3 2 0 5<br />
1993 4 1 1 6<br />
1994 9 0 5 14<br />
1995 26 6 18 50<br />
1996 2 1 0 3<br />
1997 5 1 3 9<br />
1998 2 3 4 9<br />
1999 38 5 29 72<br />
2000 4 2 11 17<br />
2001 10 7 17 34<br />
2002 7 5 9 21<br />
Source: Missouri Department of Health and Social Services City of St Louis Department of Health<br />
agriculture, production, energy and infrastructure. In June to September 1980 the nation<br />
saw a devastating heat wave and drought that claimed at least 1,700 lives and had<br />
estimated economic costs $20 billion in 1980 dollars. Table J47 above and J48 below<br />
identifies specific damages to the St. Louis metropolitan area.<br />
TABLE J48 ST. LOUIS METROPOLITAN REGION HEAT WAVES<br />
1994 TO 2002 AND ASSOCIATED DAMAGES<br />
Date Deaths Injuries Property<br />
Damage<br />
Crop<br />
Damage<br />
06/12/1994 4 55 0 50K<br />
07/17/1995 20 225 75K 0.4M<br />
07/28/1995 0 120 15K 25K
98<br />
<strong>Jefferson</strong> <strong>County</strong> – Section 2<br />
TABLE J48 ST. LOUIS METROPOLITAN REGION HEAT WAVES<br />
1994 TO 2002 AND ASSOCIATED DAMAGES<br />
Date Deaths Injuries Property<br />
Damage<br />
Crop<br />
Damage<br />
08/01/1995 9 230 0 400K<br />
05/17/1996 0 25 0 0<br />
06/18/1996 0 0 0 0<br />
06/22/1996 1 0 0 0<br />
06/30/1996 1 0 0 0<br />
07/07/1996 0 8 0 0<br />
07/18/1996 0 11 0 0<br />
06/25/1997 1 0 0 0<br />
07/12/1997 0 14 0 0<br />
07/20/1997 1 0 0 0<br />
08/17/1997 1 0 0 0<br />
06/23/1998 3 143 0 0<br />
07/18/1998 0 137 0 0<br />
08/23/1998 0 10 0 0<br />
09/04/1998 0 13 0 0<br />
07/18/1999 42 397 0 0<br />
07/02/2000 4 103 0 0<br />
08/28/2000 1 125 0 0<br />
09/01/2000 1 38 0 0<br />
06/18/2001 1 0 0 0<br />
07/07/2001 5 61 0 0<br />
07/17/2001 0 19 0 0<br />
07/21/2001 3 71 0 0<br />
07/29/2001 0 4 0 0<br />
08/01/2001 0 34 0 0<br />
08/07/2001 1 10 0 0<br />
08/12/2001 3 0 0 0<br />
08/21/2001 0 14 0 0<br />
05/31/2002 2 0 0 0<br />
06/01/2002 0 14 0 0<br />
06/25/2002 1 0 0 0<br />
07/08/2002 1 26 0 0<br />
07/17/2002 1 0 0 0<br />
07/20/2002 0 47 0 0<br />
07/26/2002 0 185 0 0<br />
08/01/2002 1 59 0 0<br />
08/26/2002 1 0 0 0<br />
07/03/2003 3 93 0 0<br />
08/15/2003 2 54 0 0<br />
08/24/2003 0 0 0 0<br />
Totals 116 2366 5.09M 875K<br />
Source: NCDC<br />
There are several impacts on transportation documented in case studies. Aircraft lose lift at<br />
high temperatures. Phoenix airport has been closed due to periods of extreme heat that<br />
made aircraft operations unsafe. Highways and roads are damaged by excessive heat.
A Regional Overview All-Hazard Mitigation Plan 99<br />
Asphalt roads soften. Concrete roads have been known to "explode" lifting –three to four<br />
foot pieces of concrete. During the 1980 heat wave hundreds of miles of highways buckled<br />
(NOAA, 1980). Stress is placed on automobile cooling systems, diesel trucks and railroad<br />
locomotives. This leads to an increase in mechanical failures. Train rails develop sun kinks<br />
and distort. Refrigerated goods experience a significant greater rate of spoilage due to<br />
extreme heat.<br />
Various sectors of the agriculture community are affected by extreme heat. Livestock, such<br />
as rabbits and poultry, are severely impacted by heat waves. Millions of birds have been<br />
lost during heat waves. Milk production and cattle reproduction also decreases during heat<br />
waves. Pigs are also adversely impacted by extreme heat. In terms of crop impacts in the<br />
summer of 1980, it is unclear what the impacts are of very high temperatures for a few<br />
days, versus the above average summer temperatures or the drought. We do know that<br />
high temperatures at the wrong time inhibit crop yields. Wheat, rice, corn, potato, and<br />
soybean crop yields can all be significantly reduced by extreme high temperatures at key<br />
development stages.<br />
The electric transmission system is impacted when power lines sag in high temperatures. In<br />
2002 a major west coast power outage impacting 4 states was blamed in part on extreme<br />
high temperatures causing sagging transmission lines to short out. The combination of<br />
extreme heat and the added demand for electricity to run air conditioning causes<br />
transmission line temperatures to rise.<br />
The demand for electric power during heat waves is well documented. In 1980, consumers<br />
paid $1.3 billion more for electric power during the summer than the previous year. The<br />
demand for electricity, 5.5% above normal, outstripped the supply, causing electric<br />
companies to have rolling black outs.<br />
The demand for water increases during periods of hot weather. In extreme heat waves,<br />
water is used to cool bridges and other metal structures susceptible to heat failure. This<br />
causes a reduced water supply and pressure in many areas. This can significantly contribute<br />
to fire suppression problems for both urban and rural fire departments.<br />
The rise in water temperature during heat waves contributes to the degradation of water<br />
quality and negatively impacts fish populations. It can also lead to the death of many other<br />
organisms in the water ecosystem. High temperatures are also linked to rampant algae<br />
growth, causing fish kills in rivers and lakes.<br />
Locations/Areas Affected<br />
Impacts from heat waves are widespread, not selective. Impacts and areas where there are<br />
impacts are dependent upon the weather systems, which affect wide expanses of land.
100<br />
Seasonal Pattern<br />
<strong>Jefferson</strong> <strong>County</strong> – Section 2<br />
Heat waves typically occur during the warm summer months including June, July and<br />
August as seen on Table J48 above.<br />
Speed of Onset and/or Existing Warning Systems<br />
Heat wave weather in the St. Louis region slowly descends into the area. Heat wave<br />
weather is different that other hazards such as tornadoes in that the hazard tends to occur<br />
over a much larger area, often times affecting from several counties to multiple states.<br />
The NWS will initiate alert procedures when the Heat Index is expected to exceed 105<br />
degrees F to 110 degrees F (depending on the local climate) for at least two consecutive<br />
days. The expected severity of the heat determines whether advisories or warnings are<br />
issued. A common guideline for the issuance of excessive heat alerts is when the maximum<br />
daytime HI is expected to equal or exceed 105°F and a nighttime minimum HI of 80°F or<br />
above for two or more consecutive days. Some regions and municipalities are more<br />
sensitive to excessive heat than others. As a result, alert thresholds may vary substantially<br />
from these guidelines. Excessive heat-alert thresholds are being tailored at major<br />
metropolitan centers based on research results that link unusual amounts of heat-related<br />
deaths to city-specific meteorological conditions.<br />
The alert procedures are:<br />
• Include HI values in zone and city forecasts.<br />
• Issue Special Weather Statements and/or Public Information Statements presenting<br />
a detailed discussion of (1) the extent of the hazard including HI values, (2) those<br />
individuals most at risk, (3) safety rules for reducing the risk.<br />
• Assist state and local health officials in preparing Civil Emergency Messages in severe<br />
heat waves. Meteorological information from Special Weather Statements will be<br />
included as well as more detailed medical information, advice, and names and<br />
telephone numbers of health officials.<br />
• Release to the media and over NOAA's own Weather Radio all of the above<br />
information.<br />
Operation Weather Survival was created in l981 to address the needs of the community<br />
during extreme weather conditions. It is comprised of public and private organizations<br />
working together to prevent illness or death from extreme heat, cold conditions and<br />
ground level ozone. The phone number is 1-800-427-4626<br />
OWS Summer Outreach Programs that work to prevent HEAT-related illness through OWS<br />
are:<br />
• Health Departments: Preventive education, temperature monitoring, alerts,<br />
warnings, and data collection
A Regional Overview All-Hazard Mitigation Plan 101<br />
• OWS Air-Conditioner Program: Provides air conditioners to individuals who are<br />
medically at risk. Air conditioners are purchased with funds primarily donated by<br />
AmerenUE.<br />
• Cooling Sites: Cooling sites are open year-round. During severe heat, hours and<br />
services are extended.<br />
• TelAssure Telephone Reassurance Services: Complimentary service at-risk individuals<br />
during weather emergency Agency referrals needed. TelAssure Telephone<br />
Reassurance Services Utility Assistance: Assistance is provided through OWN<br />
member agencies to prevent electrical disconnection for individuals and families atrisk.<br />
Map of Hazards<br />
Figure J45 (located in the back of the Technical Appendix) depicts the potential heat wave<br />
areas in the county. In addition, Figure J50 below depicts the Heat Wave Hazard Impact<br />
areas in the St. Louis Metropolitan area during the heat wave from 1980.<br />
Statement of Probable Future Severity<br />
FIGURE J50 1980 MIDWEST HEAT WAVE<br />
Source: National Climatic Data Center<br />
Heat waves are sporadic phenomena that occur throughout the United States. Frequency,<br />
intensity, and duration of heat waves, however, vary drastically from year to year.<br />
The levels of severity, by Heat Index apparent temperature are found below.<br />
• Extreme Danger (heat stroke or sunstroke highly likely at 130 degrees F or<br />
higher).<br />
• Danger (sunstroke, muscle cramps, and/or heat exhaustion likely at 105 degrees F<br />
to 129 degrees F).<br />
• Extreme Caution (sunstroke, muscle cramps, and/or heat exhaustion possible at<br />
90 degrees F to 104 degrees F)<br />
• Caution (fatigue possible at less than 90 degrees F).
102<br />
<strong>Jefferson</strong> <strong>County</strong> – Section 2<br />
The future probably severity for <strong>Jefferson</strong> <strong>County</strong> is shown below according to the Heat<br />
Index levels of severity.<br />
Heat Index Probable Severity<br />
Heat Index of 130°F or higher Catastrophic<br />
Heat Index of 105°F to 129°F Critical<br />
Heat Index of 90°F to 104°F Limited<br />
Heat Index of less than 90°F Negligible<br />
Statement of Probable Risk/Likeliness of Future Occurrence<br />
Heat waves are sporadic phenomena that occur throughout the United States. Frequency,<br />
intensity, and duration of heat waves, however, vary drastically from year to year.<br />
Based in information from the National Oceanic and Atmospheric Administration and<br />
FEMA there have been at least fifteen heat wave related events from 1901 to 1980 and 43<br />
periods of heat wave related events from 1994 to 2003. In the St. Louis metropolitan area,<br />
days with temperatures of 90 degrees or greater generally occur from June through August<br />
based on Table J48 above. The future probable risk for <strong>Jefferson</strong> <strong>County</strong> is shown below<br />
according to the Heat Index levels of severity.<br />
Heat Index Probable Risk<br />
Heat Index of 130°F or higher Unlikely<br />
Heat Index of 105°F to 129°F Possible<br />
Heat Index of 90°F to 104°F Likely<br />
Heat Index of less than 90°F Highly Likely<br />
Statement of Next Disaster’s Likely Adverse Impact on Community<br />
The next heat wave will possibly have a detrimental impact on the community in terms of<br />
agricultural, economic (social) and environmental based upon the past historic heat wave<br />
occurrences. The adverse impacts of future heat waves affecting <strong>Jefferson</strong> <strong>County</strong> is shown<br />
below.<br />
Without Mitigation Measures<br />
Life Catastrophic<br />
Property Limited<br />
Emotional Catastrophic<br />
Financial Limited<br />
Comments Based on worst case scenario<br />
With Mitigation Measures<br />
Life Limited<br />
Property Negligible<br />
Emotional Limited
A Regional Overview All-Hazard Mitigation Plan 103<br />
Financial Negligible<br />
Comments <strong>Jefferson</strong> <strong>County</strong> has been proactive in protecting those<br />
At-risk residents by organizing OWS.<br />
Recommendation<br />
Educate those people who work outdoors of the dangers of extended exposure to a<br />
combination of high temperatures and high humidities. The people to be educated are<br />
those at risk including:<br />
• "Homeless" living outside<br />
• Poor, elderly, chronically ill persons living alone<br />
• Individuals working outside in extreme heat<br />
Dam Failure Hazard Profile<br />
The purpose of a dam is to impound (store) water, wastewater or liquid borne materials for<br />
any of several reasons, including flood control, human water supply, irrigation, livestock<br />
water supply, energy generation, containment of mine tailings, and recreation or pollution<br />
control. Many dams fulfill a combination of the above functions.<br />
Manmade dams may be classified according to the type of construction material used, the<br />
methods used in construction, the slope or cross-section of the dam, the way the dam<br />
resists the forces of the water pressure behind it, the means used for controlling seepage<br />
and, occasionally, according to the purpose of the dam.<br />
The materials used for construction of dams include earth, rock, tailings from mining or<br />
milling, concrete, masonry, steel, timber, miscellaneous materials (such as plastic or rubber)<br />
and any combination of these materials. Dams are owned and operated by individuals,<br />
private and public organizations and the government. Associated works include spillways,<br />
water supply facilities, and lake drain structures. Most dams have an earth embankment<br />
and one or two spillways.<br />
Embankment dams are the most common type of dam in use today in Missouri (99% of all<br />
dams in Missouri are made of earthen materials, the 1% are constructed of concrete).<br />
Materials used for embankment dams include natural soil or rock, or waste materials<br />
obtained from mining or milling operations. An embankment dam is termed an “earthfill”<br />
or “rockfill” dam depending on whether it is comprised of compacted earth or mostly<br />
compacted or dumped rock. The ability of an embankment dam to resist the reservoir<br />
water pressure is primarily a result of the mass weight, type and strength of the materials<br />
from which the dam is made.
104<br />
<strong>Jefferson</strong> <strong>County</strong> – Section 2<br />
Concrete dams may be categorized into gravity and arch dams according to the designs<br />
used to resist the stress due to reservoir water pressure. Typical concrete gravity dams are<br />
the most common form of concrete dam. Because the purpose of a dam is to retain water<br />
effectively and safely, the water retention ability of a dam is of prime importance. Water<br />
may pass from the reservoir to the downstream side of a dam by:<br />
• Passing through the main spillway or outlet works<br />
• Passing over an auxiliary spillway<br />
• Overtopping the dam<br />
• Seepage through the abutments<br />
• Seepage under the dam<br />
Overtopping of an embankment dam is very undesirable because the embankment<br />
materials may be eroded away. Additionally, only a small number of concrete dams have<br />
been designed to be overtopped. Water normally passes through the main spillway or<br />
outlet works; it should pass over an auxiliary spillway only during periods of high reservoir<br />
levels and high water inflow. All embankment and most concrete dams have some<br />
seepage. However, it is important to control the seepage to prevent internal erosion and<br />
instability. Proper dam construction, and maintenance and monitoring of seepage provide<br />
this control.<br />
Description<br />
Thousands of people have been injured, many killed and billions of dollars of property<br />
damaged by dam failures in the United States, including the catastrophic dam failure<br />
upstream from Johnstown, Pennsylvania that killed 2,209 people in May 31, 1889 as a<br />
result of a poor and inappropriate maintenance of a poorly constructed dam. The problem<br />
of unsafe dams in Missouri was underscored by dam failures at Lawrenceton in 1968 (just<br />
south of <strong>Jefferson</strong> <strong>County</strong>), Washington <strong>County</strong> in 1975 and a near failure in Franklin<br />
<strong>County</strong> in 1978.<br />
Safety is of paramount importance to the effectiveness of a dam. Dam failures can be<br />
devastating for the dam owners, to the dam’s intended purpose and, especially, for<br />
downstream populations and property. Property damage can range in the thousands to<br />
billions of dollars. No price can be put on the lives that have been lost and could be lost in<br />
the future due to dam failure. Failures know no state boundaries—inundation from a dam<br />
failure could affect several states and large populations.<br />
Driving every other issue and all activities within the dam safety community is the risk of<br />
dam failure. Although the majority of dams in the U.S. have responsible owners and are<br />
properly maintained, still many dams fail every year. In the past several years, there have<br />
been hundreds of documented failures across the nation (this includes 250 after the<br />
Georgia Flood of 1994). A life was recently lost in New Hampshire as a result of a dam<br />
failure. Dam and downstream repair costs resulting from failures in 23 states reporting in<br />
one recent year totaled $54.3 million.
A Regional Overview All-Hazard Mitigation Plan 105<br />
Early in this century, as many dams failed due to lack of proper engineering and<br />
maintenance, it was recognized that some form of regulation was needed. One of the<br />
earliest state programs was enacted in California in the 1920s. Federal agencies, such as<br />
the Corps of Engineers and the Department of Interior, Bureau of Reclamation built many<br />
dams during the early part of the twentieth century and established safety standards<br />
during this time. Slowly, other states began regulatory programs. But it was not until the<br />
string of significant dam failures in the 1970s that awareness was raised to a new level<br />
among the states and the federal government.<br />
In Missouri, the first state legislation aimed at regulating dams was passed in 1889 and<br />
was called the Dam Mills and Electric Power Law. The law was concerned only with<br />
damaged caused by construction and lake formation. It did not address the engineering<br />
aspects of design or downstream safety of dams.<br />
In 1972, Congress passed the National Dam Safety Act (P.L. 92-367) that called for an<br />
inventory of dams in the U.S. and one time inspection of dams that would result in loss of<br />
life from a failure. In 1986, Congress enacted the Water Resources Development Act (P.L.<br />
99-662). Title XII-Dam Safety authorized the U.S. Army Corps of Engineers (USACE) to<br />
maintain and periodically update the inventory of dams. In 1988 funds were appropriated<br />
for this effort. FEMA and USACE developed a Memorandum of Agreement where FEMA<br />
assumed responsibility for maintaining and updating the inventory using the funds<br />
authorized. The Water Resources Development Act of 1996 (P.L. 104-303) Section 215 reauthorized<br />
periodic update of the National Inventory of Dams (NID) by USACE and<br />
continued a funding mechanism. For the 1998 update, the USACE resumed the lead<br />
responsibility and worked with FEMA and other agencies. There are about 77,000 dams in<br />
the inventory.<br />
Federal law and the Association of Dam Safety Officials (ASDSO) Model State Dam Safety<br />
program define a dam as “any artificial barrier, including appurtenant works, which<br />
impounds or diverts water and which 1.) is 25 feet or more in height from the natural bed<br />
of the stream or watercourse measured at the downstream toe of the barrier, or from the<br />
lowest elevation of the outside limit of the barrier, if it is not across a stream channel or<br />
watercourse to the maximum water storage elevation; or 2.) has an impounding capacity<br />
at the maximum water storage elevation of fifty acre-feet or more.<br />
This Act does not apply to any such barrier which is not in excess of six feet in height,<br />
regardless of storage capacity, or which has a storage capacity at a maximum water<br />
storage elevation not in excess of fifteen acre-feet, regardless of height (P.L. 92-367; Dam<br />
Safety Act of 1972) unless such barrier, due to its location or other physical characteristic,<br />
is likely to pose a significant threat to human life or property in the event of its failure.”<br />
(P.L. 99-662, Water Resources Development Act of 1986).<br />
Criteria for dams in the NID are as follows:<br />
1). All high hazard potential classification dams
106<br />
2). All significant hazard potential classification dams<br />
3) Low hazard or undetermined potential classification dams which<br />
<strong>Jefferson</strong> <strong>County</strong> – Section 2<br />
Equal or exceed 25 feet in height and which exceed 15 acre-feet in storage<br />
Equal or exceed 50 acre-feet storage and exceed 6 feet in height.<br />
The NID has definitions for downstream hazard potential. These definitions are different<br />
from the Missouri Department of Natural Resources, Geological Survey and Resource<br />
Assessment, Dam and Reservoir Safety Program. The NID definitions, as accepted by the<br />
Interagency Committee on Dam Safety are as follows:<br />
1. Low Hazard Potential<br />
Dams assigned the low hazard potential classification are those where<br />
failure or disoperation results in no probable loss of human life and low<br />
economic and/or environmental losses. Losses are principally limited to<br />
the owner’s property.<br />
2. Significant Hazard Potential<br />
Dams assigned the significant hazard potential classification are those<br />
dams where failure or disoperation results in no probable loss of<br />
human life but can cause economic loss, environmental change,<br />
disruption of lifeline facilities, or impact other concerns. Significant<br />
hazard potential classification dams are often located in<br />
predominantly rural or agricultural areas but could be located in areas<br />
with population and significant infrastructure.<br />
3. High Hazard Potential<br />
Dams assigned the high hazard potential classification are those<br />
where failure or disoperation will probably cause loss of human life.<br />
In September 1979, ninety years after the first state legislation was passed, the Missouri<br />
House Bill 603 (called the Dam Safety Law) was passed by the Missouri Legislature and<br />
became effective in September 1979, as a result of the USACE inspection program that<br />
Missouri led the country in total number of unsafe dams. House Bill 603 (now contained<br />
in Sections 236.400 through 236.500 of the revised statues of Missouri) excluded certain<br />
dams from regulation-those less than 35 feet high, and allowed exemptions for others<br />
used for agricultural purposes and those regulated by other state or federal agencies. The<br />
law requires that a construction permit application be made to construct new dams or<br />
modify, remove or alter existing dams. Owners of existing dams 35 feet or more in height<br />
must obtain a registration permit and owners of new dams 35 feet or more in height must
A Regional Overview All-Hazard Mitigation Plan 107<br />
obtain a safety permit after construction to operate the structures. All regulated dams<br />
must be inspected periodically to assure that their continued operation does not constitute<br />
a hazard to public safety, life and property. The construction of dams in Missouri has<br />
always been an important part of the state’s economy primarily from the standpoint of the<br />
recreational areas they create. The Missouri Department of Natural Resources, Geological<br />
Survey and Resource Assessment, Dam and Reservoir Safety Program who inspect the dams<br />
are critical to the safety of Missouri citizens. The Dam and Reservoir Safety Program<br />
operates under the general guidance of the Dam and Reservoir Safety <strong>Council</strong>. The <strong>Council</strong><br />
is responsible for the development of the rules and regulations and the determination of<br />
enforcement procedures to make the law operative. All seven council members are<br />
appointed by the Governor.<br />
The Missouri Dam and Reservoir Safety Program is responsible for ensuring that all new<br />
and existing non-agricultural, non-federal dams 35 feet or more in height meet minimum<br />
safety standards. The program reviews engineering plans and specifications; conducts<br />
hydrologic, hydraulic and structural analysis of dams; monitors construction of new dams<br />
and modification of existing dams; performs safety inspections of existing dams; responds<br />
to dam safety emergencies so that public safety, life and property are protected. Basic<br />
functions of the program include inspections, permit issuance (construction, registration<br />
and safety permits), compliance and review, data management (around 4000 dams in<br />
Missouri, of which only about 600 are regulated under Missouri law), inundation mapping<br />
(provided to recorder of deeds for each county showing areas impacted by dam failure).<br />
Dam owners are solely responsible for the safety and the liability of the dam and for<br />
financing its upkeep, upgrade and repair. While most infrastructure facilities (roads,<br />
bridges, sewer systems, etc.) are owned by public entities, the majority of dams in the<br />
United States are privately owned. Many different types of people and entities own and<br />
operate dams. About 58 percent are privately owned. Local governments own and<br />
operate the next largest number of dams, about 16 percent. State ownership is next with<br />
about four percent; the federal government, public utilities and undetermined interests<br />
each own smaller numbers of dams (5%).<br />
Contact:<br />
James L. Alexander<br />
Chief Engineer<br />
MO Department of Natural Resources<br />
Dam and Reservoir Safety Program<br />
PO Box 250<br />
Rolla, MO 65402-0250<br />
Phone: 573/368-2175<br />
Fax: 573/368-2111<br />
Email: nralexj@dnr.state.mo.us<br />
Web: http://www.dnr.state.mo.us/geology/damsft/damsfthp.htm
108<br />
2003 Statistics:<br />
Number of Missouri state-regulated dams: 638<br />
Number of Missouri dams in National Inventory of Dams: 4,096<br />
Characteristics<br />
<strong>Jefferson</strong> <strong>County</strong> – Section 2<br />
The characteristics of a dam failure, based on the International Commission of Large Dams<br />
(ICOLD) include following the three major categories of dam failure: (1) overtopping by<br />
flood; (2) foundation defects; and (3) piping. For earthen dams, the major reason for<br />
failure is piping or seepage. For concrete dams, the major reasons for failure are associated<br />
with foundations. Overtopping has been a significant cause of dam failure primarily in<br />
cases where there was an inadequate spillway. Dam failures are most likely to happen for<br />
one of five reasons:<br />
• Overtopping caused by water spilling over the top of a dam<br />
• Structural failure of materials used in dam construction<br />
• Cracking caused by movements like the natural settling of a dam<br />
• Inadequate maintenance and upkeep<br />
• Piping—when seepage through a dam is not properly filtered and soil particles<br />
continue to progress and form sink holes in the dam<br />
Likely Locations<br />
The National Inventory of Dams, the State of Missouri, and FEMA have summarized the<br />
status of dams in Missouri by hazard classification. Refer to Figure JF51 (located in the<br />
back of the Technical Appendix) that shows the location of the high hazard dams in<br />
<strong>Jefferson</strong> <strong>County</strong>, based on MDNR’s inventory. High hazard is defined as dams that are<br />
more than 30 years old, have a high ratio of maximum storage to dam height and/or high<br />
population density downstream. Table J49 identifies the national and state inventory of<br />
dams. Table J50 lists <strong>Jefferson</strong> <strong>County</strong> high hazard dams.<br />
TABLE J49 SUMMARY STATUS OF MISSOURI DAMS BY HAZARD<br />
CLASSIFICATION<br />
NATIONAL INVENTORY STATE REGULATED<br />
Hazard Classification Hazard Classification<br />
Total High Significant Low Total High Significant Low<br />
4095 607 912 2576 630 440 127 63<br />
Source: Missouri Department of Natural Resources
A Regional Overview All-Hazard Mitigation Plan 109<br />
TABLE J50 JEFFERSON COUNTY HIGH HAZARD DAMS<br />
DAM NAME RECEIVING RIVER BUILT LENGTH<br />
DAM<br />
HEIGHT VOLUME<br />
STATE<br />
REGULATED<br />
Fondulac Dam Tr- Saline Creek 1954 0 28 296 N<br />
Glen Rose Lake Dam Tr to Rock Creek 1962 0 30 46 N<br />
Steeger Lake Dam Trib-Sugar Creek 1976 0 33 58 N<br />
Lake Kearney Dam Tr to Sugar Creek<br />
Tributary to Belew<br />
1800 0 25 16 N<br />
Lake Tishomingo Dam Creek<br />
Lake Wauwanoka<br />
1950 870 68 2376 Y<br />
Dam Dry Creek 1942 1045 50 2370 Y<br />
Lake Montowese Dam Tr Big River 1942 1000 54 606 Y<br />
Lembeck Lake Dam Whitehead Creek 1958 0 26 117 N<br />
Upper Valle Mines<br />
Dam Tr To Joachim Creek 1958 0 34 142 N<br />
Williams Dam Tr-Joachim Creek 1965 0 26 93 N<br />
Lake Briarwood Dam Ball Branch 1970 1400 57 1398 Y<br />
Spring Lake Dam<br />
Hickory Hills Golf Club<br />
Tr Ball Branch 1970 0 20 33 N<br />
Dam Tr Joachim Creek<br />
<strong>West</strong> Fork Plattin<br />
1965 0 25 19 N<br />
Laguna Palma Dam Creek 1947 530 26 98 N<br />
Kinnippi Lake Dam Tr to Dry Creek<br />
Tributary to Butcher<br />
1960 0 27 64 N<br />
Anderson Lake Dam Branch. 1958 0 26 57 N<br />
Lake Adelle Dam<br />
Conservation Club<br />
Tr-Skullbones Creek 1950 0 29 73 N<br />
Lake Dam Tr. to Mississippi River 1951 0 30 135 N<br />
River Cement Tributary to<br />
Company Dam Mississippi Riv. 1965 605 57 300 Y<br />
Dehner Lake Dam Tr to Sandy Creek 1958 0 29 27 N<br />
Hideout Lake Dam Tr to Sandy Creek 1945 0 33 69 N<br />
Lake Virginia Dam Tr Joachim Creek 1954 0 25 176 N<br />
Leonard,Glen Dam Tr-Heads Creek 1956 0 29 75 N<br />
Lake Ararat Dam Heads Creek<br />
Tributary of Sandy<br />
1960 0 34 248 N<br />
Lake Lorraine Dam Creek 1957 1100 46 400 Y<br />
Lake Bono Del Dam Tr to Belew Creek<br />
Tributary to Belew<br />
1954 0 27 35 N<br />
Becker Lake Dam<br />
Sweetwater Dam -<br />
Creek 1965 0 28 80 N<br />
Noname 251 Tr-Dulin Creek 1960 0 29 74 N<br />
Clear Lake Dam<br />
Lower Valle Mines<br />
Tr to Joachim Creek 1961 0 34 144 N<br />
Dam Tr to Joachim Creek 1952 0 22 54 N<br />
Liguori Lake Dam - Tributary to Glaize<br />
Nonane 255 Creek 1950 0 25 28 N<br />
Autumn Lake Dam Tributary to Rock 1962 0 32 81 N
110<br />
TABLE J50 JEFFERSON COUNTY HIGH HAZARD DAMS<br />
DAM NAME RECEIVING RIVER BUILT LENGTH<br />
<strong>Jefferson</strong> <strong>County</strong> – Section 2<br />
DAM<br />
HEIGHT VOLUME<br />
STATE<br />
REGULATED<br />
Creek<br />
Pine Lake Dam Tr-Rock Creek 1961 0 33 77 N<br />
Weber Hill Terrace<br />
Lake Dam Tr-Bear Creek 1957 519 36 117 Y<br />
Land Of Lakes Dam Tr-Bear Creek 1946 0 30 26 N<br />
Tamarack Dam Tr-Sand Creek 1964 0 29 141 N<br />
Little Lake Dam Tr to Joachim Creek 1961 0 32 24 N<br />
Sunrise Big Lake Dam Tr to Joachim Creek 1961 480 38 97 Y<br />
Summer Set Lake Dam Falling Rock Branch<br />
Deerwood Lake No.3<br />
1974 1200 59 1336 Y<br />
Dam<br />
Bequette Dam -<br />
Trib-Isom Creek 1960 0 25 30 N<br />
Noname 262 Tr-Isum Creek<br />
Tributary to La Barque<br />
1967 0 31 31 N<br />
Glenwilfern Lake Dam Creek 1953 540 38 93 Y<br />
Cedar Hill Lake No. 3 Tributary to<br />
Dam<br />
Skullbones Creek 1949 0 28 60 N<br />
Fisherman's Lake Dam Tr Ball Branch 1970 0 34 167 N<br />
Dresser No. 10 Dam Tr Big River 1974 765 100 1118 Y<br />
Atwood Lake Dam<br />
Sunrise Lake Upper<br />
Tr to Sandy Creek 1969 0 27 43 N<br />
Dam<br />
Winter Haven Lake<br />
Tr to Joachim Creek 1961 360 37 175 Y<br />
Dam Falling Rock Branch 1978 730 49 224 Y<br />
Spring Lake Dam Tr-Falling Rock Branch 1976 600 42 133 Y<br />
Siesta Lake Dam Tr to Fritz Creek 1957 0 30 58 N<br />
Gwenmil Lake Dam Tr to Isum Creek 1957 0 29 23 N<br />
Francois Lake Dam Tr to Mississippi River 1979 470 38 19 Y<br />
Highway 21 Lake Dam Trib-Heads Creek 1940 0 28 47 N<br />
Dresser No. 11 Tr to Big River 1975 500 90 50 Y<br />
Silver Lake Dam Ditch Creek 1981 1600 80 0 Y<br />
Raintree Dam #2 Belew Creek Tributary 1989 1000 55 988 Y<br />
Stonehenge #1 Dam Trib to Sugar Creek 1990 360 41 13 Y<br />
Brian Haskins Lake<br />
Dam 1990 0 22 0 N<br />
Ralph McNail Lake<br />
Dam 1988 0 24 0 N<br />
Source: Missouri Department of Natural Resources<br />
Type of Damage<br />
When dams fail, the results can be catastrophic. Dams are innately hazardous structures.<br />
Failure or disoperation can result in the release of the reservoir contents--this includes<br />
water, mine wastes or agricultural refuse--causing negative impacts upstream or<br />
downstream or at locations remote from the dam. Negative impacts of primary concern
A Regional Overview All-Hazard Mitigation Plan 111<br />
are loss of human life, economic loss including property damage, lifeline disruption and<br />
environmental damage.<br />
While the definition varies from place to place, it generally means if failure of a high-hazard<br />
dam occurs, there probably will be loss of life. I t must be emphasized that this<br />
determination does not mean that these dams are in need of repair--these dams could be<br />
in excellent condition or they could be in poor condition. "High-hazard" just reflects the<br />
dam's potential for doing damage downstream should it fail.<br />
High-hazard potential dams exist in every state and affect the lives of thousands<br />
downstream. The current issue and debate is over the increasing number of these highhazard<br />
structures--not because more high-hazard dams are being built, but that more<br />
development is occurring downstream. Dam and reservoir safety regulators generally have<br />
no control over local zoning issues or developers' property rights. So this issue continues to<br />
worry regulators as the trend persists.<br />
Some dams are considered to have a greater hazard potential than others. There are<br />
approximately 10,000 state-regulated "high-hazard" potential dams in the U.S. "Highhazard"<br />
is a term used by a majority of state dam safety programs and federal agencies as<br />
part of a three-pronged classification system used to determine how hazardous a dam's<br />
failure might be to the downstream area. Historically, dams that failed had some<br />
deficiency, as characterized above, which caused the failure. These dams are typically<br />
termed "unsafe." Currently, there are about 2,000 "unsafe" dams in the U.S. There are<br />
unsafe dams in almost every state. (A majority of states and federal agencies define an<br />
"unsafe" dam as one that has been found to have deficiencies that leave it more susceptible<br />
to failure.)<br />
Hazard Event History<br />
Thousands of people have been injured, many killed, and billions of dollars of property<br />
damaged by dam failures in the United States. Dam failures at Lawrenceton in 1968,<br />
Washington <strong>County</strong> in 1975, Fredericktown in 1977, and a near failure in Franklin <strong>County</strong><br />
underscored the problem of unsafe dams in Missouri in 1978.<br />
Frequency of Occurrence<br />
Table F51 below summarized the frequency of dam failures in Missouri. Four dams failed<br />
in ten years.<br />
TABLE J51 RECENT DAM FAILURES IN MISSOURI<br />
Community Date<br />
Lawrenceton 1968<br />
Washington <strong>County</strong> 1975<br />
Frederickton 1977<br />
Franklin <strong>County</strong> (near failure) 1978
112<br />
Intensity or Strength<br />
<strong>Jefferson</strong> <strong>County</strong> – Section 2<br />
The intensity or strength of resultant damages from dam failures is dependent upon the<br />
amount of water stored behind the dam as well as the weather. A large rain event can<br />
exacerbate an already critical emergency situation. Damage from dam failures can be<br />
catastrophic.<br />
Lives Lost, Injuries, Property Damage, Economic Losses/Other Losses<br />
The cost of a dam failure is difficult to assess because flooding can affect large areas. Local<br />
communities may be directly impacted due to building damage, injuries fatalities, lost<br />
water supply, damaged transportation and infrastructure and lost recreational assets. The<br />
extent of an owner’s liability will vary from state to state depending on the statutes and<br />
case law precedents. The concept of strict liability imposes liability on a dam owner for<br />
damages that occur regardless of the cause of failure. The alternative theory of negligence<br />
considers the degree of care employed by the owner in constructing, operating and<br />
maintaining a dam. Historically, courts have sought to compensate those injured by a dam<br />
failure. When assessing liability, the standard of care exercised by an owner will be closely<br />
examined and should be in proportion to the downstream hazards involved. Where the<br />
risk is great, owners must be cautious. In many cases, dams regulated by the federal<br />
government or a state dam safety program must be designed to withstand an<br />
unprecedented flood or earthquake. Thousands of people have been injured, many killed,<br />
and billions of dollars of property damaged by dam failures in the United States.<br />
1972-Buffalo Creek Dam, <strong>West</strong> Virginia-125 dead, $400 million in damages.<br />
1976-Teton Dam, Idaho-14 dead, over $1 billion in damages<br />
1977-Laurel Run Dam, Pennsylvania-40 dead, $5.3 million in damages<br />
1977-Kelly Barnes Dam, Georgia-39 dead, $30 million in damages<br />
1982-Lawn Lake Dam, Colorado-3 dead, $25 million in damages<br />
1988-Quail Creek Dam, Utah-$12 million in damages<br />
The failures of Teton Dam and the Kelly Barnes Dam focused national attention to the<br />
problem of unsafe dams. Dam failures, however, continue to occur with destructive and<br />
sometimes fatal results.<br />
Locations/Areas Affected<br />
Locations affected by dam failure will be low-lying areas that are below dams, near a creek,<br />
stream or river valley. Residents, businesses and infrastructure in the path of the dam<br />
waters can become quickly inundated and destroyed. Refer to Figure J51, located in the<br />
back of the Technical Appendix, for downstream areas that could be potentially affected.
A Regional Overview All-Hazard Mitigation Plan 113<br />
Seasonal Pattern<br />
There is no seasonal pattern to dam failure. However, various climatic conditions and other<br />
situations may result in dam failure including such elements of risk as natural phenomena<br />
such as floods and landslides during wet weather seasons. These hazards threaten dam<br />
structures and their surroundings. Floods that exceed the capacity of a dam's spillway and<br />
then erode the dam or abutments are particularly hazardous, as is seismic activity that may<br />
cause cracking or seepage. Similarly, debris from landslides may block a dam's spillway and<br />
cause an overflow wave that erodes the abutments and ultimately weakens the structure.<br />
Speed of Onset And/Or Existing Warning Systems<br />
A few large Missouri dams have monitoring systems, emergency action plans and warning<br />
systems. However, most dams in Missouri do not.<br />
Map of Hazards<br />
Refer to Figure J51in the back of the Technical Appendix that depicts the regulated dams in<br />
the EWG planning region.<br />
Statement of Probable Future Severity<br />
Missouri Geological Survey and Resource Assessment Division has defined three levels of<br />
hazard potential: high, significant and low hazard, as accepted by the Interagency<br />
Committee on Dam Safety.<br />
High: Failure or disoperation will probably cause loss of human life<br />
Significant: Failure or disoperation results in no probable loss of human life, but can<br />
cause economic loss, environmental damage, disruption of lifeline facilities,<br />
or impact other concerns. Significant hazard potential classification dams<br />
are often located in predominantly rural or agricultural areas but could be<br />
located in areas with population and significant infrastructure.<br />
Low: Failure or disoperation results in no probably loss of human life and low<br />
economic and/or environmental losses. Losses are principally limited to the<br />
owner’s property.<br />
According to MDNR’s Dam and Reservoir Safety Program, <strong>Jefferson</strong> <strong>County</strong> has 145 dams.<br />
The mean dam height is 36 feet with the mean storage capacity of 247 acre-feet. Many<br />
are less than 35 feet high and are not regulated by MDNR. People living in low-lying areas<br />
downstream of the smaller unregulated dams, depending upon the safety of the dams may<br />
be at risk if these dams should fail. Of the dams in <strong>Jefferson</strong> <strong>County</strong>, 60 are rated by<br />
MDNR as “high risk”. Only nineteen are regulated by MDNR. The oldest dam on this list<br />
was built in 1800, the most recent one was built in 1990.
114<br />
The probably future severity of a dam failure for <strong>Jefferson</strong> <strong>County</strong> is below.<br />
Hazard Level Future Probable Severity<br />
High Catastrophic<br />
Significant Critical<br />
Low Negligible<br />
Statement of Probable Risk/Likeliness Of Future Occurrence<br />
<strong>Jefferson</strong> <strong>County</strong> – Section 2<br />
According to the Dam and Reservoir Safety Program within MDNR, the likeliness of a future<br />
occurrence of dam failure is very likely, due to the conditions of dams in Missouri. While<br />
the definition varies from place to place, it generally means if failure of a high-hazard dam<br />
occurs, there probably will be loss of life. It must be emphasized that this determination<br />
does not mean that these dams are in need of repair--these dams could be in excellent<br />
condition or they could be in poor condition. "High-hazard" just reflects the dam's potential<br />
for doing damage downstream should it fail.<br />
High-hazard potential dams exist in every state and affect the lives of thousands<br />
downstream. The current issue and debate is over the increasing number of these highhazard<br />
structures--not because more high-hazard dams are being built, but that more<br />
development is occurring downstream. Dam and reservoir safety regulators generally have<br />
no control over local zoning issues or developers' property rights. So this issue continues to<br />
worry regulators as the trend persists.<br />
Hazard Level Probable Risk<br />
High Likely<br />
Significant Likely<br />
Low Likely<br />
Statement Of Next Disaster’s Likely Adverse Impact On Community<br />
The impact on the downstream community, dependent upon what is downstream could<br />
be very serious. The adverse impacts of future dam failures affecting <strong>Jefferson</strong> <strong>County</strong> at<br />
the high hazard level are shown below. Intersecting almost all the issues above is the issue<br />
of public education about dams. The ordinary citizen is unaware that the beautiful lakes on<br />
which he or she boats, skis or fishes are only there because of manmade dams. Developers<br />
build in dam break flood inundation areas knowing nothing about the potential that an<br />
upstream dam has, to cause devastation should it fail. In fact, some developers and zoning<br />
officials are completely unaware of dams within their community. Even if citizens<br />
understand and are aware of dams, they still can be overly confident in the infallibility of<br />
these manmade structures. Living in dam break flood-prone areas is a risk. Many dam<br />
owners do not realize their responsibility and liability toward the downstream public and<br />
environment.
A Regional Overview All-Hazard Mitigation Plan 115<br />
Without Mitigation Measures<br />
Life Catastrophic<br />
Property Catastrophic<br />
Emotional Catastrophic<br />
Financial Catastrophic<br />
Comments None<br />
With Mitigation Measures<br />
Life Negligible<br />
Property Negligible<br />
Emotional Negligible<br />
Financial Negligible<br />
Comments None<br />
Recommendation<br />
Implementation of dam safety actions with dam owners and jurisdictions downstream.<br />
Wildland Fires Hazard Profile<br />
Description<br />
The term wildfire is defined as "a highly destructive, uncontrollable fire." During a wildfire,<br />
the fire produces the same amount of energy in 10 minutes as a nuclear bomb.<br />
FIGURE J52<br />
Fires that burn forest plants can be classified in three ways: ground<br />
fires, surface fires, and crown fires. Ground fires burn the humus<br />
layer of the forest floor, surface fires burn forest undergrowth and<br />
surface litter, and crown fires advance through the tops of trees.<br />
Atmospheric factors such as temperature, humidity, and rainfall<br />
are important factors in determining the combustibility of a given<br />
forest. See Figure J52.<br />
Humans, either through negligence, accident, or intentional arson,<br />
have caused approximately 90% of all wildfires in the last decade<br />
in the U.S. Accidental and negligent acts include unattended<br />
campfires, sparks, burning debris, and irresponsibly discarded<br />
cigarettes. Refer to Table 52 below. The remaining 10% of fires<br />
are mostly caused by lightning, but may also be caused by other<br />
acts-of-nature such as volcanic eruptions or earthquakes.
116<br />
<strong>Jefferson</strong> <strong>County</strong> – Section 2<br />
During March and April 2000 Missouri sustained devastating fire damage to thousands of<br />
acres resulting from wildland fires. Warm temperatures and low humidity increased the<br />
occurrence and fueled the flames scorching many areas of the state. In an attempt to raise<br />
the public’s awareness of the hazardous situations, Governor Mel Carnahan and State Fire<br />
Marshal Bill Farr issued a statewide voluntary burn ban, urging citizens to refrain from<br />
conducting any open burning. In addition, the Missouri Department of Conservation and<br />
U.S. Forestry Service issued burn bans throughout state and federally owned land.<br />
TABLE J52 REASONS FOR FIRES IN MISSOURI<br />
Lightning >1%<br />
Camping 1%<br />
Smoking 4%<br />
Debris Burning 58%<br />
Arson 20%<br />
Equipment Use 3%<br />
Railroads 1%<br />
Children 1%<br />
Miscellaneous Causes 12%<br />
The Missouri Division of Fire Safety is urging fire service agencies and local governments to<br />
begin planning for this situation by adopting a local ordinance to prohibit open burning<br />
during a high fire hazard time period. Missouri statutes do not allow the state to issue a<br />
MANDATORY burn ban at the state level.<br />
One responsibility of the Forestry Division is protecting state and private land from the<br />
destructive effects of wildfires. The Forestry Division works closely with rural fire<br />
departments to assist with fire suppression activities. Nearly 900 rural fire departments<br />
have mutual aide agreements with the division. Forestry personnel provide training,<br />
equipment and grants to rural fire departments to help them become a more effective firefighting<br />
team.<br />
Statutory authority is given to fire protection districts via RSMo 321.220 (12) to "adopt and<br />
amend bylaws, fire protection and fire prevention ordinances, …". However, coordination<br />
with the county prosecuting attorney’s office is strongly recommended before<br />
implementing such an ordinance to ensure enforcement ability. Voluntary fire service<br />
associations should also coordinate similar efforts at the local level to adopt open burning<br />
laws.<br />
Not only is the land affected, but also personnel throughout many fire service agencies are<br />
pushed to their limit battling these types of fires. These situations place Missouri citizens<br />
and responding fire fighters at risk.
A Regional Overview All-Hazard Mitigation Plan 117<br />
Fire danger is based upon the burning index (BI). The burning index takes into account the<br />
fuel moisture, relative humidity, wind speed, temperature and recent precipitation. The<br />
burning index is the basis for fire suppression crew staffing levels.<br />
The vegetative types and fuel types are different than in the western U.S. As compared to<br />
the western U.S., with the humid climate of the Midwest, fuel decomposes much faster.<br />
As a result of this, the wildfires in Missouri are rare and are nearly not as severe as the fires<br />
that the western states experiences.<br />
Characteristics<br />
Fires in the counties of Franklin, <strong>Jefferson</strong>, St. Louis City, St. Louis and St. Charles Counties<br />
are different than those in the <strong>West</strong> as described above; Missouri does not have large<br />
conflagrations and crown fires, where embers from the fire are thrown a long way from<br />
the fire that results in fire ignition of other dry areas. Damage may result in the burning of<br />
outbuildings, possibly a home and nearby grassy areas. Missouri fires consist of grassy<br />
areas, leaves, ground letter, plants, shrubs, and trees. However, as new housing<br />
development in forested rural areas, the likelihood of fires will increase, especially in<br />
<strong>Jefferson</strong> <strong>County</strong>.<br />
Likely Locations<br />
Fires typically occur in highway medians and shoulders, near homes and outbuildings.<br />
People who live at the edge of the woods and vegetative debris, especially in <strong>Jefferson</strong><br />
<strong>County</strong> are at a higher risk of having a fire affect their homes and property.<br />
Type of Damage<br />
Damage may result in the burning of outbuildings, maybe a home. Missouri does not have<br />
large crown fires like the <strong>West</strong> has, where embers from the fire are thrown a long way<br />
from the fire that results in fire ignition of other dry areas. Missouri Department of<br />
Conservation and Public Safety recommend that homes in these types of areas should not<br />
be built with cedar shake shingles. Typically homes catch on fire when dry brush, bushes<br />
and trees are very close to the house.<br />
Hazard Event History<br />
In accordance with Missouri Statute 254.230 and 321.220(12), the state is currently<br />
setting up a central fire reporting system. In the past, it was the responsibility of volunteer,<br />
local and district fire departments are supposed to report wildland fires to the state.<br />
However, this is rarely done. MDC is preparing an online central reporting system that will<br />
keep track of fires. As a result, an historical summary of fires was impossible due to the<br />
way in which MDC currently has their records stored.
118<br />
<strong>Jefferson</strong> <strong>County</strong> – Section 2<br />
No Missouri fires are listed among the significant wildfires in the U.S. since 1825. Fires<br />
covering more than 300 acres are considered large in Missouri. Based on limited MDC<br />
data, it was reported that during March and April 2000 all of Missouri sustained<br />
devastating fire damage to thousands of acres resulting from wildland fires. Each year,<br />
about 3,700 wildfires burn more than 55,000 acres of forest and grassland. Missouri's<br />
wildfire season is in the spring and fall, unlike the <strong>West</strong>ern states that have a summer fire<br />
season. Dead vegetation, combined with the low humidities and high winds typical of<br />
these seasons, makes wildfire risk greater at these times.<br />
According to the MDC-Forestry Office, in the past twenty years, there have been only about<br />
five fires in the State of Missouri that MDC has been involved with in the St. Louis<br />
Metropolitan area. For the most part the rural fire departments fight their own fires.<br />
Some areas of land are not covered even by volunteer fire departments. In this event, the<br />
MDC will cover fires in these areas. Missouri has very few fires that occur as a result from<br />
lightening. Most fires result from arson, campers and from residents that burn trash.<br />
Frequency Of Occurrence<br />
Due to the timing factor and the stage of the MDC database development, frequency of<br />
occurrences was not obtained. Generally, occurrences of fires are based on the weather,<br />
humidity and available fuel.<br />
Intensity Or Strength<br />
Fires that due occur are neither intense nor strong as a result of the weather and fuel<br />
conditions found in Missouri, as compared to the fires in the <strong>West</strong>.<br />
Lives Lost, Injuries, Property Damage, Economic Losses/Other Losses<br />
Due to the timing factor and the stage of the MDC database development, specific<br />
information on lives lost, injuries, property damage and economic losses was not obtained.<br />
Locations/Areas Affected<br />
Fires typically occur in highway medians and shoulders, near homes and outbuildings.<br />
People who live at the edge of the woods and vegetative debris, especially in <strong>Jefferson</strong><br />
<strong>County</strong> are at a higher risk of having a fire affect their homes and property.<br />
Seasonal Pattern<br />
The season for wildfires in Missouri is between the end of February and the end of April, or<br />
whenever the environment is dry from lack of rain. Due to the lack of moisture throughout<br />
many areas Missouri, from late winter (February) through spring (May) often times the<br />
conditions are favorable for the high risk of wildland fires.
A Regional Overview All-Hazard Mitigation Plan 119<br />
Speed Of Onset And /Or Existing Warning Systems<br />
The Department of Conservation relies upon the news media to help warn citizens of high<br />
fire danger. A set of standardized fire danger adjectives has been developed for fire<br />
warnings. These adjectives include a brief description of burning conditions, open burning<br />
suggestions for homeowners and fire crew staffing levels. Residents should always check<br />
with their local fire department or District Forester for local burning conditions.<br />
Map Of Hazards<br />
Refer to Figure J53 (located in the back of the Technical Appendix) for a map that depicts<br />
areas of potential wildfire hazard. These would include those areas of rural homes near<br />
forested areas.<br />
Statement of Probable Future Severity<br />
Location Future Probable Severity<br />
Buffer areas Negligible<br />
Forests Negligible<br />
Grassy areas Negligible<br />
Statement Of Probable Risk/Likeliness Of Future Occurrence<br />
There is a somewhat greater likelihood of future occurrences in <strong>Jefferson</strong> <strong>County</strong> as a result<br />
of the influx of greater numbers of residents moving into rural areas where the homes are<br />
close to forested areas and vegetative debris. Dry weather, available fuel and fires are<br />
sporadic phenomena that occur throughout the United States. Frequency, intensity, and<br />
duration of these conditions vary drastically from year to year.<br />
Based upon <strong>Jefferson</strong> <strong>County</strong>’s lack of a great number of wildfires, a conflagration similar<br />
to those out <strong>West</strong> is unlikely, especially in light of the fact that the humidity and fuel<br />
source is not available. Fires will possibly occur, but on a much smaller scale. These will<br />
consist of grass fires along side roads and railroad tracks and fires near homes in rural<br />
areas. The following fire danger index used by MDC will be the criteria by which an<br />
evaluation of probable risk for <strong>Jefferson</strong> <strong>County</strong> will be developed.<br />
Level Probable Risk of Occurrence<br />
Low Fire Danger Possible<br />
Moderate Fire Danger Possible<br />
High Fire Danger Unlikely<br />
Extreme Fire Danger Unlikely
120<br />
Statement Of Next Disaster’s Likely Adverse Impact On Community<br />
<strong>Jefferson</strong> <strong>County</strong> – Section 2<br />
Missouri Department of Conservation Forester, Mr. William Altman does not believe that<br />
Missouri, much less the EWG planning region as being included in a wildland fire disaster<br />
category. It may be a disaster to an individual, but it is not a disaster to a community.<br />
There is a somewhat greater likelihood of future occurrences in <strong>Jefferson</strong> <strong>County</strong> as a result<br />
of the influx of greater numbers of residents moving into rural areas where the homes are<br />
close to woods and vegetative debris.<br />
Without Mitigation Measures<br />
Life Negligible<br />
Property Negligible<br />
Emotional Negligible<br />
Financial Negligible<br />
With Mitigation Measures<br />
Life Negligible<br />
Property Negligible<br />
Emotional Negligible<br />
Financial Negligible<br />
Recommendation<br />
Missouri Department of Conservation and <strong>Jefferson</strong> <strong>County</strong> Fire Districts to develop an<br />
education outreach program for communities that have a greater chance of future fires.<br />
MDC has an ongoing educational effort in certain at risk areas. This effort includes visiting<br />
schools, local fairs and other events to educate and pass out fire prevention pamphlets in<br />
terms of seasonal or broad fire prevention approach. Establishing local ordinances to<br />
prohibit open burning during hazardous conditions is a proactive approach and will help<br />
reduce the number of wildland fires in the future.<br />
Multi-Jurisdictional Risk Assessment In <strong>Jefferson</strong> <strong>County</strong> and Communities<br />
<strong>Jefferson</strong> <strong>County</strong> hazards tend to be either geographically random or regional in nature.<br />
Some areas of the <strong>County</strong> have experienced affects from some tornadoes and localized<br />
flash flooding. The historic floods along the Mississippi River, especially the 1993 flood,<br />
greatly impacted the <strong>County</strong>. The <strong>County</strong> is also susceptible to impacts from earthquakes<br />
due to the proximity to the New Madrid Fault Zone, density of population, condition of the<br />
buildings, and geological environment. The <strong>County</strong> has experienced only scattered damage<br />
from winter storms, thunderstorms, and drought.<br />
Certain incorporated communities within <strong>Jefferson</strong> <strong>County</strong> that exhibit a unique flooding<br />
hazard profile, due to its location on the Mississippi and Meramec River floodplains include<br />
the following jurisdictions:
A Regional Overview All-Hazard Mitigation Plan 121<br />
Arnold<br />
Byrnes Mill<br />
Cedar Hill Lakes<br />
Crystal City<br />
DeSoto<br />
Festus<br />
Herculaneum<br />
Kimmswick<br />
Pevely<br />
Scotsdale<br />
Consequences from riverine and flash flooding could be catastrophic in terms of safety of<br />
lives and property. Riverine flooding is considered a primary hazard for the <strong>County</strong>.<br />
Significant Mississippi River flooding inundated the above communities in July 1947, July<br />
1951, August 1993, and May 1995. Significant Meramec River flooding also inundated<br />
Byrnes Mill and Arnold in May 1973, December 1982, August 1993, and April 1994.<br />
During the 1993 flood, in <strong>Jefferson</strong> <strong>County</strong>, $1,527,199 in public assistance was paid to<br />
claimants as a result of flood damage. In one community, the wastewater treatment plant<br />
was inundated by floodwaters; the community is currently constructing a levee and<br />
floodwall to protect the new infrastructure. Significant flash flooding in the Meramec,<br />
Bourbeuse and Big River basins from an intense rainfall on May 7, 2000. The flooding<br />
resulted in two deaths, extensive damage to structures, roads and bridges and major<br />
economic losses from communities and businesses throughout the area. Communities<br />
including Byrnes Mill and Eureka (St. Louis <strong>County</strong>) were overwhelmed by the deluge that<br />
consisted of a thunderstorm that delivered up 15 inches of rain in 13 hours. A Federal<br />
Disaster declaration was made (DR-1328); damages and losses incurred totaled<br />
$483,511.22 in individual assistance, $473,000 in small business loans, and $574,002.26<br />
in public assistance. In 2003, flash flooding and a severe tornado resulted in inundation,<br />
one death and property storm damage in DeSoto with an estimated at $1 million dollars in<br />
damage.<br />
Consequences from earthquakes (and cascading hazards) could also be catastrophic in<br />
terms of human lives and property in the event of a larger magnitude earthquake (in the<br />
range of 6.7 to 8.6). The nearby New Madrid Fault Zone has the potential to produce an<br />
earthquake of this magnitude and cause damage similar to the earthquake that struck the<br />
San Francisco Bay region during the World Series, killing 63 people and causing $6 billion<br />
of property damage. The nearby the Wabash Valley Fault and the fault zones in the vicinity<br />
of Farmington (including Big River Fault and the St. Genevieve Fault Zone) are also capable<br />
of producing lesser magnitude earthquakes. The earthquake hazard is also considered a<br />
primary hazard. Certain regions within the <strong>County</strong> are more susceptible to greater damage<br />
from earthquakes due to their position within the soil liquefaction zone, as identified by<br />
Missouri Department of Natural Resources, Geological Survey Resource Assessment<br />
Division, Earthquake Hazards Map of the St. Louis Metro Area. Areas outside of the soil<br />
liquefaction zone will most likely be impacted from an earthquake, but probably to a lesser<br />
degree. These incorporated communities within <strong>Jefferson</strong> <strong>County</strong> that exhibit a unique
122<br />
<strong>Jefferson</strong> <strong>County</strong> – Section 2<br />
earthquake hazard profile, due to its location on the Mississippi and Meramec River<br />
floodplains include the following jurisdictions:<br />
Arnold<br />
Byrnes Mill<br />
Cedar Hill Lakes<br />
Crystal City<br />
DeSoto<br />
Festus<br />
Herculaneum<br />
Kimmswick<br />
Pevely<br />
Scotsdale<br />
Refer to Figure J54 (located in the back of the Technical Appendix), which identifies the<br />
combined hazards for <strong>Jefferson</strong> <strong>County</strong>.<br />
Vulnerability Assessment Worksheets for <strong>Jefferson</strong> <strong>County</strong> are located in the back of the<br />
Technical Appendix. These worksheets represent the loss estimates for each hazard<br />
affecting the county, including the communities listed above.<br />
Loss estimates were calculated using a combination of information found below. Rough<br />
economic estimates were also included.<br />
• The number of buildings was based on the recorded number of buildings from the<br />
assessor’s database.<br />
• Values of buildings represent the market value, rather than the dollar loss likely to<br />
result from a given event. Building damages could range from minimal to total<br />
devastation.<br />
• The number of people was derived from the 2000 U.S. Census, EWG, and Office of<br />
Social and Economic Development (OSEDA) databases.<br />
• Dollar figures were based on county assessor’s data and Saylor Construction Cost<br />
Index data.<br />
• Sources for these worksheets include the Missouri Department of Elementary and<br />
Secondary Education, Economic Development, Missouri Department of<br />
Conservation, Missouri Office of Economic Data Analysis; county assessor’s data,<br />
Saylor Construction Cost Index, and EWG databases.<br />
• Projected figures were calculated using the above numbers and factoring in<br />
population projection percentages from the community profile.
A Regional Overview All-Hazard Mitigation Plan 123<br />
For purposes of this assessment, “Developed Land” and “Undeveloped Land” categories<br />
EWG used the definition of the National Resources Conservation Service’s National<br />
Resources Inventory, 2001 (NRI).
124<br />
WORKSHEETS<br />
<strong>Jefferson</strong> <strong>County</strong> – Section 2<br />
JEFFERSON COUNTY HAZARD ANALYSIS NARRATIVE WORKSHEETS<br />
JEFFERSON COUNTY HAZARD PROFILE WORKSHEETS<br />
JEFFERSON COUNTY RISK ASSESSMENT WORKSHEETS<br />
JEFFERSON COUNTY RISK INDEX WORKSHEETS<br />
JEFFERSON COUNTY VULNERABILITY WORKSHEETS
A Regional Overview All-Hazard Mitigation Plan 125<br />
HAZARD ANALYSIS NARRATIVE<br />
Hazard: Dam Failure<br />
Description of Hazard (Type of hazard, pathways/areas likely affected, type of damage,<br />
etc.)<br />
A dam failure is defined as structural failure of materials used in dam construction,<br />
inadequate maintenance, overtopping by flood, foundation defects and piping/cracking<br />
caused by movements from settling of dam.<br />
Damage occurs downstream from a failing dam to lives of residents and their property,<br />
businesses, infrastructure. Depending upon volume of water released, damage could be<br />
catastrophic in a limited area.<br />
Historical Statistics (Frequency, strength, # of lives lost, # of injuries, economic losses, etc.)<br />
Based on the National Dam Inventory maintained by the USCOE, Missouri has 607<br />
dams that are considered a high hazard. Historic dam failures have occurred just<br />
south of the EWGCC region near Lawrenceton in 1968 (Ste. Genevieve <strong>County</strong>),<br />
Washington <strong>County</strong> in 1975, in Fredericktown in 1968 (Madison <strong>County</strong>) and a near<br />
failure in Franklin <strong>County</strong> in 1978. The EWGCC region has the largest number of<br />
dams in Missouri. No lives have been lost as a result of these dam failures. No data<br />
is available on the number of injuries or economic losses as a result of these failures.<br />
Statement of Future Probable Severity (Catastrophic/Critical/Limited/Negligible). Severity<br />
of future dam failures will be catastrophic in the path of the released waters. For<br />
topographically higher areas surrounding the failed dam, negligible impacts will occur.<br />
Statement of Probable Risk (Likeliness of future occurrence- (Highly<br />
Likely/Likely/Possible/Unlikely). According to Missouri Department of Natural Resources, Dam<br />
and Reservoir Safety Program, it is likely that future occurrences of dam failures will occur<br />
based on the poor conditions of the existing dams.<br />
Statement of Next Disaster’s Likely Adverse Impact on the Community<br />
(Catastrophic/Critical/Limited/Negligible). Severity of future dam failures will be catastrophic<br />
in the path of the released waters. For topographically higher areas surrounding the failed<br />
dam, negligible impacts will occur.<br />
Without mitigation measures: Life Property Emotional Financial<br />
Comments:<br />
Catastrophic Catastrophic Catastrophic Catastrophic<br />
With mitigation measures: Life Property Emotional Financial<br />
Negligible Negligible Negligible Negligible
126<br />
Comments:<br />
<strong>Jefferson</strong> <strong>County</strong> – Section 2<br />
Recommendation: EWGCC Hazard Mitigation Planning Committee to initiate mitigation<br />
activity to convince legislators to provide adequate funding to staff the Dam and Reservoir<br />
Safety Program for inspections, permit issuance in order to protect human life and property.
A Regional Overview All-Hazard Mitigation Plan 127<br />
HAZARD ANALYSIS NARRATIVE<br />
Hazard: Drought<br />
Description of Hazard (Type of hazard, pathways/areas likely affected, type of damage,<br />
etc.) Drought is defined as the deficiency of precipitation over an extended period of time,<br />
usually a season or more; resulting in extensive damage to crops. Meteorological drought is<br />
the expression of precipitation’s departure from normal over some time period. Agricultural<br />
drought occurs when there isn’t enough soil moisture to meet the needs of a particular<br />
crop at a particular time. Hydrologic drought refers to the deficiencies in surface and<br />
subsurface water supplies; measured as stream flow, lake and groundwater levels.<br />
Socioeconomic drought occurs when physical water shortage starts to affect people.<br />
Drought characteristics include economic, social and environmental. The amount of<br />
damage depends on 1). The length/severity of the drought, 2). Damage can range from very<br />
slight to total.<br />
Historical Statistics (Frequency, strength, # of lives lost, # of injuries, economic losses,<br />
etc.) Droughts are classified according to various classifications. The National Drought<br />
Mitigation Center created a drought map that uses the Palmer Index, Crop Moisture Index,<br />
Standardized Precipitation Indices, Percent of Normal Rainflow, Daily Streamflow,<br />
Snowpack, Soil Moisture, Vegetative Index and Fire Danger Classifications. According to<br />
The Missouri Climate Center at UMC, the Drought Monitor map is the drought indicator of<br />
choice and is superior to the Palmer Index. The Palmer Index is good for past droughts.<br />
However, the NDMC drought monitor map is the best tool to use.<br />
The EWGCC planning region is divided into two climate divisions (CD): St. Louis City, St.<br />
Louis, St. Charles, and Franklin counties are within CD #2. <strong>Jefferson</strong> <strong>County</strong> is located in<br />
CD #5. According to the Missouri Climate Center, the worst droughts on record to affect<br />
CD#2 occurred in 1901-1902, 1913-14, 1930-31, 1934, 1936, 1940-41, 1953-56, 1963-<br />
64, 1980-81, 1988-89 and 1999-2000. Droughts on record that affected CD#5 occurred<br />
in 1900-09, 1940-49, 1950-59, 1964-66 and 1980. In addition, MDNR divided the state<br />
into three regions, prioritized according to drought susceptibility, slight, moderate and<br />
severe. The EWGCC region is within all three regions. St. Louis city and northern <strong>Jefferson</strong><br />
<strong>County</strong> is in region C (high susceptibility). <strong>East</strong> half of St. Chalres <strong>County</strong> and northern<br />
portions (floodplain areas) of St. Louis and Franklin Counties are within Region A (slight<br />
susceptibility). The western half of St. Charles <strong>County</strong> is included in Region B (moderate<br />
susceptibility).<br />
On average, drought costs the U.S. economy about $7-$9 billion a year according to the<br />
National Drought Mitigation Center. Losses from the drought from 1988 to 1989 are<br />
estimated to have cost $39 billion dollars.<br />
Statement of Future Probable Severity (Catastrophic/Critical/Limited/Negligible)-<br />
Catastrophic to limited.<br />
Statement of Probable Risk (Likeliness of future occurrence-Highly<br />
Likely/Likely/Possible/Unlikely)- Likely
128<br />
<strong>Jefferson</strong> <strong>County</strong> – Section 2<br />
Statement of Next Disaster’s Likely Adverse Impact on the Community<br />
(Catastrophic/Critical/Limited/Negligible)-Catastrophic to limited<br />
Without Mitigation Measures: Life Property Emotional Financial<br />
Comments:<br />
Negligible Limited Limited Critical<br />
With Mitigation Measures: Life Property Emotional Financial<br />
Comments<br />
Limited Limited Limited Limited<br />
Recommendations: That the <strong>County</strong> Hazard Mitigation Planning Committee<br />
initiate a mitigation activity to convince state and local government, and county residents to<br />
help reduce the impacts caused by droughts, by implementing the state drought plan.
A Regional Overview All-Hazard Mitigation Plan 129<br />
HAZARD ANALYSIS NARRATIVE<br />
Hazard: Earthquake<br />
Description of Hazard (Type of hazard, pathways/areas likely affected, type of damage,<br />
etc.)<br />
The characteristics of earthquakes include the rolling or shaking of the ground surface,<br />
landslides, liquefaction and amplification. The severity depends on several factors including<br />
soil/slope conditions, closeness to the fault, earthquake magnitude and type of earthquake.<br />
Any person or structure that is present in the land closest to the epicenter will be most<br />
severely affected. Persons or structures farther away from the epicenter will be less severely<br />
affected, dependent upon the geology of the area. The amount of damage depends on 1).<br />
The intensity/strength of the earthquake, 2). The proximity of the earthquake, 3). The<br />
strength/construction of the structure, 4). How well a person is sheltered. Damage can<br />
range from very slight to total.<br />
Historical Statistics (Frequency, strength, # of lives lost, # of injuries, economic losses,<br />
etc.)<br />
Since 1811 there have been 16 earthquakes affecting the EWGCC ranging in magnitude<br />
from 2.4 to 8.2 on the Richter scale. The earthquakes have caused multiple deaths,<br />
.injuries, and damaged properties in the past. The Center for Earthquake Studies estimated<br />
that from a 7.6 scale earthquake, there will be over 1400 deaths, and $2.5 million dollars in<br />
property damage and $500K in utility damage. This data excludes St. Charles and Franklin<br />
Counties due to unavailability.<br />
Statement of Future Probable Severity (Catastrophic/Critical/Limited/Negligible)<br />
Catastrophic<br />
Statement of Probable Risk (Likeliness of future occurrence- (Highly<br />
Likely/Likely/Possible/Unlikely)<br />
Possible<br />
Statement of Next Disaster’s Likely Adverse Impact on the Community<br />
(Catastrophic/Critical/Limited/Negligible)-Catastrophic<br />
The Center for Earthquake Studies estimated that from a 7.6 scale earthquake, there will be<br />
over 1400 deaths, and $2.5 million dollars in property damage and $500K in utility<br />
damage. This data excludes St. Charles and Franklin Counties due to unavailability.<br />
Without mitigation measures: Life Property Emotional Financial<br />
Comments:<br />
Catastrophic Catastrophic Catastrophic Catastrophic
130<br />
<strong>Jefferson</strong> <strong>County</strong> – Section 2<br />
With mitigation measures: Life Property Emotional Financial<br />
Comments:<br />
Limited Limited Critical Limited<br />
Recommendation: The <strong>County</strong> Hazard Mitigation Planning Committee to initiate a<br />
mitigation activity to convince various government agencies, businesses, county<br />
residents to retrofit buildings/infrastructure, businesses and homes in earthquake<br />
prone areas to help reduce the loss of life caused by earthquakes.
A Regional Overview All-Hazard Mitigation Plan 131<br />
HAZARD ANALYSIS NARRATIVE<br />
Hazard: Flood<br />
Description of Hazard (Type of hazard, pathways/areas likely affected, type of damage,<br />
etc.) A flood is defined as an overflow or inundation that comes from a river or other<br />
body of water or causes or threatens damage, or any relatively high streamflow that<br />
overtops the natural or artificial banks in any reach of stream. The National Flood Insurance<br />
Program defines a flood as a general and temporary condition of partial or complete<br />
inundation of two or more acres of normally dry land or of two or more properties from<br />
inland waters, unusual and rapid accumulation or runoff of waters from any source or a<br />
mudflow. Floods are most likely to occur in the spring, but can occur in any time of the<br />
year. Any person or structure that is present in the path of floodwaters as described above<br />
could be damaged. Damage is most likely to occur within the flood insurance rate map<br />
designated 100 and 500-year areas. The amount of damage depends on 1). The<br />
intensity/strength of the flood, 2). The proximity of the flood to the person/structure.<br />
Damage can range from very slight to total. Hazards range from death to total property<br />
damage from floodwaters.<br />
Historical Statistics (Frequency, strength, # of lives lost, # of injuries, economic losses,<br />
etc.) The <strong>East</strong>-<strong>West</strong> <strong>Gateway</strong> <strong>Coordinating</strong> <strong>Council</strong> planning region has many river and<br />
small tributaries in both the unincorporated and incorporated areas that are susceptible to<br />
flooding. Catastrophic floods have occurred in the EWGCC region in 1927, 1951, 1973,<br />
1979, 1982, 1984, 1986, 1993, 1994, 1994, 1995, 1998, 1999 and 2000. In the<br />
Chesterfield Valley of St. Louis <strong>County</strong> alone, damage from the 1993 flood totaled $200<br />
million. (In the 1993 flood approximately $21 billion dollars in damage and costs and 48<br />
deaths resulted (NOAA.) Multiple lives have been lost from flooding; 49 deaths were<br />
recorded from the 1993 Flood.<br />
Statement of Future Probable Severity (Catastrophic/Critical/Limited/Negligible) Critical<br />
Statement of Probable Risk (Likeliness of future occurrence- (Highly<br />
Likely/Likely/Possible/Unlikely)-Highly Likely to occur in future<br />
Statement of Next Disaster’s Likely Adverse Impact on the Community<br />
(Catastrophic/Critical/Limited/Negligible)<br />
Without mitigation measures: Life Property Emotional Financial<br />
Comments:<br />
Catastrophic Catastrophic Catastrophic Catastrophic<br />
With mitigation measures: Life Property Emotional Financial
132<br />
Comments:<br />
<strong>Jefferson</strong> <strong>County</strong> – Section 2<br />
Limited Limited Limited Limited<br />
Recommendation: The <strong>County</strong> Hazard Mitigation Planning Committee to initiate a<br />
mitigation activity to convince county residents to build, move to higher ground or<br />
to retrofit homes in flood prone areas to help reduce the loss of life caused by<br />
floods.
A Regional Overview All-Hazard Mitigation Plan 133<br />
HAZARD ANALYSIS NARRATIVE<br />
Hazard: Heat Wave<br />
Description of Hazard (Type of hazard, pathways/areas likely affected, type of damage,<br />
etc.) A heat wave is defined as a prolonged period of excessive heat and humidity (three<br />
consecutive days of 90 degrees plus, Fahrenheit). This usually occurs in June, July and<br />
August. This can result in heat related deaths and damage to infrastructure. The amount of<br />
damage depends on 1). The intensity/length of the heat wave, 2). How well a person is<br />
sheltered.<br />
Historical Statistics (Frequency, strength, # of lives lost, # of injuries, economic losses,<br />
etc.)<br />
Heat wave are likely to occur as frequently as in past history, or between 10 and<br />
100% in the next 10 years. In 1966, 246 individuals were reported to have died as<br />
a result of the heat in the St. Louis metropolitan area. St. Louis experienced heat<br />
waves in 1993, 1988, 1995, without experiencing death rates close to the total of<br />
113 in 1980. A total of 134 heat related deaths have occurred in St. Louis City from<br />
1989 through 2003. Thirty-nine deaths in this same time period occurred in St.<br />
Louis <strong>County</strong>. No information was available for the other counties. St. Louis ranks<br />
in the top five in the U.S. for heat related deaths.<br />
Statement of Future Probable Severity (Catastrophic/Critical/Limited/Negligible)<br />
Negligible to catastrophic dependent upon the location within the EWGCC<br />
region. The EWGCC region has a history of having multiple heat related<br />
deaths.<br />
Statement of Probable Risk (Likeliness of future occurrence- (Highly<br />
Likely/Likely/Possible/Unlikely). It is highly likely that heat waves will occur in the future.<br />
Statement of Next Disaster’s Likely Adverse Impact on the Community<br />
(Catastrophic/Critical/Limited/Negligible). Catastrophic<br />
Without mitigation measures: Life Property Emotional Financial<br />
Comments:<br />
Catastrophic Critical Catastrophic Limited<br />
With mitigation measures: Life Property Emotional Financial<br />
Limited/Critical Negligible Limited Negligible
134<br />
Comments:<br />
<strong>Jefferson</strong> <strong>County</strong> – Section 2<br />
Recommendation: The EWGCC Hazard Mitigation Planning Committee will support<br />
continuation of mitigation activity Operation Weather Survival that will assist at risk<br />
residents during heat waves in the region.
A Regional Overview All-Hazard Mitigation Plan 135<br />
HAZARD ANALYSIS NARRATIVE<br />
Hazard: Tornadoes/Severe Storms (Downbursts, Lightening, Hail, Heavy Rains,<br />
Wind)<br />
Description of Hazard (Type of hazard, pathways/areas likely affected, type of damage,<br />
etc.) Tornadoes are cyclical windstorms or violently rotating column of air. Accompanying<br />
storm activities include severe thunder/electrical storms, down-bursts, straight-line winds,<br />
lightning, hail and heavy rain. The average forward speed of a tornado is about 30 m.p.h.<br />
but may vary from nearly stationary to 70 m.p.h. The average pathway may vary in any<br />
direction, but the average tornado moves from southwest to northeast. Tornadoes are<br />
most likely to occur between 3:00 p.m. and 9:00 p.m. but may ensue at any hour of the<br />
day. Any person or structure at any location could be damaged by a tornado. The amount<br />
of damage depends on 1). The strength of the tornado, 2) the tornado’s proximity to the<br />
person/structure, 3) the strength the structure, 4) how well a person is sheltered. Damage<br />
can range fro very slight to total. On average, tornadoes stay on the ground 30 minutes,<br />
covers 15 miles, is up to 300 years wide, although NOAA determined that the mean path<br />
length was 2.27 miles long and .14 square mile path in length. Most storms move from<br />
southwest to northeast and occur between 3 and 9 in the afternoon hours in the spring<br />
months.<br />
Historical Statistics (Frequency, strength, # of lives lost, # of injuries, economic losses,<br />
etc.) Tornadoes are classified according to the F-scale (developed by Dr. Theodore Fujita).<br />
The F-scale ranks tornadoes according to its wind speed based on the severity of damage it<br />
caused. On May 27, 1896, 18 tornadoes struck St. Louis, resulting in 306 deaths and $15<br />
million dollars in damages. On May 9, 1927 two tornadoes struck St. Louis, the first killing<br />
306 people and causing $13 million in damages (between Missouri and Illinois). The<br />
second tornado killed 79 people and resulted in $23 million in damages. In November 1988<br />
a tornado struck the St. Charles community. Businesses were able to obtain Small Business<br />
Loans to recover from this disaster. Since 1950, St. Louis <strong>County</strong> has had 23 tornadoes, St.<br />
Charles has had 24, St. Louis City has had 3, <strong>Jefferson</strong> <strong>County</strong> has had 23 and Franklin has<br />
had 16 tornadoes. Since 1950, 11 deaths in St. Louis City have resulted from tornadoes. In<br />
this same period for St. Louis <strong>County</strong>, 13 deaths have resulted, one death in <strong>Jefferson</strong><br />
<strong>County</strong>, and none in St. Charles and Franklin Counties.<br />
F-SCALE SPEED IN M.P.H. COUNTY TORNADOES BY F-SCALE<br />
SINCE 1950?<br />
FO 40-72 F0 16 %<br />
F1 73-112 F1 32<br />
F2 113-157 F2 32<br />
F3 158-206 F3 14<br />
F4 207-260 F4 5<br />
F5 261-318 F5 0
136<br />
<strong>Jefferson</strong> <strong>County</strong> – Section 2<br />
Statement of Future Probable Severity (Catastrophic/Critical/Limited/Negligible)-<br />
Catastrophic<br />
F-SCALE SPEED IN M.P.H. COUNTY TORNADOES BY F-SCALE<br />
SINCE 1950?<br />
FO 40-72 F0 16%<br />
F1 73-112 F1 32<br />
F2 113-157 F2 32<br />
F3 158-206 F3 14<br />
F4 207-260 F4 5<br />
F5 261-318 F5 0<br />
Statement of Probable Risk (Likeliness of future occurrence-(Highly<br />
Likely/Likely/Possible/Unlikely)- highly likely<br />
F-SCALE SPEED IN M.P.H. COUNTY TORNADOES BY F-SCALE<br />
SINCE 1950?<br />
FO 40-72 F0 16%<br />
F1 73-112 F1 32<br />
F2 113-157 F2 32<br />
F3 158-206 F3 14<br />
F4 207-260 F4 5<br />
F5 261-318 F5 0<br />
Statement of Next Disaster’s Likely Adverse Impact on the Community<br />
(Catastrophic/Critical/Limited/Negligible)-Catastrophic<br />
Without Mitigation Measures: Life Property Emotional Financial<br />
Comments:<br />
Catastrophic Catastrophic Catastrophic Catastrophic<br />
With Mitigation Measures: Life Property Emotional Financial<br />
Comments<br />
Limited Limted Limited Limited
A Regional Overview All-Hazard Mitigation Plan 137<br />
Recommendations: That the <strong>County</strong> Hazard Mitigation Planning Committee<br />
initiate a mitigation activity to convince county residents to construct Tornado Saferooms to<br />
help reduce the loss of life caused by tornadoes.
138<br />
HAZARD ANALYSIS NARRATIVE<br />
Hazard: Wildland Fire<br />
<strong>Jefferson</strong> <strong>County</strong> – Section 2<br />
Description of Hazard (Type of hazard, pathways/areas likely affected, type of damage,<br />
etc.)<br />
A wildland fire is defined as any nonstructure fire, other than prescribed fire, that<br />
occurs in the wildland. Wildland fires impact areas where a common urban/forest<br />
boundary, prairie and grassland is present. The line, area or zone where structures<br />
and other human development meet or intermingle with undeveloped wildland or<br />
vegetative fuels. The type of damage depends on the size of the fire. Typically in<br />
the EWGCC region, wildland fires are not a concern. Damage may be a partially<br />
burned outbuilding.<br />
Historical Statistics (Frequency, strength, # of lives lost, # of injuries, economic losses,<br />
etc.)<br />
Fires usually occur in the spring and fall seasons. According to Missouri Department<br />
of Conservation, Forestry staff, in the past 20 years, approximately 4 to 5 fires have<br />
erupted in the EWGCC region. Most firefighting work in Missouri is done in<br />
regions that have large stands of trees and as support to fires in the western United<br />
States.<br />
Statement of Future Probable Severity (Catastrophic/Critical/Limited/Negligible)-<br />
Negligible<br />
Statement of Probable Risk (Likeliness of future occurrence- (Highly<br />
Likely/Likely/Possible/Unlikely)-Possible<br />
Statement of Next Disaster’s Likely Adverse Impact on the Community<br />
(Catastrophic/Critical/Limited/Negligible)<br />
Without mitigation measures: Life Property Emotional Financial<br />
Comments:<br />
Negligible Negligible Negligible Negligible<br />
With mitigation measures: Life Property Emotional Financial<br />
Comments:<br />
Negligible Negligible Negligible Negligible
A Regional Overview All-Hazard Mitigation Plan 139<br />
Recommendation: The EWGCC Hazard Mitigation Planning Committee recommends<br />
mitigation activity to convince county residents to help reduce the damage to property and<br />
the potential loss of life caused by wildfires.
140<br />
HAZARD ANALYSIS NARRATIVE<br />
Hazard: Severe Winter Weather<br />
<strong>Jefferson</strong> <strong>County</strong> – Section 2<br />
Description of Hazard (Type of hazard, pathways/areas likely affected, type of damage,<br />
etc.) Severe winter weather is defined as sleet, freezing rain, and heavy snow. This can be<br />
accompanied by strong winds creating blizzard conditions, severe drifting and dangerous<br />
wind chill. Ice storms cause significant hazards as well. Communications and power can be<br />
disrupted for days, resulting in residents using alternate fuel sources that are likely to start<br />
fires. Strong winds with intense storms and cold fronts knock down trees, utility poles,<br />
power lines. Extreme cold often accompanies a winter storm in its wake. Winter weather<br />
can result in injuries, death, and property damage. Prolonged exposure to cold can cause<br />
frostbite, hypothermia can become life-threatening. The average pathway may vary in any<br />
direction, but the average winter storm moves from west to east. Winter storms are most<br />
likely to occur in November through February but may ensue from October through April.<br />
Any person or structure at any location could be damaged by a winter storm.<br />
Historical Statistics (Frequency, strength, # of lives lost, # of injuries, economic losses,<br />
etc.) Economic losses are difficult to measure. Local governments, home and business<br />
owners can be faced with spending millions of dollars for snow removal, restoration of<br />
services, debris removal and landfill hauling. NOAA weather indicates that the Missouri<br />
counties north of the Missouri River receive an average snowfall of 18-22 inches, and<br />
counties south of the river receive an average of 8-12 inches. Historical statistics for the<br />
EWGCC include the winter storm in January 1994 that resulted in temperatures dropping to<br />
–20 F degrees below zero, with wind chills to –50 degrees F below zero. In January 1977,<br />
the EWGCC region received the maximum snowfall for the area at 23.9 inches of snow with<br />
temperatures hovering around –14 degrees F below zero. Also in January 1982, the<br />
EWGCC region received a 24 maximum snowfall of 13.9 inches with temperatures around –<br />
15 degrees F below zero. In February 1914, the EWGCC received the maximum snowfall for<br />
the area for this month at 23.5 inches of snow. In December 1973, the EWGCC region<br />
received its maximum snowfall for the area for this month at 26.3 inches. The coldest<br />
December on record was 1983 with temperature average of 20.5 degrees F. Multiple<br />
homes and businesses had water pipes break, people were admitted to hospitals for<br />
hypothermia/frostbite and schools were closed.<br />
Statement of Future Probable Severity (Catastrophic/Critical/Limited/Negligible). Ice<br />
storms could be limited to catastrophic<br />
Statement of Probable Risk (Likeliness of future occurrence-(Highly<br />
Likely/Likely/Possible/Unlikely) Winter/ice storms are likely to occur in the future.<br />
Statement of Next Disaster’s Likely Adverse Impact on the Community<br />
(Catastrophic/Critical/Limited/Negligible)<br />
Without Mitigation Measures: Life Property Emotional Financial
A Regional Overview All-Hazard Mitigation Plan 141<br />
Comments:<br />
Critical Critical Critical Critical<br />
With Mitigation Measures: Life Property Emotional Financial<br />
Comments<br />
Limited Limited Limited Limited<br />
Recommendations: That the <strong>County</strong> Hazard Mitigation Planning Committee initiate a<br />
mitigation activity to convince county local governments, residents to help reduce the loss<br />
of life and property damage caused by winter storms by preparing for the storms and<br />
adhering to NOAA winter storm weather warnings.
142<br />
<strong>Jefferson</strong> <strong>County</strong> – Section 2<br />
JEFFERSON COUNTY EARTHQUAKE HAZARD PROFILE WORKSHEET<br />
COMMUNITIES: Arnold, Byrnes Mill, Cedar Hill Lakes, Crystal City, DeSoto, Festus,<br />
Herculaneum, Kimmswick, Pevely, Scotsdale.<br />
POTENTIAL MAGNITUDE (Percentage of jurisdiction that can be affected):<br />
X Catastrophic: More than 50%<br />
_ Critical: 25% to 50%<br />
_ Limited: 10 to 25%<br />
_ Negligible: Less than 10%<br />
FREQUENCY OF OCCURRENCE:<br />
_ Highly Likely: Near 100% probability in next year<br />
_ Likely: Between 10 and 100% probability in next year, or at least one chance in 10<br />
years<br />
X Possible: Between 1 and 10% probability in next year or at least one chance in next<br />
100 years.<br />
_ Unlikely: Less than 1% probability in next 100 years<br />
SEASONAL PATTERN:<br />
There is no known relationship between the occurrence of earthquakes and seasonal<br />
weather patterns.<br />
AREAS LIKELY TO BE AFFECTED MOST (BY SECTOR):<br />
All areas in county(s) will be affected due to the widespread nature of earthquakes. Those<br />
counties farther south (<strong>Jefferson</strong>, southern, central St. Louis <strong>County</strong> and City will most likely<br />
be impacted more than farther counties north and west (Franklin and St. Charles) due to<br />
the closer proximity to the New Madrid Fault zone.<br />
PROBABLE DURATION:<br />
Initial earthquakes and subsequent aftershocks have been known to last in the range of<br />
three or more months (1811-1812 New Madrid Earthquake).<br />
POTENTIAL SPEED OF ONSET<br />
(Probable amount of warning time)<br />
X Minimal (or no) warning<br />
_ 6 to 12 hours warning<br />
_ 12 to 24 hours warning<br />
_ More than 24 hours warning<br />
EXISTING WARNING SYSTEMS: None
A Regional Overview All-Hazard Mitigation Plan 143<br />
COMPLETE VULNERABILITY ANALYSIS: Based on a Mercalli Scale Level VII earthquake, with<br />
an estimated damage in 80% of the county, it was estimated that in the developed<br />
portions of the county approximately 129,000 people would be impacted, 30,000<br />
buildings affected valued at $3 billion dollars. Projected risk for undeveloped areas: 54,450<br />
persons in 21,000 buildings valued at $1.5 billion dollars.
144<br />
FLOOD HAZARD PROFILE WORKSHEET<br />
<strong>Jefferson</strong> <strong>County</strong> – Section 2<br />
COMMUNITIES: Arnold, Byrnes Mill, Cedar Hill Lakes, Crystal City, DeSoto, Festus,<br />
Herculaneum, Kimmswick, Pevely, Scotsdale<br />
POTENTIAL MAGNITUDE (Percentage of jurisdiction that can be affected):<br />
_ Catastrophic: More than 50%<br />
X Critical: 25% to 50%<br />
_ Limited: 10 to 25%<br />
_ Negligible: Less than 10%<br />
FREQUENCY OF OCCURRENCE:<br />
_ Highly Likely: Near 100% probability in next year<br />
X Likely: Between 10 and 100% probability in next year, or at least one chance in 10<br />
years<br />
_ Possible: Between 1 and 10% probability in next year or at least one chance in next<br />
100 years.<br />
_ Unlikely: Less than 1% probability in next 100 years<br />
SEASONAL PATTERN:<br />
Floods can occur anytime of the year; however, the most likely time of the year is in the<br />
spring due to winter thaw and spring rains.<br />
AREAS LIKELY TO BE AFFECTED MOST (BY SECTOR):<br />
Areas likely to be affected are areas designated on the Flood Insurance Rate Maps. Areas<br />
likely to be affected are dependent upon weather systems and storm track.<br />
PROBABLE DURATION:<br />
Duration of flood can last a few hours up to three or more months of inundation.<br />
POTENTIAL SPEED OF ONSET<br />
(Probable amount of warning time)<br />
X Minimal (or no) warning<br />
_ 6 to 12 hours warning<br />
_ 12 to 24 hours warning<br />
_ More than 24 hours warning<br />
EXISTING WARNING SYSTEMS: National Weather Service<br />
COMPLETE VULNERABILITY ANALYSIS: Based on a 100-year flood causing damage in 11%<br />
of the county (including Arnold, Byrnes Mill, Cedar Hill Lakes, Crystal City, DeSoto, Festus,<br />
Herculaneum, Kimmswick, Pevely, Scotsdale), in the developed portions of <strong>Jefferson</strong><br />
<strong>County</strong>, approximately 36,000 persons and 5,400 buildings valued at $$540 million dollars
A Regional Overview All-Hazard Mitigation Plan 145<br />
could be affected. In the undeveloped portions of the county, approximately 11,000<br />
persons, and 3,800 buildings values at $280 million dollars could be impacted.
146<br />
HAZARD: Dam Failure<br />
JEFFERSON COUNTY HAZARD PROFILE WORKSHEET<br />
POTENTIAL MAGNITUDE (Percentage of jurisdiction that can be affected):<br />
X Catastrophic: More than 50%<br />
_ Critical: 25% to 50%<br />
_ Limited: 10 to 25%<br />
_ Negligible: Less than 10%<br />
<strong>Jefferson</strong> <strong>County</strong> – Section 2<br />
FREQUENCY OF OCCURRENCE:<br />
_ Highly Likely: Near 100% probability in next year<br />
X Likely: Between 10 and 100% probability in next year, or at least one chance in 10<br />
years<br />
_ Possible: Between 1 and 10% probability in next year or at least one chance in next<br />
100 years.<br />
_ Unlikely: Less than 1% probability in next 100 years<br />
SEASONAL PATTERN:<br />
Dam failures would be related to seasonal patterns in terms the inability of a dam to<br />
withhold/withstand the deluge of a catastrophic rain event (spring rains) hitting a<br />
weakening dam infrastructure.<br />
AREAS LIKELY TO BE AFFECTED MOST (BY SECTOR):<br />
Areas most likely affected will be downstream from dams; torrential floodwaters from<br />
failed dam descending upon residential homes, businesses, schools, agricultural lands, and<br />
outbuildings.<br />
PROBABLE DURATION:<br />
By the nature of dam failures, the duration of the event will be instantaneous and the<br />
duration of the failure could last up approximately six hours dependent upon the size of<br />
the reservoir.<br />
POTENTIAL SPEED OF ONSET<br />
(Probable amount of warning time)<br />
X Minimal (or no) warning<br />
_ 6 to 12 hours warning<br />
_ 12 to 24 hours warning<br />
_ More than 24 hours warning<br />
EXISTING WARNING SYSTEMS:<br />
A few large Missouri dams have monitoring systems, emergency action plans and warning<br />
systems. However, most dams in Missouri do not.
A Regional Overview All-Hazard Mitigation Plan 147<br />
COMPLETE VULNERABILITY ANALYSIS: Based on a single dam failure causing damage in<br />
½% of the county, in the developed portion of the county, it has been estimated that<br />
approximately 1,050 persons and 250 buildings valued at $25 million dollars may be<br />
impacted from water inundation. In the undeveloped portion of the county, it has been<br />
estimated that approximately 200 persons and 75 buildings valued at $80,000 may be<br />
impacted from water inundation.
148<br />
HAZARD: Drought<br />
JEFFERSON COUNTY HAZARD PROFILE WORKSHEET<br />
POTENTIAL MAGNITUDE (Percentage of jurisdiction that can be affected):<br />
_ Catastrophic: More than 50%<br />
X Critical: 25% to 50%<br />
_ Limited: 10 to 25%<br />
_ Negligible: Less than 10%<br />
<strong>Jefferson</strong> <strong>County</strong> – Section 2<br />
FREQUENCY OF OCCURRENCE:<br />
_ Highly Likely: Near 100% probability in next year<br />
X Likely: Between 10 and 100% probability in next year, or at least one chance in 10<br />
years<br />
_ Possible: Between 1 and 10% probability in next year or at least one chance in next<br />
100 years.<br />
_ Unlikely: Less than 1% probability in next 100 years<br />
SEASONAL PATTERN: Droughts usually occur over an extended period of time, usually a<br />
season or more. Droughts can begin during any season in a year.<br />
AREAS LIKELY TO BE AFFECTED MOST (BY SECTOR):<br />
All areas will most likely to be affected by drought including agricultural, hydrologic<br />
(streamflow, reservoir, groundwater resources) impacts (associated uses including<br />
irrigation, recreation, navigation, hydropower/utilities, wildlife habitat).<br />
PROBABLE DURATION:<br />
Droughts have been known to last up to ten years in duration.<br />
POTENTIAL SPEED OF ONSET<br />
(Probable amount of warning time)<br />
The onset of drought is very slow.<br />
_ Minimal (or no) warning<br />
_ 6 to 12 hours warning<br />
_ 12 to 24 hours warning<br />
X More than 24 hours warning<br />
EXISTING WARNING SYSTEMS: Missouri Department of Natural Resources has a warning<br />
system in place.<br />
COMPLETE VULNERABILITY ANALYSIS: Based on regional drought statistics, the county<br />
could represent 1% of those damages. In the developed portion of the county, it was<br />
estimated that approximately 2,100 persons and 500 buildings/properties valued at $50
A Regional Overview All-Hazard Mitigation Plan 149<br />
million dollars could be impacted from the drought. In the undeveloped portion of the<br />
county, it was estimated that approximately 200 persons and 75 buildings/properties<br />
valued at $75,500 could be impacted from the drought.
150<br />
HAZARD: Wildland fires<br />
JEFFERSON COUNTY HAZARD PROFILE WORKSHEET<br />
POTENTIAL MAGNITUDE (Percentage of jurisdiction that can be affected):<br />
_ Catastrophic: More than 50%<br />
_ Critical: 25% to 50%<br />
_ Limited: 10 to 25%<br />
X Negligible: Less than 10%<br />
<strong>Jefferson</strong> <strong>County</strong> – Section 2<br />
FREQUENCY OF OCCURRENCE:<br />
_ Highly Likely: Near 100% probability in next year<br />
_ Likely: Between 10 and 100% probability in next year, or at least one chance in 10<br />
years<br />
X Possible: Between 1 and 10% probability in next year or at least one chance in next<br />
100 years.<br />
_ Unlikely: Less than 1% probability in next 100 years<br />
SEASONAL PATTERN:<br />
Typically occur in warm months of year. Commonly occurs when there has been little<br />
rainfall.<br />
AREAS LIKELY TO BE AFFECTED MOST (BY SECTOR):<br />
Areas most likely to be affected are in rural areas where buildings, homes are next to<br />
forest.<br />
PROBABLE DURATION:<br />
Wildland fires in Missouri are typically short lived due to the type of fuel and climatic<br />
conditions. Fires that do occur may last up a couple of days.<br />
POTENTIAL SPEED OF ONSET<br />
(Probable amount of warning time)<br />
X Minimal (or no) warning<br />
_ 6 to 12 hours warning<br />
_ 12 to 24 hours warning<br />
_ More than 24 hours warning<br />
EXISTING WARNING SYSTEMS: Local fire department.<br />
COMPLETE VULNERABILITY ANALYSIS:<br />
The EWGCC region is not vulnerable to wildland fires in Missouri are typically short lived<br />
due to the type of fuel and climatic conditions. Fires may concentrate near the grasses<br />
along roadsides or where rural homes are adjacent to forested areas. Based on a large
A Regional Overview All-Hazard Mitigation Plan 151<br />
wildfire causing damage in 1% of the county, in the developed portion of the county, it<br />
was estimated that approximately 1,050 people and 250 buildings valued at $25 billion<br />
dollars in damage could be impacted from a fire. In the undeveloped portion of the<br />
county, it was estimated that approximately 250 persons and 75 buildings valued at<br />
$79,000 dollars in damage could be impacted from a fire.
152<br />
HAZARD: Heat Wave<br />
JEFFERSON COUNTY HAZARD PROFILE WORKSHEET<br />
POTENTIAL MAGNITUDE (Percentage of jurisdiction that can be affected):<br />
_ Catastrophic: More than 50%<br />
X Critical: 25% to 50%<br />
_ Limited: 10 to 25%<br />
_ Negligible: Less than 10%<br />
<strong>Jefferson</strong> <strong>County</strong> – Section 2<br />
FREQUENCY OF OCCURRENCE:<br />
_ Highly Likely: Near 100% probability in next year<br />
X Likely: Between 10 and 100% probability in next year, or at least one chance in 10<br />
years<br />
_ Possible: Between 1 and 10% probability in next year or at least one chance in next<br />
100 years.<br />
_ Unlikely: Less than 1% probability in next 100 years<br />
SEASONAL PATTERN:<br />
Heat waves typically occur in the summer months of June, July and August.<br />
AREAS LIKELY TO BE AFFECTED MOST (BY SECTOR):<br />
Every sector of the entire planning region will be affected by a heat wave.<br />
PROBABLE DURATION:<br />
Heat wave occurrences have been known to last approximately one month.<br />
POTENTIAL SPEED OF ONSET<br />
(Probable amount of warning time)<br />
_ Minimal (or no) warning<br />
_ 6 to 12 hours warning<br />
X 12 to 24 hours warning<br />
_ More than 24 hours warning<br />
EXISTING WARNING SYSTEMS: National Weather Service<br />
COMPLETE VULNERABILITY ANALYSIS:<br />
The EWGCC region is extremely vulnerable to heat wave hazard based upon the summer<br />
weather characteristics; St. Louis has been included in the top five cities in the U.S. for<br />
having the largest number of heat related deaths. Based on regional heat wave statistics,<br />
the county could represent 5% of those damages. In the developed portion of the county,<br />
it was estimated that approximately 2,100 persons and 500 buildings valued at $49 million
A Regional Overview All-Hazard Mitigation Plan 153<br />
dollars could be impacted by a heat wave. In the undeveloped portion of the county, it<br />
was estimated that approximately 200 persons and 75 buildings valued at $79,000 dollars<br />
could be impacted by a heat wave.
154<br />
HAZARD: Tornado<br />
JEFFERSON COUNTY HAZARD PROFILE WORKSHEET<br />
POTENTIAL MAGNITUDE (Percentage of jurisdiction that can be affected):<br />
_ Catastrophic: More than 50%<br />
_ Critical: 25% to 50%<br />
_ Limited: 10 to 25%<br />
X Negligible: Less than 10%<br />
<strong>Jefferson</strong> <strong>County</strong> – Section 2<br />
FREQUENCY OF OCCURRENCE:<br />
_ Highly Likely: Near 100% probability in next year<br />
X Likely: Between 10 and 100% probability in next year, or at least one chance in 10<br />
years<br />
_ Possible: Between 1 and 10% probability in next year or at least one chance in next<br />
100 years.<br />
_ Unlikely: Less than 1% probability in next 100 years<br />
SEASONAL PATTERN: Tornadoes normally occur in the spring and early summer<br />
months.<br />
AREAS LIKELY TO BE AFFECTED MOST (BY SECTOR):<br />
Areas most likely to be affected are dependent upon weather system and storm track.<br />
PROBABLE DURATION: Tornadoes move through at an average speed on 30 miles per<br />
hour.<br />
POTENTIAL SPEED OF ONSET<br />
(Probable amount of warning time)<br />
X Minimal (or no) warning<br />
_ 6 to 12 hours warning<br />
_ 12 to 24 hours warning<br />
_ More than 24 hours warning<br />
EXISTING WARNING SYSTEMS:<br />
National Weather System and tornado weather sirens.<br />
COMPLETE VULNERABILITY ANALYSIS:<br />
The EWGCC region is extremely vulnerable for tornado hazards, with 115 total tornadoes<br />
recorded by the National Weather Service. St. Louis has a history of six F4 devastating<br />
tornadoes. This analysis is based on an F4 tornado causing damage in 5% of the county.<br />
In the developed portion of the county, it was estimated that 10,500 persons and 2,500<br />
buildings valued at $245 million dollars could be affected by this disaster. In the
A Regional Overview All-Hazard Mitigation Plan 155<br />
undeveloped portion of the county, it was estimated that 4,500 persons and 1,750<br />
buildings valued at $131million dollars could be affected by this disaster.
156<br />
HAZARD: Winter Weather<br />
JEFFERSON COUNTY HAZARD PROFILE WORKSHEET<br />
POTENTIAL MAGNITUDE (Percentage of jurisdiction that can be affected):<br />
_ Catastrophic: More than 50%<br />
_ Critical: 25% to 50%<br />
X Limited: 10 to 25%<br />
_ Negligible: Less than 10%<br />
<strong>Jefferson</strong> <strong>County</strong> – Section 2<br />
FREQUENCY OF OCCURRENCE:<br />
_ Highly Likely: Near 100% probability in next year<br />
X Likely: Between 10 and 100% probability in next year, or at least one chance in 10<br />
years<br />
_ Possible: Between 1 and 10% probability in next year or at least one chance in next<br />
100 years.<br />
_ Unlikely: Less than 1% probability in next 100 years<br />
SEASONAL PATTERN: Late fall, winter and early spring months<br />
AREAS LIKELY TO BE AFFECTED MOST (BY SECTOR):<br />
Areas most likely to be affected are dependent upon weather patterns and track of storms.<br />
PROBABLE DURATION: Two to three days<br />
POTENTIAL SPEED OF ONSET<br />
(Probable amount of warning time)<br />
_ Minimal (or no) warning<br />
_ 6 to 12 hours warning<br />
_ 12 to 24 hours warning<br />
X More than 24 hours warning<br />
EXISTING WARNING SYSTEMS: National Weather Service<br />
COMPLETE VULNERABILITY ANALYSIS: This analysis is based on regional severe winter<br />
statistics; the analysis assumes that the county could represent 1% of those damages. In<br />
the developed portion of the county, it was estimated that approximately 2,100 persons<br />
and 500 buildings valued at $50 million dollars could be affected by this disaster. In the<br />
undeveloped portion of the county, it was estimated that approximately 3 persons and<br />
1building valued at $1million dollars could be affected by this disaster.
A Regional Overview All-Hazard Mitigation Plan 157<br />
RISK ASSESSMENT WORKSHEET- JEFFERSON COUNTY<br />
Dam Failure<br />
Sector Essential Facilities at Risk<br />
Buildings downstream from failed dam<br />
Population at Risk<br />
Individuals living downstream from dams<br />
that are failing<br />
Infrastructure at Risk<br />
Roads, bridges, utilities<br />
Property at Risk<br />
Expected Extent of Percent of Sector<br />
Damage<br />
Property<br />
Drought<br />
Catastrophic- in areas<br />
affected, damage could<br />
be catastrophic in path<br />
of released waters<br />
Critical 5<br />
Limited-topographically<br />
10<br />
higher areas<br />
Negligible 80<br />
RISK ASSESSMENT WORKSHEET- JEFFERSON COUNTY<br />
Sector Essential Facilities at Risk<br />
All essential facilities that depend on water<br />
will be at risk.<br />
Population at Risk<br />
In severe drought, entire population living<br />
and working in <strong>Jefferson</strong> <strong>County</strong>, the health<br />
and welfare of humans and animals is at risk.<br />
Infrastructure at Risk<br />
Entire infrastructure pertaining to water<br />
supply, water treatment, utility operations<br />
will be affected.<br />
Property at Risk<br />
Expected Extent of<br />
Percent of Sector<br />
Damage<br />
Property<br />
Catastrophic- 45<br />
45<br />
Critical-Damage to<br />
essential facilities,<br />
5
158<br />
Drought<br />
RISK ASSESSMENT WORKSHEET- JEFFERSON COUNTY<br />
population,<br />
infrastructure,<br />
agricultural industry will<br />
be critical to catastrophic<br />
Limited 5<br />
Negligible 5<br />
RISK ASSESSMENT WORKSHEET- JEFFERSON COUNTY<br />
Earthquake<br />
Flood<br />
<strong>Jefferson</strong> <strong>County</strong> – Section 2<br />
Sector Essential Facilities at Risk<br />
Worst case scenario-older buildings or those<br />
not constructed to building code, near total<br />
devastation from New Madrid earthquake<br />
Population at Risk<br />
Entire population at risk in older buildings or<br />
those not constructed to building code<br />
Infrastructure at Risk<br />
Entire infrastructure at risk in older facilities<br />
or those not constructed to building code<br />
Property at Risk<br />
Expected Extent of Percent of Sector<br />
Damage<br />
Property<br />
Catastrophic-near total<br />
45<br />
devastation<br />
Critical 45<br />
Limited 5<br />
Negligible 5<br />
RISK ASSESSMENT WORKSHEET- JEFFERSON COUNTY<br />
Sector Essential Facilities at Risk<br />
Those facilities in low lying areas within 100<br />
or 500 year floodplains not constructed to<br />
building code.<br />
Population at Risk
A Regional Overview All-Hazard Mitigation Plan 159<br />
Flood<br />
RISK ASSESSMENT WORKSHEET- JEFFERSON COUNTY<br />
Those living and working in low lying areas<br />
within 100 or 500-year floodplains in<br />
buildings not constructed to building code.<br />
Infrastructure at Risk<br />
Infrastructure in poor condition or located in<br />
low-lying areas within 100 or 500-year<br />
floodplains in facilities not constructed to<br />
building code.<br />
Property at Risk<br />
Expected Extent of<br />
Damage<br />
Catastrophic<br />
Critical<br />
Percent of Sector<br />
Property<br />
Limited-11% 11% area of county<br />
subject to flooding risk<br />
to 100-year event<br />
Negligible 89%<br />
RISK ASSESSMENT WORKSHEET- JEFFERSON COUNTY<br />
Heat Wave<br />
Sector Essential Facilities at Risk<br />
All facilities affected by heat (no air<br />
conditioning) are at risk<br />
Population at Risk<br />
Entire population at risk; elderly, young, ill,<br />
homeless people<br />
Infrastructure at Risk<br />
All infrastructure affected by heat (roads,<br />
bridges, rail lines) is at risk<br />
Property at Risk<br />
Expected Extent of Percent of Sector<br />
Damage<br />
Property<br />
Catastrophic-limited to Approximately 14%<br />
elderly, ill population<br />
Critical 3<br />
Limited 3<br />
Negligible 80
160<br />
Tornado<br />
RISK ASSESSMENT WORKSHEET- JEFFERSON COUNTY<br />
<strong>Jefferson</strong> <strong>County</strong> – Section 2<br />
Sector Essential Facilities at Risk<br />
Buildings in path of storm not constructed to<br />
building code.<br />
Population at Risk<br />
Populations that do not have safe rooms to<br />
seek refuge<br />
Infrastructure at Risk<br />
Infrastructure in path of storm<br />
Property at Risk<br />
Expected Extent of<br />
Damage<br />
Catastrophic-in path of<br />
storm; dependent upon<br />
magnitude of storm,<br />
damage could be<br />
catastrophic<br />
Critical-in path of storm;<br />
dependent upon<br />
magnitude of storm,<br />
damage could be critical<br />
Limited-in path of storm;<br />
dependent upon<br />
magnitude of storm,<br />
damage could be limited<br />
Negligible-in path of<br />
storm; dependent upon<br />
magnitude of storm,<br />
damage could be<br />
negligible<br />
Percent of Sector<br />
Property<br />
1%<br />
4%<br />
5%<br />
90%<br />
RISK ASSESSMENT WORKSHEET- JEFFERSON COUNTY<br />
Wildland Fire<br />
Sector Essential Facilities at Risk<br />
Buildings in path of fire may be burned<br />
Population at Risk<br />
Residents living and working near forested<br />
areas<br />
Infrastructure at Risk<br />
May burn utility lines<br />
Property at Risk
A Regional Overview All-Hazard Mitigation Plan 161<br />
RISK ASSESSMENT WORKSHEET- JEFFERSON COUNTY<br />
Wildland Fire<br />
Expected Extent of<br />
Damage<br />
Catastrophic<br />
Critical<br />
Percent of Sector<br />
Property<br />
Limited 1<br />
99<br />
Negligible-wildfires<br />
possible, limited to<br />
negligible magnitude<br />
RISK ASSESSMENT WORKSHEET- JEFFERSON COUNTY<br />
Winter Weather<br />
Sector Essential Facilities at Risk<br />
Some buildings in path of storm may have<br />
power outages.<br />
Population at Risk<br />
Dependent upon where storm hits, entire<br />
population, especially those who work<br />
outdoors, drive for a living, homeless people.<br />
Infrastructure at Risk<br />
Utility poles downed by ice storms; roads,<br />
bridges impassible<br />
Property at Risk<br />
Expected Extent of<br />
Damage<br />
Percent of Sector<br />
Property<br />
Catastrophic 1%<br />
Critical 1%<br />
Limited 90%<br />
Negligible 8%
162<br />
RISK INDEX WORKSHEET- <strong>Jefferson</strong> <strong>County</strong><br />
HAZARD FREQUENCY MAGNITUDE WARNING<br />
TIME<br />
Dam<br />
Failure<br />
Drought<br />
Highly likely4<br />
Likely3<br />
Possible2<br />
Unlikely1<br />
Highly likely4<br />
Likely3<br />
Possible2<br />
Unlikely1<br />
Earthquake Highly likely4<br />
Likely3<br />
Possible2<br />
Unlikely1<br />
Flood<br />
Highly likely4<br />
Likely3<br />
Possible2<br />
Unlikely1<br />
Heat Wave Highly likely4<br />
Likely3<br />
Possible2<br />
Unlikely1<br />
Tornado<br />
Wildland<br />
Fire<br />
Winter<br />
Weather<br />
Highly likely4<br />
Likely3<br />
Possible2<br />
Unlikely1<br />
Highly likely4<br />
Likely3<br />
Possible2<br />
Unlikely1<br />
Highly likely4<br />
Likely3<br />
Possible2<br />
Unlikely1<br />
Catastrophic4<br />
Critical3<br />
Limited2<br />
Negligible1<br />
Catastrophic<br />
Critical3<br />
Limited2<br />
Negligible1<br />
Catastrophic4<br />
Critical3<br />
Limited2<br />
Negligible1<br />
Catastrophic4<br />
Critical3<br />
Limited2<br />
Negligible1<br />
Catastrophic4<br />
Critical3<br />
Limited2<br />
Negligible1<br />
Catastrophic4<br />
Critical3<br />
Limited2<br />
Negligible1<br />
Catastrophic4<br />
Critical3<br />
Limited2<br />
Negligible1<br />
Catastrophic4<br />
Critical3<br />
Limited2<br />
Negligible1<br />
Ranking is top bold number<br />
Score is bottom number<br />
Minimal4<br />
6-12 hours<br />
12-24<br />
hours<br />
24+ hours1<br />
Minimal4<br />
6-12 hours<br />
12-24<br />
hours<br />
24+ hours1<br />
Minimal4<br />
6-12 hours<br />
12-24<br />
hours<br />
24+ hours1<br />
Minimal4<br />
6-12 hours<br />
12-24<br />
hours<br />
24+ hours1<br />
Minimal4<br />
6-12 hours<br />
12-24<br />
hours<br />
24+ hours1<br />
Minimal4<br />
6-12 hours<br />
12-24<br />
hours<br />
24+ hours1<br />
Minimal4<br />
6-12 hours<br />
12-24<br />
hours<br />
24+ hours1<br />
Minimal4<br />
6-12 hours<br />
12-24<br />
hours<br />
24+ hours1<br />
<strong>Jefferson</strong> <strong>County</strong> – Section 2<br />
SEVERITY SPECIAL<br />
CHARACTERISTICS<br />
& PLANNING<br />
Catastrophic4<br />
Critical3<br />
Limited2<br />
Negligible1<br />
Catastrophic4<br />
Critical3<br />
Limited2<br />
Negligible1<br />
Catastrophic4<br />
Critical3<br />
Limited2<br />
Negligible1<br />
Catastrophic4<br />
Critical3<br />
Limited2<br />
Negligible1<br />
Catastrophic4<br />
Critical3<br />
Limited2<br />
Negligible1<br />
Catastrophic4<br />
Critical3<br />
Limited2<br />
Negligible1<br />
Catastrophic4<br />
Critical3<br />
Limited2<br />
Negligible1<br />
Catastrophic4<br />
Critical3<br />
Limited2<br />
Negligible1<br />
CONSIDERATIONS<br />
RISK<br />
PRIORITY<br />
2<br />
11<br />
4<br />
8<br />
1<br />
14<br />
2<br />
11<br />
5<br />
7<br />
2<br />
11<br />
4<br />
8<br />
3<br />
9
A Regional Overview All-Hazard Mitigation Plan 163<br />
TORNADO: JEFFERSON COUNTY VULNERABILITY ASSESSMENT<br />
(The estimates below are based on an F4 tornado causing damage in 5% of the county.)<br />
DEVELOPED LAND UNDEVELOPED LAND<br />
# of<br />
# of # of<br />
# of People Buildings Approx. Value People Buildings Approx. Value<br />
Residential 5,725 2,260 $160,295,000 4,200 1,725 $125,000,000<br />
Commercial / Industrial 2,040 140 $44,470,000 230 15 $5,065,000<br />
Key Non-profit public service facilities 15 1 $250,000 N.A. N.A. N.A.<br />
Public buildings and critical facilities 30 2 $500,000 N.A. N.A. N.A.<br />
Sewage treatment plant N.A. 1 $100,000 N.A. N.A. N.A.<br />
Water treatment plant N.A. N.A. N.A. N.A. N.A. N.A.<br />
Roads N.A. N.A. $2,500,000 N.A. N.A. $192,500<br />
Police 4 1 $180,000 N.A. N.A. N.A.<br />
Fire 3 1 $150,000 N.A. N.A. N.A.<br />
Schools/colleges 2,000 5 $22,925,500 N.A. N.A. N.A.<br />
Utilities/communications 25 1 $1,000,000 N.A. N.A. $305,000.<br />
Hospital/medical/dental 30 1 $1,180,000 N.A. N.A. N.A.<br />
Nursing homes 160 2 $2,298,750 N.A. N.A. N.A.<br />
Hazardous facilities N.A. N.A. N.A. N.A. N.A. N.A.<br />
Other county, state, and federal government 450 30 $9,000,000 N.A. N.A. N.A.<br />
TOTAL 10,482 2445 $242,849,250 4430 1740 $130,562,500<br />
Note: Emergency shelters (see key non-profits)<br />
The entire county is vulnerable to tornado and severe thunderstorm hazards. Data limitations: Because of the timeframe and time limitations of<br />
this project, GIS analysis in <strong>Jefferson</strong> <strong>County</strong> was conducted using an interim product/"work in progress" property map and database; due to<br />
georeferencing shortcomings and attribute data limitations, results were incomplete. MDNR is updating Hazardous Waste Facilities locations and data.
164<br />
FLOOD: JEFFERSON COUNTY VULNERABILITY ASSESSMENT<br />
(The estimates below are based on a 100-year flood causing damage in 11% of the county)<br />
<strong>Jefferson</strong> <strong>County</strong> – Section 2<br />
DEVELOPED LAND UNDEVELOPED LAND<br />
# of<br />
# of<br />
# of People Buildings Approx. Value # of People Buildings Approx. Value<br />
Residential 12,600 5,000 $352,650,000 10,130 3,805 $270,000,000<br />
Commercial / Industrial 4500 300 $98,500,000 510 35 $12,000,000<br />
Key Non-profit public service facilities 35 2 $550,000 N.A. N. A. N.A.<br />
Public buildings and critical facilities 70 4 $110,000 N.A. N. A. N.A.<br />
Sewage treatment plant 150 1 $220,000 N.A. N. A. N.A.<br />
Water treatment plant 150 1 $220,000 N.A. N. A. N.A.<br />
Roads N.A. N.A. $5,475,000 N.A. N. A. $415,000<br />
Police 10 1 $400,000 N.A. N. A. N.A.<br />
Fire 7 1 $330,000 N.A. N. A. N.A.<br />
Schools/colleges 4,500 15 $50,450,000 N.A. N. A. N.A.<br />
Utilities/communications 55 2 $2,200,000 N.A. N. A. $670,000<br />
Hospital/medical/dental 70 1 $2,600,000 N.A. N. A. N.A.<br />
Nursing/disability homes 360 4 $5,100,000 N.A. N. A. N.A.<br />
Hazardous facilities N.A. N.A. N.A. N.A. N. A. N.A.<br />
Other county, state, and federal government 1,000 65 $19,800,000 N.A. N. A. N.A.<br />
TOTAL 36,437 5,397 $538,605,000 10,640 3840 $283,085,000<br />
Note: Emergency shelters (see key non-profits)<br />
Specific riverine and/or flash flood hazard areas include the Meramec, Mississippi Rivers. Data llimitations: Because of the timeframe and time<br />
limitations of this project, GIS analysis in <strong>Jefferson</strong> <strong>County</strong> was conducted using an interim product/"work in progress" property map and database; due<br />
to georeferencing shortcomings and attribute data limitations, results were incomplete. MDNR is updating Hazardous Waste Facilities locations and<br />
data.
A Regional Overview All-Hazard Mitigation Plan 165<br />
SEVERE WINTER STORM: JEFFERSON COUNTY VULNERABILITY ASSESSMENT<br />
(Using regional severe winter statistics, the county could represent 1% of those damages.)<br />
DEVELOPED LAND UNDEVELOPED LAND<br />
# of<br />
# of<br />
SEVERE WINTER STORM # of People Buildings Approx. Value # of People Buildings Approx. Value<br />
Residential 1145 450 $32,060,700 3 1 $71,000<br />
Commercial / Industrial 410 30 $8,950,200 0 0 0<br />
Key Non-profit public service facilities 3 1 $50,000 0 0 0<br />
Public buildings and critical facilities 6 1 $100,000 0 0 0<br />
Sewage treatment plant 5 1 $20,000 0 0 0<br />
Water treatment plant 0 0 0 0 0 0<br />
Roads 0 0 $498,800 0 0 0<br />
Police 1 1 $36,000 0 0 0<br />
Fire 1 1 $30,000 0 0 0<br />
Schools/colleges 400 1 $4,585,100 0 0 0<br />
Utilities/communications 5 1 $200,000 0 0 $865,000<br />
Hospital/medical/dental 6 1 $235,500 0 0 0<br />
Nursing/disability homes 30 1 $459,750 0 0 0<br />
Hazardous facilities 0 0 0 0 0 0<br />
Other county, state, and federal government 90 6 $1,800,000 0 0 0<br />
TOTAL 2102 495 $49,026,050 3 1 $936,000<br />
Note: Emergency shelters (see key non-profits)<br />
The entire county is vulnerable to severe winter storm hazards. Data llimitations: Because of the timeframe and time limitations of this project, GIS<br />
analysis in <strong>Jefferson</strong> <strong>County</strong> was conducted using an interim product/"work in progress" property map and database; due to georeferencing<br />
shortcomings and attribute data limitations, results were incomplete. MDNR is updating Hazardous Waste Facilities locations and data.
166<br />
<strong>Jefferson</strong> <strong>County</strong> – Section 2<br />
DROUGHT: JEFFERSON COUNTY VULNERABILITY ASSESSMENT<br />
(Using regional drought statistics, the county could represent 1% of those damages.)<br />
DEVELOPED LAND UNDEVELOPED LAND<br />
# of People<br />
# of<br />
Buildings Approx. Value # of People<br />
# of<br />
Buildings<br />
Approx.<br />
Value<br />
Residential and/or agricultural 1145 450 $32,060,700 195 75 $38,000<br />
Commercial / Industrial 410 30 $8,950,200 0 0 $40,500<br />
Key Non-profit public service facilities 3 1 $50,000 N.A. N. A. N.A.<br />
Public buildings and critical facilities 6 1 $100,000 N.A. N. A. N.A.<br />
Sewage treatment plant 5 1 $20,000 N.A. N. A. N.A.<br />
Water treatment plant 0 0 0 N.A. N. A. N.A.<br />
Roads 0 0 $498,800 N.A. N. A. N.A.<br />
Police 1 1 $36,000 N.A. N. A. N.A.<br />
Fire 1 1 $30,000 N.A. N. A. N.A.<br />
Schools/colleges 400 1 $4,585,100 N.A. N. A. N.A.<br />
Utilities/communications 5 1 $200,000 N.A. N. A. N.A.<br />
Hospital/medical/dental 6 1 $235,500 N.A. N. A. N.A.<br />
Nursing/disability homes 30 1 $459,750 N.A. N. A. N.A.<br />
Hazardous facilities 0 0 0 N.A. N. A. N.A.<br />
Other county, state, and federal government 90 6 $1,800,000 N.A. N. A. N.A.<br />
TOTAL 2102 495 $49,026,050 195 75 $75,500<br />
Note: Emergency shelters (see key non-profits)<br />
The entire county is vulnerable to the effects of drought. Data llimitations: Because of the timeframe and time limitations of this project, GIS analysis in<br />
<strong>Jefferson</strong> <strong>County</strong> was conducted using an interim product/"work in progress" property map and database; due to georeferencing shortcomings and<br />
attribute data limitations, results were incomplete. MDNR is updating Hazardous Waste Facilities locations and data.
A Regional Overview All-Hazard Mitigation Plan 167<br />
HEAT WAVE: JEFFERSON COUNTY VULNERABILITY ASSESSMENT<br />
(Using regional heat wave statistics, the county could represent 1% of those damages.)<br />
DEVELOPED LAND UNDEVELOPED LAND<br />
# of<br />
# of Approx.<br />
# of People Buildings Approx. Value # of People Buildings Value<br />
Residential 1145 450 $32,060,700 195 75 $38,000<br />
Commercial / Industrial 410 30 $8,950,200 0 0 $40,500<br />
Key Non-profit public service facilities 3 1 $50,000 N.A. N.A. N.A.<br />
Public buildings and critical facilities 6 1 $100,000 N.A. N.A. N.A.<br />
Sewage treatment plant 5 1 $20,000 N.A. N.A. N.A.<br />
Water treatment plant 0 0 0 N.A. N.A. N.A.<br />
Roads 0 0 $498,800 N.A. N.A. N.A.<br />
Police 1 1 $36,000 N.A. N.A. N.A.<br />
Fire 1 1 $30,000 N.A. N.A. N.A.<br />
Schools/colleges 400 1 $4,585,100 N.A. N.A. N.A.<br />
Utilities/communications 5 1 $200,000 N.A. N.A. N.A.<br />
Hospital/medical/dental 6 1 $235,500 N.A. N.A. N.A.<br />
Nursing/disability homes 30 1 $459,750 N.A. N.A. N.A.<br />
Hazardous facilities N.A. N.A. N.A. N.A. N.A. N.A.<br />
Other county, state, and federal government 90 6 $1,800,000 N.A. N.A. N.A.<br />
TOTAL 2102 495 $49,026,050 195 75 $78,500<br />
Note: Emergency shelters (see key non-profits and schools)<br />
The entire county is vulnerable to the effects of heat wave. Data llimitations: Because of the timeframe and time limitations of this project, GIS analysis<br />
in <strong>Jefferson</strong> <strong>County</strong> was conducted using an interim product/"work in progress" property map and database; due to georeferencing shortcomings and<br />
attribute data limitations, results were incomplete. MDNR is updating Hazardous Waste Facilities locations and data.
168<br />
EARTHQUAKE: JEFFERSON COUNTY VULNERABILITY ASSESSMENT<br />
(Based on a Level VII earthquake causing damage in 80% of the county)<br />
<strong>Jefferson</strong> <strong>County</strong> – Section 2<br />
DEVELOPED LAND UNDEVELOPED LAND<br />
# of<br />
# of Approx.<br />
# of People Buildings Approx. Value # of People Buildings Value<br />
Residential 70,000 28,000 $2,000,000,000 51,700 20,800 $1,470,000,000<br />
Commercial / Industrial 24,480 1,600 $536,775,000 2,750 180 $60,800,000<br />
Key Non-profit public service facilities 180 15 $3,000,000 N.A. N. A. N.A.<br />
Public buildings and critical facilities 360 25 $6,000,000 N.A. N. A. N.A.<br />
Sewage treatment plant 1090 2 $1,200,000 N.A. N. A. N.A.<br />
Water treatment plant N.A. N.A. N.A. N.A. N. A. N.A.<br />
Roads - - $30,000,000 N.A. N. A. $2,280,000<br />
Police 50 2 $2,160,000 N.A. N. A. N.A.<br />
Fire 40 2 $1,800,000 N.A. N. A. N.A.<br />
Schools/colleges 25,000 60 $275,110,000 N.A. N. A. N.A.<br />
Utilities/communications 300 15 $12,000,000 N.A. N. A. $3,650,000<br />
Hospital/medical/dental 375 1 $14,135,000 N.A. N. A. N.A.<br />
Nursing/disability homes 2000 25 $30,000,000 N.A. N. A. N.A.<br />
Hazardous facilities 0 0 0 N.A. N. A. N.A.<br />
Other county, state, and federal government 5,400 360 $108,000,000 N.A. N. A. N.A.<br />
TOTAL 129,275 30,107 $3,050,180,000 54,450 20,980 $1,536,730,000<br />
Note: Emergency shelters (see key non-profits)<br />
The entire county is vulnerable to critical damage severity due to earthquake hazards. The eastern portion of the county is especially vulnerable to the<br />
threat of liquefaction due to the alluvial soils in the Mississippi River. Data llimitations: Because of the timeframe and time limitations of this project, GIS<br />
analysis in <strong>Jefferson</strong> <strong>County</strong> was conducted using an interim product/"work in progress" property map and database; due to georeferencing<br />
shortcomings and attribute data limitations, results were incomplete. MDNR is updating Hazardous Waste Facilities locations and data.
A Regional Overview All-Hazard Mitigation Plan 169<br />
DAM FAILURE: JEFFERSON COUNTY VULNERABILITY ASSESSMENT<br />
(Based on a single dam failure causing damage in 1/2% of the county)<br />
DEVELOPED LAND UNDEVELOPED LAND<br />
# of People<br />
# of<br />
Buildings Approx. Value # of People<br />
# of<br />
Buildings<br />
Approx.<br />
Value<br />
Residential 570 225 $16,025,350 195 75 $38,000<br />
Commercial / Industrial 200 15 $4,475,100 0 0 $40,500<br />
Key Non-profit public service facilities 1 1 $25,000 N.A. N.A. N.A.<br />
Public buildings and critical facilities 3 1 $50,000 N.A. N.A. N.A.<br />
Sewage treatment plant 2 1 $10,000 N.A. N.A. N.A.<br />
Water treatment plant 0 0 0 N.A. N.A. N.A.<br />
Roads 0 0 $250,000 N.A. N.A. N.A.<br />
Police 1 1 $18,000 N.A. N.A. N.A.<br />
Fire 1 1 $15,000 N.A. N.A. N.A.<br />
Schools/colleges 200 1 $2,292,550 N.A. N.A. N.A.<br />
Utilities/communications 2 1 $100,000 N.A. N.A. N.A.<br />
Hospital/medical/dental 3 1 $117,750 N.A. N.A. N.A.<br />
Nursing/disability homes 15 1 $229,875 N.A. N.A. N.A.<br />
Hazardous facilities 0 0 0 N.A. N.A. N.A.<br />
Other county, state, and federal government 45 3 $900,000 N.A. N.A. N.A.<br />
TOTAL 1043 252 $24,508,625 195 75 $78,500<br />
Note: Emergency shelters (see key non-profits)<br />
Data llimitations: Because of the timeframe and time limitations of this project, GIS analysis in <strong>Jefferson</strong> <strong>County</strong> was conducted using an interim<br />
product/"work in progress" property map and database; due to georeferencing shortcomings and attribute data limitations, results were incomplete.<br />
MDNR is updating Hazardous Waste Facilities locations and data.
170<br />
WILDFIRE: JEFFERSON COUNTY VULNERABILITY ASSESSMENT<br />
(Based on a large wildfire causing damage in 1% of the county.)<br />
<strong>Jefferson</strong> <strong>County</strong> – Section 2<br />
DEVELOPED LAND UNDEVELOPED LAND<br />
# of<br />
# of Approx.<br />
WILDFIRE # of People Buildings Approx. Value # of People Buildings Value<br />
Residential 570 225 $16,025,350 195 75 $38,000<br />
Commercial / Industrial 200 15 $4,475,100 0 0 $40,500<br />
Key Non-profit public service facilities 1 1 $25,000 N.A. N.A. N.A.<br />
Public buildings and critical facilities 3 1 $50,000 N.A. N.A. N.A.<br />
Sewage treatment plant 2 1 $10,000 N.A. N.A. N.A.<br />
Water treatment plant 0 0 0 N.A. N.A. N.A.<br />
Roads 0 0 $250,000 N.A. N.A. N.A.<br />
Police 1 1 $18,000 N.A. N.A. N.A.<br />
Fire 1 1 $15,000 N.A. N.A. N.A.<br />
Schools/colleges 200 1 $2,292,550 N.A. N.A. N.A.<br />
Utilities/communications 2 1 $100,000 N.A. N.A. N.A.<br />
Hospital/medical/dental 3 1 $117,750 N.A. N.A. N.A.<br />
Nursing/disability homes 15 1 $229,875 N.A. N.A. N.A.<br />
Hazardous facilities 0 0 0 N.A. N.A. N.A.<br />
Other county, state, and federal government 45 3 $900,000 N.A. N.A. N.A.<br />
TOTAL 1043 252 $24,508,625 195 75 $78,500<br />
Note: Emergency shelters (see key non-profits)<br />
There is a very low threat of wildfire across the county. Data llimitations: Because of the timeframe and time limitations of this project, GIS analysis in<br />
<strong>Jefferson</strong> <strong>County</strong> was conducted using an interim product/"work in progress" property map and database; due to georeferencing shortcomings and<br />
attribute data limitations, results were incomplete. MDNR is updating Hazardous Waste Facilities locations and data.
A Regional Overview All-Hazard Mitigation Plan 171<br />
Combined Totals Represent All Natural<br />
Hazards Occurring in <strong>Jefferson</strong> <strong>County</strong><br />
TOTAL JEFFERSON COUNTY VULNERABILITY SUMMARY<br />
DEVELOPED LAND UNDEVELOPED LAND<br />
Total # Total #<br />
# of<br />
of of Total Approx. Critical<br />
People Buildings Value Facilities<br />
Total #<br />
of<br />
People<br />
Total # of Total Approx.<br />
Buildings Value<br />
# of<br />
Critical<br />
Facilities<br />
Residential 92,900 37,060 $2,641,177,800 185 66,813 26,561 $1,865,223,000 132<br />
Commercial / Industrial 32,650 2160 $715,545,800 10 920 230 $78,027,000 1<br />
Key Non-profit public service facilities 241 23 $4,000,000 1 N.A. N.A. N.A. N.A.<br />
Public buildings and critical facilities 483 36 $701,000 1 N.A. N.A. N.A. N.A.<br />
Sewage treatment plant 1259 9 $1,600,000 1 N.A. N.A. N.A. N.A.<br />
Water treatment plant 1240 3 $1,420,000 1 N.A. N.A. N.A. N.A.<br />
Roads - - $39,971,400 - N.A. N.A. $2,887,500 N.A.<br />
Police 69 9 $2,884,000 1 N.A. N.A. N.A. N.A.<br />
Fire 55 9 $2,400,000 1 N.A. N.A. N.A. N.A.<br />
Schools/colleges 33,700 85 $366,825,900 1 N.A. N.A. N.A. N.A.<br />
Utilities/communications 399 23 $16,000,000 1 N.A. N.A. $5,490,000 1<br />
Hospital/medical/dental 499 8 $18,857,000 1 N.A. N.A. N.A. N.A.<br />
Nursing/disability homes 2640 36 $39,237,750 3 N.A. N.A. N.A. N.A.<br />
Hazardous facilities N.A. N.A. N.A. N.A. N.A. N.A. N.A. N.A.<br />
Other county, state, and federal government 7210 476 $124,200,000 2 N.A. N.A. N.A. N.A.<br />
TOTAL 173,345 39,940 $3,938,846,394 210 67,733 26,791 $1,951,627,500 134<br />
Note: Emergency shelters (see key non-profits)<br />
Data llimitations: Because of the timeframe and time limitations of this project, GIS analysis in <strong>Jefferson</strong> <strong>County</strong> was conducted using an interim<br />
product/"work in progress" property map and database; due to georeferencing shortcomings and attribute data limitations, results were incomplete.<br />
MDNR is updating Hazardous Waste Facilities locations and data.
A Regional Overview All-Hazard Mitigation Plan<br />
SECTION 3<br />
<strong>County</strong> Capability Assessment<br />
Mitigation Management Policies<br />
The <strong>Jefferson</strong> <strong>County</strong> Emergency Management Agency is charged with preparing for<br />
disasters. That duty includes advising the <strong>County</strong> Commission on mitigation measures and<br />
implementing those measures deemed appropriate by the Commission. In general, the<br />
<strong>County</strong>’s policies encourage cooperation and coordination within the <strong>Jefferson</strong> <strong>County</strong><br />
agencies; as well as cooperation, including mutual aid compacts, between neighboring<br />
counties and the municipalities within <strong>Jefferson</strong> <strong>County</strong>. The Emergency Operations Plan<br />
(EOP) provides for an integrated countywide emergency preparedness and response plan,<br />
utilizing public, nonprofit, and private resources.<br />
Existing Plans<br />
The <strong>County</strong> has recently completed the <strong>Jefferson</strong> <strong>County</strong> Official Master Plan with the<br />
anticipation that it will be formally adopted in the near future. The Plan was developed to<br />
provide the framework for planned supportable growth, including promoting best practice<br />
policies relating to stormwater and floodplain management. The Plan identifies a Preferred<br />
Growth Alternative, with the intent to “achieve a balance of growth with preservation of<br />
existing natural features and protection of the rural character of the county.” In general,<br />
growth will be targeted around currently developed areas, utilizing existing transportation<br />
corridors and extending utility and transportation infrastructure in a logical and progressive<br />
manner, thereby ensuring capacity to service new development.<br />
The <strong>County</strong>’s Emergency Operations Plan (EOP) is approved by the <strong>County</strong> Commission.<br />
The Plan identifies facilities and resources that require special security during a disaster;<br />
promotes the development and maintenance of mutual aid agreements with nearby<br />
agencies; requires participation in drills and exercises; identifies human and capital<br />
resources available throughout the county for disaster response; and includes an<br />
evacuation plan. The EOP includes hazard mitigation measures and a damage assessment<br />
plan.<br />
Mitigation Programs<br />
The main mitigation programs are the <strong>County</strong>’s floodplain management regulations and<br />
participation in and administration of the National Flood Insurance Program (NFIP). The<br />
county coordinates with Mississippi River levee districts through the U.S. Corps of<br />
Engineers. Additional programs include the following:<br />
• The <strong>County</strong>’s floodplain regulations are aimed at restricting any new development in<br />
the floodplain. The current ordinance requires two feet of additional freeboard for<br />
1
2<br />
<strong>Jefferson</strong> <strong>County</strong> – Section 3<br />
new structures and requires an increase, if necessary, to that elevation when<br />
structures are significantly reconstructed within the floodplain. Minimum elevation<br />
is one foot above for structures in the identified regional floodplains.<br />
• The county has participated in floodplain property acquisition, funded through<br />
FEMA’s Hazard Mitigation Program.<br />
• Stormwater management and sedimentation and erosion control standards that<br />
comply with Phase II Federal Stormwater Regulations are in the process of being<br />
adopted, with implementation expected in the summer of 2004.<br />
• Development is prohibited in identified floodways and wetlands.<br />
• Development can occur on slopes steeper than 3 feet to one foot only after<br />
geotechnical analysis and receipt of an engineer’s recommendation.<br />
• The county is able to receive NWS warnings; equipment is radio-activated. During<br />
waking hours, using all available communications, less than 50 percent of the<br />
county’s population could be alerted within 30 minutes; responders and key<br />
executive officials could be alerted within 5 minutes.<br />
• The Emergency Management Agency’s director and key personnel have completed<br />
substantial training in all facets of emergency management. Emergency response<br />
personnel, EOC operations staff, and volunteer agencies have received training and<br />
education within the last five years.<br />
<strong>Jefferson</strong> <strong>County</strong> is located in a Modified Mercalli Zone VII area. Missouri statutes require<br />
school districts in a Modified Mercalli Zone VII or above at a magnitude 7.6 earthquake to<br />
provide for public view each year, an earthquake preparedness and safety information,<br />
such as earthquake procedures and a disaster plan; and conduct earthquake drills twice<br />
each year. Missouri statutes RSMo 260.451, 160.453, 160.455, and 160.457 provide that<br />
“the governing body of each school district shall request assistance from the State<br />
Emergency Management Agency and any local emergency management agency located<br />
within its district boundaries to develop and establish the earthquake emergency procedure<br />
system.”<br />
The questionnaire asked responders to summarize their regulations effectiveness in<br />
reducing potential losses from hazards and the effectiveness of their measures to increase<br />
public awareness of measures to reduce potential losses from hazards. The questions were<br />
answered on a scale of “O” to “4”, with “0” being not effective and “4” being very<br />
effective. In answer to the question: How effective would you rate the regulations<br />
employed by your local government to reduce potential losses from hazards, one<br />
municipality answered “1”, three answered “2”, and one answered “3”. In response to the<br />
question: How effective would you rate the measures employed by your local government<br />
to increase public awareness of measures that can be used to reduce potential losses to<br />
existing development in areas subject to hazards, two municipalities answered “2”, and<br />
three answered “3”.
A Regional Overview All-Hazard Mitigation Plan<br />
<strong>County</strong> Capabilities (Organization, Staffing, Training)<br />
The capabilities of emergency management, fire protection, law enforcement, and<br />
emergency medical services are detailed at the end of Section I.<br />
The EOC is located in the <strong>Jefferson</strong> <strong>County</strong> Courthouse in Hillsboro. The facility is well<br />
equipped for sustained operations over an extended period of time. A primary alternate<br />
EOC is located at the 911 Center in Hillsboro. Other alternate sights are identified. The<br />
EOC has survivable communications for operating forces, the Emergency Alert System,<br />
commercial and public broadcast stations, the State Emergency Management Agency,<br />
cities within the county, and neighboring jurisdictions. Communication and warning<br />
systems are tested on a regular basis. Five municipalities responding to the questionnaire<br />
have sirens, tested on a monthly basis. A substantial amount of the county’s<br />
unincorporated area is not within hearing range of sirens.<br />
<strong>County</strong>wide, substantial emergency response equipment is available to respond to events.<br />
Within the county, there are a total of nineteen fire protection districts or fire departments<br />
and seven ambulance districts. In addition to the <strong>Jefferson</strong> <strong>County</strong> Sheriff’s Department,<br />
there are ten municipal police departments. Substantial vehicle and heavy equipment is<br />
available through municipal and county public works departments. American Red Cross<br />
has a service center in the county. One hospital is located in the county, and most St.<br />
Louis metropolitan area medical facilities are located within a one-hour drive from any<br />
location in <strong>Jefferson</strong> <strong>County</strong>.<br />
The county has conducted at least one full-scale EOP exercise within the last four years<br />
including testing and evaluating alert notification, coordination and control, and<br />
communications.<br />
Responsibilities and Authorities<br />
<strong>Jefferson</strong> <strong>County</strong> government and their municipal governments responding to the<br />
questionnaire indicated the following:<br />
• <strong>County</strong> does not have legal basis for authority to order an evacuation.<br />
Municipalities: Six have legal basis.<br />
• <strong>County</strong> has legal basis for redirecting funds for emergency use.<br />
Municipalities: Five have legal basis; one answered not applicable.<br />
• <strong>County</strong> does not have legal basis for ordering a curfew.<br />
Municipalities: Five have legal basis.<br />
• <strong>County</strong> does not have legal basis for commandeering facilities, equipment,<br />
and materials.<br />
Municipalities: Five have legal basis; one does not.<br />
• <strong>County</strong> does not have legal basis to authorize lines of succession to carry out<br />
emergency activities.<br />
3
4<br />
<strong>Jefferson</strong> <strong>County</strong> – Section 3<br />
Municipalities: Six have legal basis; two do not know.<br />
• <strong>County</strong> has system to safeguard records to conduct emergency operations<br />
Municipalities: Five have system to safeguard; one does not.<br />
• <strong>County</strong> has system to safeguard vital records to reconstitute local<br />
government.<br />
Municipalities: Six have system to safeguard.<br />
• <strong>County</strong> has not developed an all-hazard vulnerability analysis to access<br />
potential consequences of disasters.<br />
Municipalities: Five have done analysis; one has not.<br />
• <strong>County</strong> has a multi-hazard emergency operations plan.<br />
Municipalities: Six have a multi-hazard plan.<br />
• <strong>County</strong> has mutual aid compacts with other jurisdictions<br />
Municipalities: Six have mutual aid compacts.<br />
• <strong>County</strong> EOP addresses the protection of people with special needs.<br />
Municipalities: Four address the protection; two do not.<br />
Intergovernmental and Interagency Coordination<br />
The <strong>County</strong> Emergency Management Agency interacts with the municipalities and single<br />
purpose governments on a regular basis to maintain communication and coordination of<br />
policy related to emergency management.<br />
Vulnerability Assessment of <strong>County</strong> Policies and Development Trends<br />
Commitments to a Comprehensive Mitigation Program<br />
<strong>Jefferson</strong> <strong>County</strong> has a well-established Emergency Management Agency. It regularly<br />
updates the EOP, addressing mitigation measures for hazards, both natural and manmade,<br />
incorporating any changes to the plan necessitated by changes in transportation<br />
infrastructure and land use.<br />
Laws, Regulations and Policies Related to Development in Hazard-Prone Areas<br />
The floodplain management ordinances of the county and municipalities are based on<br />
policies to protect health and welfare of people and minimize damage to public<br />
infrastructure and physical structures. They also restrict avoidable increases in flood height<br />
or velocity and protect individuals from buying land unsuited for the intended use due to a<br />
flood hazard.<br />
<strong>County</strong> Laws, Regulations and Policies Related to Hazard Mitigation in General<br />
Zoning and floodplain ordinances, coupled with the enforcement of building codes and<br />
the approval process for subdivisions and new or reconstructive development assures that
A Regional Overview All-Hazard Mitigation Plan<br />
hazards are addressed in the proposal and planning stages of the development process.<br />
Stormwater regulations that the county will soon be adopting and those of seven<br />
responding municipalities are designed to minimize the harmful physical and economic<br />
effects of erosion, sedimentation, and flooding from stormwater runoff. This is<br />
accomplished through the requirement of measures to mitigate erosion, both during and<br />
after construction; the detention and controlled discharge of the differential runoff from<br />
the development; and a well-designed stormwater conveyance system.<br />
Missouri statute RSMo 319.203 requires that cities and counties in the Level VII earthquake<br />
zone pass “an ordinance of order” regarding earthquake preparedness and building<br />
requirements demonstrating compliance with 319.207 for certain types of structures. This<br />
statute applies to <strong>Jefferson</strong> <strong>County</strong>.<br />
How Local Risk Assessments are Incorporated and Prioritized into Local Planning<br />
Of the hazard risks the county has exposure to, riverine and flash flooding hazard risks are<br />
foremost in frequency and potential magnitude in loss of people and property.<br />
Enforcement of zoning, floodplain, stormwater ordinances, and placement of public<br />
infrastructure provide the most effective tools to minimize known risks.<br />
The county and municipalities recognize the danger and economic impact of severe winter<br />
storms. Clearing of snow and ice from roadways is a main priority during these events.<br />
The Missouri Department of Transportation has responsibility for the interstate and state<br />
designated highways within the county. The <strong>County</strong> Highway Department and<br />
municipalities clear their respective roadways, prioritizing known hazardous stretches of<br />
roadways, school bus stops, and intersections in efforts to reduce accidents and maintain<br />
the movement of people and goods.<br />
Current Criteria Used to Prioritize Mitigation Funding<br />
Mitigation funding is based upon the combination of expected damage, the assumed<br />
frequency of damage, and the likelihood of death or injury to people.<br />
Integration of Hazard Mitigation with the City/<strong>County</strong> Department’s Plans<br />
A city or county EOP and its floodplain, zoning, subdivision, and building code ordinances<br />
developed and enforced in an integrated fashion insure that avoidable disasters are<br />
prevented, and the vulnerability of people and property to the effects of disasters is<br />
reduced.<br />
How the <strong>County</strong> Determines Cost-Effectiveness of Mitigation Programs<br />
Cost-effectiveness is considered on a case-by-case basis; dependent upon the scope of<br />
5
6<br />
<strong>Jefferson</strong> <strong>County</strong> – Section 3<br />
damages, estimated savings in future hazard events, the type of mitigation project, and the<br />
probable hazard to human life in future events. A FEMA cost/benefit analysis criterion is<br />
required for FEMA funded projects.<br />
Mitigation Funding Options (including current and potential sources of federal, state, local,<br />
private funds)<br />
The county and municipalities have utilized federal or state funds when disaster<br />
declarations have been made in the case of heavy widespread damages. Sources have<br />
included FEMA, SEMA, the Missouri Department of Natural Resources and Department of<br />
Economic Development. In addition to local government general revenue funds, the<br />
<strong>County</strong> and many of the municipalities have either a dedicated transportation and/or<br />
capital improvements sales/use tax that can be used to fund mitigation projects. These<br />
projects are generally reactive or reconstructive in nature. In some cases, private property<br />
owners cost share in these projects. Private funds are expended when necessary mitigation<br />
measures are incorporated into a development plan.<br />
How Governments Meet Requirements for Hazard Mitigation Funding Programs<br />
Governmental jurisdictions will meet the requirements for hazard mitigation funding<br />
programs if the project conforms to Missouri’s Hazard Mitigation Plan, provides a<br />
beneficial impact on the disaster area, meeting environmental requirements, solves the<br />
problem independently, and is cost-effective. Adoption of the Resolution of Intent to<br />
Participate in All-Hazard Mitigation will insure that a county or municipality meets the<br />
requirements for hazard mitigation funding programs.<br />
Recommendations for Improvement<br />
Recommended improvements include working with watershed groups and engineering<br />
consultants to assess and maintain watersheds, marking flood prone areas, working with<br />
the wastewater and stormwater management districts to control runoff issues and address<br />
growth issues, address soil erosion in parks, improve stormwater ordinances, and conduct<br />
mitigation property buyouts. Additional recommendations pertaining to education and<br />
training include upgrade and install warning and communications systems (through<br />
assistance from business sponsors), create Emergency Management Center (for<br />
communities of Festus, Pevely, Herculaneum, Crystal City), coordination between<br />
communities and planners/cooperative technical agreements, education for public safety<br />
(earthquake proof historic buildings), prioritize assistance to smaller communities (training),<br />
and use of municipal league as nexus for coordination. Further recommendations consist<br />
of collaboration of communities and local emergency services with Highway departments<br />
regarding construction of roads and bridges pertaining to stability/earthquake hazard proof<br />
structures, performing retrofits of one or two emergency rooms to withstand earthquake,<br />
assist with the full implementation of the MDNR dam safety program, and installation of<br />
back-up power systems for critical facilities or bury critical lines.
A Regional Overview All-Hazard Mitigation Plan<br />
The Missouri Seismic Safety Commission (under Missouri statutes RSMo 44.227, 44.229,<br />
44.231, 44.233, 44.235, and 44.277) has developed a Strategic Plan for earthquake safety<br />
in Missouri. This plan contains recommendations for earthquake mitigation. Use of the<br />
Strategic Plan by the <strong>County</strong> would facilitate mitigation planning.<br />
Missouri has an organization called Structural Assessment and Visual Evaluation (SAVE)<br />
coalition. The Coalition's objective is to assist the Missouri State Emergency Management<br />
Agency (SEMA) in the execution of its responsibilities with respect to the use of qualified<br />
volunteers in the emergency assessment of buildings following catastrophic events.<br />
S.A.V.E. volunteers consist of architects, professional engineers, and other qualified<br />
professionals that assist SEMA in assessing buildings and vertical structures following<br />
catastrophic events. The S.A.V.E. Coalition also includes the American Institute of<br />
Architects/Missouri (AIA/MO), the American Society of Civil Engineers (ASCE), the<br />
Consulting Engineers <strong>Council</strong> of MO (CECMO), and the Missouri Society of Professional<br />
Engineers (MSPE).<br />
<strong>County</strong> and Municipal Policies and Development Trends<br />
At present, the county is more densely developed in the northern third of the county; along<br />
Interstate 55, located along its eastern boundary; and the State Highway 21 and State<br />
Highway 30 corridors. <strong>Jefferson</strong> <strong>County</strong>’s population was 198,099 in 2000, increasing by<br />
15.6 percent in the last decade. It is predicted that the county will see an increase of 11<br />
percent by 2010, and about 28 percent by 2025, with a population of about 253,000. Of<br />
the county population of 198,099 in year 2000, almost 74 percent lived outside<br />
incorporated areas.<br />
<strong>Jefferson</strong> <strong>County</strong> has a current master plan, zoning, subdivision regulations, and a building<br />
code. Of the municipalities in the county, seven answered that they have master plans and<br />
six did not answer. Seven have zoning, subdivision, stormwater, and building codes; six<br />
did not answer.<br />
Refer to Table J53 that summarizes <strong>Jefferson</strong> <strong>County</strong> capability assessment.<br />
Funding Sources<br />
There are several sources of funding for both pre- and post-disaster hazard mitigation<br />
policies and projects. While all mitigation techniques will likely save money by avoiding<br />
losses, the cost of implementing mitigation efforts can be substantial and well beyond the<br />
local government’s capacity to fund the mitigation activity. There do exist federal and state<br />
funding programs that can be utilized for funding assistance. Following is a list of some<br />
sources of funding presently available. This list is not comprehensive and as new programs<br />
can be developed, or existing programs can be eliminated or modified.<br />
7
8<br />
Federal Sources<br />
TITLE: PRE-DISASTER MITIGATION PROGRAM<br />
AGENCY: FEDERAL EMERGENCY MANAGEMENT AGENCY (FEMA)<br />
<strong>Jefferson</strong> <strong>County</strong> – Section 3<br />
Through the Disaster Mitigation Act of 2000, Congress approved the creation of a national<br />
program to provide a funding mechanism that is not dependent on a Presidential disaster<br />
declaration. The Pre-Disaster Mitigation (PDM) Program provides funding to states and<br />
communities for cost-effective hazard mitigation activities that complement a<br />
comprehensive mitigation program, and reduce injuries, loss of life, and damage and<br />
destruction of property.<br />
TITLE: FLOOD MITIGATION ASSISTANCE PROGRAM<br />
AGENCY: FEDERAL EMERGENCY MANAGEMENT AGENCY<br />
FEMA’S Flood Mitigation Assistance Program (FMA) provides funding to assist states and<br />
communities in implementing measures to reduce or eliminate the long-term risk of flood<br />
damage to buildings, manufactured homes, and other structures insurable under the<br />
National Flood Insurance Program (NFIP). FMA was created as part of the National Flood<br />
Insurance Reform Act of 1994 (42 U.S.C. 4101) with the goal of reducing or eliminating<br />
claims under the NFIP. FMA is a pre-disaster grant program, and is made available to<br />
states on an annual basis. This funding is exclusively available for mitigation planning and<br />
implementation of mitigation measures.<br />
Criteria: Community must be a participant in NFIP; the project must be cost effective,<br />
beneficial to the NFIP fund, and technically feasible. The project must conform to the<br />
minimum standards of the NFIP Floodplain Management Regulations, the applicant’s Flood<br />
Mitigation Plan, and all applicable laws and regulations.<br />
TITLE: HAZARD MITIGATION GRANT PROGRAM<br />
AGENCY: FEDERAL EMERGENCY MANAGEMENT AGENCY<br />
The Hazard Mitigation Grant Program (HMGP) was created in November 1988 through<br />
Section 404 of the Robert T. Stafford Disaster Relief and Emergency Assistance Act. The<br />
HMGP assists states and local communities in implementing long-term mitigation measures<br />
following a Presidential disaster declaration.<br />
Criteria: Project must conform to State’s Hazard Mitigation Plan, provide a beneficial<br />
impact on the disaster area, meet environmental requirements, solve a problem<br />
independently, and be cost-effective.<br />
TITLE: MITIGATION TECHNICAL ASSISTANCE PROGRAMS (MTAP)<br />
AGENCY: FEDERAL EMERGENCY MANAGEMENT AGENCY<br />
There are three major mitigation technical assistance programs (MTAPs) that provide<br />
technical support to state/local communities through FEMA Regional and Headquarters<br />
Mitigation staff in support of mitigation initiatives. These programs include the Hazard
A Regional Overview All-Hazard Mitigation Plan<br />
Mitigation Technical Assistance Program (HMTAP), the National Earthquake Technical<br />
Assistance Program (NETAP), and the Wind and Water Technical Assistance Program<br />
(WAWTAP). They provide the technical support that is necessary to mitigate against<br />
potential loss of lives and minimize the amount of damage as a result of a disaster.<br />
The HMTAP provides assistance to FEMA’s Headquarters and Regional Mitigation Staff.<br />
This multi-hazards program was designed to provide architectural, engineering, and other<br />
mitigation related technical assistance in support of post disaster mitigation initiatives.<br />
The NETAP is a technical assistance program created to provide ad hoc short-term<br />
architectural and engineering support to state/local communities as they are related to<br />
earthquake mitigation. The program was designed to enhance the state/local<br />
communities’ ability to become more resistant to seismic hazards. This assistance cannot<br />
be used for actions that are covered under the State’s/Territories Performance Partnership<br />
Agreement (PPA). This program assists in carrying out the statutory authorities of the<br />
National Earthquake Hazards Reduction Act of 1977, as amended.<br />
The WAWTAP is a technical assistance program created to provide ad hoc short-term<br />
assistance in support of the hurricane and flood programs. The program was designed to<br />
enhance the state/local communities’ ability to become more resistant to hazards related to<br />
flooding and hurricanes. This assistance cannot be used for actions that are covered under<br />
the State’s/Territories Performance Partnership Agreement (PPA). This program assists in<br />
carrying out the statutory authorities of the National Flood Insurance Act of 1968 and the<br />
Flood Disaster Protection Act of 1973.<br />
Criteria: State participation in the Flood Program<br />
TITLE: SBA DISASTER ASSISTANCE PROGRAM<br />
AGENCY: U. S. SMALL BUSINESS ADMINISTRATION<br />
The purpose of the Pre-Disaster Mitigation Loan Program is to make low-interest, fixed rate<br />
loans to eligible small businesses for the purpose of implementing mitigation measures to<br />
protect business property from damage that ma be caused by future disasters. The<br />
program is a pilot program, which supports FEMA’s Pre-Disaster Mitigation Program.<br />
SBA’s Pre-Disaster Mitigation Program is available to businesses whose proposed mitigation<br />
measure conforms to the priorities and goals of the mitigation plan for the community, as<br />
defined by FEMA, in which the business is located. Because the program has been<br />
approved only for limited funding, approved loan requests will be funded on a first-come,<br />
first-served basis up to the limit of the program funds.<br />
Criteria: A Presidential disaster declaration or an SBA administrative declaration must be<br />
made.<br />
TITLE: COMMUNITY DEVELOPMENT BLOCK GRANTS<br />
AGENCY: U. S. DEPARTMENT OF HOUSING AND URBAN DEVELOPMENT<br />
The Community Development Block Grant (CDBG) program provides grants to local<br />
9
10<br />
<strong>Jefferson</strong> <strong>County</strong> – Section 3<br />
governments for community and economic development projects that primarily benefit<br />
low-and moderate-income people. The CDBG program also provides grants for postdisaster<br />
hazard mitigation and recovery following a Presidential disaster declaration.<br />
Criteria: CBDG eligible communities (generally communities with under 50,000 population<br />
and counties under 200,000 population) located within a Presidential disaster declaration<br />
area.<br />
TITLE: DISASTER MITIGATION PLANNING AND TECHNICAL ASSISTANCE<br />
AGENCY: DEPARTMENT OF COMMERCE, ECONOMIC DEVELOPMENT<br />
ADMINISTRATION<br />
These grants are primarily designed for economic development initiatives, but are<br />
applicable to hazard mitigation when the focus is on creating disaster resistant jobs and<br />
workplaces. Also, these monies are applicable because often projects related to developing<br />
infrastructure are also making the community more disaster resistant.<br />
TITLE: EMERGENCY WATERSHED PROTECTION<br />
AGENCY: DEPARTMENT OF AGRICULTURE, Natural Resources Conservation Service<br />
(NRCS)<br />
The Emergency Watershed Protection Program (EWP) provides financial assistance to<br />
sponsors and individuals in implementing emergency measures to relieve imminent hazards<br />
to life and property created by a natural disaster. Activities include providing financial and<br />
technical assistance to remove debris from streams, protect destabilized streambanks, and<br />
the purchase of flood plain easements. The program is designed for installation of recovery<br />
measures. It is not necessary for a national emergency to be declared to be eligible for<br />
assistance.<br />
TITLE: WATERSHED SURVEYS AND PLANNING PROGRAM<br />
AGENCY: DEPARTMENT OF AGRICULTURE, Natural Resources<br />
Conservation Service (NRCS)<br />
This Program provides financial assistance for watershed planning activities and cooperative<br />
river basin surveys and investigations. Types of plans include flood hazard analyses, and<br />
flood plain management assistance, with a focus on identifying solutions that use<br />
conservation practice and nonstructural measures to solve resource problems.<br />
State Sources<br />
TITLE: WATER AND SEWER GRANT PROGRAMS<br />
AGENCY: MISSOURI DEPARTMENT OF ECONMIC DEVELOPMENT<br />
The Department of Economic Development offers grants to enhance infrastructure such as<br />
water and sewer lines. These grants might be particularly helpful in protecting against<br />
drought by connecting disparate water sources and thereby providing multiple water
A Regional Overview All-Hazard Mitigation Plan<br />
sources to isolated communities. These monies might also be helpful in providing<br />
adequate protection of sewage treatment plants from the risk of flood or separation of<br />
storm water from combined sewer lines.<br />
TITLE: EMERGENCY MANAGEMENT/MITIGATION TRAINING<br />
AGENCY: STATE EMERGENCY MANAGEMENT AGENCY<br />
The State Emergency Management Agency (SEMA) offers grants for training jurisdictions in<br />
hazard mitigation, preparedness, and planning. These funds are used for training<br />
appropriate staff in identifying projects best suited for mitigation.<br />
TITLE: PRE-DISASTER MITIGATION PROJECT IMPACT<br />
AGENCY: STATE EMERGENCY MANAGEMENT AGENCY<br />
SEMA funds are provided to assist communities with technical assistance in the<br />
development of a sustained pre-disaster mitigation program. Funds can be used for<br />
planning mitigation initiatives and providing technical “know-how” in the construction of<br />
mitigation projects.<br />
TITLE: HAZARD MITIGATION GRANT PROGRAM<br />
AGENCY: STATE EMERGENCY MANAGEMENT AGENCY<br />
SEMA funds are available to communities for implementing long-term hazard mitigation<br />
measures following a disaster declaration. It is thought that after a major disaster,<br />
communities will be able to identify where things can be done to prevent losses in the<br />
future.<br />
TITLE: PUBLIC ASSISTANCE PROGRAM<br />
AGENCY: STATE EMERGENCY MANAGEMENT AGENCY<br />
These SEMA grants are designed to provide funds to repair damaged infrastructure and<br />
public facilities. Funds can also be used to reinstate government services impacted by a<br />
natural hazard event. This program can fund the repair of damaged components of a<br />
structure.<br />
TITLE: DISASTER RECOVERY INITIATIVE<br />
AGENCY: MISSOURI DEPARTMENT OF ECONOMIC DEVELOPMENT<br />
The Missouri Department of Economic Development (DED) provides this grant program to<br />
bridge funding gaps in recovery assistance after a disaster. These funds can also be used to<br />
fund gaps in a mitigation development program.<br />
11
12<br />
TITLE: SOIL AND WATER CONSERVATION PROGRAM<br />
AGENCY: MISSOURI DEPARTMENT OF NATURAL RESOURCES<br />
<strong>Jefferson</strong> <strong>County</strong> – Section 3<br />
The Missouri Department of Natural Resources (DNR), through the Soil and Water<br />
Conservation Program, offer grants, cost share programs, and low interest loans to<br />
agencies and property owners to plan and implement best practices to reduce soil erosion<br />
and improve water quality. Practices that facilitate slower release of water upstream<br />
mitigate downstream flood hazards. The programs are generally applicable to rural and<br />
agricultural environments.<br />
Local Sources<br />
Municipal and county governments can provide funds for projects through their general<br />
revenue fund and through a dedicated capital improvement and/or transportation sales/use<br />
tax. Special taxing districts, such as a Neighborhood Improvement District (NID), can be<br />
formed if practical, to assess property owners for a portion of the cost of improvements.<br />
Non-governmental<br />
Other potential sources of revenue for implementing local mitigation projects are monetary<br />
contributions from nonprofit organizations such as the American Red Cross, community<br />
relief funds, churches, charitable trusts, and land trusts.<br />
Conclusion<br />
There are many sources of funding available for hazard mitigation projects. Those<br />
identified here, while they are significant, do not comprise all potential sources. It should<br />
be noted that new programs can become available, and existing programs can be modified<br />
or dropped. Many funds available are leveraged with “local” matching funds at various<br />
contribution percentages. Diligence in keeping abreast of changes in funding<br />
opportunities will be necessary to institute hazard mitigation projects that take advantage<br />
of non-local funds.
A Regional Overview All-Hazard Mitigation Plan<br />
WORKSHEET<br />
JEFFERSON COUNTY CAPABILITY ASSESSMENT WORKSHEET<br />
13
14<br />
Policies and<br />
Programs<br />
(ex. Zoning<br />
Ordinance)<br />
Floodplain<br />
management<br />
Multi-hazard<br />
emergency plan<br />
Stormwater<br />
regulations<br />
Building<br />
regulations<br />
Document<br />
Reference<br />
(ex.<br />
Comprehensive<br />
Plan & page<br />
number)<br />
<strong>County</strong> Floodplain<br />
Management<br />
Ordinance<br />
<strong>County</strong> Emergency<br />
Operations Plan<br />
<strong>County</strong> Stormwater<br />
and Subdivision<br />
Regulations<br />
<strong>County</strong><br />
BOCA<br />
1996<br />
Flood insurance Joined NFIP<br />
Mississippi River<br />
levee issues<br />
5/16/83<br />
#290808<br />
CAPABILITY ASSESSMENT<br />
Effectiveness<br />
for<br />
Mitigation<br />
(ex. low,<br />
medium,<br />
high)<br />
High<br />
<strong>Jefferson</strong> <strong>County</strong> – Section 3<br />
Rationale for Effectiveness<br />
(ex. low because allows<br />
development in floodplain)<br />
New construction and improvements are<br />
not allowed without extensive mitigation<br />
requirements. Any encroachments such as<br />
fill, new construction, or other<br />
developments within in the floodway must<br />
not create any increase in flood levels<br />
within the community during a base flood<br />
discharge.<br />
Requires 2 feet freeboard.<br />
Medium Consider more formal mutual aid<br />
agreements, improve the Emergency<br />
Operations Center, warning systems in rural<br />
areas, emergency response equipment,<br />
training for volunteer agencies and the<br />
private sector, and public preparedness<br />
education.<br />
Medium Stormwater runoff, sediment and erosion<br />
management provides effective measures to<br />
deal with increasing development trends.<br />
Medium The county has building inspectors that<br />
ensure construction is built to code.<br />
High The county administers and participates<br />
fully in the NFIP.<br />
levee districts Medium Coordination with county jurisdictions<br />
through US Corps of Engineers.
A Regional Overview All-Hazard Mitigation Plan 1<br />
SECTION 4<br />
Introduction to Mitigation<br />
The <strong>East</strong>-<strong>West</strong> <strong>Gateway</strong> <strong>Council</strong> of Governments is subject to many types of hazards:<br />
flooding, tornado/severe windstorm, winter storm, earthquake/landslide, dam failure,<br />
drought, heat wave, and an occasional wildfire. All-hazard mitigation planning is the<br />
process associated with devising strategies needed to mitigate the damages associated<br />
with these disasters.<br />
Definition of Mitigation<br />
Mitigation is defined as “sustained action that reduces or eliminates long-term risk to<br />
people and property from hazards and their effects.” It describes the ongoing efforts at<br />
the Federal, State, local and individual levels to lessen the impact of disasters upon families,<br />
homes, jurisdictions and the economy.<br />
Mitigation includes not only avoiding the development of hazard prone sections of the<br />
jurisdiction, but also making existing development in hazard prove areas safer. Certain<br />
areas in some jurisdictions are susceptible to damage from hazards. As such, steps are<br />
taken to make these areas less vulnerable through flood buyouts.<br />
Jurisdictions can steer growth to less risky areas, through non-structural measures such as<br />
avoiding construction in flood-prone areas. Keeping buildings and people out of harm’s<br />
way is the essence of mitigation. Incorporating mitigation into decisions relating to a<br />
jurisdiction’s growth can result in a safer, more resilient jurisdiction, and one that is more<br />
attractive to families and businesses.<br />
Categories of Mitigation<br />
Mitigation categories are grouped into six categories.<br />
• Prevention - Prevention measures are intended to keep a hazard risk problem from<br />
getting worse; it ensures future development does not increase losses. Some<br />
examples include: planning and zoning, open space preservation, land development<br />
regulations, and storm water management.<br />
• Property Protection - These measures are used to modify buildings and other<br />
surroundings subject to hazard risk or their surroundings, rather than prevent the<br />
hazard from occurring. These measures protect people and property at risk. Some<br />
examples include: acquisition/public procurement and management of lands that<br />
are vulnerable to damage from hazards; relocation/permanent evacuation of hazard<br />
prone areas to safer areas; rebuilding and modifying structures to reduce damage
2<br />
<strong>Jefferson</strong> <strong>County</strong> – Section 4<br />
by future hazard events; floodproofing or protection of floodprone buildings, using<br />
various methods.<br />
• Natural Resource Protection - These measures are intended to reduce the intensity<br />
of hazard effects and to improve the quality of the environment and wildlife. Parks,<br />
recreation, conservation agencies and similar organizations implement these<br />
activities. Some examples of this mitigation measure include: erosion and sediment<br />
control, and wetlands protection.<br />
• Emergency Services - Emergency services measures protect people before and after a<br />
hazard event. Most counties and many cities have emergency management offices<br />
to coordinate warning, responses and recovery during disasters. Emergency services<br />
include warning, capacity of response, critical facilities protection and health and<br />
safety maintenance.<br />
• Structural Projects - These measures directly protect people and property at risk.<br />
They are called structural because they involve construction of manmade structures<br />
to control hazards. Structural projects for flood control include reservoirs,<br />
levees/floodwalls, diversions, channel modifications, and storm sewers.<br />
• Public Information - Public information activities inform and remind citizens about<br />
hazardous areas and measures needed to avoid damage and injury. This<br />
information is directed to present and future property owners, present and future<br />
business owners, and visitors. Some examples of public information activities<br />
include providing hazard maps and other information; outreach hazard mitigation<br />
programs through newspapers, radio/TV/videotape, mass mailings, notices/displays,<br />
property owner handbook, presentations; real estate disclosure, public library,<br />
technical assistance, and school age and adult education classes.<br />
Mitigation Versus Preparedness<br />
Mitigation differs from preparedness in that mitigation is designed to address long term<br />
activities that reduce or eliminate a hazard and/or a hazard’s damages, such as<br />
development and implementation of a hazard mitigation plan, promoting/developing<br />
tornado saferooms, promoting/developing business continuity plans, rerouting<br />
transportation of HAZMAT materials, development/enforcement of building/fire seismic<br />
and flood codes and promoting flood buyouts or retrofit projects. Preparedness activities<br />
occur at the pre-disaster stage and addresses activities that develop response and recovery<br />
activities. These activities include an inventory of local resources,<br />
development/implementation of training citizens, design/conduct and evaluate responder<br />
exercises; development of resource lists and procurement resources; development of<br />
unified incident command agreements and development of mutual aid agreements.
A Regional Overview All-Hazard Mitigation Plan 3<br />
Mitigation Versus Response and Recovery<br />
Mitigation differs from response and recovery in that mitigation is designed to address<br />
long term activities that reduce or eliminate a hazard and/or a hazard’s damages such as<br />
development and implementation of a hazard mitigation plan, promoting/developing<br />
tornado saferooms, promoting/developing business continuity plans, rerouting<br />
transportation of HAZMAT materials, development/enforcement of building/fire seismic<br />
and flood codes and promoting flood buyouts or retrofit projects. Response and recovery<br />
activities occur at the disaster onset and during the post disaster time frame. Response<br />
activities include immediate actions that save lives, protect property and stabilize the<br />
situation and include alerting, securing and aiding the public, mobilizing emergency<br />
personnel and equipment, implementing plans and protective actions, assessment of the<br />
disaster, activating the incident command system and response and react to the disaster’s<br />
effects. Recovery activities occur after the disaster has occurred. Activities ensure that all<br />
systems return to normal. Such activities include implementation of damage assessment<br />
procedures, remove debris, develop after action reports, develop disaster assistance grants<br />
and rebuild better.<br />
Mitigation Plan Benefits<br />
Hazard mitigation planning offers many benefits. These include: saving lives and property,<br />
meeting the needs/policies of each specific jurisdiction, educates jurisdiction officials, public<br />
and partners, reduces vulnerability to future hazards, guide and speed post disaster<br />
recovery, enhance funding opportunities (HMGP, flood mitigation plan credit for FMA and<br />
CRS programs, NOAA/NWS StormReady credit, NRCS/DNR/COE/CDBG grants), promotes<br />
public participation, helps place mitigation project in the budget cycle, helps keep projects<br />
and spending on track, focuses jurisdiction disaster mitigation efforts, guides post disaster<br />
recovery, employs pro-active approach to minimize adverse effects of disasters, evaluates<br />
hazards and risks, and determines mitigation needs and capabilities, solutions, activities<br />
and projects.<br />
<strong>Jefferson</strong> <strong>County</strong> Hazard Mitigation Goals, Objectives, Strategies and Coordination<br />
This section contains strategies that promote achievement of hazard mitigation, impact<br />
reduction and other hazard mitigation jurisdiction goals. This section will address<br />
mitigation strategies for hazards including flooding, tornado/severe windstorm, winter<br />
storm, earthquake/landslide, dam failure, drought, heat wave and wildfire.<br />
<strong>Jefferson</strong> <strong>County</strong>’s mitigation goals were derived from conferences with emergency<br />
managers, jurisdiction stakeholders as well as the key planning documents (i.e. Emergency<br />
Operations Plan, Official Master Plan, floodplain and building ordinances and the meetings<br />
and workshops conducted on June 13 and October 17, 2003 during the development of<br />
the Regional All-Hazard Mitigation Plan.
4<br />
The mitigation goals include the following:<br />
<strong>Jefferson</strong> <strong>County</strong> – Section 4<br />
• Prevent the loss of life, minimize illness and injury<br />
• Preserve property, infrastructure, business, maintain jurisdiction integrity<br />
• Develop sustainable long-range growth strategy<br />
This section is organized with general goals that are to be met by accomplishing the<br />
accompanying objectives, actions and subsequent strategies. An action matrix has been<br />
included for <strong>Jefferson</strong> <strong>County</strong>. It provides a reference for the jurisdiction during the<br />
implementation process. It identifies each goal, objective and strategy, identifies the<br />
hazards addressed by each strategy, type of strategy, target completion date, responsible<br />
party/organization for implementation, potential funding source, prioritization, as well as<br />
monitoring and evaluation indicators. Specific information on potential funding sources is<br />
in found in Section 3 of <strong>Jefferson</strong> <strong>County</strong> Hazard Mitigation Plan.<br />
The goals, objectives, actions and strategies identified here were developed through a<br />
multi-step process.<br />
• Hazard identification and analysis (identification of the hazards most prevalent of<br />
the area and following the area).<br />
• Area vulnerability assessment (identification the areas of the jurisdiction most<br />
vulnerable to the previously identified hazards).<br />
• Jurisdiction capability assessment questionnaire (assessment identified the steps the<br />
jurisdiction had taken toward reducing their vulnerability to hazards by reviewing<br />
the jurisdiction’s legal, institutional, political, technical and fiscal capability. This<br />
step identified the jurisdiction’s capability to implement future mitigation measures.)<br />
Evaluation<br />
Several mitigation actions were proposed and discussed by all of the participants at the<br />
mitigation workshops for inclusion into the Hazard Mitigation Plan. The following table<br />
provides an analysis of the <strong>County</strong>’s proposed mitigation actions. Each action was<br />
reviewed according to the STAPLEE criteria. STAPLEE criteria include: Social, Technical,<br />
Administrative, Political, Legal, Economic and Environmental considerations. The asterisks<br />
in the columns on the right indicate the action would have a positive effect.<br />
TABLE J54 JEFFERSON COUNTY PROPOSED MITIGATION ACTION<br />
EVALUATION<br />
Proposed Action S T A P L E E<br />
Objective 1.1: Raise public awareness.<br />
Encourage development of public outreach programs * * * * * *<br />
Encourage organizations to develop hazard measures for<br />
employees/visitors<br />
* * * * * * *<br />
Encourage development of emergency management<br />
curriculum in schools.<br />
* * * * * * *
A Regional Overview All-Hazard Mitigation Plan 5<br />
TABLE J54 JEFFERSON COUNTY PROPOSED MITIGATION ACTION<br />
EVALUATION<br />
Proposed Action S T A P L E E<br />
Encourage agencies to identify, develop outreach program<br />
for special needs population and hazard mitigation<br />
measures<br />
Encourage education and construction of saferooms in<br />
mobile home parks<br />
* * * * * * *<br />
* * * * * * *<br />
Objective 1.2: Establish warning systems for all hazards.<br />
Encourage jurisdictions, LEPC, EMA to determine, report<br />
warning system data gaps for all hazards.<br />
* * * * * * *<br />
Encourage development of evacuation plan for all disasters * * * * *<br />
Encourage placement of flood warning signs * * * * * * *<br />
Encourage special needs population to obtain NOAA radios, *<br />
saferooms<br />
* * * * * *<br />
Objective 1.3: Decrease occurrence and impacts of flooding.<br />
Encourage participation in NFIP, CRS * * * * * * *<br />
Encourage residents, jurisdictions, developers to protect<br />
rivers and corridors<br />
* * * * * * *<br />
Encourage residents, etc. to design, build stormwater<br />
systems that replicate water movement<br />
* * * * *<br />
Encourage residents, stakeholders to participate in * * * * * *<br />
watershed plans to prevent flooding.<br />
Encourage jurisdictions to identify, purchase remaining<br />
repetitive flood buyout properties.<br />
* * * * *<br />
Revise flood fighting plans as needed. * * * * * * *<br />
Encourage jurisdictions to strengthen floodplain<br />
* * * * * * *<br />
regulations.<br />
Objective 2.1: Reduce or prevent impacts from hazards on<br />
private properties.<br />
Encourage education of residents on property protection<br />
from hazards (checklists, preparedness kits).<br />
Jurisdiction planning departments encouraged to use<br />
hazard maps with developers, home buyers, construction<br />
and engineers.<br />
Encourage utilities, communications, developers to<br />
construct underground lines<br />
Objective 2.2: Reduced or prevent impacts from hazards on<br />
public properties.<br />
Encourage jurisdictions to adopt, enforce most current<br />
codes, ordinances for all hazards.<br />
Encourage those responsible for special needs population to<br />
take FEMA structural safety classes for building integrity<br />
Encourage emergency response agencies and districts to<br />
relocate facilities away from geographically redundant<br />
areas.<br />
Encourage jurisdictions to adopt open burning control<br />
ordinances.<br />
Encourage jurisdiction agencies to coordinate<br />
communications plans.<br />
Encourage jurisdictions, state, federal agencies to review,<br />
prioritize emergency routes, retrofit infrastructure used for<br />
* * * * * *<br />
* * * * * * *<br />
* * * * * * *<br />
* * * * * *<br />
* * * * * *<br />
* * * * * * *<br />
* * * * * * *<br />
* * * *<br />
* * * * * * *
6<br />
<strong>Jefferson</strong> <strong>County</strong> – Section 4<br />
TABLE J54 JEFFERSON COUNTY PROPOSED MITIGATION ACTION<br />
EVALUATION<br />
Proposed Action S T A P L E E<br />
hazard events<br />
Encourage upgrade of lifeline facilities to meet most current<br />
building seismic codes<br />
Objective 3.1: Develop collaborative hazard mitigation<br />
efforts across jurisdictional boundaries.<br />
Encourage jurisdictions to implement Hazard Mitigation<br />
Plan<br />
Encourage partnering with local, county, region, state<br />
governments<br />
Encourage coordination between levee districts to protect<br />
those living up and downstream.<br />
Highly recommend pertinent jurisdictions conduct proper<br />
record keeping for all documents related to disasters.<br />
Objective 3.2: Reduce impacts and promote protection of<br />
natural resources.<br />
Encourage development of jurisdiction land use plans,<br />
zoning, regulations to protect downstream residents from<br />
dam failure.<br />
Encourage jurisdiction educate residents on proper disposal<br />
of yard, commercial and household waste.<br />
Encourage jurisdictions, residents to maintain streams,<br />
corridors.<br />
Encourage jurisdictions assist MDNR in full implementation<br />
of dam safety program.<br />
Encourage jurisdictions to develop greenways for flood<br />
protection that parallels streams, rivers.<br />
Encourage jurisdictions to become familiar and comply with<br />
drought, water restrictions.<br />
Encourage jurisdictions, stakeholders to work together to<br />
protect watersheds, encourage stormwater practices for<br />
flood protection<br />
* * * * * *<br />
* * * * * * *<br />
* * * *<br />
* * * * * * *<br />
* * * * *<br />
* * * * * * *<br />
* * * * *<br />
* * * * * * *<br />
* * * * * * *<br />
* * * * * * *<br />
* * * * * *<br />
* * * * * * *<br />
Workshop participants discussed suggestions, added suggestions and deleted some for<br />
various actions by using the STAPLEE evaluation. The following actions were eliminated for<br />
various reasons as shown on the following list:<br />
• A comment was made pertaining to coordination between local stakeholders and<br />
various state agencies on design and construction of roadways that were being<br />
rebuilt from severe flooding. The local stakeholders felt that the state agencies were<br />
not taking their suggestions and expertise into advisement.<br />
• A comment was made regarding the need for specialty equipment for response and<br />
recovery activities. This was discarded as not being directly relevant to hazard<br />
mitigation planning.
A Regional Overview All-Hazard Mitigation Plan 7<br />
The final mitigation recommendations include the six categories of mitigation: prevention,<br />
property protection, natural resource protection, emergency services, structural projects<br />
and public information. Recommendations include, but are not limited to those listed<br />
below.<br />
GOAL #1: Prevent the loss of life; minimize illness and injury on a local, countywide and<br />
regional basis.<br />
Objectives:<br />
1. Raise public awareness concerning hazards, including measures that can be taken to<br />
promote mitigation and increase disaster preparedness, response and recovery<br />
capabilities.<br />
Actions<br />
a. Encourage development of public outreach programs that ensure all<br />
members of the jurisdiction have access to information on hazards,<br />
consequences, and steps to be taken to reduce risk at home and work.<br />
b. Encourage businesses, governments and special districts to develop and<br />
distribute pertinent hazard mitigation measures for employees and visitors<br />
c. Encourage development of emergency management curriculum in public and<br />
private schools, colleges and universities to develop hazard mitigation<br />
measures (for incorporation into emergency plans) for schools; post plans on<br />
school internet site.<br />
d. Encourage appropriate jurisdiction agencies to identify all special needs<br />
populations in the jurisdiction, and develop a special outreach program for<br />
those at risk, and coordinate hazard mitigation plans (including backup<br />
power, evacuation, and warning plans for all hazards).<br />
e. Encourage education and construction of saferooms in all mobile<br />
home parks.<br />
2. Establish warning systems for all disasters for businesses, schools, special districts<br />
and special needs populations and governments.<br />
Actions<br />
a. Encourage jurisdictions to work with local emergency planning committee<br />
and emergency management agency to determine and report on warning<br />
system gaps for all hazards, including dam failures, tornadoes and flash<br />
floods; make recommendations and act on them.<br />
b. Encourage development of evacuation plan for all disasters.<br />
c. Encourage placement of flash flood warning signs.
8<br />
<strong>Jefferson</strong> <strong>County</strong> – Section 4<br />
d. Encourage special needs population to develop hazard measures to include<br />
distribution of NOAA weather radios; encourage placement of saferooms (in<br />
strategic locations).<br />
3. Decrease occurrence and impact of flooding.<br />
Actions<br />
a. Encourage appropriate jurisdictions to participate in National Flood Insurance<br />
Program, CRS, Hazard Mitigation Plan.<br />
b. Encourage residents, jurisdictions and developers to protect and maintain<br />
natural river and stream channels and corridors.<br />
c. Encourage residents, jurisdictions and developers to utilize, design and/or<br />
build systems to detain stormwater in ways to promote infiltration and<br />
replicate natural movement of water.<br />
d. Encourage local governments and stakeholders to participate in watershed<br />
planning that protect streams against flooding.<br />
e. Encourage jurisdictions to identify remaining repetitive flood loss properties<br />
for buyout purposes; prioritize and implement buyouts.<br />
f. Review and revise flood-fighting plans as appropriate.<br />
g. Encourage jurisdictions to strengthen floodplain regulations.<br />
GOAL # 2: Preserve and maintain property, infrastructure, businesses, and jurisdiction<br />
vitality on local, countywide and regional basis.<br />
Objectives:<br />
1. Reduce or prevent impacts from hazards on private properties<br />
Actions<br />
a. Encourage education of residents, businesses and jurisdictions on hazards by<br />
circulating brochures, checklist and preparedness kits to prepare structures<br />
for disasters (such as tiedowns, gas shutoff valves and other utilities).<br />
b. Encourage jurisdiction planning departments to work with home builders<br />
associations, realtors’ associations, developers; encourage use of hazard<br />
maps by public for purchasing, construction, improvement of properties.<br />
c. Encourage utilities and communications businesses and developers to<br />
consider installation of underground electric and communications lines.<br />
2. Reduce or prevent impacts from hazards on public properties.
A Regional Overview All-Hazard Mitigation Plan 9<br />
Actions<br />
a. Encourage jurisdictions adopting and enforcing most current<br />
codes, ordinances, policies for all hazards, especially floods, earthquakes<br />
and tornadoes.<br />
b. Encourage those who are responsible for special needs populations to take<br />
FEMA structural safety training classes for building integrity.<br />
c. Encourage emergency response agencies and districts to locate facilities<br />
away from all geographically redundant hazard areas<br />
d. Encourage jurisdictions to adopt open burning control ordinances<br />
e. Utilize municipal leagues as nexus for coordination<br />
f. Encourage appropriate jurisdiction agencies to coordinate communications<br />
plan for hazard events.<br />
g. Encourage appropriate jurisdictions, state and federal agencies to review,<br />
prioritize emergency route and retrofit infrastructure (roads, bridges,<br />
buildings, emergency medical facilities) that will be utilized for disasters.<br />
h. Upgrade lifeline facilities to meet current building code seismic standards<br />
GOAL #3: Encourage growth that is compatible with hazard mitigation strategies<br />
identified in this plan on a local, countywide and regional basis.<br />
Objectives:<br />
1. Develop collaborative hazard mitigation efforts across jurisdictional boundaries.<br />
Actions<br />
a. Encourage jurisdictions and local emergency management agencies to<br />
implement Hazard Mitigation Plan.<br />
b. Encourage partnering with local, county and region-wide governments<br />
c. Encourage coordination between levee districts in order to protect upstream<br />
and downstream interests.<br />
d. Highly recommend proper recordkeeping of pertinent documents related to<br />
disasters.<br />
2. Reduce impacts and promote protection to natural resources.<br />
Actions<br />
a. Encourage development of jurisdiction land use plans, zoning and<br />
regulations to protect downstream residents from impacts of dam failure.<br />
b. Encourage jurisdictions to educate residents on proper disposal of yard,<br />
commercial and household waste (not in sewer system or streams).<br />
c. Encourage jurisdictions, residents to clean up creeks and streams.
10<br />
<strong>Jefferson</strong> <strong>County</strong> – Section 4<br />
d. Encourage jurisdictions to assist MDNR in full implementation of dam safety<br />
program.<br />
e. Encourage jurisdictions to develop greenways for flood protection that<br />
parallel streams, rivers<br />
f. Encourage jurisdictions to become familiar and comply with drought/water<br />
restrictions<br />
g. Encourage jurisdictions and local stakeholders to work together to protect<br />
watersheds and encourage sound stormwater practices for flood protection.<br />
Strategic Implementation<br />
The State of Missouri SEMA requires that the Hazard Mitigation Plan contain a description<br />
of the jurisdiction’s mitigation strategy for reducing disaster damages and implementing<br />
mitigation activities.<br />
Adoption of the plan demonstrates <strong>Jefferson</strong> <strong>County</strong>’s commitment to working toward<br />
fulfilling the mitigation goals and objectives outlines in the plan. This also legitimizes the<br />
plan and authorizes the various responsible agencies to incorporate mitigation as a part of<br />
their job duties. Adoption fulfills requirements of several Federal programs (CRS, FMS) that<br />
require local governments to adopt mitigation strategy. Adoption mechanisms provide a<br />
better opportunity for the mitigation planning activities to be ingrained into regular<br />
government operations. <strong>Jefferson</strong> <strong>County</strong>’s Hazard Mitigation Plan will be implemented by<br />
various departments and agencies within <strong>Jefferson</strong> <strong>County</strong>. The implementation process<br />
will include coordination among the <strong>County</strong> departments and coordinated with other<br />
relevant agencies or districts though <strong>Jefferson</strong> <strong>County</strong>’s Emergency Management Agency.<br />
<strong>Jefferson</strong> <strong>County</strong> will set up a system to monitor progress and evaluate the effectiveness of<br />
implemented actions with revisions as needed. Every five years, the county will review the<br />
plan and include any needed updates. The updated plan will be submitted for<br />
SEMA/FEMA approval. Copies of the signed adoption resolutions are included in the<br />
Regional Overview. The plan will be reviewed for any updates following any major<br />
disasters that occur within the county.<br />
Cities with Higher Exposure to <strong>County</strong> Hazards<br />
The cities of Arnold, Byrnes Mill, Cedar Hill Lakes, DeSoto, Festus, Herculaneum Kimmswick,<br />
Pevely, and Scotsdale are the incorporated areas within <strong>Jefferson</strong> <strong>County</strong> that are found to<br />
have a significantly higher exposure to those hazards affecting the <strong>County</strong>. The <strong>County</strong>’s<br />
goals, objectives, and actions encompass those needed to deal with the issues found in<br />
these cities; especially targeting repetitive flood loss properties for buyout. It is<br />
recommended that <strong>Jefferson</strong> <strong>County</strong> work with these cities to incorporate county actions<br />
into these jurisdictions specific hazard mitigation concerns.
A Regional Overview All-Hazard Mitigation Plan 11<br />
Analysis and Prioritization of Mitigation Actions<br />
<strong>Jefferson</strong> <strong>County</strong>’s mitigation actions promote and/or support the development of local<br />
hazard mitigation plans, projects and activities. Examples of actions include instituting<br />
watershed plans, encouraging adoption of the most current codes and ordinances,<br />
development of flood fighting plans, prioritizing flood buyout properties.<br />
The following matrix provides an analysis and prioritization of the county’s hazard<br />
mitigation goals, objectives and actions. The matrix distinguishes between the identified<br />
hazards and the county’s mitigation actions. It is recommended that the <strong>County</strong> will place<br />
an emphasis on cost-benefit analysis for further mitigation project prioritization purposes<br />
when the budget analyses are conducted. The matrix also identifies those agencies<br />
responsible for implementation along with the respective funding sources. It is<br />
recommended that actions be coordinated, where applicable with Missouri’s mitigation<br />
actions.<br />
Criteria for prioritization are:<br />
Historically, <strong>Jefferson</strong> <strong>County</strong> has been most affected by flooding hazards followed in<br />
severity by tornado/thunderstorm, severe winter storm, heat wave, and drought. The risk<br />
of earthquake, dam failure and wildfire must be addressed, even though the <strong>County</strong> has<br />
not yet experienced these hazards.<br />
Some actions may be high priorities, but will require a lengthy planning process. These<br />
types of actions will be designated as a “high priority” with a future target date for<br />
completion.<br />
Certain hazards can impact incorporated areas more than the <strong>County</strong> as a whole. The<br />
incorporated areas that could be specifically affected are identified as follows:<br />
1= Arnold<br />
2=Byrnes Mill<br />
3=Cedar Hill Lakes<br />
4=Crystal City<br />
5=DeSoto<br />
6=Festus<br />
7=Herculaneum<br />
8=Kimmswick<br />
9=Pevely<br />
10=Scotsdale<br />
11= All communities<br />
<strong>Jefferson</strong> <strong>County</strong> involvement is assumed for all of the items on the following Action<br />
Matrix.
12<br />
Monitoring, Evaluating and Updating the Plan<br />
<strong>Jefferson</strong> <strong>County</strong> – Section 4<br />
The narrative below describes the process to follow for monitoring, evaluating,<br />
maintaining, updating and obtaining SEMA/FEMA’s approval of the Hazard Mitigation Plan<br />
every five years and on an as needed basis.<br />
In the course of their duties, emergency managers, in collaboration with their respective<br />
Emergency Management Committee should meet annually and on an informal and routine<br />
basis to focus on monitoring and evaluating as well as updating the Hazard Mitigation<br />
Plan. In addition, a regional meeting could also be organized by Emergency Managers on<br />
an annual basis to provide cross-jurisdictional information sharing federal and state<br />
updates and opportunities for project development, implementation, and funding with<br />
jurisdictions and stakeholders. It is recommended that the Emergency Management<br />
Committee include <strong>County</strong> Commissioners, municipal officials, fire, law enforcement,<br />
emergency medical and public health officials for various objectives of this plan. It is<br />
recommended that the <strong>County</strong> public notice these meetings and encourage the public to<br />
participate.<br />
It is recommended that the committee review each goal and objective to determine the<br />
relevance to local, regional, statewide and federal disaster situations and to ensure that<br />
they are addressing current and expected conditions. The committee should review the risk<br />
assessment portion of the plan to determine if this information should be updated. The<br />
parties responsible for the various implementation actions should report on the status of<br />
their projects and will include which implementation processes worked well, difficulties<br />
encountered, coordination efforts and which strategies should be revised.<br />
The Emergency Management Committee should take three months to update the plan<br />
before submitting it to the State Hazard Mitigation Officer. If no changes are necessary,<br />
the State Hazard Mitigation Officer should be given a justification for this determination.<br />
Copies of the plan should be catalogued and kept on hand at the main <strong>Jefferson</strong> <strong>County</strong><br />
library branch. In addition, a copy of the plan will be available on the <strong>East</strong>-<strong>West</strong> <strong>Gateway</strong><br />
<strong>Council</strong> of Governments website (www.ewgateway.org), the Office of Emergency<br />
Management and at the <strong>Jefferson</strong> <strong>County</strong> Clerk’s Office. The existence and location of<br />
these copies should be publicized by the daily local newspaper, and listed on the county<br />
website. Contained in the plan is the address and telephone number of the Office of<br />
Emergency Management responsible for keeping track of public comments on the plan.<br />
Copies of the plan and proposed changes will be posted on the county website. The site<br />
will contain an email address and telephone number to which people can direct their<br />
comments. A link to this site will be provided on University of Missouri-St. Louis website<br />
and the <strong>East</strong>-<strong>West</strong> <strong>Gateway</strong> <strong>Council</strong> of Governments website. The general public should be<br />
encouraged to attend these meetings through media coverage, published notices,<br />
reminders, and civic meetings.
A Regional Overview All-Hazard Mitigation Plan 13<br />
WORKSHEET<br />
JEFFERSON COUNTY FIVE-YEAR ACTION MATRIX WORKSHEET
14<br />
Community<br />
Action<br />
Type of<br />
Strategy<br />
New,<br />
Revision/Ongoing<br />
<strong>Jefferson</strong> <strong>County</strong>'s Proposed Five-Year Action Matrix<br />
Estimated<br />
Target Date<br />
Goal #1: Prevent loss of life, minimize illness, injury on local, countywide and regional basis.<br />
1.1 Raise public awareness.<br />
11<br />
11<br />
11<br />
11<br />
11<br />
Encourage development of<br />
public outreach program<br />
Encourage development of<br />
hazard measures for<br />
visitors, employees<br />
Encourage development of<br />
emergency management<br />
curriculum in schools<br />
Encourage agencies to<br />
identify and develop<br />
jurisdiction outreach plan<br />
for special needs<br />
population<br />
Encourage education,<br />
need, construction of<br />
saferooms in mobile home<br />
parks<br />
1.2 Establish warning systems for all hazards.<br />
Encourage jurisdictions to<br />
work with LEPC, EMA to<br />
determine and report on<br />
warning system data gaps<br />
including dam failure,<br />
11 tornadoes, flash floods<br />
11<br />
Encourage development of<br />
evacuation plan for all<br />
natural disasters<br />
Public<br />
Information New & Ongoing<br />
Public<br />
Information New & Ongoing<br />
Public<br />
Information New & Ongoing<br />
Public<br />
Information New<br />
Public<br />
Information New<br />
Emergency<br />
Services New<br />
Emergency<br />
Services New & Ongoing<br />
2005 &<br />
Continuing<br />
Probable Lead<br />
Organizer<br />
<strong>County</strong><br />
Information/<br />
Planning Officer<br />
Potential<br />
Funding<br />
Sources Priority Evaluation<br />
fed, state,<br />
local govt.<br />
program funds High<br />
2006 &<br />
Continuing <strong>County</strong> EMA internal funds<br />
fed & state<br />
govt. program<br />
Low<br />
2005 &<br />
funds/ private<br />
Continuing Schools funding High<br />
2005 &<br />
Continuing<br />
2004 &<br />
Continuing<br />
<strong>County</strong><br />
Information/<br />
Planning Officer<br />
American Red<br />
Cross<br />
2005 &<br />
Annually <strong>County</strong> EMA<br />
2004 &<br />
Continuing <strong>County</strong> EMA<br />
fed, state,<br />
local govt.<br />
program funds High<br />
govt. program<br />
funds/ private<br />
funding High<br />
fed, state,<br />
local govt.<br />
program funds High<br />
govt. program<br />
funds Medium<br />
<strong>Jefferson</strong> <strong>County</strong> – Section 4<br />
Identified Natural Hazards<br />
Tornado<br />
Flood<br />
Winter<br />
Drought<br />
Heat Wave<br />
Earthquake<br />
Dam Failure<br />
Wildfire<br />
Program completed<br />
and distributed x x x x x x x x<br />
Program completed<br />
and distributed x x x x x x<br />
Curriculum<br />
completed and<br />
implemented x x x x x x x<br />
Program completed,<br />
distributed and<br />
implemented x x x x x x x<br />
Program completed,<br />
distributed and<br />
implemented x<br />
Program completed,<br />
distributed and<br />
implemented x x x x x x x x<br />
Program completed,<br />
distributed and<br />
implemented x x x x x x x x
A Regional Overview All-Hazard Mitigation Plan 15<br />
1,2,3,4,5,6,7,8,9, Encourage placement of<br />
10 flood warning signs<br />
11<br />
Encourage special needs<br />
population obtain NOAA<br />
weather radios, saferooms<br />
(in strategic locations)<br />
1.3 Decrease occurrence and impacts of flooding.<br />
1,2,3,4,5,6,7,8,9, Encourage participation in<br />
10<br />
Encourage residents,<br />
jurisdictions, developers to<br />
protect, maintain rivers,<br />
11 corridors Prevention<br />
1,2,3,4,5,6,7,8,9,<br />
10<br />
1,2,3,4,5,6,7,8,9,<br />
10<br />
1,2,3,4,5,6,7,8,9,<br />
10<br />
Emergency<br />
Services Ongoing Continuing <strong>County</strong> EMA<br />
Emergency<br />
Services New & Ongoing<br />
NFIP, CRS Prevention Ongoing<br />
Encourage residents,<br />
jurisdictions, developers to<br />
use, design, build systems<br />
New and<br />
ongoing<br />
to detain stormwater that<br />
replicates natural water<br />
movement Structural New & Ongoing<br />
Encourage jurisdictions,<br />
stakeholders to participate<br />
in watershed planning to<br />
protect against floods Prevention New & Ongoing<br />
Encourage jurisdictions to<br />
identify, purchase<br />
remaining repetitive flood<br />
loss buyout properties<br />
Property<br />
Protection Ongoing<br />
2004 &<br />
Continuing <strong>County</strong> EMA<br />
2004 &<br />
Continuing<br />
2004 &<br />
Continuing<br />
2004 &<br />
Continuing<br />
2004 &<br />
Continuing<br />
2004 &<br />
Continuing<br />
fed, state,<br />
local govt.<br />
program funds Medium Signs placed x x<br />
govt. program<br />
funds/ private<br />
funding High<br />
Program completed,<br />
distributed and<br />
implemented x x x x<br />
<strong>County</strong><br />
Floodplain<br />
manager internal funds High Status Improved x x<br />
Watershed<br />
Advisory<br />
Committee internal funds Medium Status Improved x x<br />
University<br />
Engineering<br />
Department<br />
Watershed<br />
Advisory<br />
Committee<br />
Floodplain<br />
manager<br />
govt. program<br />
funds/ private<br />
funding High<br />
Design<br />
Plans/Construction of<br />
Structures x x<br />
govt. program<br />
funds/ private<br />
funding High Attendance Records x x<br />
govt. program<br />
funds High<br />
Repetitive Loss<br />
Properties Mitigated x x
16<br />
1,2,3,4,5,6,7,8,9, Revise flood-fighting plans<br />
10 as needed<br />
1,2,3,4,5,6,7,8,9,<br />
10<br />
Emergency<br />
Services Ongoing<br />
Encourage jurisdictions to<br />
strengthen floodplain<br />
regulations to reduce<br />
impacts from flooding Prevention Ongoing<br />
2004 &<br />
Annually<br />
2004 &<br />
Continuing<br />
Goal #2: Preserve and maintain property, infrastructure, businesses, jurisdiction vitality.<br />
2.1 Reduce or prevent impacts from hazards on private properties.<br />
11<br />
11<br />
11<br />
Encourage education of<br />
residents on property<br />
protection from hazards<br />
(checklists, preparedness<br />
kits)<br />
Jurisdiction planning<br />
department encouraged to<br />
use hazard maps with<br />
developers, home buyers,<br />
construction, engineers Prevention New<br />
Encourage utilities,<br />
communications,<br />
developers to installation of<br />
underground lines Prevention New<br />
2.2 Reduce or prevent impacts from hazards on public properties.<br />
Encourage jurisdictions to<br />
adopt, enforce most<br />
current codes, ordinances<br />
11 for all hazards<br />
Encourage those<br />
responsible for special<br />
needs population to take<br />
FEMA structural safety<br />
Prevention New<br />
classes for building<br />
New and<br />
11 integrity Prevention ongoing<br />
11<br />
Encourage emergency<br />
response agencies and<br />
districts to locate facilities<br />
away from geographically<br />
redundant areas<br />
<strong>County</strong><br />
Floodplain<br />
manager<br />
<strong>County</strong><br />
Commission<br />
Public<br />
Information Ongoing Ongoing <strong>County</strong> EMA<br />
Property<br />
Protection New<br />
2004 &<br />
Continuing<br />
2005 &<br />
Continuing<br />
2004 &<br />
Continuing<br />
fed, state,<br />
local govt.<br />
program funds High<br />
fed, state,<br />
local govt.<br />
program funds High<br />
<strong>Jefferson</strong> <strong>County</strong> – Section 4<br />
Updated Plans<br />
Revised and Adopted x x<br />
Revised Regulations<br />
in Place x x<br />
fed, state,<br />
local govt.<br />
program funds High Status Improved x x x x x x x x<br />
<strong>County</strong><br />
Planning/Building<br />
Department internal funds High<br />
<strong>County</strong><br />
Planning/Building<br />
Department internal funds Low<br />
2004 &<br />
Continuing <strong>County</strong> EMA<br />
2004 &<br />
Continuing <strong>County</strong> EMA<br />
<strong>County</strong><br />
Commission internal funds High<br />
Completed and<br />
publicized x x x x x<br />
Inquiries and Design<br />
Plans/Construction of<br />
Underground<br />
Infrastructure<br />
Revised Regulations<br />
in Place x x x x x x x x<br />
fed & state<br />
govt. program<br />
funds High Attendance Records x<br />
fed, state,<br />
local govt.<br />
program funds High<br />
At Risk Facilities<br />
Relocated x x x x
A Regional Overview All-Hazard Mitigation Plan 17<br />
11<br />
11<br />
11<br />
11<br />
redundant areas<br />
Encourage jurisdictions to<br />
adopt open burning<br />
control ordinances<br />
Encourage jurisdictions to<br />
coordinate<br />
Prevention Ongoing<br />
communications plans<br />
Encourage jurisdictions,<br />
state, federal agencies to<br />
review, prioritize<br />
emergency routes, retrofit<br />
Prevention Ongoing<br />
infrastructure<br />
Encourage upgrade of<br />
lifeline facilities to meet<br />
Prevention New & Ongoing<br />
seismic codes Prevention New<br />
2005 & <strong>County</strong><br />
Revised Regulations<br />
Continuing Commission internal funds<br />
fed & state<br />
Low in Place x<br />
2004 &<br />
govt. program<br />
Continuing <strong>County</strong> EMA funds Medium Status Improved x x x x x x x x<br />
2005 &<br />
Continuing <strong>County</strong> EMA<br />
2005 &<br />
Continuing <strong>County</strong> EMA<br />
fed & state<br />
govt. program<br />
funds Medium<br />
fed & state<br />
govt. program<br />
funds Medium<br />
Encourage growth that is compatible with hazard mitigation strategies identified in this plan on local, countywide and regional basis.<br />
3.1 Develop collaborative multi-interest committee to develop and achieve multi-jurisdictional goals.<br />
11<br />
11<br />
Encourage jurisdictions to<br />
implement hazard<br />
mitigation plan Prevention New<br />
Encourage partnering with<br />
local, county, region-wide,<br />
state governments;<br />
encourage legislation to<br />
promote, establish state<br />
planning department Prevention New<br />
Encourage state planning<br />
department to coordinate<br />
levee districts to protect<br />
1,2,3,4,5,6,7,8,9, those living upstream and<br />
10<br />
Recommend pertinent<br />
jurisdictions conduct<br />
proper recordkeeping for<br />
all documents related to<br />
11 natural disasters<br />
downstream Prevention New<br />
Public<br />
Information New<br />
3.2 Reduce impacts and promote protection of natural resources.<br />
2004 and<br />
annually <strong>County</strong> EMA internal funds High<br />
2004 &<br />
Continuing Legislature internal funds High<br />
2004 &<br />
Continuing<br />
State Planning<br />
Department internal funds High<br />
Completed and<br />
Implemented x<br />
Construction<br />
Complete x<br />
Plan Completed and<br />
Implemented x x x x x x x x<br />
Establishment of<br />
State Planning<br />
Department x x x x x x x x<br />
Levee Districts<br />
inventoried x x<br />
2004 &<br />
Continuing <strong>County</strong> internal funds Low Documents Archived x x x x x x x x
18<br />
Encourage development of<br />
jurisdictions' land use plans,<br />
zoning, regulations to<br />
protect downstream<br />
1,2,3,4,5,6,7,8,9, residents from impacts of<br />
10<br />
dam failure<br />
Encourage jurisdictions to<br />
educate residents on<br />
proper disposal of yard,<br />
commercial, household<br />
11 waste<br />
11<br />
1,2,3,4,5,6,7,8,9,<br />
10<br />
11<br />
11<br />
11<br />
Encourage jurisdictions,<br />
residents to maintain<br />
creeks, streams<br />
Encourage jurisdictions to<br />
assist MDNR in full<br />
implementation of dam<br />
safety program<br />
Encourage jurisdictions to<br />
develop greenways for<br />
flood protection that<br />
parallel streams and rivers<br />
Encourage jurisdictions to<br />
become familiar and<br />
comply with drought,<br />
water restrictions<br />
Encourage jurisdictions,<br />
stakeholders to work<br />
together together to<br />
protect watersheds and<br />
encourage stormwater<br />
practices for flood<br />
protection<br />
Natural<br />
resource<br />
protection New<br />
2004 &<br />
Continuing<br />
Natural<br />
resource<br />
protection Ongoing Ongoing<br />
Natural<br />
resource<br />
protection Ongoing Ongoing<br />
Natural<br />
resource<br />
protection New<br />
2004 &<br />
Continuing<br />
Natural<br />
resource<br />
protection New & Ongoing Ongoing<br />
Natural<br />
resource<br />
protection New<br />
Natural<br />
resource<br />
protection New & Ongoing<br />
<strong>Jefferson</strong> <strong>County</strong> – Section 4<br />
<strong>County</strong><br />
Planning/Zoning<br />
Officer internal funds High Regulations in place x x<br />
<strong>County</strong><br />
Department of<br />
Environment internal funds Low Status Improved x x<br />
Watershed<br />
Advisory<br />
Committee internal funds Low Status Improved x x<br />
<strong>County</strong><br />
Planning/Zoning<br />
Officer<br />
2004 &<br />
Continuing NRCS<br />
2004 &<br />
Continuing<br />
Potential<br />
Funding<br />
Sources High<br />
Watershed<br />
Advisory<br />
Committee internal funds Medium<br />
Status Improved/Risk<br />
Reduced x x<br />
Design<br />
Plans/Construction of<br />
Greenways x x<br />
fed & state<br />
govt. program<br />
funds Low Status Improved x x<br />
Watershed<br />
Advisory<br />
Committee internal funds High<br />
Establishment of<br />
Sustainable<br />
Watershed<br />
committees x x<br />
1 Arnold 2 Byrnes Mill 3 Cedar Hill Lakes 4 Crystal City 5 DeSoto 6 Festus 7 Herculaneum 8 Kimmswick 9 Pevely 10 Scotsdale 11 All Communities