
You also want an ePaper? Increase the reach of your titles
YUMPU automatically turns print PDFs into web optimized ePapers that Google loves.
New venue: Interbike moves<br />
down Strip to Mandalay Bay.<br />
20YEARS<br />
OF JOURNALISM<br />
FOR THE TRADE<br />
bicycleretailer.com<br />
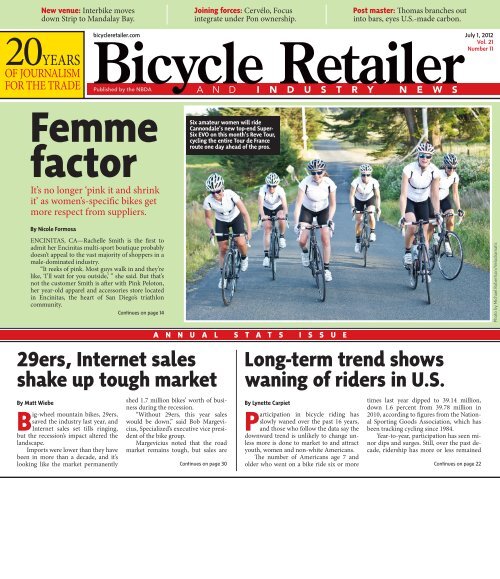
Femme<br />
factor<br />
It’s no longer ‘pink it and shrink<br />
it’ as women’s-specific bikes get<br />
more respect from suppliers.<br />
By Nicole Formosa<br />
ENCINITAS, CA—Rachelle Smith is the first to<br />
admit her Encinitas multi-sport boutique probably<br />
doesn’t appeal to the vast majority of shoppers in a<br />
male-dominated industry.<br />
“It reeks of pink. Most guys walk in and they’re<br />
like, ‘I’ll wait for you outside,’ ” she said. But that’s<br />
not the customer Smith is after with Pink Peloton,<br />
her year-old apparel and accessories store located<br />
in Encinitas, the heart of San Diego’s triathlon<br />
community.<br />
Continues on page 14<br />
29ers, Internet sales<br />
shake up tough market<br />
By Matt Wiebe<br />
Big-wheel mountain bikes, 29ers,<br />
saved the industry last year, and<br />
Internet sales set tills ringing,<br />
but the recession’s impact altered the<br />
landscape.<br />
Imports were lower than they have<br />
been in more than a decade, and it’s<br />
looking like the market permanently<br />
<strong>Joining</strong> forces: Cervélo, Focus<br />
integrate under Pon ownership.<br />
A N N U A L S T A T S I S S U E<br />
shed 1.7 million bikes’ worth of business<br />
during the recession.<br />
“Without 29ers, this year sales<br />
would be down,” said Bob Margevicius,<br />
Specialized’s executive vice president<br />
of the bike group.<br />
Margevicius noted that the road<br />
market remains tough, but sales are<br />
Six amateur women will ride<br />
Cannondale’s new top-end Super-<br />
Six EVO on this month’s Reve Tour,<br />
cycling the entire Tour de France<br />
route one day ahead of the pros.<br />
Continues on page 30<br />
By Lynette Carpiet<br />
Participation in bicycle riding has<br />
slowly waned over the past 16 years,<br />
and those who follow the data say the<br />
downward trend is unlikely to change unless<br />
more is done to market to and attract<br />
youth, women and non-white Americans.<br />
The number of Americans age 7 and<br />
older who went on a bike ride six or more<br />
Post master: Thomas branches out<br />
into bars, eyes U.S.-made carbon.<br />
Long-term trend shows<br />
waning of riders in U.S.<br />
July 1, 2012<br />
Vol. 21<br />
Number 11<br />
times last year dipped to 39.14 million,<br />
down 1.6 percent from 39.78 million in<br />
2010, according to figures from the National<br />
Sporting Goods Association, which has<br />
been tracking cycling since 1984.<br />
Year-to-year, participation has seen minor<br />
dips and surges. Still, over the past decade,<br />
ridership has more or less remained<br />
Continues on page 22<br />
Photo by Michael Robertson/Velodramatic
14<br />
Continued from cover<br />
Femme factor<br />
She wants the women.<br />
Smith has a long background in<br />
customer service, sales and inventory<br />
control for Reebok, Active, Zoot and<br />
Lululemon, but it was her one-year stint<br />
working the retail floor at B&L Bike Shop<br />
that initially got her thinking about the<br />
potential for a women’s-specific shop.<br />
“I think that’s when the seed was<br />
planted that there’s this huge miss going<br />
on. They couldn’t give me enough hours<br />
on the floor to help all the women. The<br />
women didn’t want to talk to the guys;<br />
they wanted to talk to me,” she said.<br />
So she opened Pink Peloton as a onestop<br />
shop for female athletes—new or<br />
accomplished—to buy gear, attend clinics<br />
or join group rides.<br />
Progress has been slow and there are<br />
days when Smith has her doubts, but the<br />
timing of her new venture could end up<br />
being spot-on, with women’s-specific<br />
product finally garnering more attention<br />
and resources from the industry’s biggest<br />
suppliers.<br />
The days of women’s frames sharing<br />
molds with men’s versions and<br />
male designers and product managers<br />
developing women’s apparel and bikes<br />
are rapidly disappearing as companies<br />
start investing in female staff to work on<br />
women’s projects and putting real dollars<br />
behind the product.<br />
When developing Cannondale’s new<br />
line of SuperSix women’s carbon fiber<br />
Men’s vs. women’s bike sales, 2009-2011 and January-April 2012<br />
EVOs, its highest-ever-spec’d women’s<br />
road bikes, Lyriel Jordan, Cannondale’s<br />
global senior product manager, came up<br />
with five new unique frames sizes. That<br />
required five distinct molds at the factory<br />
that didn’t piggyback on the men’s<br />
EVO, which debuted more than a year<br />
earlier.<br />
“I’m happy to say with women’s<br />
there’s justification for it now. Three<br />
years ago, we couldn’t have done it,” Jordan<br />
said. Cannondale also released its<br />
first women’s-specific 29er last month<br />
at PressCamp, the Tango aluminum<br />
hardtail, which retails between $800 and<br />
$1,300. The next goal is to beef up the<br />
high-end women’s mountain bike line.<br />
Since 2009, revenue from Cannondale’s<br />
women’s line has increased 150<br />
percent, with 68 percent of that growth<br />
UNITS SOLD DOLLARS SOLD<br />
2009 2010 2011 2012 2009 2010 2011 2012<br />
ROAD MEN’S 74.31% 75.63% 74.17% 73.31% 77.13% 78.56% 77.53% 78.25%<br />
WOMEN’S 25.69% 24.37% 25.83% 26.69% 22.87% 21.44% 22.47% 21.75%<br />
MOUNTAIN MEN’S 82.02% 80.85% 82.12% 82.74% 85.80% 86.21% 87.95% 88.31%<br />
LIFESTYLE/<br />
LEISURE<br />
TRANSIT/<br />
FITNESS<br />
WOMEN’S 17.98% 19.15% 17.88% 17.26% 14.20% 13.79% 12.05% 11.69%<br />
MEN’S 48.22% 51.05% 49.20% 48.13% 46.95% 49.84% 47.68% 47.06%<br />
WOMEN’S 51.78% 48.95% 50.80% 51.87% 53.05% 50.16% 52.32% 52.94%<br />
MEN’S 71.05% 69.44% 69.19% 64.19% 72.20% 70.84% 69.89% 64.95%<br />
WOMEN’S 28.95% 30.56% 30.81% 35.81% 27.80% 29.16% 30.11% 35.05%<br />
OTHER MEN’S 98.97% 97.70% 98.12% 98.56% 97.52% 94.69% 96.15% 97.26%<br />
Source: Leisure Trends RetailTrak<br />
WOMEN’S 1.03% 2.30% 1.88% 1.44% 2.48% 5.31% 3.85% 2.74%<br />
occurrig since 2010, said Mandy Braverman,<br />
women’s global marketing manager.<br />
Those kinds of numbers give the<br />
women’s team ammunition when proposing<br />
new products and to lobby internally<br />
for resources, an ongoing challenge<br />
as women’s categories inch up toward<br />
their male counterparts. While most female<br />
product managers in the industry<br />
would like to spec out an XTR carbon fiber<br />
frame 29er or a fast, flashy Dura-Ace<br />
Di2 road bike, they’re up against a bit of<br />
a disadvantage when the R&D dollars<br />
are doled out.<br />
“Probably 85 to 90 percent of product<br />
managers are men. They’re going to<br />
want to see a bike they can ride first. It’s<br />
really hard to get that past them,” Jordan<br />
said.<br />
And the volume in the women’s part<br />
of the business is still squarely in the sub-<br />
$1,000 transit/fitness category, making it<br />
more difficult to validate big investments<br />
on high-zoot products.<br />
Sales of women’s road bikes have<br />
hovered around 25 percent of the overall<br />
units sold in the U.S. for the past four<br />
years, and mountain bikes around 17 to<br />
18 percent, according to data captured<br />
through Leisure Trends’ RetailTRAK<br />
program. The two categories where<br />
women’s product represents a significant<br />
chunk of the pie is lifestyle/leisure at 50<br />
percent, where brands like Electra, Linus<br />
and Public stand to win big, and transit/<br />
fitness at about 35 percent.<br />
Much of the growth in the men’s road<br />
category over the past four years has occurred<br />
in the $3,000 to $7,000 range,<br />
while women’s unit sales drop sharply
eyond the $3,000 threshold. On the mountain side, men’s unit<br />
sales between $2,300 and $5,000 have risen significantly while<br />
women’s growth is more centered between $1,500 and $1,900.<br />
Greg Shoenfeld, retail relations manager for Leisure Trends,<br />
said women’s bikes haven’t mirrored the industry’s recent<br />
growth in high-end carbon fiber sport performance bikes.<br />
“I would say the development for women’s-specific product<br />
is laggard to men’s. Women’s product is not necessarily benefiting<br />
from trends in men’s product. It can’t keep up with the<br />
growth in men’s product,” Shoenfeld said. That could stem from<br />
many reasons. Safety issues are a huge barrier to entry, and<br />
women may feel more comfortable on hybrid or commuterstyle<br />
bikes as cities add more safe routes and dedicated bike<br />
lanes. Also, as women reach the age where they have the money<br />
and desire to drop $5,000 on a bike, a large proportion are likely<br />
in their child-rearing years.<br />
“Naturally, that’s going to take some people out of the pool,”<br />
Shoenfeld said.<br />
But as more brands develop women’s-specific product, particularly<br />
29ers, where the momentum in mountain bikes has<br />
been in recent years, women’s categories could quickly catch<br />
up.<br />
“If we look at it as the glass is half full, a lot of opportunity<br />
remains in women’s product. There is a lot more sitting in the<br />
pipeline since brands have focused on the men’s pipeline because<br />
that’s where the bulk of the business is,” Shoenfeld said.<br />
That opportunity is not lost on brands like Sugoi and Pearl<br />
Izumi, which lead the women’s apparel category. Giant will expand<br />
its Liv/Giant women’s store-in-store concept to as many<br />
as 35 shops this year, has added a second women’s demo van<br />
and is developing a women’s-specific line of price-point performance<br />
shorts and jerseys. It launched a women’s-specific midrange<br />
full-suspension 29er line this spring and will follow up<br />
with more high-performance options this summer. Specialized<br />
is rebranding its women’s division, dubbed I Am Specialized<br />
Women, in a new campaign rolling out this month at its dealer<br />
event in Utah designed to capture the attention of new riders, a<br />
demographic the performance-oriented brand has had trouble<br />
resonating with in the past despite appealing to women with a<br />
more hard-core edge.<br />
Trek has long been a leader with its Women’s Specific Design,<br />
and brands like Jamis and Bianchi are broadening their<br />
female-specific lines.<br />
And retailers who specialize in selling women’s gear say it’s<br />
starting to make a difference on the sales floor.<br />
At the end of her second year, Robin Bylenga, owner<br />
of Pedal Chic in Greenville, South Carolina, is closing in on<br />
$500,000 in revenue and is well on her way to profitability by<br />
doing things differently—carrying women’s apparel other shops<br />
shun, organizing “Spin and Sip” rides with wine and appetizers<br />
Women’s multi-sport boutique Pink Peloton<br />
and producing fun how-to YouTube videos on fixing flats<br />
without ruining a manicure.<br />
Across the country in Berkeley, California, Kristie Hamilton—general<br />
manager of Mike’s Bikes, one of the first<br />
women in the company and the first female manager—said<br />
that five years ago it was rare to see a women’s-specific bike<br />
on the floor; now about a quarter of the 300 bikes on display<br />
are designed for female riders. There are still challenges, like<br />
bikes that are spec’d a step down from the men’s version or<br />
designed with “cutesy” graphics, but slowly the industry is<br />
figuring out what women want.<br />
“I hope it just gets better. I’d like to have 50-50. I don’t<br />
know if that’s ever going to happen,” she said.<br />
Pedal Chic owner Robin Bylenga<br />
July 1, 2012<br />
15
22<br />
Continued from cover<br />
Riders<br />
around 39 million to 40 million, according<br />
to NSGA numbers. Yet U.S. population<br />
has grown by 27 million over the<br />
same period, indicating that the number<br />
of riders as a percentage of the total population<br />
is down.<br />
Taking a longer view, the drop is even<br />
more significant. In fact, NSGA numbers<br />
alone show participation has shrunk by<br />
about 15 million since 1995 when cycling<br />
participants peaked at 56 million. This<br />
trend is particularly alarming since conservative<br />
estimates put federal, state and<br />
local investment in bike and pedestrian<br />
Gender and age, 2011 riders<br />
Female:<br />
17.76 million<br />
45.4%<br />
Mean age: 32.5<br />
Male:<br />
21.38 million<br />
54.6%<br />
Mean age: 32.4<br />
A N N U A L S T A T S I S S U E<br />
infrastructure over the same period at<br />
more than $10 billion, an all-time record.<br />
Much of that decline comes from<br />
thinning numbers of women and children<br />
who ride, said Brad Edmondson,<br />
an industry consultant who authored a<br />
report detailing trends in participation<br />
from 2000 to 2010. NSGA numbers show<br />
a decrease of 21 percent and 15 percent<br />
among kids ages 7 to 11 and 12 to 17, respectively,<br />
from 2001 to 2011. And about<br />
10.2 million adult women rode 109 days<br />
or less in 2010, a decrease of 13 percent<br />
since 2000, he pointed out in the report.<br />
It’s also a reflection of the aging baby<br />
boomer segment, which drove growth<br />
in the ’80s and ’90s. As they age, baby<br />
Youth<br />
(age 17 and below)<br />
13.8 million<br />
35.3% Adult<br />
(age 18 and over)<br />
25.4 million<br />
64.6%<br />
boomers are riding less.<br />
But other factors also played a role,<br />
including a decline in overall household<br />
income. “Population grew but the number<br />
of people with discretionary income<br />
went down or was flat,” Edmondson said.<br />
“In general, the decade from 2000 to 2010<br />
was not good times in terms of income<br />
for most people.”<br />
The other trend his report detailed<br />
is that while overall participation has<br />
decreased over the past decade, declines<br />
were across groups who rode infrequently<br />
or occasionally—or what are typically<br />
known as casual riders.<br />
Edmondson pointed out that American<br />
adults who rode a bike at least 110<br />
2011 ridership<br />
Total U.S. participation:<br />
39.14 million<br />
Infrequent riders<br />
(6-24 days)<br />
16.21 million<br />
41.4%<br />
Frequent riders<br />
(110 days or more)<br />
5.29 million<br />
13.5%<br />
Occasional riders<br />
(25-109 days)<br />
17.63 million<br />
45%<br />
Source: National Sporting Goods Association<br />
days a year increased 12 percent from<br />
2000 to 2010 while the total number of<br />
adult riders remained flat at around 25<br />
million.<br />
Still, if overall participation growth is<br />
the goal, the key is increasing the number<br />
of new riders and growing the number of<br />
casual riders. That’s something advocacy<br />
groups like Bikes Belong and the League<br />
of American Bicyclists are working toward,<br />
but it’s difficult to do on a grand<br />
scale with limited finances, said Bikes Belong<br />
president Tim Blumenthal.<br />
“The mainstreaming is what I think<br />
about all the time. Unfortunately, the<br />
Lycra, the helmet, the traditional recreational<br />
bike culture—most American<br />
adults don’t see themselves putting on<br />
that uniform and being part of that tribe.<br />
It’s a barrier to entry. They’re afraid if they<br />
don’t look or act the part, they shouldn’t<br />
ride bikes,” he said.<br />
Bikes Belong has a new series of public<br />
service ads it will soon roll out on billboards,<br />
street furniture and train stations<br />
promoting the idea of bicycling. “I feel<br />
like so many things have improved and<br />
there’s so many good reasons why bicycling<br />
should be more popular in the U.S.<br />
than ever,” Blumenthal said.<br />
One positive trend is the growing<br />
popularity of cycling for transportation.<br />
The League of American Bicyclists’<br />
Andy Clarke and Blumenthal both said<br />
that while small, the number of Americans<br />
commuting to work by bike is up.<br />
Between 2000 and 2009, the number of<br />
commuters who rode to work increased
Boom in baby boomers (participation, in millions)<br />
2001 2011 CHANGE<br />
ADULTS AGE 55 AND OLDER 3.39 6.57 93.8%<br />
Note: Those who rode six times or more<br />
Source: National Sporting Goods Association<br />
by 57 percent. Still, that number is minute<br />
at 765,703 in 2009.<br />
Cycling for transportation has grown<br />
across all 50 major U.S. cities over the<br />
past five years, propelled by infrastructure<br />
improvements and bike-share programs.<br />
And this trend could prove more<br />
positive in the future.<br />
“I’ve really been cheered by the<br />
growth in urban cycling culture,” Edmondson<br />
said. “It’s no longer dorky to<br />
show up on a bike. Women’s cycling participation<br />
is increasing in urban areas<br />
where it’s considered hip to use a bike as<br />
a form of transportation.”<br />
In the Bay Area, companies like Williams-Sonoma,<br />
Facebook and Mozilla<br />
encourage employees to ride between different<br />
offices and buildings and to work,<br />
offering company bike fleets as an alternative<br />
to shuttles and short car trips.<br />
“The tide has turned in terms of seeing<br />
bikes as a solution. That’s on the menu<br />
now,” said Kurt Wallace Martin, who has<br />
carved out a business helping companies<br />
in the private sector develop and launch<br />
employee bike programs over the past<br />
couple of years.<br />
Other potential for growth lies in<br />
ethnic diversification. According to Ed-<br />
A N N U A L S T A T S I S S U E<br />
mondson, Latinos are driving the bus in<br />
terms of population growth, accounting<br />
for most of the spike over the last decade.<br />
But in terms of cycling, they’re still hardly<br />
a blip. “The cycling consumer is overwhelmingly<br />
white, but that group is not<br />
growing,” he said.<br />
One way to draw Americans of different<br />
racial backgrounds is by homing<br />
in on kids and young adults, said industry<br />
consultant Jay Townley, who at press<br />
time was finalizing a study detailing the<br />
growing importance of Generation X and<br />
Generation Y to future sales.<br />
Gen Y, born between 1985 and 2004,<br />
have reached 100 million, are the most<br />
multicultural generation of Americans,<br />
embrace everything green and, according<br />
to recent studies, are driving less and are<br />
less likely and less interested in owning a<br />
car. They feel the impact of the recession<br />
more, so they’re looking for the cheapest<br />
way to go from point A to point B, Edmondson<br />
said.<br />
“We’re going to continue to be at 39<br />
to 40 million in participation until Generation<br />
Y makes itself felt,” Townley said.<br />
“It’s going to take a while if we let it naturally<br />
occur. But if we go after the market,<br />
there’s plenty of potential.”<br />
Youth declines (participation, in millions)<br />
July 1, 2012<br />
2001 2011 CHANGE<br />
KIDS AGES 7-11 9.75 7.69 -21%<br />
KIDS AGES 12-17 7.25 6.10 -15.8%<br />
Note: Those who rode six times or more<br />
Source: National Sporting Goods Association<br />
Participation vs. population growth<br />
2000 2010 CHANGE CHANGE<br />
TOTAL U.S. POPULATION 281,421,000 308,745,000 27,324,000 10%<br />
BICYCLE RIDERS 43,135,000 39,789,000 -3,346,000 -8%<br />
PERCENTAGE OF U.S.<br />
POPULATION<br />
15% 13%<br />
Sources: Census Bureau and National Sporting Goods Association<br />
Participation Study 2010 & 2000<br />
Growth in ride frequency over past five years<br />
MALE<br />
2007 2008 2009 2010 2011<br />
FREQUENT (110 DAYS+) 12.4% 13.7% 13.7% 14.3% 16.4%<br />
OCCASIONAL (25-109 DAYS) 49.4% 48.3% 43.1% 46.6% 45.7%<br />
INFREQUENT (6-24 DAYS) 38.2% 38.0% 43.2% 39.1% 37.9%<br />
FEMALE<br />
FREQUENT (110 DAYS+) 6.8% 7.8% 8.3% 10.9% 10.0%<br />
OCCASIONAL (25-109 DAYS) 45.0% 43.8% 41.5% 43.5% 44.3%<br />
INFREQUENT (6-24 DAYS) 48.2% 48.5% 50.2% 45.6% 45.7%<br />
Source: National Sporting Goods Association<br />
23
26<br />
Up-and-comers rise in relevance to global market<br />
By Nicole Formosa<br />
The retraction in the global economy<br />
squeezed industry suppliers in<br />
Asia last year, causing manufacturers<br />
to turn more attention to promising<br />
potential in Eastern Europe, Southeast<br />
Asia and South America as demand<br />
waned in traditionally strong export<br />
markets.<br />
China—by far the world’s dominant<br />
supplier of bicycles—remained relatively<br />
resilient due to a stabilizing economy in<br />
the U.S., but Taiwan felt the strain from<br />
worsening conditions in the European<br />
Union, whose 27 member states account<br />
for about 60 percent of the island’s exports.<br />
In Taiwan, exports of complete bikes<br />
dropped 13.7 percent overall in units last<br />
year, and fell in each of its top 10 individual<br />
export markets, except for Japan.<br />
The silver lining came in the unit value<br />
of exports, which rose 10.6 percent to<br />
$1.6 billion, speaking to Taiwan’s philosophy<br />
to position itself as an expert in<br />
higher-quality, lower-quantity manufacturing<br />
and leave the big-volume orders<br />
to cheaper labor regions like China, India<br />
and Southeast Asia. Further indicating<br />
that shift, the volume of bike parts<br />
shipped from Taiwan fell 1.3 percent,<br />
but the value rose nearly 19 percent to<br />
$781.7 million.<br />
Exports to the U.S., Taiwan’s second-largest<br />
export market, dipped 7.8<br />
percent to 613,343 units, but values<br />
also rose, climbing nearly 15 percent to<br />
$369 million. Despite a somewhat dire<br />
outlook in North America and Europe,<br />
Taiwan is seeing plenty of promise in<br />
emerging markets. The number of units<br />
and the value of exports soared in China,<br />
Thailand, Brazil, Mexico and Hong<br />
Kong last year as consumers spent more<br />
on cycling.<br />
China imported 32,273 complete<br />
bikes from Taiwan last year—still a<br />
small number in the overall picture, but<br />
a massive 189 percent jump from 2010.<br />
The value of those bikes rose 227 percent<br />
to $16.9 million and the average selling<br />
price was $523, higher than most European<br />
countries, and coming in just below<br />
the average selling price of $601 for<br />
the U.S.<br />
In all, China imported 67,000 bikes<br />
last year, a hefty vault from 2010’s 27,000<br />
and a clear sign of the building market<br />
for midrange to high-end bicycles in<br />
China.<br />
Still, the situation in Europe is<br />
nerve-wracking for Taiwan, which has<br />
become the go-to manufacturing base<br />
for Europe-bound bikes in the face of<br />
steep anti-dumping duties on bicycles<br />
imported to Europe from China.<br />
Moreno Fioravanti, president of<br />
Coliped, the Association of the European<br />
Two-Wheeler Parts’ and Accessories’<br />
Industry, said in general the EU market<br />
was down 7 to 10 percent in 2011 in both<br />
sales and production.<br />
“Most of it was caused by real bad<br />
weather, but also the economic situation<br />
in Europe doesn’t help: The crisis is very<br />
deep and denting the will to purchase<br />
new products. Nevertheless we are not<br />
in the bad situation like other industries.<br />
Motorcycles, cars are down 20 to 30 percent<br />
or more, and much more the housing,”<br />
Fioravanti said.<br />
European global imports of complete bicycles<br />
Imports to EU 27 (in millions of units and dollars)<br />
2007 UNITS/VALUE 2008 UNITS/VALUE 2009 UNITS/VALUE 2010 UNITS/VALUE 2011 UNITS/VALUE<br />
TAIWAN 3.1 $407 3.35 $456 2.85 $492 3.37 $604.6 2.73 $581.9<br />
ITALY N/A 1.43 $104 1.19 $95 1.12 $96.2 1.33 $111.5<br />
THAILAND 1.48 $1.099 1.47 $177.7 1.35 $126.9 1.2 $109.4 .991 $86.5<br />
GERMANY .661 $22.1 1.09 $179.6 .879 $191.7 .785 $221 .731 $208.6<br />
PHILIPPINES .644 $22.1 .423 $15.5 .449 $16.5 .491 $20 .497 $20.1<br />
CHINA .785 $24.1 .739 $29.9 .452 $33.9 .462 $45.4 .492 $42.2<br />
BANGLADESH .355 $18.6 .373 $22.7 .412 $28.6 .504 $37.1 .426 $32.4<br />
CAMBODIA .430 $34.7 .479 $43.3 .444 $48.1 .368 $45.2 .366 $52.1<br />
VIETNAM .029 $2.7 .003 $.35 .007 $.76 .013 $2.1 .226 $28.4<br />
Eastern European imports to EU 27 (in millions of units and dollars)<br />
2007 UNITS/VALUE 2008 UNITS/VALUE 2009 UNITS/VALUE 2010 UNITS/VALUE 2011 UNITS/VALUE<br />
ROMANIA .121 $10.6 .129 $10.5 .169 $15.1 .355 $36.2 .490 $48.3<br />
BULGARIA .253 $19 .313 $23.9 .295 $25 .340 $33.5 .408 $45<br />
POLAND .832 $73.3 1.01 $100.8 .533 $64.1 .383 $50.5 .358 $51.5<br />
CZECH REPUBLIC .224 $42.6 .267 $48.9 .248 $41.1 .316 $58.5 .390 $58.8<br />
LITHUANIA .315 $30.8 .290 $30.7 .189 $36.8 .325 $41.9 .283 $40.3<br />
HUNGARY .193 $34.8 .203 $38.6 .192 $42.4 .210 $40.9 .232 $41.5<br />
Source: Eurostat<br />
A N N U A L S T A T S I S S U E<br />
China’s top export countries in 2011<br />
8. CANADA<br />
1. U.S.<br />
4. RUSSIA<br />
6. IRAN<br />
Sales of e-bikes continue to fuel the<br />
European market, hitting the 1 million<br />
mark last year, but, at the same time,<br />
pedelecs are chipping away at sales of<br />
trekking bikes. Instead of purchasing<br />
fancy 7-speed Nexus hub trekking bikes,<br />
more consumers are turning to batterypowered<br />
alternatives, Fioravanti said.<br />
That’s good for dealers since e-bikes<br />
bring higher margins, but it’s not neces-<br />
7. SAUDI ARABIA<br />
2. JAPAN<br />
5. MALAYSIA<br />
3. INDONESIA<br />
sarily growing the overall cycling market<br />
as much as could be expected. Mountain<br />
bikes are a positive point in Europe as<br />
29ers hit their stride at long last, 650b<br />
bikes gain exposure and motorized<br />
mountain bikes catch on.<br />
Europe’s import landscape is also undergoing<br />
change. Asia—and Taiwan in<br />
particular—is still the biggest contributor,<br />
but increasingly Eastern European
China production and exports<br />
Unit production<br />
(in millions)<br />
E-bike production<br />
(in billions of units)<br />
Unit export<br />
(in millions)<br />
Unit imports<br />
(in thousands)<br />
Import value<br />
(dollar millions)<br />
countries such as Romania, Bulgaria,<br />
Poland and Hungary are becoming significant<br />
players.<br />
Vietnam also re-emerged on the<br />
scene last year after the European Union<br />
lifted 34.5 percent anti-dumping duties<br />
in July 2010. In 2011, Vietnam producers<br />
shipped 226,000 units to Europe at<br />
a value of $28.4 million. That’s up from<br />
13,000 units in 2010 at $2.1 million,<br />
but the numbers are still nowhere near<br />
where they were before the anti-dumping<br />
duties were enacted in 2005. The prior<br />
year, in 2004, the EU imported 1.85<br />
million bikes from Vietnam.<br />
China continues to be affected by the<br />
48.5 percent anti-dumping duties levied<br />
against bikes exported to the EU. The duties,<br />
in place for 19 years, are currently<br />
under review.<br />
Last year, China exported 492,000<br />
bikes to Europe at a value of $42 million.<br />
That marks a drastic decline since 2004,<br />
when more than 2 million China-made<br />
bikes reached Europe.<br />
Production in Eastern Europe has<br />
Taiwan exports<br />
Value of exported bike parts<br />
2007 2008 2009 2010 2011<br />
87.1 87.6 76 81.6 83.5<br />
21.4 21.8 23.7 29.5 30.9<br />
59.2 56.6 46.1 58.2 55.7<br />
11 Not available 21 27 67<br />
$230 $280 $280 $320 $430<br />
CHANGE<br />
2007 $421,922,299 +18.7%<br />
2008 $548,295,354 +30%<br />
2009 $510,697, 176 -7.3%<br />
2010 $657,513,240 +28.7%<br />
2011 $781,695,145 +18.8%<br />
Value of complete bike<br />
exports globally (in billions)<br />
CHANGE<br />
2007 $1.05 +25%<br />
2008 $1.38 +31.6%<br />
2009 $1.25 -11%<br />
2010 $1.5 +20.24%<br />
2011 $1.6 +10.6%<br />
Source: Taiwan Bureau of Foreign Trade<br />
A N N U A L S T A T S I S S U E<br />
increased tenfold since 2000, and the region<br />
is now home to about 100 parts and<br />
assembly factories, Fioravanti said. Exports<br />
from Romania have steadily risen<br />
from 121,000 bikes in 2007 to 490,000<br />
units last year. The quality has also increased<br />
with the value nearing $50 million<br />
last year, nearly five times the value<br />
from five years ago.<br />
Exports from the top six Eastern European<br />
countries—the Czech Republic,<br />
Poland, Lithuania, Hungary, Romania<br />
and Bulgaria—totaled 2.16 million units,<br />
the second-largest contributor to the EU<br />
behind Taiwan.<br />
“I honestly think we’re in a moment<br />
of switch, a moment of possible<br />
change,” Fioravanti said in response to<br />
whether Eastern European production<br />
could eclipse Asia. “I think that in some<br />
cases the production in Eastern Europe<br />
is going to be favorable,” but lead times<br />
on frames imported from Asia continue<br />
to be a factor. Until more Eastern European<br />
factories start producing frames,<br />
the industry still relies heavily on Asia-<br />
Exports of bike parts<br />
in quantity by kilograms<br />
QUANTITY CHANGE<br />
2007 40,005,315 +10%<br />
2008 42,743,897 +6.85%<br />
2009 35,597,056 -16.7%<br />
2010 40,237,287 +13%<br />
2011 39,714,573 -1.3%<br />
Complete bikes<br />
exported globally<br />
QUANTITY CHANGE<br />
2007 4,751,967 +17.1%<br />
2008 5,401,920 +13.7%<br />
2009 4,301,360 -20.3%<br />
2010 5,069,915 +17.8%<br />
2011 4,370,000 -13.7%<br />
Taiwan exports of complete bicycles, 2011<br />
COUNTRY UNITS VALUE<br />
(IN MILLIONS)<br />
AVERAGE<br />
SALE PRICE<br />
July 1, 2012<br />
CHANGE FROM 2010<br />
U.K. 655, 693 $153 $233.32 -36% units; -18.5% value<br />
U.S. 614,343 $369 $601 -7.8 units; +14.8% value<br />
NETHERLANDS 501,144 $188 $375 -12% units; -2% value<br />
GERMANY 432,880 $132 $305 -8.5% units; +5.5% value<br />
JAPAN 264,908 $107 $405 +15.7% units; +35% value<br />
SPAIN 179,282 $43.5 $243 -14.5% units; -4.5% value<br />
BELGIUM 172,702 $79.2 $458.6 -8.1% units; +26.9 % value<br />
SWEDEN 167,941 $24.8 $148 -36.4% units; -30% value<br />
AUSTRALIA 126,582 $85.7 $677 -10.3% units; +7.8% value<br />
DENMARK 123,628 $30.9 $250 -34.1% units; -15.8% value<br />
Emerging markets<br />
COUNTRY UNITS VALUE<br />
(IN MILLIONS)<br />
AVERAGE<br />
SALE PRICE<br />
CHANGE FROM 2010<br />
CHINA 32,273 $16.9 $523 +189% units; +227% value<br />
THAILAND 22,374 $7.1 $320 +42% units; +65% value<br />
BRAZIL 19,576 $9.4 $482 +66% units; +88% value<br />
MEXICO 17,157 $6.2 $363 +73% units; +98% value<br />
HONG KONG 14,126 $4.4 $564 +42.3% units; +80% value<br />
ARGENTINA 13,466 $4.6 $344 +19% units; +21.7% value<br />
SINGAPORE 12,831 $7.9 $617 +26.8% units; +49% value<br />
ISRAEL 12,340 $7 $568 +4.5% units; +4.7 value<br />
INDONESIA 10,463 $5.6 $532 -9.5% units; +2.6% value<br />
MALAYSIA 9,231 $4.4 $476 +40.5% units; +44.8% value<br />
Note: Excludes folding bicycles<br />
Source: Taiwan Bureau of Foreign Trade<br />
sourced products.<br />
The retail market in Eastern Europe<br />
is also developing as cycling becomes<br />
more popular for sport and transportation,<br />
due in part to advocacy work at the<br />
national and continental level, Fioravanti<br />
said. Sales have increased fivefold since<br />
2000. Poland imported 98,102 complete<br />
Exports of complete bikes<br />
to the U.S. from Taiwan<br />
596,305<br />
720,192<br />
598,635<br />
668,726<br />
616,370<br />
bikes from Taiwan last year, a 5 percent<br />
increase from 2010. The Czech Republic<br />
brought in 31,106 bikes, 2.5 percent<br />
more than the year before, and Estonia<br />
and Latvia also saw healthy increases.<br />
Lithuania reported the biggest leap, spiking<br />
342 percent from 2010’s 12,043 units<br />
to 53,331 last year.<br />
Exports of complete bikes<br />
to EU 27 from Taiwan<br />
3,334,063<br />
3,617,437<br />
2,786,704<br />
3,502,051<br />
2,746,689<br />
2007 2008 2009 2010 2011 2007 2008 2009 2010 2011<br />
27
28<br />
By Toby Hill<br />
The bicycle retail market remained<br />
essentially flat dollar-wise in 2011,<br />
ticking up 1.1 percent to $6 billion,<br />
but specialty retailers outperformed the<br />
sector as they bucked the steep overall<br />
decline in unit sales and sold pricier<br />
bikes than in 2010.<br />
Bike shops and outdoor specialty retailers<br />
sold more than 3.1 million bikes<br />
last year, up slightly from 2010, but that<br />
compares with a dramatic drop of more<br />
than 4 million bikes, or 21 percent, for<br />
the entire retail market, according to figures<br />
from the NBDA U.S. Bicycle Market<br />
2011, an analysis produced by the<br />
Gluskin Townley Group for the National<br />
Bicycle Dealers Association.<br />
Further, unit retail values rose in all<br />
retail channels, but none more so than<br />
specialty, which saw a 28 percent surge<br />
to an average of $671 per bike, the study<br />
says. Bicycle sales for the channel totaled<br />
more than $2.1 billion last year, or 60<br />
percent of the dollar-value market for<br />
bikes, up from 49 percent in 2010.<br />
Gluskin Townley principal Jay<br />
Townley, who compiled the study data,<br />
attributed the spike in unit values to increased<br />
production and shipping costs,<br />
including rising fuel prices. In one 45day<br />
period toward the end of the year, he<br />
noted, the cost to ship a container from<br />
Asia to the U.S. doubled.<br />
“Those cost increases all year got<br />
passed along to retailers,” Townley said.<br />
Whether the market can sustain<br />
those prices remains to be seen, but<br />
Townley points out that total value of<br />
imports for the first quarter of 2012 is<br />
down despite a slight increase in units<br />
shipped.<br />
Last year’s jump in bike values was<br />
accompanied by a 12-year low in unit<br />
purchases of bikes. According to Townley’s<br />
data, the decline occurred almost<br />
entirely at mass retailers, the primary<br />
seller of juvenile bikes.<br />
“Bicycling’s no longer a kids’ market,<br />
not the way it once was,” he said. “Somebody<br />
either made a major error in 2010<br />
and brought in way too much, so they<br />
had to cut back in 2011, or they were<br />
A N N U A L S T A T S I S S U E<br />
Specialty retailers outshine bike market in 2011<br />
U.S. specialty retail locations<br />
January 2003 through January 2012<br />
backing away.”<br />
At IBDs, meanwhile, Leisure Trends<br />
Group reported strong growth for 2011.<br />
Bicycle sales rose 1.3 percent in units<br />
to almost 2.3 million, but a 7.6 percent<br />
increase in average retail prices netted a<br />
9.1 percent jump in bicycle dollars, according<br />
to BPSA Topline data from Leisure<br />
Trends’ Cycling RetailTRAK. Overall<br />
IBD sales rose 6.6 percent to $3.38<br />
billion, Leisure Trends reported.<br />
Breaking down bike categories,<br />
IBDs sold 11 percent more road bikes,<br />
representing 37 percent of all bike dollars,<br />
while mountain bikes were down<br />
less than 1 percent for 28 percent of<br />
dollars. Transit/fitness bikes were flat<br />
2003 2004 2005 2006 2007 2009 2009 2010 2011 2012<br />
TOTAL U.S. 5,358 4,982 4,704 4,599 4,451 4,394 4,319 4,256 4,178 4,089<br />
VARIANCE NUMBER OF LOCATIONS -147 -376 -278 -104 -150 -57 -75 -63 -78 -89<br />
PERCENTAGE VARIANCE -3% -7% -5.6% -2.2% -3.3% -1.3% -1.7% -1.5% -1.8% -2.1<br />
VARIANCE 2003 TO 2011 -1,269<br />
PERCENTAGE VARIANCE 2003 TO 2011 -24%<br />
Source: The Bike Shop List<br />
U.S. market channels of trade<br />
Apparent consumption 2009-2011 estimated units and market share<br />
CHANNEL EST. 2009<br />
UNITS<br />
(IN THOUSANDS)<br />
EST. 2009<br />
SHARE<br />
EST. 2010 UNITS<br />
(IN THOUSANDS)<br />
EST. 2010<br />
SHARE<br />
EST. 2011 UNITS<br />
(IN THOUSANDS)<br />
EST. 2011 SHARE<br />
MASS MERCHANT 10,868 73% 14,970 75.5% 11,029 70%<br />
CHAIN SPORT GOODS 595 4% 1,187 6% 1,103 7%<br />
BIKE SHOPS+OSR 2,977 18% 3,067 15.5% 3,151 20%<br />
OTHER 447 3% 595 3% 473 3%<br />
TOTAL 14,888 100% 19,828 100% 15,756 100%<br />
Sources: U.S. Department of Commerce Import statistics for 2011; Gluskin Townley Group estimates for 2011, excluding exports; Leisure Trends data published<br />
in Bicycle Retailer and Industry News<br />
U.S. market estimated consumption in retail dollars<br />
2011 total market share, bicycles and parts, by channel of trade<br />
CHANNEL BIKE SHOPS<br />
+ OSR<br />
BICYCLES $2,114,413,195<br />
60%<br />
PARTS, RUBBER AND ACCESSORIES,<br />
INCLUDING CLOTHING AND SHOES<br />
$980,645,622<br />
39%<br />
MASS<br />
MERCHANT<br />
$926,434,396<br />
27%<br />
$590,901,849<br />
23%<br />
CHAIN SPORT-<br />
ING GOODS<br />
$274,621,624<br />
8%<br />
$528,039,950<br />
21%<br />
OTHER<br />
(INCLUDING HARDWARE<br />
CHAINS, INDEPENDENT<br />
RETAILERS, MAIL ORDER<br />
AND INTERNET)<br />
$179,614,832<br />
5%<br />
$414,888,532<br />
17%<br />
TOTAL U.S.<br />
MARKET<br />
$3,495,084,047<br />
100%<br />
$2,514,475,953<br />
100%<br />
TOTAL ESTIMATED RETAIL DOLLARS $3,095,058,817 $1,517,336,245 $802,661,574 $594,503,364 $6,009,560,000<br />
PERCENTAGE SHARE OF TOTAL<br />
MARKET RETAIL DOLLARS<br />
for 19 percent of dollars sold; lifestyle/<br />
leisure dipped 9.5 percent for 5 percent<br />
of dollars; children’s rose 2 percent for 5<br />
percent of dollars; and “other,” including<br />
folding, recumbent, trikes and e-bikes,<br />
inched up less than 1 percent for less<br />
than a single percent of dollars.<br />
Trek remained the most popular<br />
brand at retail last year based on store<br />
locations, according to Townley’s data,<br />
followed by Giant and Specialized. Redline<br />
was the biggest mover among the<br />
top 10 brands, jumping from seventh to<br />
fourth. It was followed by Raleigh, Haro,<br />
Electra, Cannondale (in eighth for the<br />
fourth straight year), Sun Bicycles and<br />
Scwhinn.<br />
Note: Excludes service labor and rentals<br />
Sources: National Sporting Goods Association; Gluskin Townley Group analysis and estimates<br />
The number of specialty retail storefronts<br />
continued their steady decline,<br />
with a loss of 89 locations last year, down<br />
2.1 percent. As of January 2012, the dealer<br />
base stood at 4,089 locations, according<br />
to Townley.<br />
Though the drop is the largest since<br />
2007, when 150 stores closed, NBDA executive<br />
director Fred Clements sees little<br />
cause for alarm.<br />
“We’re doing the same or a little bit<br />
more volume from fewer storefronts.<br />
So the stores that are still here are getting<br />
a little bigger; they’re attracting<br />
more customers. So maybe losing a<br />
few storefronts isn’t a bad thing as long<br />
as all the markets are covered,” he said.<br />
51.5% 25.2% 13.4% 9.9% 100%
“Compared to some industries, we’re in great<br />
shape. If the slide was 10 percent instead of a<br />
couple percent, then I’d worry.”<br />
But Townley notes an ongoing march<br />
away from smaller and midsize markets in<br />
favor of urban markets, a trend also reflected<br />
by big-box retailers. This corresponds with<br />
the rise of what Townley terms “new wave”<br />
bike shops—retailers in densely populated<br />
metropolitan centers that serve neighborhoods<br />
with high levels of daily, utilitarian<br />
bike use and that often emphasize local<br />
product and community identity.<br />
“The piece that is going to drive the<br />
new wave is that, so far, they have focused<br />
on servicing the dense neighborhood markets<br />
that are younger Gen X and Gen Y;<br />
women and fashion as touch points. And<br />
there’s this whole idea of locally made bikes,”<br />
he said.<br />
Serving Gens X and Y, as well as women<br />
and minorities, gains greater importance for<br />
specialty retailers as baby boomers continue<br />
to age out of the bicycle market or reduce<br />
their cycling activity and buying.<br />
Generation X currently drives the U.S.<br />
bike market, but there are 11 percent fewer<br />
Gen X’ers than boomers, notes Townley, who<br />
predicts a “slow fade” in the market for eight<br />
to 10 years until Generation Y—the largest<br />
U.S. generation ever—comes of age.<br />
“The specialty channel is going to have to<br />
take a good hard look if it isn’t going to succumb<br />
to what other channels of trade in consumer<br />
goods are going to succumb to. At the<br />
A N N U A L S T A T S I S S U E<br />
end of the day there are 11 percent fewer Gen<br />
X’ers than there are boomers. And Gen Y’ers<br />
aren’t going to come into the market quickly<br />
enough over the time frame, so you need to<br />
figure out what you’re going to do to pick up<br />
your game,” he said.<br />
The NBDA’s Clements is more sanguine<br />
about the change in demographics.<br />
“One thing I’ve learned is that the markets<br />
are regional and local. And the demographic<br />
shifts in America affect regions differently.<br />
As long as retailers remain aware of<br />
their community, they’ll be fine. It’s not uniform.<br />
It doesn’t affect every dealer the same.<br />
The dealers live and breathe with local markets,<br />
not national.”<br />
Market demographics aside, the mild<br />
winter/early spring has gotten 2012 off to a<br />
spirited start at IBDs: Leisure Trends reports<br />
a 14 increase in sales to $1.1 billion for the<br />
first four months of the year. Growth slowed<br />
in April, however, and Leisure Trends anticipates<br />
a slowing of the market as the season<br />
continues and bicycle inventories remain<br />
light. Still, it’s forecasting a 5 to 6 percent increase<br />
in IBD sales this year.<br />
“Despite the market slowing, average<br />
retail prices are up. And with less inventory<br />
in the market, there is also less discounting<br />
taking place,” said Greg Shoenfeld, retail relations<br />
manager at Leisure Trends.<br />
“The safe prediction is let’s be flat again,”<br />
Clements said. “If everything is flat from<br />
here on it’s a good year, given the strong<br />
start.”<br />
U.S. bicycle market<br />
Estimated average unit retail value by channel of trade 2009-2011<br />
CHANNEL 2009 EST. AVERAGE<br />
UNIT RETAIL VALUE<br />
2010 EST. AVERAGE<br />
UNIT RETAIL VALUE<br />
2011 EST.<br />
AVERAGE UNIT<br />
RETAIL VALUE<br />
MASS MERCHANT $78 $79 $84<br />
CHAIN SPORTING GOODS $234 $239 $249<br />
BIKE SHOPS+OSR $500 $525 $671<br />
OTHER $350 $355 $380<br />
TOTAL $177 $166 $222<br />
Sources: U.S. Department of Commerce Import Statistics for 2011; Gluskin Townley Group estimates for 2011,<br />
excluding exports; Leisure Trends data published in Bicycle Retailer and Industry News<br />
Top 10 brands sold at specialty retail 2008-2011<br />
2008 2009 2010 2011<br />
1 TREK 1 TREK 1 TREK 1 TREK<br />
2 GIANT 2 GIANT 2 SPECIALIZED 2 GIANT<br />
3 SPECIALIZED 3 RALEIGH 3 GIANT 3 SPECIALIZED<br />
4 HARO 4 HARO 4 HARO 4 REDLINE<br />
5 REDLINE 5 SPECIALIZED 5 ELECTRA 5 RALEIGH<br />
6 GARY FISHER 6 GARY FISHER 6 RALEIGH 6 HARO<br />
7 ELECTRA 7 REDLINE 7 REDLINE 7 ELECTRA<br />
8 CANNONDALE 8 CANNONDALE 8 CANNONDALE 8 CANNONDALE<br />
9 RALEIGH 9 DIAMONDBACK 9 SUN BICYCLES 9 SUN BICYCLES<br />
10 SUN BICYCLES 10 ELECTRA 10 FELT 10 SCHWINN<br />
Source: NBDA Specialty Bicycle Retailer Study, 2008-2011<br />
July 1, 2012<br />
29
30<br />
Continued from cover<br />
Tough market<br />
strong with new bike designs. Overall,<br />
however, there are not many gains, he<br />
added.<br />
“Carbon is still king. This is where we<br />
are seeing bicycle unit and dollar sales<br />
gains in the road market,” Margevicius<br />
said.<br />
Members of the Bicycle Product and<br />
Supplier Association (BPSA) shipped<br />
100,000 more 29ers to shops in 2011 than<br />
they did in 2010, representing a $50.4<br />
million increase in sales, more than 90<br />
percent of last year’s sales gain.<br />
The 9 percent jump in average unit<br />
value for 700c imports reflects the increasing<br />
number of high-value 29ers that<br />
are included in this category. But few expect<br />
the 29er golden goose to continue<br />
laying; going forward, it’s doubtful 29ers<br />
will continue commanding a $500 premium<br />
over 26-inch bikes.<br />
“The average selling price of 29er<br />
hardtails is down so far this year. This is<br />
the most significant market segment. I<br />
don’t expect there will be a big gap between<br />
26-inch and 29er in full suspension,<br />
as components are now readily available<br />
for either wheel size,” Margevicius said.<br />
Though the average value of 26-inch<br />
imports jumped 20 percent, the number<br />
of units imported fell by 17 percent. The<br />
shortfall was mostly in low-value comfort<br />
and cruiser bikes, where customers<br />
are most acutely affected by the recession.<br />
The absence of low-value bikes in the import<br />
mix is probably responsible for the<br />
rise in average value.<br />
Internet retail arrived as a substantial<br />
player in the market: The Gluskin Townley<br />
Group estimates Internet sales of new<br />
bikes and parts hit $1.2 billion in 2011,<br />
about 20 percent of all bicycle-related<br />
sales.<br />
Gluskin Townley further estimates<br />
sales of used bikes from such retailers as<br />
eBay, Craigslist and <strong>Amazon</strong> hit $816 million<br />
last year. Internet purchases of new<br />
and used product represent more than a<br />
third of the overall bike market.<br />
“Since we’ve been working for the<br />
past few years trying to hammer out these<br />
numbers, I’m not that surprised Internet<br />
sales are this substantial. I am surprised<br />
that the industry seems oblivious to a series<br />
of changes in the retail landscape that<br />
is totally reshaping the market,” said Jay<br />
Townley, principal with Gluskin Townley.<br />
Internet retail. In a recent consumer survey<br />
evaluated by Gluskin Townley, when<br />
asked which Internet retailer received<br />
their business, consumers said 37 percent<br />
of their purchases were made through a<br />
bike shop’s website.<br />
But what has captured industry attention<br />
are sales that U.K. Internet retailers<br />
such as Chain Reaction Cycles and Wiggle<br />
are ringing up in North America.<br />
“I still think the industry under-appreciates<br />
the consumer appetite for Internet<br />
commerce,” said Brendan Quirk,<br />
A N N U A L S T A T S I S S U E<br />
general manager of Backcountry.com’s<br />
bike division and founder of Competitive<br />
Cyclist.<br />
“We saw phenomenal growth last<br />
year—maybe not mind-blowing growth<br />
because of the inroads Chain Reaction<br />
and Wiggle made. If suppliers don’t take a<br />
concerted stand on minimum advertised<br />
pricing, the retail landscape is going to<br />
quickly change,” he said.<br />
European retailers do not conform to<br />
minimum advertised pricing, and their<br />
low prices are attracting<br />
customers<br />
in the U.S.<br />
Chain Reaction<br />
Cycles made its first<br />
trip to Sea Otter<br />
this spring, a reflection<br />
of how strongly<br />
the retailer’s business<br />
grew last year.<br />
“The USA is a<br />
strong market for<br />
us which has seen<br />
steady year-on-year<br />
growth over the last<br />
three years. We are<br />
already signed up to<br />
be at Sea Otter next<br />
year and look forward<br />
to once again<br />
meeting our North<br />
American customers,”<br />
said Simon<br />
Cordner, Chain Reaction<br />
Cycles’ public<br />
relations manager.<br />
In 2010, Chain<br />
Reaction Cycles’<br />
most recent public<br />
filing, the company’s<br />
sales hit 109 million<br />
pounds ($167 million),<br />
up from 23.9<br />
million pounds in<br />
2007. Its sales have<br />
been growing 66<br />
percent annually,<br />
and 37 percent of<br />
its sales—or $61.8<br />
million—were outside<br />
the European<br />
Union.<br />
Wiggle reported<br />
2011 sales of 141<br />
million euros ($175<br />
million). Its largest<br />
international markets<br />
are Australia<br />
and Japan, and its<br />
international business<br />
represents 60<br />
percent of sales, or<br />
$105 million.<br />
Together these<br />
two European retailers<br />
could do<br />
more than $50 million<br />
in business in<br />
the U.S. That is less<br />
than 1 percent of<br />
the $6 billion total<br />
U.S. bike market, but sales are growing<br />
quickly.<br />
European companies buy U.S. suppliers.<br />
Internet retailing is not the only place Europeans<br />
are making inroads in the U.S.<br />
market.<br />
Last year saw the purchase of iconic<br />
bike brand Titus by the U.K.’s Planet<br />
X. Swiss company Scott Sports bought<br />
Syncros, and this year Dutch company<br />
Pon Holdings purchased Cervélo. Accell<br />
U.S. domestic exports by category<br />
U.S. import landed average unit value<br />
U.S. import value by category<br />
Group, also Dutch, bought Seattle Bike<br />
Supply a few years ago and purchased ebike<br />
maker Currie late last year.<br />
“There are now a lot of very distressed<br />
bicycle companies in Europe, but equally<br />
American companies seem under great<br />
pressure,” said Dave Loughran, Planet X’s<br />
founder. “I think the entire marketplace<br />
is going through massive changes, and it’s<br />
basically hard now for a midsize brand to<br />
compete.”<br />
Despite tough conditions at home<br />
CATEGORIES 2007 2008 2009 2010 2011<br />
KID’S SUB-20-INCH $26.07 $30.11 $29.25 $30.44 $32.43<br />
20-INCH $35.98 $42.69 $39.30 $45.84 $49.13<br />
24-INCH $60.06 $62.63 $61.11 $60.30 $63.47<br />
26-INCH $93.39 $106.65 $105.36 $101.01 $119.48<br />
700C $232.90 $274.09 $284.36 $284.78 $310.39<br />
U.S. import units by category<br />
CATEGORIES 2007 2008 2009 2010 2011<br />
KID’S SUB-20-INCH 5,426,613 5,095,446 4,682,134 6,321,675 4,716,749<br />
20-INCH 5,404,990 5,590,241 4,282,929 5,374,343 3,710,461<br />
24-INCH 1,259,439 1,175,257 821,497 1,289,550 1,110,592<br />
26-INCH 4,918,550 5,294,668 3,829,805 5,316,420 4,418,353<br />
700C 1,099,461 1,795,972 1,221,288 1,323,584 1,475,888<br />
TOTALS 18,109,053 18,451,584 14,837,653 19,765,572 15,432,043<br />
CATEGORIES 2007 2008 2009 2010 2011<br />
KID’S SUB-20-INCH $141,494,076 $153,423,676 $136,930,864 $192,460,397 $152,984,436<br />
20-INCH $194,461,686 $238,660,479 $168,332,934 $246,349,616 $182,299,378<br />
24-INCH $75,636,836 $73,604,064 $50,201,346 $77,756,631 $70,493,195<br />
26-INCH $459,344,590 $564,650,282 $403,504,521 $531,692,550 $527,906,821<br />
700C $247,601,229 $334,602,603 $331,888,367 $376,935,998 $458,097,883<br />
TOTALS $1,126,997, 205 $1,370,383,419 $1,093,366,488 $1,431,391,656 $1,391,781,713<br />
U.S. import unit market share by category<br />
CATEGORIES 2007 2008 2009 2010 2011<br />
KID’S SUB-20-INCH 30% 27.6% 31.6% 32% 31%<br />
20-INCH 29.8% 30.3% 28.9% 27.2% 24%<br />
24-INCH 7% 6.4% 5.5% 6.5% 7%<br />
26-INCH 27.2% 28.7% 25.8% 26.9% 29%<br />
700C 6.1% 7% 8.2% 7.4% 10%<br />
Source: U.S. Department of Commerce<br />
2007 2008 2009 2010 2011<br />
TIRES > 25 INCHES 51,585 45,882 43,885 46,193 42,663<br />
TIRES < 25 INCHES 31,226 28,993 31,838 35,935 32,765<br />
Source: U.S. Department of Commerce
U.S. import dollar market share by category<br />
26-inch<br />
700C<br />
20-inch<br />
Kid’s<br />
Sub-20-inch<br />
24-inch<br />
2007<br />
40.8%<br />
22.7%<br />
17.3%<br />
12.6%<br />
6.7%<br />
Source: U.S. Department of Commerce<br />
2008<br />
41.2%<br />
24.8%<br />
17.4%<br />
11.2%<br />
5.4%<br />
in Europe, Loughran is making further<br />
investment in America. Planet X will be<br />
consolidating its mountain and road operations—Titus<br />
and Planet X—in Portland,<br />
Oregon. Currently a distributor in<br />
Gap, Pennsylvania, runs Planet X USA<br />
under contract.<br />
Yet in spite of new investment in the<br />
U.S. market, the numbers are clear. The<br />
average number of bikes imported in<br />
the five years leading up to the recession,<br />
2002 to 2006, is 18,798,025. The five-year<br />
import average since the 2007 recession is<br />
17,100,241, a shortfall of 1.7 million units.<br />
2009<br />
36.9%<br />
30.6%<br />
15.4%<br />
12.5%<br />
4.6%<br />
A N N U A L S T A T S I S S U E<br />
2010<br />
37.1%<br />
26.8%<br />
17.2%<br />
13.4%<br />
2011<br />
38%<br />
33%<br />
13%<br />
11%<br />
5.4% 5%<br />
Last year’s imports totaled 14,567,348, an<br />
additional 2.5 million units below this average.<br />
Asian direct business growing. Last year<br />
was certainly a watershed for consumers<br />
buying composite frames directly from<br />
Asian suppliers. Two years ago comments<br />
on forums about buying carbon frames<br />
directly from Asian factories raised reservations<br />
about the quality of the frames<br />
and after-sale support.<br />
Today, bike buyers ask which catalog<br />
number was ordered—and any anxiety<br />
U.S. market<br />
dollar sales<br />
share 2011<br />
Misc 0.6%<br />
Tandems 0.2%<br />
Hybrids 16%<br />
Road 38.5%<br />
Source: Leisure Trends Group BPSA Sell-In Report<br />
about buying direct is lessened by a growing<br />
number of happy riders.<br />
“Overall, I get the feeling we’re right<br />
on the brink of the factory-direct wholesale<br />
option being relatively mainstream<br />
in the U.S. The wholesalers just have to<br />
take care of a few rough edges—webbased<br />
ordering interface—and it will be<br />
just like buying a frame from Competitive<br />
Cyclist,” wrote “Hiro11” on a Roadbikereview.com<br />
thread titled “Chinese Carbon<br />
Thread and eBay direct version 6.0.”<br />
Ebay sellers “A_Baygoods,” “Carbon<br />
Bicycle,” “Carbonzone” and “Oemitem”<br />
July 1, 2012<br />
26-inch cruiser 1.4%<br />
26-inch comfort 3.7%<br />
26-inch rigid MTB 0.2%<br />
26-inch Front<br />
Suspension<br />
MTB 12.2%<br />
26-inch dualsuspension<br />
MTB 6.3%<br />
29er rigid MTB 0.2%<br />
29-inch frontsuspension<br />
MTB 8.1%<br />
29-inch dualsuspension<br />
MTB 5.3%<br />
20-/24-inch BMX/freestyle 2.5%<br />
24-inch juvenile 1.9%<br />
20-inch juvenile 1.9%<br />
19-inch and below 1.1%<br />
are based in Hong Kong, and all offer a<br />
carbon 29er hardtail—including a carbon<br />
fork, seatpost, handlebar, stem and<br />
saddle—for $599, as well as other carbon<br />
frames from $389 to $700.<br />
The sellers may have sold close to<br />
14,000 frames over the last 12 months, according<br />
to eBay data.<br />
And this is just the tip of the iceberg:<br />
There are more China-based eBay sellers<br />
of carbon frames and plenty of factories<br />
with consumer-direct websites like Gotobike.com,<br />
Dengfubikes.com and Greatkeenbike.com.<br />
31