
Create successful ePaper yourself
Turn your PDF publications into a flip-book with our unique Google optimized e-Paper software.
26<br />
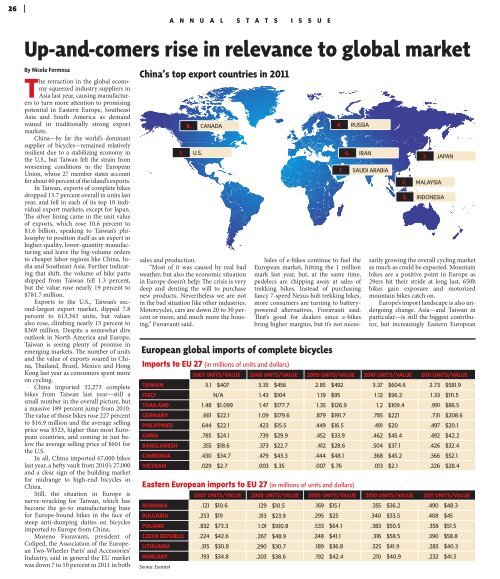
Up-and-comers rise in relevance to global market<br />
By Nicole Formosa<br />
The retraction in the global economy<br />
squeezed industry suppliers in<br />
Asia last year, causing manufacturers<br />
to turn more attention to promising<br />
potential in Eastern Europe, Southeast<br />
Asia and South America as demand<br />
waned in traditionally strong export<br />
markets.<br />
China—by far the world’s dominant<br />
supplier of bicycles—remained relatively<br />
resilient due to a stabilizing economy in<br />
the U.S., but Taiwan felt the strain from<br />
worsening conditions in the European<br />
Union, whose 27 member states account<br />
for about 60 percent of the island’s exports.<br />
In Taiwan, exports of complete bikes<br />
dropped 13.7 percent overall in units last<br />
year, and fell in each of its top 10 individual<br />
export markets, except for Japan.<br />
The silver lining came in the unit value<br />
of exports, which rose 10.6 percent to<br />
$1.6 billion, speaking to Taiwan’s philosophy<br />
to position itself as an expert in<br />
higher-quality, lower-quantity manufacturing<br />
and leave the big-volume orders<br />
to cheaper labor regions like China, India<br />
and Southeast Asia. Further indicating<br />
that shift, the volume of bike parts<br />
shipped from Taiwan fell 1.3 percent,<br />
but the value rose nearly 19 percent to<br />
$781.7 million.<br />
Exports to the U.S., Taiwan’s second-largest<br />
export market, dipped 7.8<br />
percent to 613,343 units, but values<br />
also rose, climbing nearly 15 percent to<br />
$369 million. Despite a somewhat dire<br />
outlook in North America and Europe,<br />
Taiwan is seeing plenty of promise in<br />
emerging markets. The number of units<br />
and the value of exports soared in China,<br />
Thailand, Brazil, Mexico and Hong<br />
Kong last year as consumers spent more<br />
on cycling.<br />
China imported 32,273 complete<br />
bikes from Taiwan last year—still a<br />
small number in the overall picture, but<br />
a massive 189 percent jump from 2010.<br />
The value of those bikes rose 227 percent<br />
to $16.9 million and the average selling<br />
price was $523, higher than most European<br />
countries, and coming in just below<br />
the average selling price of $601 for<br />
the U.S.<br />
In all, China imported 67,000 bikes<br />
last year, a hefty vault from 2010’s 27,000<br />
and a clear sign of the building market<br />
for midrange to high-end bicycles in<br />
China.<br />
Still, the situation in Europe is<br />
nerve-wracking for Taiwan, which has<br />
become the go-to manufacturing base<br />
for Europe-bound bikes in the face of<br />
steep anti-dumping duties on bicycles<br />
imported to Europe from China.<br />
Moreno Fioravanti, president of<br />
Coliped, the Association of the European<br />
Two-Wheeler Parts’ and Accessories’<br />
Industry, said in general the EU market<br />
was down 7 to 10 percent in 2011 in both<br />
sales and production.<br />
“Most of it was caused by real bad<br />
weather, but also the economic situation<br />
in Europe doesn’t help: The crisis is very<br />
deep and denting the will to purchase<br />
new products. Nevertheless we are not<br />
in the bad situation like other industries.<br />
Motorcycles, cars are down 20 to 30 percent<br />
or more, and much more the housing,”<br />
Fioravanti said.<br />
European global imports of complete bicycles<br />
Imports to EU 27 (in millions of units and dollars)<br />
2007 UNITS/VALUE 2008 UNITS/VALUE 2009 UNITS/VALUE 2010 UNITS/VALUE 2011 UNITS/VALUE<br />
TAIWAN 3.1 $407 3.35 $456 2.85 $492 3.37 $604.6 2.73 $581.9<br />
ITALY N/A 1.43 $104 1.19 $95 1.12 $96.2 1.33 $111.5<br />
THAILAND 1.48 $1.099 1.47 $177.7 1.35 $126.9 1.2 $109.4 .991 $86.5<br />
GERMANY .661 $22.1 1.09 $179.6 .879 $191.7 .785 $221 .731 $208.6<br />
PHILIPPINES .644 $22.1 .423 $15.5 .449 $16.5 .491 $20 .497 $20.1<br />
CHINA .785 $24.1 .739 $29.9 .452 $33.9 .462 $45.4 .492 $42.2<br />
BANGLADESH .355 $18.6 .373 $22.7 .412 $28.6 .504 $37.1 .426 $32.4<br />
CAMBODIA .430 $34.7 .479 $43.3 .444 $48.1 .368 $45.2 .366 $52.1<br />
VIETNAM .029 $2.7 .003 $.35 .007 $.76 .013 $2.1 .226 $28.4<br />
Eastern European imports to EU 27 (in millions of units and dollars)<br />
2007 UNITS/VALUE 2008 UNITS/VALUE 2009 UNITS/VALUE 2010 UNITS/VALUE 2011 UNITS/VALUE<br />
ROMANIA .121 $10.6 .129 $10.5 .169 $15.1 .355 $36.2 .490 $48.3<br />
BULGARIA .253 $19 .313 $23.9 .295 $25 .340 $33.5 .408 $45<br />
POLAND .832 $73.3 1.01 $100.8 .533 $64.1 .383 $50.5 .358 $51.5<br />
CZECH REPUBLIC .224 $42.6 .267 $48.9 .248 $41.1 .316 $58.5 .390 $58.8<br />
LITHUANIA .315 $30.8 .290 $30.7 .189 $36.8 .325 $41.9 .283 $40.3<br />
HUNGARY .193 $34.8 .203 $38.6 .192 $42.4 .210 $40.9 .232 $41.5<br />
Source: Eurostat<br />
A N N U A L S T A T S I S S U E<br />
China’s top export countries in 2011<br />
8. CANADA<br />
1. U.S.<br />
4. RUSSIA<br />
6. IRAN<br />
Sales of e-bikes continue to fuel the<br />
European market, hitting the 1 million<br />
mark last year, but, at the same time,<br />
pedelecs are chipping away at sales of<br />
trekking bikes. Instead of purchasing<br />
fancy 7-speed Nexus hub trekking bikes,<br />
more consumers are turning to batterypowered<br />
alternatives, Fioravanti said.<br />
That’s good for dealers since e-bikes<br />
bring higher margins, but it’s not neces-<br />
7. SAUDI ARABIA<br />
2. JAPAN<br />
5. MALAYSIA<br />
3. INDONESIA<br />
sarily growing the overall cycling market<br />
as much as could be expected. Mountain<br />
bikes are a positive point in Europe as<br />
29ers hit their stride at long last, 650b<br />
bikes gain exposure and motorized<br />
mountain bikes catch on.<br />
Europe’s import landscape is also undergoing<br />
change. Asia—and Taiwan in<br />
particular—is still the biggest contributor,<br />
but increasingly Eastern European