AS PREMIA FOODS
AS PREMIA FOODS
AS PREMIA FOODS

Create successful ePaper yourself
Turn your PDF publications into a flip-book with our unique Google optimized e-Paper software.
<strong>AS</strong> <strong>PREMIA</strong> <strong>FOODS</strong> Consolidated Unaudited Interim Report for 4 th quarter and 12 months of 2012<br />
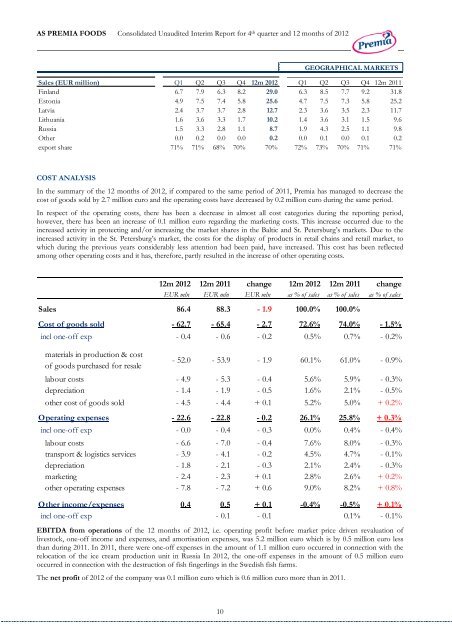
COST ANALYSIS<br />
In the summary of the 12 months of 2012, if compared to the same period of 2011, Premia has managed to decrease the<br />
cost of goods sold by 2.7 million euro and the operating costs have decreased by 0.2 million euro during the same period.<br />
In respect of the operating costs, there has been a decrease in almost all cost categories during the reporting period,<br />
however, there has been an increase of 0.1 million euro regarding the marketing costs. This increase occurred due to the<br />
increased activity in protecting and/or increasing the market shares in the Baltic and St. Petersburg’s markets. Due to the<br />
increased activity in the St. Petersburg’s market, the costs for the display of products in retail chains and retail market, to<br />
which during the previous years considerably less attention had been paid, have increased. This cost has been reflected<br />
among other operating costs and it has, therefore, partly resulted in the increase of other operating costs.<br />
EBITDA from operations of the 12 months of 2012, i.e. operating profit before market price driven revaluation of<br />
livestock, one-off income and expenses, and amortisation expenses, was 5.2 million euro which is by 0.5 million euro less<br />
than during 2011. In 2011, there were one-off expenses in the amount of 1.1 million euro occurred in connection with the<br />
relocation of the ice cream production unit in Russia In 2012, the one-off expenses in the amount of 0.5 million euro<br />
occurred in connection with the destruction of fish fingerlings in the Swedish fish farms.<br />
The net profit of 2012 of the company was 0.1 million euro which is 0.6 million euro more than in 2011.<br />
10<br />
GEOGRAPHICAL MARKETS<br />
Sales (EUR million) Q1 Q2 Q3 Q4 12m 2012 Q1 Q2 Q3 Q4 12m 2011<br />
Finland 6.7 7.9 6.3 8.2 29.0 6.3 8.5 7.7 9.2 31.8<br />
Estonia 4.9 7.5 7.4 5.8 25.6 4.7 7.5 7.3 5.8 25.2<br />
Latvia 2.4 3.7 3.7 2.8 12.7 2.3 3.6 3.5 2.3 11.7<br />
Lithuania 1.6 3.6 3.3 1.7 10.2 1.4 3.6 3.1 1.5 9.6<br />
Russia 1.5 3.3 2.8 1.1 8.7 1.9 4.3 2.5 1.1 9.8<br />
Other 0.0 0.2 0.0 0.0 0.2 0.0 0.1 0.0 0.1 0.2<br />
export share 71% 71% 68% 70% 70% 72% 73% 70% 71% 71%<br />
12m 2012 12m 2011 change 12m 2012 12m 2011 change<br />
EUR mln EUR mln EUR mln as % of sales as % of sales as % of sales<br />
Sales 86.4 88.3 - 1.9 100.0% 100.0%<br />
Cost of goods sold - 62.7 - 65.4 - 2.7 72.6% 74.0% - 1.5%<br />
incl one-off exp - 0.4 - 0.6 - 0.2 0.5% 0.7% - 0.2%<br />
materials in production & cost<br />
of goods purchased for resale<br />
- 52.0 - 53.9 - 1.9 60.1% 61.0% - 0.9%<br />
labour costs - 4.9 - 5.3 - 0.4 5.6% 5.9% - 0.3%<br />
depreciation - 1.4 - 1.9 - 0.5 1.6% 2.1% - 0.5%<br />
other cost of goods sold - 4.5 - 4.4 + 0.1 5.2% 5.0% + 0.2%<br />
Operating expenses - 22.6 - 22.8 - 0.2 26.1% 25.8% + 0.3%<br />
incl one-off exp - 0.0 - 0.4 - 0.3 0.0% 0.4% - 0.4%<br />
labour costs - 6.6 - 7.0 - 0.4 7.6% 8.0% - 0.3%<br />
transport & logistics services - 3.9 - 4.1 - 0.2 4.5% 4.7% - 0.1%<br />
depreciation - 1.8 - 2.1 - 0.3 2.1% 2.4% - 0.3%<br />
marketing - 2.4 - 2.3 + 0.1 2.8% 2.6% + 0.2%<br />
other operating expenses - 7.8 - 7.2 + 0.6 9.0% 8.2% + 0.8%<br />
Other income/expenses 0.4 0.5 + 0.1 -0.4% -0.5% + 0.1%<br />
incl one-off exp - 0.1 - 0.1 0.1% - 0.1%