AS PREMIA FOODS
AS PREMIA FOODS
AS PREMIA FOODS

You also want an ePaper? Increase the reach of your titles
YUMPU automatically turns print PDFs into web optimized ePapers that Google loves.
<strong>AS</strong> <strong>PREMIA</strong> <strong>FOODS</strong> Consolidated Unaudited Interim Report for 4 th quarter and 12 months of 2012<br />
The main figures by the business segments of Premia Foods for the 4 th quarter and 12 months are indicated in the table<br />
below.<br />
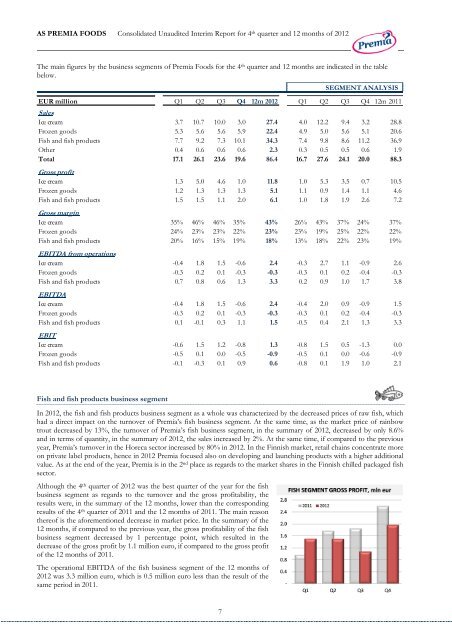
Fish and fish products business segment<br />
In 2012, the fish and fish products business segment as a whole was characterized by the decreased prices of raw fish, which<br />
had a direct impact on the turnover of Premia’s fish business segment. At the same time, as the market price of rainbow<br />
trout decreased by 13%, the turnover of Premia’s fish business segment, in the summary of 2012, decreased by only 8.6%<br />
and in terms of quantity, in the summary of 2012, the sales increased by 2%. At the same time, if compared to the previous<br />
year, Premia’s turnover in the Horeca sector increased by 80% in 2012. In the Finnish market, retail chains concentrate more<br />
on private label products, hence in 2012 Premia focused also on developing and launching products with a higher additional<br />
value. As at the end of the year, Premia is in the 2 nd place as regards to the market shares in the Finnish chilled packaged fish<br />
sector.<br />
Although the 4 th quarter of 2012 was the best quarter of the year for the fish<br />
business segment as regards to the turnover and the gross profitability, the<br />
results were, in the summary of the 12 months, lower than the corresponding<br />
results of the 4 th quarter of 2011 and the 12 months of 2011. The main reason<br />
thereof is the aforementioned decrease in market price. In the summary of the<br />
12 months, if compared to the previous year, the gross profitability of the fish<br />
business segment decreased by 1 percentage point, which resulted in the<br />
decrease of the gross profit by 1.1 million euro, if compared to the gross profit<br />
of the 12 months of 2011.<br />
The operational EBITDA of the fish business segment of the 12 months of<br />
2012 was 3.3 million euro, which is 0.5 million euro less than the result of the<br />
same period in 2011.<br />
7<br />
SEGMENT ANALYSIS<br />
EUR million Q1 Q2 Q3 Q4 12m 2012 Q1 Q2 Q3 Q4 12m 2011<br />
Sales<br />
Ice cream 3.7 10.7 10.0 3.0 27.4 4.0 12.2 9.4 3.2 28.8<br />
Frozen goods 5.3 5.6 5.6 5.9 22.4 4.9 5.0 5.6 5.1 20.6<br />
Fish and fish products 7.7 9.2 7.3 10.1 34.3 7.4 9.8 8.6 11.2 36.9<br />
Other 0.4 0.6 0.6 0.6 2.3 0.3 0.5 0.5 0.6 1.9<br />
Total 17.1 26.1 23.6 19.6 86.4 16.7 27.6 24.1 20.0 88.3<br />
Gross profit<br />
Ice cream 1.3 5.0 4.6 1.0 11.8 1.0 5.3 3.5 0.7 10.5<br />
Frozen goods 1.2 1.3 1.3 1.3 5.1 1.1 0.9 1.4 1.1 4.6<br />
Fish and fish products 1.5 1.5 1.1 2.0 6.1 1.0 1.8 1.9 2.6 7.2<br />
Gross margin<br />
Ice cream 35% 46% 46% 35% 43% 26% 43% 37% 24% 37%<br />
Frozen goods 24% 23% 23% 22% 23% 23% 19% 25% 22% 22%<br />
Fish and fish products 20% 16% 15% 19% 18% 13% 18% 22% 23% 19%<br />
EBITDA from operations<br />
Ice cream -0.4 1.8 1.5 -0.6 2.4 -0.3 2.7 1.1 -0.9 2.6<br />
Frozen goods -0.3 0.2 0.1 -0.3 -0.3 -0.3 0.1 0.2 -0.4 -0.3<br />
Fish and fish products 0.7 0.8 0.6 1.3 3.3 0.2 0.9 1.0 1.7 3.8<br />
EBITDA<br />
Ice cream -0.4 1.8 1.5 -0.6 2.4 -0.4 2.0 0.9 -0.9 1.5<br />
Frozen goods -0.3 0.2 0.1 -0.3 -0.3 -0.3 0.1 0.2 -0.4 -0.3<br />
Fish and fish products 0.1 -0.1 0.3 1.1 1.5 -0.5 0.4 2.1 1.3 3.3<br />
EBIT<br />
Ice cream -0.6 1.5 1.2 -0.8 1.3 -0.8 1.5 0.5 -1.3 0.0<br />
Frozen goods -0.5 0.1 0.0 -0.5 -0.9 -0.5 0.1 0.0 -0.6 -0.9<br />
Fish and fish products -0.1 -0.3 0.1 0.9 0.6 -0.8 0.1 1.9 1.0 2.1