OT – Optima Telekom d.d. Management Interim Report for the first ...
OT – Optima Telekom d.d. Management Interim Report for the first ...
OT – Optima Telekom d.d. Management Interim Report for the first ...

Create successful ePaper yourself
Turn your PDF publications into a flip-book with our unique Google optimized e-Paper software.
<strong>OT</strong> <strong>–</strong> <strong>Optima</strong> <strong>Telekom</strong> d.d.<br />
<strong>Management</strong> <strong>Interim</strong> <strong>Report</strong><br />
<strong>for</strong> <strong>the</strong> <strong>first</strong> half and second<br />
quarter of 2013<br />
consolidated
Main features 3<br />
Business indicators 4<br />
Consolidated revenue 5<br />
Telecommunications services revenue 5<br />
Earnings be<strong>for</strong>e interest, taxation and depreciation <strong>–</strong> EBITDA 6<br />
Earnings be<strong>for</strong>e taxation - EBT 6<br />
Market potential 7<br />
Infrastructural development 8<br />
Significant events in <strong>the</strong> <strong>first</strong> half of 2013 and expectations <strong>for</strong><br />
future development<br />
Macroeconomic and market trends 9<br />
Research and development activities 10<br />
Regulatory environment 11<br />
Changes in <strong>the</strong> Company's <strong>Management</strong> Bodies 13<br />
Statement of <strong>the</strong> Persons in Charge of Financial Statements 14<br />
Financial Statements of Group as of 30 June 2013 15<br />
9
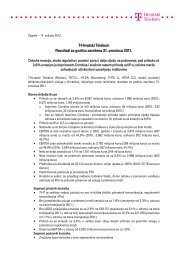
Main features<br />
3<br />
<strong>Optima</strong>telekom<br />
Consolidated <strong>OT</strong> <strong>–</strong> <strong>Optima</strong> <strong>Telekom</strong> d.d. <strong>Management</strong> <strong>Interim</strong> <strong>Report</strong> <strong>for</strong> <strong>the</strong> <strong>first</strong> half and second quarter of 2013<br />
Due to overindebtedness, lack of liquidity and insolvency, pursuant<br />
to <strong>the</strong> Financial Operations and Pre-Bankruptcy Settlement Act (<strong>the</strong><br />
Official Gazette no. 108/2012 and 11/2012), <strong>OT</strong> <strong>–</strong> <strong>Optima</strong> <strong>Telekom</strong><br />
d.d. (hereinafter: <strong>Optima</strong>) has already initiated <strong>the</strong> pre-bankruptcy<br />
settlement procedure, with <strong>the</strong> purpose of operative and financial<br />
restructuring of its business. By implementing <strong>the</strong> financial and<br />
operative restructuring plan, in <strong>the</strong> <strong>for</strong>thcoming period, <strong>Optima</strong> should<br />
become both liquid and solvent. <strong>Optima</strong> obtained <strong>the</strong> Decision on<br />
initiation of pre-bankruptcy settlement proceedings on 11 April 2013,<br />
and <strong>the</strong> <strong>first</strong> (inspection) hearing took place on 21 June 2013. Pursuant<br />
to <strong>the</strong> Financial Operations and Pre-Bankruptcy Settlement Act, all<br />
in<strong>for</strong>mation concerning <strong>the</strong> course of pre-bankruptcy settlement<br />
proceedings are made available to <strong>the</strong> public at <strong>the</strong> Financial Agency’s<br />
website, www.fina.hr.
4<br />
<strong>Optima</strong>telekom<br />
Consolidated <strong>OT</strong> <strong>–</strong> <strong>Optima</strong> <strong>Telekom</strong> d.d. <strong>Management</strong> <strong>Interim</strong> <strong>Report</strong> <strong>for</strong> <strong>the</strong> <strong>first</strong> half and second quarter of 2013<br />
Business indicators<br />
<strong>Optima</strong> <strong>Telekom</strong> concluded <strong>the</strong> <strong>first</strong> half-year period with:<br />
• a decrease of overall consolidated operating revenue by HRK 19.0<br />
million, or 6.6%, with <strong>the</strong> simultaneous decrease of overall operating<br />
costs by 15.8 million, or 5.9%, compared to <strong>the</strong> <strong>first</strong> half of <strong>the</strong> previous<br />
year, while at a quarterly level, that represents an 8.3% reduction of<br />
operating revenue and a 2.4% reduction of operating costs.<br />
• an 8.8% lower earnings be<strong>for</strong>e taxation, interest and depreciation<br />
(EBITDA) compared to <strong>the</strong> <strong>first</strong> half of <strong>the</strong> previous year, with a<br />
positive EBITDA of HRK 41.0 million achieved in <strong>the</strong> <strong>first</strong> half of 2013,<br />
and HRK 14.5 million in <strong>the</strong> second quarter.<br />
H1 2012 H1 2013 H1 2013 /<br />
H1 2012<br />
Q2 2012 Q2 2013 Q2 2013 /<br />
Q2 2012<br />
Total operating income 290,248 277,054 (4.5%) 144,311 140,083 (2.9%)<br />
EBITDA 44,921 40,978 (8.8%) 23,317 14,471 (37.9%)<br />
EBT (16,715) (26,840) 60.6% (8,623) (15,825) 83.5%<br />
30.06.2012 30.06.2013/<br />
30.06.2012<br />
31.12.2012 30.06.2013/<br />
31.12.2012<br />
31.03.2013 30.06.2013/<br />
31.03.2013<br />
30.06.2013<br />
Total number of <strong>OT</strong> users<br />
Number of voice channels 267,240 -15.4% 229,550 -1.5% 229,500 -1.5% 226,033<br />
Number of users in own LLU network 116,785 -0.9% 115,110 0.5% 117,294 -1.3% 115,732<br />
Number of OptiDSL users in own LLU network 74,734 3.5% 74,660 3.7% 77,652 -0.3% 77,386<br />
Number of OptiTV users in own LLU network 19,200 22.4% 21,800 7.8% 22,500 4.4% 23,500<br />
Number of collocations installed 270 3.7% 276 1.4% 276 1.4% 280<br />
North 92 2.2% 92 2.2% 92 2.2% 94<br />
West 45 4.4% 46 2.2% 46 2.2% 47<br />
East 52 5.8% 55 0.0% 55 0.0% 55<br />
South 81 3.7% 83 1.2% 83 1.2% 84
5<br />
<strong>Optima</strong>telekom<br />
Consolidated <strong>OT</strong> <strong>–</strong> <strong>Optima</strong> <strong>Telekom</strong> d.d. <strong>Management</strong> <strong>Interim</strong> <strong>Report</strong> <strong>for</strong> <strong>the</strong> <strong>first</strong> half and second quarter of 2013<br />
Consolidated revenue<br />
The overall consolidated revenue at <strong>the</strong> end of <strong>the</strong> <strong>first</strong> half of 2013 amount to HRK 277.1<br />
million, which indicates a 4.5% decrease compared to <strong>the</strong> results achieved in <strong>the</strong> same<br />
period of <strong>the</strong> previous year. The greatest impact on <strong>the</strong> decrease of overall consolidated<br />
income came from public voice service revenue that, at a global level, has a tendency to<br />
decrease, and is <strong>the</strong> only one with a decrease that significant, making <strong>the</strong> increase of all<br />
o<strong>the</strong>r revenue insufficient to reach last year’s revenue <strong>for</strong> <strong>the</strong> same period.<br />
Telecommunications services revenue<br />
280,0<br />
270,0<br />
260,0<br />
250,0<br />
240,0<br />
230,0<br />
220,0<br />
210,0<br />
200,0<br />
TELEcOmmUNIcATIONS SERVIcES REVENUE<br />
Telecommunications services sales revenue in <strong>the</strong> <strong>first</strong> half of 2013 amounted to HRK<br />
259.2 million, being 3.6% less compared to <strong>the</strong> same period of <strong>the</strong> previous year. The<br />
revenue decrease was primarily influenced by <strong>the</strong> 20.9% drop in publikc voice service<br />
revenue, that amounted to HRK 117.2 million at <strong>the</strong> end of <strong>the</strong> <strong>first</strong> half. The decrease in<br />
revenue arising out of voice services is primarily a result of <strong>the</strong> reduction in <strong>the</strong> number<br />
of minutes of using voice services and <strong>the</strong> minute price reduction.<br />
A significant improvement has been achieved in broadband internet access and multimedia<br />
services (TV via broadband internet access) retail markets, which constitute <strong>the</strong> majority<br />
of <strong>the</strong> improvement. Interner services revenue that amounts to HRK 48.5 million at <strong>the</strong><br />
end of <strong>the</strong> <strong>first</strong> half are 20.8% higher compared to <strong>the</strong> same period of <strong>the</strong> previous year.<br />
The increase of internet services revenue is accompanied by <strong>the</strong> increase of multimedia<br />
services revenue that amounts to HRK 11.5 million and shows a 57.1% increase
6<br />
<strong>Optima</strong>telekom<br />
Consolidated <strong>OT</strong> <strong>–</strong> <strong>Optima</strong> <strong>Telekom</strong> d.d. <strong>Management</strong> <strong>Interim</strong> <strong>Report</strong> <strong>for</strong> <strong>the</strong> <strong>first</strong> half and second quarter of 2013<br />
Data services revenue amounts to HRK 20.1 million at <strong>the</strong> end of <strong>the</strong> <strong>first</strong> half of 2013<br />
and is 84.9% higher compared to <strong>the</strong> same period of <strong>the</strong> previous year.<br />
Interconnection revenue amounts to HRK 62.0 million, being 0.9% lower compared to<br />
<strong>the</strong> same period of <strong>the</strong> previous year.<br />
millions<br />
160<br />
140<br />
120<br />
100<br />
Earnings be<strong>for</strong>e interest, taxation and depreciation <strong>–</strong> EBITDA<br />
Earnings be<strong>for</strong>e taxation - EBT<br />
80<br />
60<br />
40<br />
20<br />
0<br />
Public<br />
voice<br />
H1 2012<br />
H1 2013<br />
Interconnection Internet Data multimedia<br />
The <strong>first</strong> half EBITDA amounts to HRK 41.0 million, which represents an 8.8% decrease<br />
compared to <strong>the</strong> same period of <strong>the</strong> previous year, and a 37.9% decrease <strong>for</strong> <strong>the</strong> second<br />
quarter, to a level of HRK 14.5 million.<br />
The EBITDA decrease compared to 2012 was partially caused by <strong>the</strong> initiation of prebankruptcy<br />
settlement and <strong>the</strong> increase of related costs.<br />
Due to <strong>the</strong> initiation of pre-bankruptcy settlement proceedings, most creditors charged<br />
default interest, causing <strong>the</strong> EBT plummet at <strong>the</strong> end of <strong>the</strong> <strong>first</strong> half of 2013 to <strong>the</strong> amount<br />
of HRK -26.8 million, which is a worse result by HRK 10.1 million or 60.6% compared to <strong>the</strong><br />
same period of <strong>the</strong> previous year.<br />
Given that <strong>the</strong> majority of <strong>the</strong> liabilities became due and payable as per <strong>the</strong> date of initiating <strong>the</strong><br />
pre-bankruptcy proceedings, <strong>the</strong> calculation of financial costs is not done according to regular<br />
interest rates, but default interest rates that are higher and less favorable <strong>for</strong> <strong>the</strong> debtor.
7<br />
<strong>Optima</strong>telekom<br />
Consolidated <strong>OT</strong> <strong>–</strong> <strong>Optima</strong> <strong>Telekom</strong> d.d. <strong>Management</strong> <strong>Interim</strong> <strong>Report</strong> <strong>for</strong> <strong>the</strong> <strong>first</strong> half and second quarter of 2013<br />
Market potential<br />
According to data available to <strong>the</strong> public, Croatia has approximately<br />
1.44 million active phone lines. Within this potential, at <strong>the</strong> end of <strong>the</strong><br />
<strong>first</strong> half, <strong>Optima</strong> has a total of 226,033 voice channels 1 in its network.<br />
In <strong>the</strong> <strong>first</strong> half of 2013, <strong>the</strong> number of potentially available connections at <strong>Optima</strong> was<br />
reduced to 657,342 connections, which represents:<br />
• A reduction (from 658,581 to 657,342) of available connections compared to <strong>the</strong> previous<br />
quarter. The insignificant reduction in <strong>the</strong> number of available connections is a result of<br />
reconstruction of own access carrier network, which is decreasing <strong>the</strong> length of local<br />
area fibers in order to improve service quality. By opening new UPSs, <strong>the</strong> access carrier<br />
has been decreasing <strong>the</strong> number of fibers within reach on <strong>the</strong> existing UPSs.<br />
• Over 45.9% of available connections, which is slightly above <strong>the</strong> benchmark2 <strong>for</strong> <strong>the</strong><br />
alternative carriers’ share in developed markets.<br />
1 Indicators published by HAKOm; Voice channel is <strong>the</strong> basic unit of voice or data transmission. Number of voice channels determines<br />
how many conversations can take place simultaneously on one telephone connection. Telephone connection is defined as physical<br />
connection of <strong>the</strong> user to <strong>the</strong> telecommunications network. A telephone connection may have one or more voice channels.<br />
2 Benchmark - continuing, systematic process of evaluation of products, services or business operations of an<br />
organization, recognized as <strong>the</strong> best praxis with <strong>the</strong> purpose of realizing organizational improvements.
8<br />
<strong>Optima</strong>telekom<br />
Consolidated <strong>OT</strong> <strong>–</strong> <strong>Optima</strong> <strong>Telekom</strong> d.d. <strong>Management</strong> <strong>Interim</strong> <strong>Report</strong> <strong>for</strong> <strong>the</strong> <strong>first</strong> half and second quarter of 2013<br />
Infrastructural development<br />
In accordance with <strong>the</strong> own infrastructure development plan <strong>for</strong> 2013,<br />
during <strong>the</strong> <strong>first</strong> half of 2013 collocations have been erected in Zagreb<br />
(Bogdani), Samobor (Samobor East), Šibenik (Šubićevac), Pula (Stoja<br />
2), where <strong>the</strong> local loop length is being shortened, thus improving <strong>the</strong><br />
quality of broadband internet access. Erecting collocations in Trogir<br />
(Čiovo), Rijeka (Strmica) and in Medulin is being prepared. U pripremi<br />
je podizanje kolokacija u gradovima Trogir (Čiovo), Rijeka (Strmica) te u<br />
Medulinu. Intersection optimization was carried out in <strong>the</strong> <strong>first</strong> quarter.<br />
This primarily means a decrease in <strong>the</strong> quantity of intersections leased<br />
from HŽ, in order to reduce costs.<br />
By <strong>the</strong> end of <strong>the</strong> <strong>first</strong> half of 2013, <strong>the</strong>re were a total of 280 active collocations.<br />
Along with <strong>the</strong> erection of new collocations, infrastructural development necessarily<br />
requires <strong>the</strong> construction of own optical network. During <strong>the</strong> <strong>first</strong> half of 2013, <strong>the</strong> optical<br />
network construction mainly consisted of regular construction of optical feeds to our end<br />
users. Here, we can point out connecting <strong>the</strong> feeds <strong>for</strong> <strong>the</strong> ministry of Justice and VIPNet.<br />
In numbers, we are talking about 37 km of new optical network, or 103 new feeds.<br />
comparing overall lengths, this is an 1.36% expansion of <strong>the</strong> optical network compared to<br />
<strong>the</strong> construction level established at <strong>the</strong> end of 2012 (2,764 km compared to <strong>the</strong> 2,727 km<br />
constructed by <strong>the</strong> end of 2012).<br />
The overall length of constructed optical feeds and sections is 60.5% smaller compared<br />
to <strong>the</strong> same period of 2012 (<strong>first</strong> half of <strong>the</strong> year) considering that <strong>the</strong>re was no significant<br />
construction of optical sections in this period, primarily city access sections.<br />
The largest quantity of feeds and sections was constructed in Region North (15 km),<br />
followed by Region South (10.9 km), Region West (7.9 km) and Region East (3.2 km).
9<br />
<strong>Optima</strong>telekom<br />
Consolidated <strong>OT</strong> <strong>–</strong> <strong>Optima</strong> <strong>Telekom</strong> d.d. <strong>Management</strong> <strong>Interim</strong> <strong>Report</strong> <strong>for</strong> <strong>the</strong> <strong>first</strong> half and second quarter of 2013<br />
Significant events in <strong>the</strong> <strong>first</strong> half of 2013<br />
and expectations <strong>for</strong> future development<br />
Macroeconomic and market trends 3<br />
After an extended period of slight depreciation of <strong>the</strong> HRK compared to <strong>the</strong><br />
joint European currency, in May a mild trend of its increase in value was<br />
recorded, so that <strong>the</strong> Euro was worth 0.5% less at <strong>the</strong> end of <strong>the</strong> month<br />
than at its beginning. Such a trend in <strong>the</strong> exchange rate was caused by<br />
<strong>the</strong> increased offer of <strong>for</strong>eign currencies by <strong>the</strong> banking sector, in part, by<br />
<strong>the</strong> increased inflow of <strong>for</strong>eign currencies in <strong>the</strong> low tourist season, but<br />
in part also by speculative expectations of seasonal value increase of <strong>the</strong><br />
HRK during <strong>the</strong> high tourist season.<br />
All <strong>the</strong> relevant economic variables were already showing less than favorable trends at <strong>the</strong><br />
beginning of <strong>the</strong> year, so it is no surprise that <strong>the</strong> GDP decreased in <strong>the</strong> <strong>first</strong> quarter of this<br />
year. The actual 1.5% GDP decrease compared to <strong>the</strong> same period of <strong>the</strong> previous year was<br />
mostly influenced by <strong>the</strong> reduction in private consumption and export of goods and services.<br />
The inflation curve continues to grow mild: in April <strong>the</strong> annual inflation rate (3.3%) was<br />
at its lowest counting back a year. This was mostly contributed to by <strong>the</strong> prices of oil<br />
derivatives that dropped significantly at <strong>the</strong> annual level (liquid fuels by 7% and car fuels<br />
and lubricants by 5.4%), which made <strong>the</strong>m one of <strong>the</strong> principal factors in downward<br />
adjustment of <strong>the</strong> inflation rate. On <strong>the</strong> o<strong>the</strong>r hand, <strong>the</strong> pressure <strong>for</strong> inflation is generated<br />
from administrative prices <strong>for</strong> energy (electricity, gas) and alimentation.<br />
The number of employed persons amounted to 1,120,728 in April, increasing by 0.7%<br />
compared to <strong>the</strong> previous month. At <strong>the</strong> annual level, <strong>the</strong>re is still a 3% decrease. The<br />
number of employed persons is increasing <strong>for</strong> <strong>the</strong> second month in a row, primarily due<br />
to seasonal employment. The average net salary paid in march amounted to HRK 5,516,<br />
being nominally 1.3%, and actually 1% higher at a monthly level. compared to <strong>the</strong> same<br />
month of <strong>the</strong> previous year, <strong>the</strong> net salary is nominally higher by 0.3%, while it is actually<br />
3.3% lower, which means that <strong>the</strong> actual negative trend in <strong>the</strong> amount of salaries is going<br />
on <strong>for</strong> thirteen months in a row.<br />
3 Dana resources: State Bureau of Statistics (DZS), croatian chamber of Economy (HGK)
10<br />
<strong>Optima</strong>telekom<br />
Consolidated <strong>OT</strong> <strong>–</strong> <strong>Optima</strong> <strong>Telekom</strong> d.d. <strong>Management</strong> <strong>Interim</strong> <strong>Report</strong> <strong>for</strong> <strong>the</strong> <strong>first</strong> half and second quarter of 2013<br />
Resolving <strong>the</strong> issue (striking from records) of large and long-time debtors, <strong>the</strong> value<br />
of outstanding collectibles is lower this year, even by comparison. In April, <strong>the</strong> annual<br />
decrease was achieved in <strong>the</strong> amount of 14% (by HRK 6.1 billion). However, <strong>the</strong> said<br />
decrease was generated solely by legal entities, while <strong>the</strong> situation in <strong>the</strong> trades and<br />
crafts sector continues to deteriorate.<br />
Research and development activities<br />
Research and development activities are primarily directed towards analyzing <strong>the</strong><br />
competition’s market and developing services considering <strong>the</strong> possibilities that appeared<br />
as a result of regulatory changes in <strong>the</strong> application of wholesale services. We would like to<br />
underline <strong>the</strong> following key activities that marked <strong>the</strong> <strong>first</strong> half of 2013:<br />
• Introducing two new services - HaloSurf and <strong>Optima</strong>LAN ured <strong>–</strong> intended <strong>for</strong> small<br />
and medium size users that, as a standard, offer broadband internet access and voice<br />
service via Voice over Internet Protocol (VoIP),<br />
• Replacing <strong>the</strong> existing ADSL Traffic packages with single O+ packages,<br />
• A new children’s channel synchronized in croatian <strong>–</strong> mINI TV <strong>–</strong> has been added to <strong>the</strong><br />
basic OptiTV package<br />
• The following OptiTV channels have been localized: Nickelodeon, Da Vinci learning and<br />
Discovery TLC<br />
• The localized channel Jugoton TV has been added to OptiTV FULL package<br />
• Premium HD packages have been added to OptiTV: HBO HD, HBO comedy HD, cinemax<br />
HD, cinemax 2HD, as well as <strong>the</strong> new HBO GO service <strong>–</strong> an internet service accessible<br />
via Pc, smartphone or tablet which offers direct access to <strong>the</strong> HBO Adria channel and<br />
over 400 video titles available on demand.<br />
• Over 1200 hours of broadcasting material from HBO production has been added to OptiTV,<br />
available via computers, tablets and mobile devices through <strong>the</strong> HBO GO package,<br />
• 14 new OptiTV channels are recordable<br />
• OptiTV interface was corrected and redesigned in may of<br />
• Additional benefits are available to both existing and future O+ package users, as a part<br />
of <strong>the</strong> Bonus kune stimulation program.
11<br />
<strong>Optima</strong>telekom<br />
Consolidated <strong>OT</strong> <strong>–</strong> <strong>Optima</strong> <strong>Telekom</strong> d.d. <strong>Management</strong> <strong>Interim</strong> <strong>Report</strong> <strong>for</strong> <strong>the</strong> <strong>first</strong> half and second quarter of 2013<br />
Regulatory environment<br />
The croatian Post and Electronic communications Agency (hereinafter: HAKOm) continued to<br />
regulate <strong>the</strong> electronic communications market in this reporting period as well, and in doing<br />
so, in order to en<strong>for</strong>ce <strong>the</strong> regulatory obligation of price control and cost accounting <strong>for</strong> landline<br />
network services, it rendered a decision defining a reasonable rate of return of invested capital<br />
in <strong>the</strong> amount of 11.05% within <strong>the</strong> following 3 years, which is augmented by an additional<br />
risk premium of 3.63% <strong>for</strong> new generation access network (NGN) services. Until now, only <strong>the</strong><br />
price of DTK lease and HT’s collocation space was augmented by <strong>the</strong> WAcc amount that was<br />
determined at 11.93%. The said rate will have an impact on HAKOm’a price regulation in line<br />
with <strong>the</strong> cost model. This is a weighted average capital cost by which HT’s cost oriented price is<br />
to be augmented, in order to en<strong>for</strong>ce <strong>the</strong> regulatory obligation of price control.<br />
For <strong>the</strong> purpose of protecting competition, after analyzing <strong>the</strong> relevant markets, HAKOm has<br />
found that <strong>the</strong> competition is ineffective, designated <strong>the</strong> carriers with significant market power<br />
and re-imposed regulatory obligations <strong>for</strong> each of <strong>the</strong>m. In this vein, HAKOm has rendered<br />
final decisions in <strong>the</strong> process of analyzing <strong>the</strong> market of call initiation and termination market<br />
to landline network, <strong>the</strong> market of call termination to a certain mobile network, <strong>the</strong> market<br />
wholesale access to network infrastructure at a fixed location, <strong>the</strong> wholesale broadband access<br />
market. Even after <strong>the</strong> second round of market analysis, <strong>the</strong> regulatory obligations of all carriers<br />
having significant market power remain in <strong>for</strong>ce. Out of <strong>the</strong> obligations having a significant<br />
impact on <strong>the</strong> company’s business, we would like to mention <strong>the</strong> regulatory obligation of<br />
price control, especially <strong>the</strong> calculation of <strong>the</strong> price of call termination to a landline network.<br />
Namely, HAKOm has now also regulated <strong>the</strong> prices of indirect international termination, which<br />
were previously determined at a commercial basis. The market analysis confirmed <strong>the</strong> prices<br />
<strong>for</strong> call termination in <strong>for</strong>ce as of 01.01.2013, <strong>for</strong> both HT and o<strong>the</strong>r carriers with significant<br />
market power, <strong>the</strong> company included, and <strong>the</strong> change of <strong>the</strong> termination price which will be<br />
calculated according to HAKOm’s cost model is anticipated by <strong>the</strong> end of <strong>the</strong> year. Fur<strong>the</strong>rmore,<br />
in separate proceedings <strong>the</strong> regulatory body has calculated <strong>the</strong> price of call termination to<br />
mobile networks, according to <strong>the</strong> cost model. Due to <strong>the</strong> regulatory body’s decision to delaying<br />
<strong>the</strong> application of cost oriented pricing until 01.01.2015 and determining <strong>the</strong> gradual decrease<br />
of current prices of call termination to mobile networks, it is estimated that <strong>the</strong> company was<br />
prevented from saving HRK 6 million in <strong>the</strong> period between 01.01.2013 and 01.01.2015, when<br />
<strong>the</strong> real cost oriented price is to apply.<br />
HAKOm’s decision also regulated new prices <strong>for</strong> <strong>the</strong> wholesale broadband access service<br />
based on <strong>the</strong> ADSL/VDSL technology, as well as <strong>the</strong> prices <strong>for</strong> additional virtual channels <strong>for</strong><br />
<strong>the</strong> VoIP and IPTV service and <strong>the</strong> user equipment supervision via ADSL/VDSL access. The<br />
new cost oriented price <strong>for</strong> monthly charges <strong>for</strong> wholesale broadband access <strong>for</strong> internet<br />
services based on ADSL/VDSL technology is somewhat higher than <strong>the</strong> previous one, but<br />
<strong>for</strong> carriers that have already, at wholesale level, contracted a certain number of individual<br />
wholesale broadband access services with mandatory contract duration of 12 or 24 months,
12<br />
<strong>Optima</strong>telekom<br />
Consolidated <strong>OT</strong> <strong>–</strong> <strong>Optima</strong> <strong>Telekom</strong> d.d. <strong>Management</strong> <strong>Interim</strong> <strong>Report</strong> <strong>for</strong> <strong>the</strong> <strong>first</strong> half and second quarter of 2013<br />
<strong>the</strong> price will remain <strong>the</strong> same until <strong>the</strong> expiry of each individual access, <strong>the</strong> new prices to<br />
be applied only <strong>the</strong>reafter. In addition to <strong>the</strong> new pieces of additional virtual channels <strong>for</strong> <strong>the</strong><br />
VoIP and IPTV services and supervision of user equipment via ADSL/VDSL technology, <strong>the</strong><br />
calculation of <strong>the</strong> same according to <strong>the</strong> cost model resulted in a significant price reduction<br />
(from HRK 7 to 10 per channel). The completion of <strong>the</strong> calculation of cost oriented prices<br />
<strong>for</strong> <strong>the</strong> service of single access to <strong>the</strong> local loop, <strong>the</strong> service of wholesale broadband access<br />
based on FTTH technology, as well as <strong>the</strong> service of leased lines wholesale is anticipated in<br />
<strong>the</strong> upcoming reporting periods.<br />
In this reporting period, <strong>for</strong> <strong>the</strong> <strong>first</strong> time <strong>the</strong> market regulation was alleviated in order<br />
to encourage investments in optical network construction in areas where <strong>the</strong>re is little<br />
commercial interest <strong>for</strong> investments into <strong>the</strong> access network. In order to enhance <strong>the</strong> demand<br />
<strong>for</strong> retail services of broadband internet access based on FTTH technology, by narrowing down<br />
<strong>the</strong> conditions <strong>for</strong> controlling promotional offers, HAKOm alleviated <strong>the</strong> regulatory obligations<br />
imposed on HT in <strong>the</strong> broadband internet access retail market in areas with little commercial<br />
interest (<strong>the</strong> so-called type 2 regulated area), with a simultaneous abolition of HT’s obligation to<br />
replicate promotional offers <strong>for</strong> services based on FTTH technology at wholesale level.<br />
In <strong>the</strong> second round of analysis of relevant markets changed <strong>the</strong> method of calculation of<br />
charges <strong>for</strong> <strong>the</strong> delay in realization of wholesale services by introducing a fixed amount of<br />
charges, instead of <strong>the</strong> previous percentage of monthly charges <strong>for</strong> using particular services,<br />
calculated by day of delay. Sanctioning premature realization and regulated in <strong>the</strong> same way<br />
was also introduced and regulated in <strong>the</strong> same way. Fur<strong>the</strong>rmore, in order to coordinate with<br />
<strong>the</strong> provisions of <strong>the</strong> Finacial Operations and Pre-Bankruptcy Settlement, <strong>the</strong> maturity period<br />
has been prolonged <strong>for</strong> invoices issued by carriers with significant market (HT, VIPnet and<br />
Tele2), <strong>for</strong> <strong>the</strong> use of regulated wholesale services, from <strong>the</strong> present 30 to 60 days, starting<br />
from <strong>the</strong> date when <strong>the</strong> invoice is received, and not when it is sent. At <strong>the</strong> same time, <strong>the</strong><br />
legal framework <strong>for</strong> <strong>for</strong>ced collection has been regulated and period of withholding services<br />
has been shortened from 60 to 30 days, with <strong>the</strong> possibility to activate provided securities<br />
without <strong>the</strong> creditor’s obligation to send a warning once <strong>the</strong> invoice is due. In addition, <strong>for</strong><br />
<strong>the</strong> <strong>first</strong> time quotas were introduced allowing HR to realize <strong>the</strong> wholesale service to <strong>the</strong><br />
carrier user beyond <strong>the</strong> proscribed deadline. HT is obligated to realize <strong>the</strong> average daily<br />
quota of requests within <strong>the</strong> proscribed deadline, with a 20% margin permitted, and <strong>the</strong><br />
rest within an additional deadline. moreover, HT is <strong>for</strong>bidden to charge any monthly charges<br />
on <strong>the</strong> grounds of <strong>the</strong> carrier user access via its own access lines to HT’s access point. The<br />
described amendment of <strong>the</strong> regulatory framework will have a significant financial impact<br />
on <strong>the</strong> company’s business in <strong>the</strong> <strong>for</strong>thcoming reporting period.<br />
In <strong>the</strong> period to come, <strong>the</strong> regulatory body is anticipated to continue its activities in market<br />
analysis procedures, as well as in defining wholesale terms and conditions by applying <strong>the</strong><br />
principle of cost orientation of prices and cost models, which should have an impact on <strong>the</strong><br />
company’s business in future periods.
13<br />
<strong>Optima</strong>telekom<br />
Consolidated <strong>OT</strong> <strong>–</strong> <strong>Optima</strong> <strong>Telekom</strong> d.d. <strong>Management</strong> <strong>Interim</strong> <strong>Report</strong> <strong>for</strong> <strong>the</strong> <strong>first</strong> half and second quarter of 2013<br />
Changes in <strong>the</strong> Company's <strong>Management</strong> Bodies<br />
There were no changes in <strong>the</strong> company's management bodies.
14<br />
<strong>Optima</strong>telekom<br />
Consolidated <strong>OT</strong> <strong>–</strong> <strong>Optima</strong> <strong>Telekom</strong> d.d. <strong>Management</strong> <strong>Interim</strong> <strong>Report</strong> <strong>for</strong> <strong>the</strong> <strong>first</strong> half and second quarter of 2013<br />
Statement of <strong>the</strong> Persons in Charge of Financial Statements<br />
In accordance with Article 410 of <strong>the</strong> capital market Act, <strong>the</strong> HANFA Directive of April 15,<br />
2010 and in light of <strong>the</strong> HANFA opinion of October 21, 2010 pertaining to <strong>the</strong> publication of<br />
reports concerning <strong>the</strong> issuers included in <strong>the</strong> regulated market, <strong>the</strong> members of <strong>the</strong> Board<br />
of Directors, mr. matija martić as chairman of <strong>the</strong> Board, mr. Goran Jovičić, as member of<br />
<strong>the</strong> Board and ms. Jadranka Suručić, as member of <strong>the</strong> Board, jointly declare that, to <strong>the</strong><br />
best of <strong>the</strong>ir knowledge, financial statements <strong>for</strong> <strong>the</strong> reporting period have been prepared in<br />
accordance with applicable standards of financial reporting and that <strong>the</strong>y contain an overall<br />
and true presentation of assets and liabilities, losses and profits, financial status and operation<br />
of <strong>the</strong> companies included in consolidation. The financial report contains a true presentation<br />
of development, results and position of <strong>Optima</strong> <strong>Telekom</strong> and its subsidiaries, as well as a<br />
description of <strong>the</strong> most significant risks and uncertainties which <strong>the</strong> group is exposed to.<br />
(signatures of Board members)<br />
matija martić Goran Jovičić Jadranka Suručić<br />
The management Board would like to emphasize that <strong>the</strong> above report contains certain<br />
statements on future events relative to <strong>the</strong> financial status, electronic communications<br />
market trends, results of activities <strong>the</strong> company and <strong>the</strong> group are currently undertaking<br />
with <strong>the</strong> purpose of improving <strong>the</strong>ir position on <strong>the</strong> market. The said statements are<br />
based on <strong>the</strong> best of knowledge and expectations at present, but cannot represent any<br />
guarantee of <strong>the</strong>ir realization.<br />
Additional in<strong>for</strong>mation and significant changes have been made available by <strong>the</strong> company<br />
at its website: www.optima.hr/investitori.hr
<strong>Optima</strong> <strong>Telekom</strong> d.d.<br />
and Subsidiaries<br />
Financial Statements of Group<br />
as of 30 June 2013
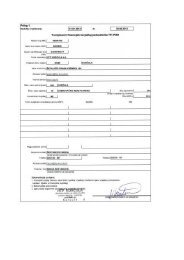
Enclosure 1<br />
<strong>Report</strong>ing period:<br />
Tax Number (MB): 0820431<br />
Registration Number (MBS): 040035070<br />
Personal Identification 36004425025<br />
Number (OIB):<br />
Issuer: <strong>OT</strong>-OPTIMA TELEKOM d.d.<br />
Street and number: BANI 75A<br />
Code and name <strong>for</strong> municipality/city<br />
e-mail address: info@optima.hr<br />
Internet address: www.optima.hr<br />
133<br />
1 Jan 2013 to 30 Jun 2013<br />
Code and name <strong>for</strong> county 21 Number of employees<br />
(at <strong>the</strong> year's end)<br />
391<br />
Consolidated <strong>Report</strong> YES Business activity code:<br />
6110<br />
Entities in consolidation (according to IFRS) Registered seat: Tax number (MB):<br />
OPTIMA TELEKOM za upravljanje nekretninama i<br />
savjetovanje d.o.o.<br />
Book-keeping firm<br />
OPTIMA DIRECT d.o.o. Buje 03806014<br />
OPTIMA TELEKOM d.o.o. Koper, Republika Slovenija 02236133<br />
Contact person Svetlana Kundović<br />
(unosi se samo prezime i ime osobe za kontakt)<br />
Telephone 01/5492 027 Telefaks: 01/5492 019<br />
e-mail address svetlana.kundovic@optima-telekom.hr<br />
Surname and name MATIJA MARTIĆ, JADRANKA SURUĈIĆ<br />
(osoba ovlaštene za zastupanje)<br />
Quarterly Financial <strong>Report</strong>-TFI-POD<br />
Postal Code and Location: 10010 BUZIN<br />
Documents <strong>for</strong> publication<br />
1. Financial Statements (balance sheet, profit and loss account, cash flow statement, change in capital statement<br />
and notes<br />
2. <strong>Management</strong> report<br />
3. Statements <strong>for</strong> persons responsible <strong>for</strong> composing financial statements<br />
M.P.<br />
Kuzmineĉka 8, Zagreb 21017859228<br />
(signature of authorized person)
Issuer: <strong>OT</strong> - <strong>Optima</strong> <strong>Telekom</strong> d.d.<br />
Item<br />
PROFIT AND LOSS ACCOUNT<br />
<strong>for</strong> <strong>the</strong> period from 01 Jan 2013 to 30 Jun 2013<br />
1<br />
I. OPERATING INCOME (112+113)<br />
1. Sales income<br />
2. O<strong>the</strong>r operating income<br />
II. OPERATING EXPENSES (115+116+120+124+125+126+129+130)<br />
1. Changes in <strong>the</strong> value of inventories of ongoing production and finished goods<br />
2. MATERIAL COSTS (117 do 119)<br />
a) Costs of raw material and supplies<br />
b) Costs of goods sold<br />
c) O<strong>the</strong>r external costs<br />
3. Staff costs (121 do 123)<br />
a) Net salaries and wages<br />
b) Expenses of taxes and contributions from salaries<br />
c) Contributions to salaries<br />
4. Amortization<br />
5. O<strong>the</strong>r costs<br />
6. Value adjustment (127+128)<br />
a) fixed assets (apart from financial assets)<br />
b) current assets (apart from financial assets)<br />
7. Provisions<br />
8. O<strong>the</strong>r operating expenses<br />
III. FINANCIAL INCOME (132 through 136)<br />
1. Intersts income, <strong>for</strong>eign exchange gains, dividends and o<strong>the</strong>r income related<br />
to affiliated undertakings<br />
2. Intersts income, <strong>for</strong>eign exchange gains, dividends and o<strong>the</strong>r income related<br />
to unaffiliated undertakings and o<strong>the</strong>r persons<br />
3. Income from affiliated undertakings and participating interests<br />
4. Unrealized income of <strong>the</strong> financial assets<br />
5. O<strong>the</strong>r financial income<br />
IV. FINANCIAL EXPENSES (138 do 141)<br />
1. Interest, <strong>for</strong>eign exchange differences and o<strong>the</strong>r expenses related to affiliated<br />
undertakings<br />
EDP<br />
Previous period Current period<br />
Cumulative Quarter Cumulative Quarter<br />
2 3 4 5 6<br />
111 286.067.822 143.800.107 267.097.724 131.887.045<br />
112 283.806.522 142.950.842 263.092.176 128.806.066<br />
113 2.261.300 849.265 4.005.548 3.080.979<br />
114 268.826.724 134.144.461 253.049.593 130.880.511<br />
115 0 0 0 0<br />
116 207.086.110 103.496.198 187.275.534 96.641.738<br />
117 1.565.612 877.502 1.121.064 526.747<br />
118 9.789.075 3.625.252 898.275 501.415<br />
119 195.731.423 98.993.444 185.256.195 95.613.576<br />
120 25.953.092 12.900.449 25.615.944 12.920.386<br />
121 14.457.411 7.221.127 14.394.535 7.263.104<br />
122 7.815.764 3.913.543 7.844.027 3.953.696<br />
123 3.679.917 1.765.779 3.377.382 1.703.586<br />
124 27.680.164 13.660.961 26.929.455 13.463.991<br />
125 5.956.651 3.031.633 7.892.523 4.889.731<br />
126 2.150.707 1.055.220 5.336.137 2.964.665<br />
127 0 0 1.635.734 216.622<br />
128 2.150.707 1.055.220 3.700.403 2.748.043<br />
129 0 0 0 0<br />
130 0 0 0 0<br />
131 4.180.513 510.552 9.956.215 8.195.554<br />
132 0 0 0 0<br />
133 4.180.513 510.552 9.956.215 8.195.554<br />
134 0 0 0 0<br />
135 0 0 0 0<br />
136 0 0 0 0<br />
137 38.136.486 18.788.740 50.844.660 25.027.221<br />
138 0 0 0 0<br />
2. Interest, <strong>for</strong>eign exchange differences and o<strong>the</strong>r expenses related to unaffiliated<br />
undertakings and o<strong>the</strong>r persons<br />
139 38.136.486 18.788.740 50.844.660 25.027.221<br />
3. Unrealized losses (expenses) of <strong>the</strong> financial assets<br />
140 0 0 0 0<br />
4. O<strong>the</strong>r financial expenses<br />
141 0 0 0 0<br />
V. SHARE IN PROFIT OF AFFILIATED UNDERTAKINGS<br />
142 0 0 0 0<br />
VI. SHARE IN LOSS OF AFFILIATED UNDERTAKINGS<br />
143 0 0 0 0<br />
VII. EXTRAORDINARY - <strong>OT</strong>HER INCOME<br />
144 0 0 0 0<br />
VIII. EXTRAORDINARY - <strong>OT</strong>HER EXPENSES<br />
145 0 0 0 0<br />
IX. T<strong>OT</strong>AL INCOME (111+131+142 + 144)<br />
146 290.248.335 144.310.659 277.053.939 140.082.599<br />
X. T<strong>OT</strong>AL EXPENSES (114+137+143 + 145)<br />
147 306.963.210 152.933.201 303.894.253 155.907.732<br />
XI. PROFIT / LOSS BEFORE TAXATION (146-147)<br />
148 -16.714.875 -8.622.542 -26.840.314 -15.825.133<br />
1. Profit be<strong>for</strong>e taxation (146-147)<br />
149 0 0 0 0<br />
2. Loss be<strong>for</strong>e taxation (147-146)<br />
150 16.714.875 8.622.542 26.840.314 15.825.133<br />
XII. PROFIT TAX<br />
151<br />
XIII. PROFIT / LOSS OF THE PERIOD (148-151)<br />
152 -16.714.875 -8.622.542 -26.840.314 -15.825.133<br />
1. Profit of <strong>the</strong> period (149-151)<br />
153 0 0 0 0<br />
2. Loss of <strong>the</strong> period (151-148)<br />
ANEX TO P&L (to be filled in by entrepreneur submitting consolidated financial report)<br />
XIV. PROFIT OR LOSS OF THE CURRENT PERIOD<br />
154 16.714.875 8.622.542 26.840.314 15.825.133<br />
1. Assigned to <strong>the</strong> holders of parent company's capital<br />
155 -16.714.875 -8.622.542 -26.840.314 -15.825.133<br />
2. Assigned to minority interest<br />
156 0 0<br />
<strong>OT</strong>HER COMPREHENSIVE INCOME STATEMENT (popunjava poduzetnik obveznik primjene MSFI-a)<br />
I. PROFIT / LOSS OF THE PERIOD (= 152)<br />
157 -16.714.875 -8.622.542 -26.840.314 -15.825.133<br />
II. <strong>OT</strong>HER COMPREHENSIVE INCOME / LOSS BEFORE TAX (159 do 165)<br />
158 0 0 0 0<br />
1. Exchange differences on translating <strong>for</strong>eign operations<br />
159 0 0<br />
2. Changes in revalorization reserves of fixed and intangible assets<br />
160 0 0<br />
3. Profit or loss from revaluation of financial assets available <strong>for</strong> sale<br />
161 0 0<br />
4. Profit or loss on effective cash flow protection<br />
162 0 0<br />
5. profit or loss on effective hedge of a net <strong>for</strong>eign investment<br />
163 0 0<br />
6. Share of o<strong>the</strong>r comprehensive income / loss of associated companies<br />
164 0 0<br />
7. Actuarial income / loss on defined benefit plans<br />
165 0 0<br />
III. COMPREHENSIVE INCOME TAX<br />
166 0 0<br />
IV. <strong>OT</strong>HER COMPREHENSIVE INCOME / LOSS FOR THE PERIOD (158-166)<br />
167 0 0 0 0<br />
V. COMPREHENSIVE INCOME / LOSS FOR THE PERIOD (157+167)<br />
168 -16.714.875 -8.622.542 -26.840.314 -15.825.133<br />
ANEX to o<strong>the</strong>r comprehensive income statement (to be filled in by entrepreneur submitting consolidated financial report)<br />
VI. COMPREHENSIVE INCOME / LOSS FOR THE PERIOD<br />
1. Assigned to <strong>the</strong> holders of parent company's capital<br />
169 -16.714.875 -8.622.542 -26.840.314 -15.825.133<br />
2. Assigned to minority interest<br />
170 0 0 0 0
Issuer: <strong>OT</strong> - <strong>Optima</strong> <strong>Telekom</strong> d.d.<br />
Item<br />
1<br />
BALANCE SHEET<br />
as at 30 Jun 2013<br />
ASSETS<br />
A) SUBSCRIBED CAPITAL UNPAID<br />
B) FIXED ASSETS (003+010+020+029+033)<br />
I. INTANGIBLE ASSETS (004 through 009)<br />
1. Development expenses<br />
2.Concessions, patents, licences, goods and services trademarkas, software and o<strong>the</strong>r rights<br />
3. Goodwill<br />
4. Advances <strong>for</strong> procurement of intangible assets<br />
5. Intangible assets in preparation<br />
6. O<strong>the</strong>r intangible assets<br />
II. TANGIBLE ASSETS (011 through 019)<br />
1. Land<br />
2. Building objects<br />
3. Facilities and equipment<br />
4. Tools, production inventory and transport assets<br />
5. Biological assets<br />
6. Advances <strong>for</strong> tangible assets<br />
7. Tangible assets in preparation<br />
8. O<strong>the</strong>r tangible assets<br />
9. Real estate investments<br />
III. FIXED FINANCIAL ASSETS (021 through 028)<br />
1. Shares (stock) in affiliated enterpreneurs<br />
2. Loans granted to affiliated enterpreneurs<br />
3. Participating interests (shares)<br />
4. Loans given to entrepreneurs with participating interests<br />
5. Securities investments<br />
6. Granted loans, deposits and such<br />
7. Own stocks and shares<br />
8. O<strong>the</strong>r fixed financial assets<br />
IV. RECEIVABLES (030 through 032)<br />
1. Receivables from affiliated enterpreneurs<br />
2. Receivables pertaining to sale on credit<br />
3. O<strong>the</strong>r receivables<br />
V. DEFERRED TAX ASSETS<br />
C) CURRENT ASSETS (035+043+050+058)<br />
I. INVENTORY (036 do 042)<br />
1. Raw material and supplies<br />
2. Ongoing produciton<br />
3. Finished products<br />
4. Trading goods<br />
5. Inventory advances<br />
6. Assets intended <strong>for</strong> sale<br />
7. Biological assets<br />
II. RECEIVABLES (044 do 049)<br />
1. Receivables from affiliated enterpreneurs<br />
2. Receivables from buyers<br />
3. Receivables from participating enterpreneurs<br />
4. Receivables from employees and members of <strong>the</strong> enterpreneur<br />
5.Receivables from <strong>the</strong> state and o<strong>the</strong>r institution<br />
6. O<strong>the</strong>r receivables<br />
III. CURRENT FINANCIAL ASSETS (051 through 057)<br />
1. Shares (stock) in affiliated enterpreneurs<br />
2. Loans granted to affiliated enterpreneurs<br />
3. Participating interests (shares)<br />
4. Loans given to entrepreneurs with participating interests<br />
5. Securities investments<br />
6. Granted loans, deposits and such<br />
7. O<strong>the</strong>r financial assets<br />
IV. CASH IN BANK AND REGISTER<br />
D) PREPAYMENTS AND ACCRUED INCOME<br />
E) T<strong>OT</strong>AL ASSETS (001+002+034+059)<br />
F) OFF-BALANCE RECORDS<br />
EDP # Previous period Current period<br />
2 3 4<br />
001 0 0<br />
002 397.633.543 379.176.715<br />
003 20.876.030 18.855.309<br />
004 0 0<br />
005 20.876.030 18.855.309<br />
006 0 0<br />
007 0 0<br />
008 0 0<br />
009 0 0<br />
010 373.193.013 356.851.325<br />
011 23.269 23.269<br />
012 21.478.201 21.111.180<br />
013 340.766.940 327.064.922<br />
014 1.052.514 1.592.612<br />
015 0 0<br />
016 0 0<br />
017 9.087.578 6.323.529<br />
018 46.822 46.822<br />
019 737.689 688.991<br />
020 3.564.500 3.470.081<br />
021 0 0<br />
022 0 0<br />
023 35.000 35.000<br />
024 0 0<br />
025 0 0<br />
026 3.529.500 3.435.081<br />
027 0 0<br />
028 0 0<br />
029 0 0<br />
030 0 0<br />
031 0 0<br />
032 0 0<br />
033 0 0<br />
034 85.467.994 137.850.090<br />
035 1.283.214 2.180.039<br />
036 0 0<br />
037 0 0<br />
038 0 0<br />
039 1.283.214 2.180.039<br />
040 0 0<br />
041 0 0<br />
042 0 0<br />
043 81.776.725 101.771.156<br />
044 0 0<br />
045 79.809.127 94.868.491<br />
046 0 0<br />
047 39.010 42.503<br />
048 828.515 478.890<br />
049 1.100.073 6.381.272<br />
050 588.199 1.080.452<br />
051 0 0<br />
052 0 0<br />
053 0 0<br />
054 0 0<br />
055 0 0<br />
056 588.199 1.080.452<br />
057 0 0<br />
058 1.819.856 32.818.443<br />
059 50.495.031 46.621.758<br />
060 533.596.568 563.648.563<br />
061 1.035.973.548 1.626.752.330
LIABILITIES<br />
A) CAPITAL AND RESERVES (063+064+065+071+072+075+078)<br />
I. BASE (registered) capital<br />
II. CAPITA RESERVES<br />
III. PROFIT RESERVES (066+067-068+069+070)<br />
1. Legal reserves<br />
2. Own stock reserves<br />
3. Own stocks and shares (deductable item)<br />
4. Statutory reserves<br />
5. O<strong>the</strong>r reserves<br />
IV. REVALORIZATION RESERVES<br />
V. RETAINED EARNINGS OR LOSS CARRIED FORWARD (073-074)<br />
1. Retained earnings<br />
2. Loss carried <strong>for</strong>ward<br />
VI. PROFIT OR LOSS OF THE YEAR (076-077)<br />
1. Profit of <strong>the</strong> year<br />
2. Loss of <strong>the</strong> year<br />
VII. MINORITY INTEREST<br />
B) PROVISIONS (080 through 082)<br />
1. Provisions <strong>for</strong> pensions, severance payments amd similar obligations<br />
2. Provisions <strong>for</strong> tax liabilities<br />
3. O<strong>the</strong>r provisions<br />
C) FIXED LIABILITIES (084 through 092)<br />
1. Liabilities towards affiliated enterpreneurs<br />
2. Liabilities <strong>for</strong> loans, deposits and similar<br />
3. Liabilities towards banks and o<strong>the</strong>r financial institutions<br />
4. Liabilities <strong>for</strong> advances<br />
5. Liabilities towards suppliers<br />
6. Liabilities as per securities<br />
7. Liabilities towards entrepreneur with participating interests<br />
8. O<strong>the</strong>r fixed liabilities<br />
9. Deferred tax liabilities<br />
D) CURRENT LIABILITIES (094 do 105)<br />
1. Liabilities towards affiliated enterpreneurs<br />
2. Liabilities <strong>for</strong> loans, deposits and similar<br />
3. Liabilities towards banks and o<strong>the</strong>r financial institutions<br />
4. Liabilities <strong>for</strong> advances<br />
5. Liabilities towards suppliers<br />
6. Liabilities as per securities<br />
7. Liabilities towards entrepreneur with participating interests<br />
8. Liabilities towards employees<br />
9. Liabilities <strong>for</strong> taxes, contributions and similar levies<br />
10. Liabilities as per share in results<br />
11. Liabilities as per longterm assets intended <strong>for</strong> sale<br />
12. O<strong>the</strong>r current liabilities<br />
E) DEFERRED SETTLEMENT OF CHARGES AND INCOME OF FUTURE PERIOD<br />
F) T<strong>OT</strong>AL <strong>–</strong> LIABILITIES (062+079+083+093+106)<br />
G) OFF <strong>–</strong> BALANCE RECORDS<br />
ANNEX TO THE BALANCE SHEET (to be filled in by entrepreneur submitting consolidated financial report)<br />
A) CAPITAL AND RESERVES<br />
1. Assigned to <strong>the</strong> holders of parent company's capital<br />
2. Assigned to minority interest<br />
Note 1.: anex to <strong>the</strong> balance sheet to be filled in by entrepreneur submitting consolidated financial report<br />
062 -591.569.657 -616.731.266<br />
063 28.200.700 28.200.700<br />
064 194.354.000 194.354.000<br />
065 0 0<br />
066 0 0<br />
067 0 0<br />
068 0 0<br />
069 0 0<br />
070 0 0<br />
071 0 0<br />
072 -709.231.838 -812.445.652<br />
073 0 0<br />
074 709.231.838 812.445.652<br />
075 -104.892.519 -26.840.314<br />
076 0 0<br />
077 104.892.519 26.840.314<br />
078 0 0<br />
079 2.300.170 2.300.170<br />
080 2.300.170 2.300.170<br />
081 0 0<br />
082 0 0<br />
083 541.604.388 15.136.721<br />
084 0 0<br />
085 24.398.088 13.922.556<br />
086 515.740.929 0<br />
087 0 0<br />
088 0 0<br />
089 0 0<br />
090 0 0<br />
091 0 0<br />
092 1.465.371 1.214.165<br />
093 515.812.521 1.131.425.382<br />
094 0 0<br />
095 7.083.572 2.902.951<br />
096 27.011.275 603.211.943<br />
097 7.452.575 0<br />
098 195.123.259 227.757.365<br />
099 269.413.750 281.550.625<br />
100 0 0<br />
101 2.539.882 2.602.523<br />
102 6.947.494 13.223.274<br />
103 0 0<br />
104 0 0<br />
105 240.714 176.701<br />
106 65.449.146 31.517.556<br />
107 533.596.568 563.648.563<br />
108 1.035.973.548 1.626.752.330<br />
109 -591.569.657 -616.731.266<br />
110 0
Issuer: <strong>OT</strong> - <strong>Optima</strong> <strong>Telekom</strong> d.d.<br />
CASH FLOW STATEMENT - Indirect method<br />
in <strong>the</strong> period from 01 Jan 2013 to 30 Jun 2013<br />
Item<br />
1<br />
CASH FLOW FROM OPERATING ACTIVITIES<br />
1. Profit be<strong>for</strong>e taxation<br />
2. Depreciation<br />
3. Increase of short-term liabilities<br />
4. Decrease of short-term receivables<br />
5. Decrease of inventories<br />
6. O<strong>the</strong>r increase of cash flow<br />
I. Total increase of cash flow from operating activities (001 through 006)<br />
1. Decrease of short-term liabilities<br />
2. Increase of short-term receivables<br />
3. Increase of inventories<br />
4. O<strong>the</strong>r decrease of cash flow<br />
II. Total decrease of cash flow from operating activities (008 through 011)<br />
A1) NET INCREASE OF CASH FLOW FROM OPERATING ACTIVITIES (007-012)<br />
A2) NET DECREASE OF CASH FLOW FROM OPERATING ACTIVITIES (012-007)<br />
CASH FLOW FROM INVESTMENT ACTIVITIES<br />
1. Cash receipt from sale of tangible and intangible assets<br />
2.Cash receipt from sale of ownership and debt instruments<br />
3. Cash receipt from interest rates<br />
4. Cash receipt from dividends<br />
5. O<strong>the</strong>r cash receipts from investment activities<br />
III. Total cash receipts from investment activities (015 through 019)<br />
1. Cash expenditure <strong>for</strong> buying tangible and intangible fixed assets<br />
2. Cash expenditure <strong>for</strong> acquiring ownership and debt financial instruments<br />
3. O<strong>the</strong>r expenditures from investment activities<br />
IV. Total cash expenditures from investment activities (021 through 023)<br />
B1) NET INCREASE OF CASH FLOW FROM INVESTMENT ACTIVITIES (020-024)<br />
B2) NET DECREASE OF CASH FLOW FROM INVESTMENT ACTIVITIES (024-020)<br />
CASH FLOW FROM FINANCIAL ACTIVITIES<br />
1. Cash receipt from issuing of ownership and debt financial instruments<br />
2. Cash receipt from loan principal, debentures, loans and o<strong>the</strong>r borrowing<br />
3. O<strong>the</strong>r receipt from financial activities<br />
V. Total cash receipt from financial activities (027 through 029)<br />
1. Cash expenditure <strong>for</strong> <strong>the</strong> payment of loan principal and bonds<br />
2. Cash expenditure <strong>for</strong> <strong>the</strong> payment of dividend<br />
3. Cash expenditure <strong>for</strong> financial lease<br />
4.Cash expenditure <strong>for</strong> own shares buy-off<br />
5. O<strong>the</strong>r expenditures from financial activities<br />
VI. Total cash expenditure from financial activities (031 through 035)<br />
C1) NET INCREASE OF CASH FLOW FROM FINANCIAL ACTIVITIES (030-036)<br />
C2)NET DECREASE OF CASH FLOW FROM FINANCIAL ACTIVITIES (036-030)<br />
Total increase of cash flow (013 <strong>–</strong> 014 + 025 <strong>–</strong> 026 + 037 <strong>–</strong> 038)<br />
Total decrease of cash flow (014 <strong>–</strong> 013 + 026 <strong>–</strong> 025 + 038 <strong>–</strong> 037)<br />
Cash and cash equivalents at <strong>the</strong> beginning of <strong>the</strong> period<br />
Increase of cash and cash equivalents<br />
Decrease of cash and cash equivalents<br />
Cash and cash equivalents at <strong>the</strong> end of <strong>the</strong> period<br />
EDP Previous period Current period<br />
2 3 4<br />
001 -16.714.875 -26.840.314<br />
002 27.680.164 26.929.455<br />
003 102.560.445 43.592.814<br />
004 0 0<br />
005 0 0<br />
006 5.081.795 5.646.397<br />
007 118.607.529 49.328.352<br />
008 0 0<br />
009 16.640.420 19.994.431<br />
010 1.207.479 896.825<br />
011 2.782.570 34.423.843<br />
012 20.630.469 55.315.099<br />
013 97.977.060 0<br />
014 0 5.986.747<br />
015 0 0<br />
016 0 0<br />
017 0 0<br />
018 0 0<br />
019 0 0<br />
020 0 0<br />
021 25.441.508 8.567.046<br />
022 0 0<br />
023 0 0<br />
024 25.441.508 8.567.046<br />
025 0 0<br />
026 25.441.508 8.567.046<br />
027 0 0<br />
028 0 45.552.380<br />
029 0 0<br />
030 0 45.552.380<br />
031 72.942.802 0<br />
032 0 0<br />
033 0 0<br />
034 0 0<br />
035 0 0<br />
036 72.942.802 0<br />
037 0 45.552.380<br />
038 72.942.802 0<br />
039 0 30.998.587<br />
040 407.250 0<br />
041 1.394.534 1.819.856<br />
042 0 30.998.587<br />
043 407.250 0<br />
044 987.284 32.818.443
CHANGE IN CAPITAL STATEMENT<br />
EDP Previous year Current year<br />
2 3 4<br />
001 28.200.700 28.200.700<br />
002 194.354.000 194.354.000<br />
003 0 0<br />
004 -708.390.211 -812.445.652<br />
005 -16.714.875 -26.840.314<br />
006 0 0<br />
007 0 0<br />
008 0 0<br />
009 0 0<br />
010 -502.550.386 -616.731.266<br />
011 0 0<br />
012 0 0<br />
013 0 0<br />
014 0 0<br />
015 0 0<br />
016 0 0<br />
017 0 0<br />
<strong>for</strong> <strong>the</strong> period from 1.1.2013 to 30.6.2013<br />
Item<br />
1<br />
1. Subscribed capital<br />
2. Capital reserves<br />
3. Profit reserves<br />
4. Retained profit or loss carried <strong>for</strong>ward<br />
5. Profit or loss of <strong>the</strong> current year<br />
6. Revaluation of fixed tangible assets<br />
7. Revaluation of intangible assets<br />
8. Revaluation of financial property available <strong>for</strong> sale<br />
9. O<strong>the</strong>r revaluation<br />
10. Total capital and reserves (EDP 001 through 009)<br />
11. Foreign exchange differences from net investments in <strong>for</strong>eign operations<br />
12. Current and deferred taxes (part)<br />
13. Cash flow protection<br />
14. Changes in accounting policies<br />
15. Correction of significant mistakes from <strong>the</strong> previous period<br />
16. O<strong>the</strong>r equity changes<br />
17. Total increase or decrease of capital (EDP 011 through 016)<br />
018 -502.550.386 -616.731.266<br />
019 0 0<br />
17 a. Assigned to holders of parent company's capital<br />
17 b. Assigned to minority interest<br />
Items that reduce capital entered with a negative sign<br />
Data under EDP codes 001-009 to be input balance sheet as at date
Notes to <strong>the</strong> Financial Statements<br />
According to HANFA's instructions items in balance sheet in <strong>the</strong> positions of <strong>the</strong> previous period is 31 December 2012<br />
As a result of indebtedness, insolvency and inliquidity and by <strong>the</strong> time of publication of this report, in compliance with <strong>the</strong> Croatian Law on financial<br />
business and pre-bankruptcy settlement (NN 108/2012 and 11/2012), <strong>Optima</strong> has launched a pre-bankruptcy settlement with <strong>the</strong> goal of<br />
operational and financial restructuring of <strong>the</strong> company. With <strong>the</strong> implementation of restructuring programme, <strong>Optima</strong> should become solvent and<br />
liquid in subsequent period. On 11 Apr 2013 <strong>Optima</strong> received <strong>the</strong> decision of opening of <strong>the</strong> prebankruptcy settlement and <strong>first</strong> (questioning)<br />
session was on 21 Jun 2013. All in<strong>for</strong>mation regarding <strong>the</strong> proceedings of prebankruptcy settlement are made public in accordance with <strong>the</strong><br />
financial business and pre-bankruptcy settlement on <strong>the</strong> website of Fina. www.fina.hr<br />
1. GENERAL INFORMATION<br />
History and incorporation<br />
The company <strong>Optima</strong> <strong>Telekom</strong> d.d. (hereinafter: <strong>the</strong> Company) was established in 1994 as Syskey d.o.o., while its principal operating activity and<br />
company name was changed to <strong>Optima</strong> <strong>Telekom</strong> d.o.o. on 22 April 2004.<br />
The Company changed its legal status from a limited liability company to a joint stock company in July 2007. The Council of <strong>the</strong> Croatian<br />
Telecommunications Agency isssued a licence <strong>for</strong> public voice service in fixed networks <strong>for</strong> <strong>the</strong> company on 19 November 2004, <strong>for</strong> a period of 30<br />
years.<br />
Principal Business Activities<br />
The Company's principal business activity is <strong>the</strong> provision of telecommunications services to private and business users in <strong>the</strong> Croatian market.<br />
The Company began to provide its telecommunications services in May of 2005.<br />
In its beginnings, <strong>Optima</strong> <strong>Telekom</strong> d.d. focused on business users, but soon after starting business operations, it began to aim <strong>for</strong> <strong>the</strong> private users<br />
market offering quality voice packages.<br />
To its business users, <strong>Optima</strong> <strong>Telekom</strong> d.d. offers services of direct access, internet services, as well as voice telecommunication services through<br />
its own network and/or migrated previously chosen services. Along with that, <strong>the</strong> leading services which <strong>Optima</strong> <strong>Telekom</strong> d.d. provides to business<br />
users is <strong>the</strong> IP Centrex solution, among <strong>the</strong> <strong>first</strong> of this kind in <strong>the</strong> Croatian market and IP VPN Services. The existing capacities enable <strong>Optima</strong><br />
<strong>Telekom</strong>u d.d.to provide services of collocation and hosting. To its large business clients, <strong>the</strong> Company also offers specifically designed solutions<br />
relying on its exceptional skills in <strong>the</strong> field of IT technology.<br />
On 6 July 2006 <strong>OT</strong>-<strong>Optima</strong> <strong>Telekom</strong> d.d. acquired 100% of interest in <strong>Optima</strong> Grupa Holding d.o.o., which changed its name to <strong>Optima</strong> Direct<br />
d.o.o., on 23 September 2008.<br />
The main business activities of <strong>Optima</strong> Direct d.o.o. are trading and providing various services which mainly relate to telecommunications sector.<br />
In August 2008, <strong>the</strong> Parent Company increased <strong>the</strong> share capital of <strong>Optima</strong> Direct d.o.o. by HRK 15.888 i.e. <strong>the</strong> share capital was increased from<br />
HRK 3.328 to HRK 19.216.<br />
As a sole member-founder, <strong>the</strong> Company established <strong>Optima</strong> <strong>Telekom</strong> d.o.o. Kopar, Slovenia, in 2007.<br />
As a sole member-founder, <strong>the</strong> Company established <strong>Optima</strong> telekom za upravljanje nekretninama i savjetovanje d.o.o., on 16 Aug 2011, wich<br />
currently is not operating<br />
Investments in affiliated companies as on 30 Jun 2013<br />
Subsidiaries Shareholding<br />
<strong>Optima</strong> Direct d.o.o., Croatia 100%<br />
<strong>Optima</strong> <strong>Telekom</strong> d.o.o., Slovenia 100%<br />
<strong>Optima</strong> telekom za upravljanje<br />
nekretninama i savjetovanje d.o.o.<br />
100%<br />
Transactions within <strong>the</strong> group are carried out at fair market terms and conditions.<br />
Staff<br />
On 30. Jun 2013 <strong>the</strong> Company employed 391 employees.<br />
MANAGEMENT AND SUPERVISORY BOARD<br />
<strong>Management</strong> Board of <strong>the</strong> Company in 2013:<br />
Matija Martić Chairman of <strong>the</strong> Company<br />
Goran Jovičić Member<br />
Jadranka Suručić<br />
Member<br />
Supervisory Board of <strong>the</strong> Company:<br />
Nada Martić Chairman<br />
Ivan Martić Member and Deputy Chairman<br />
Zrinka Vuković Berić Member<br />
Duško Grabovac Member
REVIEW OF BASIC ACCOUNTING POLICIES<br />
Basis of Preparation<br />
The Financial Statements of <strong>the</strong> Company have been prepared in accordance with International Accounting Standards (IAS) and International<br />
Financial <strong>Report</strong>ing Standards (IFRS). Financial Statements have been prepared under <strong>the</strong> historical cost convention, except <strong>for</strong> <strong>the</strong> valuation of<br />
certain financial instruments.<br />
<strong>Report</strong>ing Currency<br />
The Financial Statements of <strong>the</strong> Group are presented in Croatian kunas (HRK). The applicable exchange rate of <strong>the</strong> Croatian currency on 30 Jun<br />
2013 was HRK 7,451344 <strong>for</strong> EUR 1 and HRK 5,706344 <strong>for</strong> USD 1.<br />
112. SALES INCOME<br />
30 Jun 2013 30 Jun 2012<br />
Public voice services 117.159.845 148.059.604<br />
Interconnection services 61.961.697 62.531.578<br />
Internet services 48.490.895 40.141.959<br />
Data services 20.063.660 10.849.374<br />
Multimedia services 11.529.319 7.337.896<br />
Lease and sale of equipment 2.540.021 1.971.488<br />
Sale of goods and products 0 7.461.145<br />
Trade agency income 56.094 2.536.271<br />
O<strong>the</strong>r services 1.290.645 2.917.207<br />
263.092.176 283.806.522<br />
113. <strong>OT</strong>HER OPERATING INCOME<br />
30 Jun 2013 30 Jun 2012<br />
Write off old trade payables 783.603 1.854.898<br />
Income from rent - billing system 75.546 0<br />
Income from collected penalties etc. 862.651 0<br />
Income from in kind payments 196.544 213.697<br />
Income from assets sale 1.655.203 0<br />
O<strong>the</strong>r income 432.001 192.705<br />
4.005.548 2.261.300<br />
119. <strong>OT</strong>HER MATERIAL COSTS<br />
30 Jun 2013 30 Jun 2012<br />
Costs of maintenance 7.937.277 8.526.416<br />
Marketing services 1.099.908 2.708.361<br />
Billing costs 2.932.500 3.931.717<br />
Line lease costs 23.257.334 20.174.457<br />
Intellectual and o<strong>the</strong>r services 2.440.952 1.101.822<br />
Utilities 4.176.054 4.718.759<br />
Customer attraction costs 2.685.035 5.467.234<br />
Pair connection fees 30.982.971 30.272.189<br />
Telecommunications costs 105.196.346 113.319.638<br />
Residential sales services 1.466.289 2.160.732<br />
O<strong>the</strong>r costs 3.081.529 3.350.098<br />
185.256.195 195.731.423<br />
120. STAFF EXPENSES<br />
30 Jun 2013 30 Jun 2012<br />
Net salaries 14.394.535 14.457.411<br />
Taxes and contributions from salaries 7.844.027 7.815.764<br />
Taxes and contributions on salaries 3.377.382 3.679.917<br />
Number of employees on 30 Jun<br />
2013<br />
25.615.944 25.953.092<br />
391 374<br />
124. AMORTIZATION OF TANGIBLE AND INTANGIBLE ASSETS<br />
30 Jun 2013 30 Jun 2012<br />
Amortization of intangible assets 2.465.701 3.470.032<br />
Amortization of fixed tangible assets 24.463.754 24.210.132<br />
26.929.455 27.680.164
125. <strong>OT</strong>HER OPERATING EXPENSES<br />
30 Jun 2013 30 Jun 2012<br />
Compensations to employees 1.145.032 1.054.145<br />
Representation 615.103 741.895<br />
Insurance premiums 633.810 830.018<br />
Bank charges 1.296.636 1.507.423<br />
Taxes, contributions and membership<br />
fees<br />
759.269 459.039<br />
Costs of sold and written off assets 1.066.496 58.005<br />
Gifts and sponsorships 279.620 457.975<br />
O<strong>the</strong>r expenses 2.096.557 848.151<br />
7.892.523 5.956.651<br />
Costs reimbursed to employees comprise of daily allowances, overnight accommodation and transport related to business travels, commutation<br />
allowance, reimbursement of costs <strong>for</strong> <strong>the</strong> use of personal cars <strong>for</strong> business purposes and similar.<br />
126. VALUE ADJUSTMENT<br />
Value adjustment is per<strong>for</strong>med at <strong>the</strong> end of <strong>the</strong> reporting period if <strong>the</strong>re is evidence that <strong>the</strong>re are uncollectible trade receivables arising from<br />
significant financial difficulties on <strong>the</strong> clients' side, cancellation of contracts and <strong>for</strong>ced execution, pending bankruptcy etc.<br />
131. FINANCIAL INCOME<br />
30 Jun 2013 30 Jun 2012<br />
Interest income 3.630.256 2.899.167<br />
Foreign exchange gains 6.325.959 1.281.346<br />
9.956.215 4.180.513<br />
137. FINANCIAL EXPENSES<br />
30 Jun 2013 30 Jun 2012<br />
Interest expenses 50.257.444 37.595.990<br />
Fee 263.750 419.174<br />
Foreign exchange losses 323.466 121.322<br />
50.844.660 38.136.486<br />
Interest expenses consist of interests accrued on credits, bonds issued by <strong>the</strong> Company and default interest <strong>for</strong> untimely settlement of trade<br />
payables.<br />
Due to pre-bankruptcy settlement in which loans matured, interest is calculated at penalty rate (instead on regular rate) which is higher and<br />
because of that interest expenses increased<br />
003. INTANGIBLE ASSETS<br />
PURCHASE VALUE<br />
CONCESSIONS<br />
AND RIGHTS<br />
SOFTWARE<br />
ASSETS IN<br />
PROGRESS<br />
T<strong>OT</strong>AL<br />
As at 01 Jan 2013 8.187.690 82.540.525 0 90.728.215<br />
Additions 444.980 444.980<br />
Transfer from assets in progress 444.980 -444.980 0<br />
Disposals and retirements 0<br />
As at 30 Jun 2013 8.187.690 82.985.505 0 91.173.195<br />
VALUE ADJUSTMENT<br />
As at 01 Jan 2013 1.930.474 67.921.711 0 69.852.185<br />
Amortization of <strong>the</strong> current year 136.325 2.329.376 2.465.701<br />
Disposals and retirements 0<br />
Amortization as at 30 Jun 2013 2.066.799 70.251.087 0 72.317.886<br />
NET ACCOUNTING VALUE<br />
As at 30 Jun 2013 6.120.891 12.734.418 0 18.855.309
010. FIXED ASSETS<br />
PURCHASE VALUE<br />
LAND BUILDINGS<br />
PLANT,<br />
EQUIPMENT,<br />
TOOLS AND<br />
PRODUCTION<br />
INVENTORY<br />
VEHICLES<br />
WORK OF<br />
ARTS<br />
ASSETS IN<br />
PROGRESS<br />
LEASEHOLD<br />
IMPROVEMENTS<br />
As at 01 Jan 2012 23.269 27.157.396 586.564.547 6.539.345 46.822 9.087.578 4.502.060 633.921.017<br />
Additions 4.734.000 679.540 7.907.618 107.680 13.428.838<br />
Transfer from assets in progress 10.671.667 -10.671.667 0<br />
Disposals and retirements -28.020 -8.298.223 -8.442 -8.334.685<br />
As at 30 Jun 2013 23.269 27.129.376 593.671.991 7.210.443 46.822 6.323.529 4.609.740 639.015.170<br />
VALUE ADJUSTMENT<br />
As at 01 Jan 2012 0 5.679.195 245.797.607 5.486.831 0 0 3.764.371 260.728.004<br />
Amortization of <strong>the</strong> current year 342.993 23.825.605 138.778 156.378 24.463.754<br />
Disposals and retirements -3.992 -3.016.143 -7.778 -3.027.913<br />
Amortization as at 30 Jun 2013 0 6.018.196 266.607.069 5.617.831 0 0 3.920.749 282.163.845<br />
NET ACCOUNTING VALUE<br />
As at 30 Jun 2013 23.269 21.111.180 327.064.922 1.592.612 46.822 6.323.529 688.991 356.851.325<br />
020. LONG-TERM FINANCIAL ASSETS<br />
30 Jun 2013<br />
Loans to majority shareholder 14.071.454<br />
Loans to third party companies 36.777.680<br />
Long term deposits 3.435.081<br />
Participating interests (shares) 35.000<br />
54.319.215<br />
Value adjustment -50.849.134<br />
3.470.081<br />
Long term deposits comprise of two guarantee deposits with Zagrebačka banka d.d. and <strong>the</strong>y come due on 16 February 2015 and 23 February<br />
2015, respectively.<br />
Participating interests are related to <strong>the</strong> shares in company Pevec d.d., acquired by uncollected receivables.<br />
Movement of value adjustment of long term assets<br />
30 Jun 2013<br />
1 January 2013 49.033.884<br />
Write off during <strong>the</strong> year 0<br />
Reserved during <strong>the</strong> year 1.815.250<br />
Closing balance 50.849.134<br />
043. RECEIVABLES<br />
30 Jun 2013<br />
Trade receivables 94.868.491<br />
Employee receivables 42.503<br />
Receivables from <strong>the</strong> state and o<strong>the</strong>r<br />
478.890<br />
institutions<br />
O<strong>the</strong>r receivables 6.381.272<br />
101.771.156<br />
045. TRADE RECEIVABLES<br />
30 Jun 2013<br />
Domestic trade receivables 108.775.367<br />
Foreign trade receivables 14.891.009<br />
Interests receivables 16.405<br />
123.682.781<br />
Value adjustment -28.814.290<br />
94.868.491<br />
Movement of value adjustment <strong>for</strong> doubtful receivables:<br />
30 Jun 2013<br />
1 January 2013 30.442.425<br />
Write off during <strong>the</strong> year -4.480.232<br />
Collected during <strong>the</strong> year -668.789<br />
Reserved during <strong>the</strong> year 3.520.886<br />
Closing balance 28.814.290<br />
T<strong>OT</strong>AL
Aging of trade receivables of <strong>the</strong> Company without interests receivables:<br />
30 Jun 2013<br />
Undue 65.130.691<br />
Up to 120 days 24.518.112<br />
120-360 days 7.000.806<br />
over 360 days 27.016.767<br />
123.666.376<br />
049. <strong>OT</strong>HER RECEIVABLES<br />
30 Jun 2013<br />
Interest receivables 1.268.858<br />
Advance payments receivables 5.062.238<br />
O<strong>the</strong>r receivables 63.812<br />
6.394.908<br />
Value adjustment -13.636<br />
6.381.272<br />
058. CASH IN BANK AND REGISTER<br />
30 Jun 2013<br />
Kuna accounts balance 29.975.787<br />
Foreign currency accounts balance 2.837.462<br />
Cash in register 5.194<br />
32.818.443<br />
059. PAID EXPENSES FOR FUTURE PERIOD AND UNDUE INCOME PAYMENT<br />
30 Jun 2013<br />
Differed customer related expenses 29.639.015<br />
Bond issuing expenses 638.997<br />
Prepaid expenses 16.343.746<br />
46.621.758<br />
063. SUBSCRIBED CAPITAL<br />
On 24 August 2007, <strong>the</strong> sole shareholder at that time Mr. Matija Martić paid up <strong>the</strong> amount of HRK 20 million in <strong>the</strong> Company's share capital. In<br />
that way, <strong>the</strong> share capital of <strong>the</strong> Company has been increased from HRK 201 thousand to HRK 20.201 thousand. The Company has undergone<br />
trans<strong>for</strong>mation from limited liability company to joint stock company. The total number of shares amounted to 2.020.070 of ordinary shares with<br />
nominal value of HRK 10 each. The sole shareholder remained Matija Martić.<br />
In December 2007, <strong>the</strong> Company increased <strong>the</strong> share capital through initial public offering. The Company issued 800.000 shares with nominal<br />
value of HRK 10 each. In this way, <strong>the</strong> total number of shares has been increased to 2.820.070. By subscribing <strong>the</strong> new shares, <strong>the</strong> Company<br />
realized capital gain of HRK 194.354 thousand representing <strong>the</strong> difference between <strong>the</strong> nominal value and <strong>the</strong> price determined on <strong>the</strong> initial public<br />
offering.<br />
At 30 Jun 2013, loss per share is as follows:<br />
Net result - loss 26.840.314<br />
Number of shares 2.820.070<br />
Loss per share 9,52<br />
In <strong>the</strong> same period last year, loss per share amounted to HRK 5,93<br />
Price of shares realized on <strong>the</strong> stock exchange within <strong>the</strong> current quarter (1 Jan - 30 Jun 2013) varied from HRK 6,55 (<strong>the</strong> lowest price) to HRK<br />
8,81 (<strong>the</strong> highest price). Market capitalization in thousands of HRK on 30 Jun 2013 amounted to HRK 23.576 thousand.<br />
In <strong>the</strong> period from January to June 2013 <strong>the</strong> Company did not buy-out <strong>the</strong> issued shares i.e. it does not hold treasury shares.<br />
Structure of 10 major shareholders as on 30 Jun 2013:<br />
Shareholders<br />
u 000 HRK<br />
%<br />
MARTIĆ MATIJA 18.596<br />
65,94<br />
ZAGREBAČKA BANKA D.D./ZBIRNI SKRBNIČKI RAČUN ZA UNICREDIT<br />
18.596<br />
65,94<br />
BANK AUSTRIA AG<br />
ZAGREBAČKA BANKA D.D./ZBIRNI SKRBNIČKI RAČUN ZAGREBAČKA<br />
1.605 5,69<br />
BANKA D.D./DF<br />
SOCIETE GENERALE-SPLITSKA BANKA D.D./ AZ OBVEZNI MIROVINSKI<br />
1.385 4,91<br />
FOND (1/1)<br />
766 2,72<br />
KONEČNY ZORAN (1/1)<br />
481<br />
1,71<br />
ZAGREBAČKA BANKA D.D. (1/1)<br />
428 1,52<br />
ŽUVANIĆ ROLAND (1/1)<br />
303<br />
1,07<br />
ČERNOŠEK KRUNOSLAV (1/1)<br />
207<br />
0,73<br />
JOVIČIĆ GORAN (1/1)<br />
202<br />
0,72<br />
HRVATSKA POŠTANSKA BANKA D.D./ZBIRNI RAČUN ZA KLIJENTE<br />
164<br />
0,58<br />
5.541<br />
19,65<br />
SMALL SHAREHOLDERS<br />
4.064 14,41<br />
28.201<br />
100,00
083. LONG-TERM LIABILITIES<br />
30 Jun 2013<br />
Loan based liabilities 13.922.556<br />
Liabilities <strong>for</strong> taxes 1.214.165<br />
15.136.721<br />
093. SHORT-TERM LIABILITIES<br />
30 Jun 2013<br />
Loan based liabilities 2.902.951<br />
Liabilities towards credit institutions 534.130.416<br />
Interest liabilities 69.081.527<br />
Liabilities <strong>for</strong> bonds issued 281.550.625<br />
Trade payables 227.757.365<br />
Liabilities towards employees 2.602.523<br />
Taxes, contributions and o<strong>the</strong>r levies 13.223.274<br />
O<strong>the</strong>r liabilities 176.701<br />
1.131.425.382<br />
098. LIABILITES TOWARDS SUPPLIERS<br />
30 Jun 2013<br />
Domestic trade payables 217.912.651<br />
Foreign trade payables 9.844.714<br />
227.757.365<br />
099. BONDS ISSUED<br />
On 5 February 2007, <strong>the</strong> Company issued bonds (OPTE-O-124A) with nominal value of HRK 250 million. The bonds have been issued on Zagreb<br />
Stock Exchange with interest rate of 9,125% and maturity date on 1 February 2014. The bonds have been issued with <strong>the</strong> price of 99,496%. The<br />
interest rate due on 01 Feb 2013 is not paid.<br />
30 Jun 2013<br />
Nominal value 250.000.000<br />
Compensations <strong>for</strong> issuance of bonds -730.625<br />
Liabilities based on calculated<br />
interest<br />
32.281.250<br />
281.550.625<br />
102. LIABILITIES FOR TAXES, CONTRIBUTIONS AND SIMILAR LEVIES<br />
30 Jun 2013<br />
VAT Liabilities 10.650.190<br />
Taxes and contributions on and from<br />
1.882.111<br />
salaries<br />
O<strong>the</strong>r taxes and contributions 690.973<br />
13.223.274<br />
106. DEFERRED PAYMENTS AND FUTURE INCOME<br />
30 Jun 2013<br />
Domestic payables <strong>for</strong> which invoices<br />
have not been received<br />
10.533.325<br />
Foreign payables <strong>for</strong> which invoices<br />
have not been received<br />
4.679.240<br />
Accrued interests 16.103<br />
Deferred income 13.010.410<br />
Deferred income due to uncertainty 3.278.478<br />
31.517.556<br />
3. FINANCIAL INSTRUMENTS<br />
During <strong>the</strong> reporting period, <strong>the</strong> Company used most of its financial instruments to finance its operations. Financial instruments include loans, bills<br />
of exchange, cash and liquid assets and o<strong>the</strong>r various instruments, such as trade receivables and trade payables arising directly from ordinary<br />
business activities.<br />
Currency Risk <strong>Management</strong><br />
Currency risk may be defined as risk of fluctuation of value of financial instruments due to changes in <strong>the</strong> exchange rates. The Company's major<br />
exposure relates to long-term borrowings denominated in a <strong>for</strong>eign currency and converted to Croatian Kunas at <strong>the</strong> exchange rate applicable on<br />
<strong>the</strong> balance sheet date. Gains and losses resulting from conversion are credited and charged to <strong>the</strong> income statement, but do not affect <strong>the</strong> cash<br />
flow.
The carrying amounts of <strong>the</strong> Company's <strong>for</strong>eign currency denominated monetary assets and monetary liabilities at <strong>the</strong> reporting date are given in<br />
<strong>the</strong> following table.<br />
Liabilities<br />
Assets<br />
30 Jun 2013 30 Jun 2012 30 Jun 2013 30 Jun 2012<br />
in 000 HRK in 000 HRK in 000 HRK in 000 HRK<br />
EUR 611.238 601.273 27.093 27.786<br />
USD 1.334 2.782 0 22<br />
CHF<br />
GPB<br />
612.572 604.055 27.093 27.808<br />
Foreign currency sensitivity analysis<br />
The Company is mainly exposed to <strong>the</strong> fluctuations in <strong>the</strong> exchange rate of Croatian Kuna to Euro and US Dollar.<br />
The following table details <strong>the</strong> Company's sensitivity to a 10% decrease of Croatian Kuna exchange rate in 2013 against <strong>the</strong> relevant <strong>for</strong>eign<br />
currency. The sensitivity analysis includes only outstanding <strong>for</strong>eign currency denominated monetary items and adjusts <strong>the</strong>ir conversion at <strong>the</strong> end<br />
of <strong>the</strong> period on <strong>the</strong> basis of percent change in <strong>for</strong>eign currency rates. The sensitivity analysis includes monetary assets and monetary liabilities in<br />
<strong>for</strong>eign currencies. A negative number below indicates decrease in profit and o<strong>the</strong>r equity where Croatian Kunas changes <strong>for</strong> above-mentioned<br />
percentage against <strong>the</strong> relevant currency. For a reverse proportional change of Croatian Kuna against <strong>the</strong> relevant currency, <strong>the</strong>re would be an<br />
equal and opposite impact on <strong>the</strong> profit and o<strong>the</strong>r equity.<br />
Liabilities<br />
Assets<br />
30 Jun 2013 30 Jun 2012 30 Jun 2013 30 Jun 2012<br />
in 000 HRK in 000 HRK in 000 HRK in 000 HRK<br />
EUR 61.124 60.127 2.709 2.779<br />
USD 133 278 0 2<br />
CHF<br />
GPB<br />
61.257 60.406 2.709 2.781<br />
Exposure to <strong>the</strong> currency exchange <strong>for</strong> 10% mainly relates to received loans, trade payables and receivables from affiliated companies indicated in<br />
Euros (EURO) and US Dollars (USD).<br />
Interest Rate Risk<br />
Liabilities arising from credits and loans with variable interest rates amount to HRK 333,92 million, and <strong>the</strong>re<strong>for</strong>e, <strong>the</strong> Company's exposure to <strong>the</strong><br />
interest rate risk is significant.<br />
O<strong>the</strong>r assets and liabilities, including bonds issued, are not exposed to to interest rate risk.<br />
Credit Risk<br />
Credit risk is <strong>the</strong> risk that <strong>the</strong> Company's customers will default on <strong>the</strong>ir contractual obligations causing possible financial loss to <strong>the</strong> Company. The<br />
Company has adopted procedures which are applied in dealing with customers and it requests and collects payment security instruments, where<br />
appropriate, in order to mitigate possible financial risks and losses resulting from a default in payment and fulfilment of contractual obligations.<br />
Trade receivables are monitored continuously in order to determine <strong>the</strong>ir risk level and apply <strong>the</strong> appropriate procedures. Customers' credit ratings<br />
are also monitored on a continuous basis in order to establish <strong>the</strong> Company's credit exposure, which is reviewed at least once a year.<br />
The Company operates with a large number of customers from various industries and of various sizes as well as with individuals who have a<br />
specific credit risk. The Company has developed procedures <strong>for</strong> each particular group of customers in order to ensure that <strong>the</strong> credit risk is<br />
addressed in <strong>the</strong> most appropriate way.
Liquidity Risk <strong>Management</strong><br />
The ultimate responsibility <strong>for</strong> liquidity risk management rests with <strong>the</strong> <strong>Management</strong> Board which is in charge of setting up <strong>the</strong> appropriate<br />
framework <strong>for</strong> liquidity risk management, all with <strong>the</strong> purpose of satisfying short-term, medium-term and long-term funding and liquidity<br />
management requirements. The Company manages liquidity risk by maintaining adequate reserves and credit lines, by continuous comparison of<br />
planned and realized cash flows and by matching <strong>the</strong> maturity profiles of financial assets and liabilities.<br />
Liquidity Risk and Interest Rate Risk Table Review<br />
The following tables detail maturity of <strong>the</strong> Company's contractual liabilities indicated in <strong>the</strong> balance sheet at <strong>the</strong> end of <strong>the</strong> reporting period.<br />
Tables have been created on <strong>the</strong> basis of undiscounted cash flows of financial liabilities on <strong>the</strong>ir due date. The tables include both interest and<br />
principal cash flows.<br />
in 000 HRK Up to one<br />
year<br />
From 1 to 5<br />
years<br />
Over 5<br />
years<br />
Total<br />
30 Jun 2013<br />
Non-interest bearing liabilities 230.537 230.537<br />
Interest bearing liabilities 615.996 283.906 1.686 901.588<br />
846.533 283.906 1.686 1.132.125<br />
30 Jun 2012<br />
Non-interest bearing liabilities 220.177 220.177<br />
Interest bearing liabilities 89.073 743.398 2.067 834.538<br />
309.250 743.398 2.067 1.054.715<br />
The majority of non-interest bearing liabilities of <strong>the</strong> Company maturing within one year account <strong>for</strong> trade payables in <strong>the</strong> amount of HRK 227.757<br />
thousand <strong>for</strong> <strong>the</strong> period from January to June 2013 (HRK 193.602 on 31 december 2012).<br />
Interest bearing liabilities include short-term and long-term borrowings, bonds issued and financial lease.<br />
The following tables detail maturity of <strong>the</strong> Company's financial assets indicated in <strong>the</strong> balance sheet at <strong>the</strong> end of <strong>the</strong> reporting period.<br />
Tables have been created on <strong>the</strong> basis of undiscounted cash flows of financial assets on <strong>the</strong>ir due date. The tables include both interest and<br />
principal cash flows.<br />
in 000 HRK Up to one<br />
year<br />
From 1 to 5<br />
years<br />
Over 5<br />
years<br />
Total<br />
30 Jun 2013<br />
Non-interest bearing liabilities 134.111 134.111<br />
Interest bearing liabilities 1.117 3.399 0 4.516<br />
135.228 3.399 0 138.627<br />
30 Jun 2012<br />
Non-interest bearing liabilities 100.793 100.793<br />
Interest bearing liabilities 34.077 11.645 5.071 50.793<br />
134.870 11.645 5.071 151.586<br />
The balance of cash and cash equivalents is indicated under non-interest bearing financial assets due to <strong>the</strong> low interest rate on <strong>the</strong>se assets.<br />
Matija Martić Jadranka Suručić