Full Text (PDF)
Full Text (PDF)
Full Text (PDF)

You also want an ePaper? Increase the reach of your titles
YUMPU automatically turns print PDFs into web optimized ePapers that Google loves.
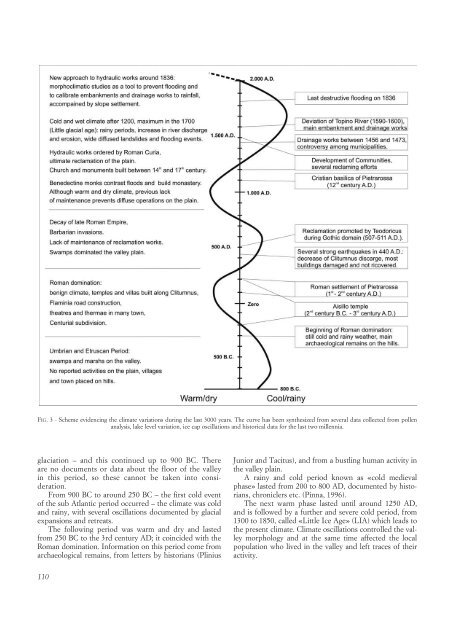
FIG. 3 - Scheme evidencing the climate variations during the last 3000 years. The curve has been synthesized from several data collected from pollen<br />
analysis, lake level variation, ice cap oscillations and historical data for the last two millennia.<br />
glaciation – and this continued up to 900 BC. There<br />
are no documents or data about the floor of the valley<br />
in this period, so these cannot be taken into consideration.<br />
From 900 BC to around 250 BC – the first cold event<br />
of the sub Atlantic period occurred – the climate was cold<br />
and rainy, with several oscillations documented by glacial<br />
expansions and retreats.<br />
The following period was warm and dry and lasted<br />
from 250 BC to the 3rd century AD; it coincided with the<br />
Roman domination. Information on this period come from<br />
archaeological remains, from letters by historians (Plinius<br />
110<br />
Junior and Tacitus), and from a bustling human activity in<br />
the valley plain.<br />
A rainy and cold period known as «cold medieval<br />
phase» lasted from 200 to 800 AD, documented by historians,<br />
chroniclers etc. (Pinna, 1996).<br />
The next warm phase lasted until around 1250 AD,<br />
and is followed by a further and severe cold period, from<br />
1300 to 1850, called «Little Ice Age» (LIA) which leads to<br />
the present climate. Climate oscillations controlled the valley<br />
morphology and at the same time affected the local<br />
population who lived in the valley and left traces of their<br />
activity.