Oil Spill Monitoring BACKGROUND PAPER - Australian Maritime ...
Oil Spill Monitoring BACKGROUND PAPER - Australian Maritime ...
Oil Spill Monitoring BACKGROUND PAPER - Australian Maritime ...

Create successful ePaper yourself
Turn your PDF publications into a flip-book with our unique Google optimized e-Paper software.
<strong>Oil</strong> <strong>Spill</strong> <strong>Monitoring</strong><br />
<strong>BACKGROUND</strong> <strong>PAPER</strong>
<strong>Oil</strong> <strong>Spill</strong> <strong>Monitoring</strong>: Background Paper<br />
Wardrop<br />
Consulting<br />
Acknowledgements<br />
This Handbook has been prepared by Wardrop Consulting (Australia) in association<br />
with the Cawthron Institute (New Zealand) at the request of the <strong>Australian</strong> <strong>Maritime</strong><br />
Safety Authority (AMSA) and New Zealand Marine Safety Authority (MSA). A number<br />
of people and Agencies have contributed to this work and are acknowledged below (in<br />
alphabetical order).<br />
Tracey Baxter, AMSA John Leeder, Leeder Consulting<br />
Trevor Gilbert, AMSA Leigh Stevens, Cawthron Institute<br />
Shayne Wilde, AMSA Julie Wall, NSW Waterways Authority<br />
Julian Roberts, MSA NZ John A. Wardrop, Wardrop Consulting<br />
National Library of Australia Cataloguing-in Publication Data: AMSA, 2003. Post <strong>Spill</strong> <strong>Monitoring</strong>:<br />
Background Paper. Prepared by Wardrop Consulting and the Cawthron Institute for the <strong>Australian</strong> <strong>Maritime</strong><br />
Safety Authority (AMSA) and the Marine Safety Authority of New Zealand (MSA). Published by AMSA,<br />
Canberra.<br />
ISBN: 0 642 70991 2<br />
Authors Note: This document should be read in association with the <strong>Oil</strong> <strong>Spill</strong> <strong>Monitoring</strong> Handbook.<br />
Copyright: This work is copyright. Apart from any fair dealing for the purpose of study, research criticism<br />
or review, as permitted under the Copyright Act this publication must not be reproduced in whole or in part<br />
without the written permission of the Copyright Holder. Unless other authorship is cited in the text or<br />
acknowledgements above, the copyright holder is the <strong>Australian</strong> <strong>Maritime</strong> Safety Authority (AMSA) and the<br />
Marine Safety Authority of New Zealand (MSA).<br />
Enquiries should be directed to: The Manager, Environment Protection Standards, <strong>Australian</strong> <strong>Maritime</strong><br />
Safety Authority, GPO Box 2181, Canberra City, ACT Australia 2601.<br />
Cover only updated (new AMSA and <strong>Maritime</strong> NZ logos) 2006.<br />
Cover photo by Jamie Storrie, Department of the Environment and Heritage.<br />
0
<strong>Oil</strong> <strong>Spill</strong> <strong>Monitoring</strong>: Background Paper<br />
TABLE OF CONTENTS<br />
TABLE OF CONTENTS………………………………………………………………………… 1<br />
1.0 THE PURPOSE OF THIS DOCUMENT……………………………………………… 2<br />
1.1 The Purpose of this Document…………………………………………………. 2<br />
1.2 Reasons for <strong>Monitoring</strong> <strong>Oil</strong> and Chemical <strong>Spill</strong>s and their Effects…… 2<br />
2.0 TYPES OF MONITORING.……………………………………………………………… 3<br />
2.1 The Need to Define Operational and Non Operational <strong>Monitoring</strong>……… 3<br />
2.2 Type I <strong>Monitoring</strong>…………………………………………………………… 4<br />
2.3 Type II <strong>Monitoring</strong>…………………………………………………………………. 4<br />
3.0 DEFINING A JUSTIFIABLE SPILL MONITORING PROGRAMME……………….… 5<br />
3.1 Type I <strong>Monitoring</strong>…………………………………….………………..…... 5<br />
3.1.1 Scope and Scale of Type I Studies…………………………… 5<br />
3.1.2 Funding and Cost Recovery……………………………………… 8<br />
3.2 Type II <strong>Monitoring</strong>…………………………………………………………………. 8<br />
3.2.1 Scope and Scale of Type II Studies………..………………… 8<br />
3.2.2 Funding and Cost Recovery…………………………………… 9<br />
4.0 MONITORING PROGRAMME DESIGN………………………………………………… 10<br />
4.1 Setting the Objectives of the Study………………………………………… 10<br />
4.1.1 Considerations when Setting Objectives ..……………..……… 10<br />
4.1.2 Responsibility for Setting Objectives …………………………… 11<br />
4.2 Determining the Scale of the Programme …………………………………… 11<br />
4.3 Setting the Spatial Boundaries of the Study………………………… 12<br />
4.4 Selecting <strong>Monitoring</strong> Sites……………………………………….…….. 12<br />
4.4.1 Stratification of Sites…………………………………………… 12<br />
4.4.2 Selection of Control Sites……………………………………… 12<br />
4.5 Defining the Level of Accuracy Required……………….……………… 12<br />
4.6 Selecting Suitable Parameters for Measurement………..………………… 13<br />
4.6.1 Initial Reconnaissance……………………………………… 13<br />
4.6.2 Sampling of the <strong>Oil</strong> ..…………………………………………… 14<br />
4.6.3 Sampling the Water Column…………………………………… 14<br />
4.6.4 Sampling Sediment and Associated Biota……………………… 15<br />
4.7 Determining the Method for Obtaining Data………………………… 16<br />
4.7.1 Selecting Sample Locations within a Site..……………… 16<br />
4.7.2 Quadrats and Transects……………………………….…… 17<br />
4.7.3 Data Types…….………………………………………………… 18<br />
4.8 Determining Sample Numbers and Sampling Schedule……………… 18<br />
4.9 Determining the Likely Duration of the Study………………………… 19<br />
4.10 Logistics………………………………………………………………………… 19<br />
4.11 Data Management………………………………………………………… 19<br />
5.0 SUMMARY………………………………………………………………..………………… 20<br />
6.0 REFERENCES…………………………………………………………………… 21<br />
ATTACHMENT A: RAPID REFERENCE FOR SPILL RESPONSE MONITORING<br />
REQUIREMENTS<br />
1<br />
27
<strong>Oil</strong> <strong>Spill</strong> <strong>Monitoring</strong>: Background Paper<br />
1.0 INTRODUCTION<br />
1.1 The Purpose of this Document<br />
The purpose of this Background Paper is to provide guidance about the nature,<br />
justifiable scope, and scale of post spill monitoring programmes. It focuses<br />
predominantly on post spill monitoring of oil spills, although the concepts presented<br />
are generally applicable to all types of marine spills.<br />
The Background Paper defines and discusses the rationale for classifying post spill<br />
monitoring into two general “types”: Operational (Type I) and Non-Operational or<br />
Scientific (Type II) monitoring. It explains the significance of these terms, addresses<br />
funding and cost recovery aspects, and describes the key design aspects that must<br />
be considered when establishing a monitoring programme.<br />
It directly supports the <strong>Oil</strong> <strong>Spill</strong> <strong>Monitoring</strong> Handbook (AMSA, 2003), which is<br />
designed to provide field guidance for the planning and execution of monitoring of oil<br />
spills for operational (response) purposes.<br />
1.2 Reasons for <strong>Monitoring</strong> <strong>Oil</strong> and Chemical <strong>Spill</strong>s, Response Actions and Effects<br />
<strong>Oil</strong> and chemical spills pose a threat to the environment, and the potential for<br />
damage, or the actual damage caused, is a major public concern. Indeed, the most<br />
often stated objective of spill response efforts is to protect the environment, or to<br />
minimise environmental damage. The term “environmental damage” includes shortterm<br />
and long-term effects on the natural, physical, economic and social environment<br />
(including risks to human health) that may be attributable to the spill or from<br />
subsequent spill response activities.<br />
To address the various concerns raised about the effects of a spill, and any<br />
associated cleanup response, some form of monitoring is usually required. <strong>Spill</strong><br />
monitoring has a very broad scope and includes all the procedures undertaken to<br />
obtain and process information relating to the behaviour and fate of a spill, its effects,<br />
and the effects of response activities.<br />
As the feedback provided by spill monitoring will directly influence the priorities,<br />
strategies and methods employed during a spill response, it is important that relevant,<br />
quantitative and accurate information is obtained and made available. For example,<br />
monitoring to ensure particular response activities are justifiable and/or effective need<br />
to show that:<br />
• Response efforts are directed at areas where the most oil/chemical has been<br />
spilled, and there is the greatest potential to recover spilt oil/chemical.<br />
• Protection and cleanup strategies are directed at the most sensitive areas or<br />
resources.<br />
• Cleanup strategies are effective and result in less damage than untreated oil or<br />
chemical.<br />
<strong>Monitoring</strong> may also be required for reasons not directly linked to the spill response.<br />
For example, the collection of information to calculate economic damages, to quantify<br />
environmental impact, to identify the source of the oil for prosecutions, or for purely<br />
scientific reasons.<br />
2
<strong>Oil</strong> <strong>Spill</strong> <strong>Monitoring</strong>: Background Paper<br />
2.0 TYPES OF MONITORING<br />
2.1 The Need to Define Operational and Non Operational <strong>Monitoring</strong><br />
Following an oil spill, both government and non-government agencies are likely to<br />
propose or implement the monitoring that they judge is necessary for the response<br />
and to gather relevant information about the spill. The monitoring scope and<br />
objectives will vary widely to reflect the roles and focus of the specific response and<br />
environmental agencies involved.<br />
The need to provide guidance about the type of monitoring required has been the<br />
subject of considerable discussion in the <strong>Australian</strong> National Plan Environment and<br />
Scientific Coordinator’s (ESC) Workshops (Storrie, 1996; Wardrop, 1997; Dutton,<br />
1998, 1990), and elsewhere (Mearns, 1995).<br />
Much of this discussion has been tied to issues of “who pays”. In particular, what<br />
monitoring is likely to be considered a legitimate response cost that can be recovered<br />
from responsible parties (the spiller and their insurers), or which can be funded<br />
directly by National contingency funds (AMSA or MSA) or by other agencies. The<br />
need to identify wider sources of funding for various types of post spill monitoring was<br />
also identified following the “Era” spill in South Australia in 1992 (Wardrop and<br />
Wagstaff, 1996). Since then the International <strong>Oil</strong> Pollution Compensation (IOPC)<br />
Fund 1992 Claims Manual has clarified the position of the international compensation<br />
funds (IOPC, 1992).<br />
One outcome of the ESC workshop discussions was the classification of post spill<br />
monitoring into two general “types”<br />
defined according to the primary<br />
objectives of the programme (Wardrop<br />
and Wagstaff, 1995):<br />
• Type I (Operational) <strong>Monitoring</strong>;<br />
which provides information of direct<br />
relevance to spill response<br />
operations, i.e information needed<br />
to plan or execute response or<br />
cleanup strategies. These<br />
programmes are an integral part of<br />
the response and as such are<br />
funded from the same sources as<br />
other components of the response.<br />
They are also subject to the same<br />
constraints (see Section 2.2).<br />
• Type II (Non-operational or<br />
Scientific) <strong>Monitoring</strong>; which<br />
relates to non-response objectives<br />
and includes short term<br />
environmental damage<br />
assessments, longer term damage<br />
assessments (including recovery),<br />
purely scientific studies, and all post<br />
spill monitoring activities. These<br />
programmes are usually not integral<br />
to the response, and funding is less<br />
well defined (see Section 2.3).<br />
3<br />
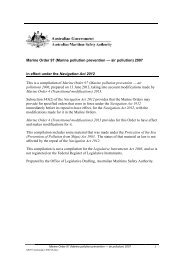
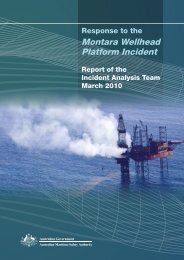
Figure 1 Subsurface Marine <strong>Monitoring</strong><br />
(Photo: Cawthron Institute)
<strong>Oil</strong> <strong>Spill</strong> <strong>Monitoring</strong>: Background Paper<br />
Operational (Type I) and Non-Operational or Scientific (Type II) monitoring have very<br />
different objectives which significantly influence the monitoring methods likely to be<br />
used, the degree of scientific rigour required to meet the monitoring objectives, and<br />
the scope of studies. These in turn, have a significant bearing on the cost of the<br />
monitoring, and who will pay for it. The monitoring type does not relate to any<br />
consideration of whether a programme is justifiable.<br />
The key difference between the two types of monitoring is the objective of the study,<br />
i.e. the reason it is undertaken. While both types of monitoring may be undertaken<br />
during a spill response, and both may be funded, the type of monitoring largely<br />
determines who has responsibility for determining the appropriate scale and design of<br />
the study, and who should pay the costs for the programme.<br />
2.2 Type I <strong>Monitoring</strong><br />
Type I (Operational) monitoring is generally characterised by:<br />
• Having well established methods.<br />
• Being relatively straightforward to implement.<br />
• Having a limited scope (area, time and scale).<br />
• Being relatively easy to define in terms of its scope and objectives e.g.<br />
determining;<br />
- spill type.<br />
- spill volume.<br />
- trajectory.<br />
- where equipment staging posts should be located.<br />
- distribution and amount of oil at sea or on shorelines, etc.<br />
Type I monitoring can include any physical, chemical and biological assessments<br />
which guide operational decisions (see Table 1).<br />
Environmental damage assessments can also be considered Type I programmes if<br />
they are directly focussed on operational needs. For example, assessing potential or<br />
actual biological effects of spilt oil and various response methods in order to select<br />
appropriate response and mitigation methods or to determine when to terminate a<br />
response activity. Initially, such biological assessments usually combine existing<br />
data, local knowledge, and limited field assessment to quickly provide information to<br />
the response decision makers.<br />
The design of a Type I monitoring programme requires judgements to be made about<br />
scope, methods, data inputs and outputs that are specific to the incident response.<br />
These judgements must balance the operational needs of the response with the<br />
logistical and time constraints of gathering and processing information, and the level<br />
of certainty needed.<br />
Usually, there is a need for information to be collected and processed rapidly to suit<br />
response needs, with a lower level of sampling and accuracy needed than for<br />
scientific purposes. As a consequence, the scale of monitoring for Type I purposes is<br />
often quite different to that undertaken for Type II purposes.<br />
2.3 Type II <strong>Monitoring</strong><br />
Type II (Non-Operational or Scientific) monitoring includes any monitoring that is<br />
undertaken for purposes other than providing information to guide a spill response. It<br />
almost always requires expert design and execution by trained individuals.<br />
4
<strong>Oil</strong> <strong>Spill</strong> <strong>Monitoring</strong>: Background Paper<br />
Type II monitoring will often extend<br />
well beyond the termination of<br />
response operations and generally<br />
has objectives relating to attributing<br />
cause-effects to the spill or to the<br />
associated response. This may be<br />
required for legal (prosecutions) or<br />
purely scientific reasons.<br />
Consequently, such studies are<br />
required to account for natural or<br />
sampling variation, and study designs<br />
must be robust and produce<br />
defensible data.<br />
Examples of Type II monitoring<br />
include studies to help future<br />
operational decision-making e.g.<br />
comparison of the long-term effects of<br />
different response options, rates of<br />
biological recovery over time following<br />
a spill, or assess changes in<br />
community or population structure<br />
caused by a spill. However, there are<br />
a very large number of possible<br />
studies that could be, and have been,<br />
undertaken (Table 1, Table 2 and<br />
Section 6.2).<br />
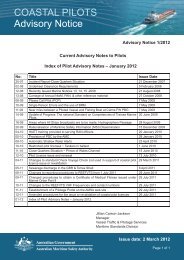
Figure 2 Plankton Sampling<br />
(Photo: Cawthron Inst.)<br />
3.0 DEFINING A JUSTIFIABLE SPILL MONITORING PROGRAMME<br />
3.1 Type I <strong>Monitoring</strong><br />
3.1.1 Scope and Scale of Type I Studies<br />
Establishing a rigid suite of Type I monitoring objectives, activities and methods that is<br />
of an “acceptable” scope and scale is difficult because monitoring needs will vary<br />
between spills according to a large number of factors. These include the size of the<br />
spill, the nature of the product spilled, the character of the environment into which it is<br />
released, the resources at risk, spill response needs, as well as prevailing legislation,<br />
insurers, political factors, etc.<br />
Nevertheless, there are a range of Type I monitoring methods suited to obtaining<br />
information to meet operational objectives. Guidelines describing common Type I<br />
monitoring methods have been prepared and are included in the <strong>Oil</strong> <strong>Spill</strong> <strong>Monitoring</strong><br />
Handbook (AMSA, 2003).<br />
However, even with a defined method, a judgment must still be made about whether<br />
monitoring is “necessary”, and whether the scope of the monitoring is “reasonable”, to<br />
reach appropriate spill response decisions in an appropriate time frame, and with an<br />
acceptable level of accuracy. This is a judgment that must reflect the circumstances<br />
of the spill, so hard and fast rules are inappropriate. Guidelines are provided in<br />
Attachment A.<br />
5
<strong>Oil</strong> <strong>Spill</strong> <strong>Monitoring</strong>: Background Paper<br />
Table 1 Historical Examples of Type I and Type II <strong>Monitoring</strong> in Australia<br />
Incident, Date and<br />
Type I Type II<br />
Location Programme Comment or Reference Programme Comment or Reference<br />
Port Adelaide River<br />
None recorded -<br />
<strong>Monitoring</strong> of mangrove Small scale 2-year study<br />
1985<br />
defoliation, mortality, recovery funded by the (then) S.A Dept.<br />
South Australia<br />
<strong>Monitoring</strong> of oil retention and of Environment and Planning<br />
degradation in sediments Unpublished SA DEP Report.<br />
“Sanko Harvest” <strong>Monitoring</strong> of Seals and Very detailed physiological<br />
Effect of fertilizer on marine Report commissioned by WA<br />
1991<br />
Sea Lions during cleaning monitoring of cleaned Seals and environment including nutrient EPA.<br />
Esperance,<br />
Sea Lions.<br />
levels<br />
Ref: WA State Committee<br />
Western Australia<br />
Ref: Gales, N. 1991.<br />
report to the Min. Transport<br />
DMH No: DMH P4/91<br />
“Kirki”<br />
Aerial surveillance of slick Ref: Aust. Govt. Dept Transport<br />
1991<br />
and Communications, 1992.<br />
Western Australia Weather and sea state See Attachment 1 to the above.<br />
“Era”<br />
Survey and assessment of Limited scope study to determine Fate of oil in sediments 5 year study.<br />
1992<br />
oil distribution whether cleanup was needed (i.e. Effects of oil on mangroves. Ref: Wardrop et. al., 1997<br />
South Australia Assessment of mangrove whether there was likely to be any Effects of oil on seagrasses Ref: Connolly, 1994<br />
damage<br />
environmental benefit) or feasible. Effects of oil on fish Ref: Bellette et. al., 1994<br />
“Iron Baron” Aerial surveillance of slick<br />
1995<br />
<strong>Monitoring</strong> of shoreline Programme extended throughout A number of studies of the Extensive monitoring<br />
Tasmania oiling (Aerial and ground the 6 month response.<br />
effects of oil and cleanup on, programme over 1-2 years.<br />
survey)<br />
and recovery of, various types Funded by the spiller.<br />
of biological community. Ref: Govt. Tasmania, 1997<br />
<strong>Oil</strong> characterisation Samples routinely collected. Some<br />
tested.<br />
Fate of oil in sediments<br />
Port Stanvac <strong>Spill</strong> <strong>Monitoring</strong> of dispersant Ref: AMSA, 2000a<br />
1999<br />
South Australia<br />
effectiveness<br />
“Laura D’Amato” Aerial surveillance of slick Ref: AMSA 2000b<br />
1999<br />
Air and ground monitoring<br />
Sydney, N.S.W. of shoreline oiling<br />
6
<strong>Oil</strong> <strong>Spill</strong> <strong>Monitoring</strong>: Background Paper<br />
Table 2 Historical Examples of Type I and Type II <strong>Monitoring</strong> in New Zealand<br />
Incident, Date and<br />
Type I Type II<br />
Location Programme Comment or Reference Programme Comment or Reference<br />
“Dong Won 529”<br />
1998<br />
Aerial surveillance of slick<br />
_<br />
_<br />
_<br />
Stewart Island Air and ground monitoring Predominantly aerial response due<br />
of shoreline oiling<br />
to exposed and remote location<br />
Wildlife assessment Identification of resources at risk<br />
“Sea Fresh 1” Air and ground monitoring<br />
_ Biosecurity assessment and Funded by Ministry of Fisheries<br />
2000<br />
of shoreline oiling (diesel)<br />
eradication of invasive exotic & Department of Conservation<br />
Chatham Island<br />
seaweed on vessel hull.<br />
“Jody F. Millennium” Aerial surveillance of slick Daily overflights during response<br />
_<br />
_<br />
2002<br />
and following dispersant use<br />
Gisborne Ground monitoring of<br />
shoreline oiling<br />
SCAT based approach<br />
Intertidal biological survey Very limited scope targeting<br />
Subtidal video and SCUBA recreational seafood<br />
survey<br />
Tissue analysis results used to lift<br />
harvesting ban<br />
“Tai Ping” Aerial surveillance No oil spilt<br />
_<br />
_<br />
2002<br />
Bluff<br />
Shoreline assessment Shoreline segmentation and<br />
response planning<br />
Wildlife assessment Identification of resources at risk<br />
Trajectory modelling Dye release to verify trajectory<br />
model<br />
“Taharoa Express” Air and ground monitoring No oil spilt<br />
_<br />
_<br />
2003<br />
of shoreline oiling<br />
Northland Assessment of dispersant<br />
effectiveness<br />
Lab test of dispersant efficacy<br />
“San Domenico” Air and ground monitoring Observation of sheens in relation to<br />
_<br />
_<br />
2003<br />
Wellington<br />
of shoreline oiling (diesel) identified resources<br />
7
<strong>Oil</strong> <strong>Spill</strong> <strong>Monitoring</strong>: Background Paper<br />
Two useful “rule of thumb” guidelines are:<br />
• <strong>Monitoring</strong> is probably necessary if monitoring data has a high probability of<br />
contributing to the response decisions and if the consequences of this influence<br />
on response decisions is likely to be significant.<br />
• <strong>Monitoring</strong> scope and scale is probably reasonable if the cost and commitment of<br />
labour is within what would be expended by a response or other agency if costs<br />
were to be born by that agency.<br />
3.1.2 Funding and Cost Recovery<br />
Currently, Type I monitoring costs may be reimbursed by AMSA and the MSA under<br />
the respective National Contingency Planning frameworks, alongside other<br />
operational costs of a response. They are later recovered from the spiller’s insurers;<br />
if the spiller is identified.<br />
Like all other operational aspects of the response, Type I monitoring programmes<br />
must be “reasonable” in their scope, design and subsequent costs if these are to be<br />
paid without challenge. A good overview of the need for reasonable and cost<br />
effective response operations is provided by Gregory et al., 2002.<br />
3.2 Type II <strong>Monitoring</strong><br />
3.2.1 Scope and Scale of Type II Studies<br />
Compared to Type I studies, the objectives and scope of potential Type II studies<br />
encompass a far greater variation, depending on the purpose of the acquired data<br />
(e.g. scientific study, legal use, etc). Examples are provided in Section 6.3.<br />
Consequently, considerations of what<br />
constitutes “reasonable” Type II<br />
monitoring is subject to greater debate.<br />
Some authors advocate continuous<br />
monitoring in areas where spills may<br />
occur (e.g. Batten et al., 1998, Dobroski<br />
et al., 1990), although this may be<br />
difficult to justify on the basis of spill risk<br />
purposes.<br />
Others have highlighted the importance<br />
of understanding pre-spill conditions in<br />
determining possible spill effects (e.g.<br />
Cowell and Monk, 1979; Page et al.,<br />
1996; Pearson et al., 1999; Wooley,<br />
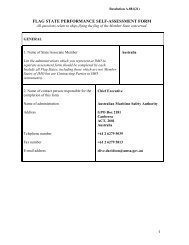
Figure 3 Marine <strong>Monitoring</strong><br />
(Photo: Cawthron Institute)<br />
2002), or have emphasised the need for multi-year sampling (Gilfillan and Page,<br />
2003) and suggested that some long-term post spill monitoring can be of limited value<br />
due to confounding from other sources (e.g. Boehm et al., 2003).<br />
Therefore, defining what is a “reasonable” scope and scale is vital, and relies, like all<br />
good monitoring programmes, on having a good design, clearly defined objectives<br />
and outputs, and appropriate resources. The discussion in Section 4 provides<br />
guidelines for the design of both Type I and Type II monitoring programmes.<br />
8
<strong>Oil</strong> <strong>Spill</strong> <strong>Monitoring</strong>: Background Paper<br />
3.2.2 Funding and Cost Recovery<br />
Type II monitoring costs are not currently reimbursed by AMSA or the MSA, and in<br />
some past cases have not been funded from the vessel’s insurer, the Protection and<br />
Indemnity Clubs (refer to Table 1).<br />
New Zealand and Australia do not have legislation that requires ecological (i.e. noneconomic)<br />
damages to be assessed, and there are no statutory provisions for<br />
claiming compensation for environmental damages. Therefore, any environmental<br />
effects monitoring must be funded by the responsible Government agencies or<br />
voluntarily by industry or academic organisations.<br />
Costs of monitoring undertaken for prosecution purposes may be recoverable through<br />
the legal process but interim costs must be borne by the responsible Government<br />
agency. In some cases, the spiller may also independently commission monitoring<br />
programmes or agree to fund them.<br />
To date, there has not been an adversarial approach to monitoring programmes in<br />
Australia or New Zealand, with a generally high level of co-operation between spillers<br />
response agencies and monitoring agencies. This may change in response to the<br />
increasing adoption of legislation which set fines for spills according to the level of<br />
environmental damage.<br />
In some other parts of the world, post spill ecological damage assessments are<br />
required by legislation. For example, the United States’ <strong>Oil</strong> Pollution Act (OPA, 1990),<br />
specifies a requirement for “Natural Resource Damage Assessment” (NRDA) (e.g.<br />
Ofiara 2002), and also the methodologies to be used (French et al. 1996, Huguenin et<br />
al. 1996, Reinharz and Burlington 1996, Reinharz and Michel 1996). NRDA costs are<br />
recoverable from the spiller, and outputs are used to define levels of environmental<br />
damage so that compensation can be sought.<br />
Because of the high financial costs associated with undertaking NRDA studies, and in<br />
the subsequent compensation they may require, a high level of defensibility is needed<br />
for data used to quantify spill effects. For large spill incidents, conflicting damage<br />
assessments may be presented to court by the spiller or their insurers. The Exxon<br />
Valdez is a classic example of this (e.g. Holloway 1996).<br />
Other nations have adopted a less proscriptive approach. The Russian Federation,<br />
for example, requires that post spill monitoring, including damage assessments, are<br />
undertaken but does not define the required scope or detailed objectives. These<br />
must be negotiated and approved on a case by case basis. Costs are met by the<br />
spiller.<br />
Korea has produced a manual for fisheries and aquaculture compensation claims<br />
under the International <strong>Oil</strong> Pollution Compensation Funds (IOPC) which describes the<br />
scientific information needed to prove environmental damage (e.g. Lee, 2002).<br />
However, the funding of such investigations are constrained by the same aspects<br />
discussed previously and requires studies to be reasonable in their scope and scale.<br />
These international examples of monitoring, particularly NRDA monitoring in the U.S.,<br />
are widely reported in the literature, and paint a picture of monitoring that is of only<br />
limited relevance due to the absence of legislation requiring such monitoring in New<br />
Zealand and Australia.<br />
9
<strong>Oil</strong> <strong>Spill</strong> <strong>Monitoring</strong>: Background Paper<br />
4.0 MONITORING PROGRAMME DESIGN<br />
For any monitoring programme, whether Type I or Type II, to be both “appropriate”<br />
and “reasonable” it is vital to have clearly identified objectives, good design, specified<br />
outcomes, and defined methods of data acquisition, transfer and assessment. If<br />
these are not in place before the programme is implemented, monitoring is unlikely to:<br />
• Provide satisfactory answers.<br />
• Be cost-effective, or<br />
• Meet responder or stakeholder expectations.<br />
Examples of the importance of good design in relation to oil spill response are<br />
provided by Gilfillan et al., 1996, Green and Montagna, 1996, Paine et al., 1996, and<br />
Peterson el al., 2001. A number of other texts provide a comprehensive overview of<br />
study design issues, e.g. AS/NZS, 1998; ANZECC, 2000; Baker and Wolff, 1987;<br />
Cooper and Rees, 2002; Davis et al., 1980;ISO, 1991; Kingsford and Battershill,<br />
1998, PSEP, 1997; USEPA, 2001 (see Section 6.4).<br />
The most comprehensive documents available on oil spill monitoring methods is the<br />
Guidelines for the Scientific Study of <strong>Oil</strong> <strong>Spill</strong> Effects (Petroleum Environmental<br />
Research Forum Project 94-10, 1999) described by Robertson, 2001, with a range of<br />
ASTM standard guides also available (e.g. ASTM 1986, 1997).<br />
4.1 Setting the Objectives of the Study<br />
Setting objectives is the first step in defining what a monitoring programme needs to<br />
deliver. In its simplest form it is a statement of what the monitoring programme seeks<br />
to measure (e.g. descriptive; measurement of change; determination of cause and<br />
effect), and defines the parameters to include in monitoring.<br />
4.1.1 Considerations when Setting Objectives<br />
When setting objectives it is important to understand how monitoring information will<br />
be used in the decision making process. If the available resources are insufficient to<br />
meet the set objectives of the monitoring programme, the programme is not worth<br />
undertaking. Some key aspects to consider when setting objectives are:<br />
• What specific question(s) needs to be answered?<br />
• Have knowledge gaps been identified and addressed?<br />
• Have the limitations of not having information been evaluated?<br />
• Will the information gathered address major stakeholders’ needs?<br />
• How will the information be managed and communicated?<br />
• Do specific objectives:<br />
- Clearly and concisely communicate the purpose of monitoring?<br />
- Specify what the monitoring will achieve?<br />
- Indicate when the monitoring is complete?<br />
It is also essential that objectives are achievable. For example coastal and estuarine<br />
systems are highly complex and natural ecological variation is almost always high.<br />
Detecting oil-water or oil-sediment interactions, establishing cause and effect links to<br />
a spill or response, or assessing longer-term effects (e.g. recovery) may be difficult.<br />
There is little value in commencing a study that is unlikely to unequivocally show<br />
impacts that are of environmental relevance and can be related to a particular spill<br />
event.<br />
10
<strong>Oil</strong> <strong>Spill</strong> <strong>Monitoring</strong>: Background Paper<br />
4.1.2 Responsibility for Setting Objectives<br />
For Type I monitoring programmes, primary objectives will generally be determined by<br />
the Incident Controller or other nominated person within the Incident Management<br />
Team (IMT). Responsibility for designing or developing a monitoring programme<br />
should be clearly assigned within the IMT. The monitoring team(s) will then be tasked<br />
with collecting the information needed to meet the set objectives.<br />
For Type II studies, responsibility for commissioning monitoring should be the relevant<br />
Government Agency, Statutory Authority, the spiller or an academic institution (for<br />
purely scientific studies) depending on programme objectives. Responsibilities will<br />
vary and guidelines for commissioning and, if required, approving Type II monitoring<br />
programmes should be documented in relevant State/NT or National Plans.<br />
4.2 Determining the Scale of the Programme<br />
While it may be stating the obvious, it is important that monitoring reflects the scale<br />
and potential effects of the spill, and addresses key environment issues relevant to<br />
the spill. A number of factors must be taken into account when defining monitoring<br />
requirements, but primarily:<br />
• The characteristics of the oil or chemical;<br />
• The type of discharge (single or continuous release);<br />
• Dispersion and dilution rates; and<br />
• The characteristics of the receiving environment.<br />
The appropriate scale for a programme will be determined largely by the specific<br />
objectives of the programme. Where variability is high, the time and resources<br />
required to reliably detect an impact may require a large monitoring effort. The need<br />
for such effort must then consider whether the objective of the study is of sufficient<br />
importance to justify the monitoring needed, i.e. the time and resources required may<br />
be considered “unreasonable” unless the<br />
objective of the study is of high importance.<br />
A very wide range of different approaches<br />
can be taken when trying to detect<br />
environmental impacts (see Section 6.4).<br />
The most common design is to compare<br />
one or more oiled sites to unoiled (“control”)<br />
sites. Sometimes it is possible to compare<br />
post-impact conditions on a site with preimpact<br />
(“background”) conditions provided<br />
by baseline data collected before a spill,<br />
but this is usually not available.<br />
In either case, variation in some<br />
parameters makes it difficult to establish a<br />
cause-effect relationship between the oil<br />
and the change. Variation may naturally<br />
occur between sites (spatial variation) or<br />
Figure 4 Buried Layers of <strong>Oil</strong><br />
(Photo: Wardrop Consulting)<br />
may occur over time (temporal variation). The latter may be seasonal or related to<br />
shorter-term factors such as weather sea state or tidal conditions.<br />
11
<strong>Oil</strong> <strong>Spill</strong> <strong>Monitoring</strong>: Background Paper<br />
4.3 Setting the Spatial Boundaries of the Study<br />
The spatial boundaries of a monitoring study will depend primarily on the actual or<br />
potential area affected by the spill. Spatial boundaries should be sufficient to meet<br />
monitoring objectives; usually determining impacted areas and the level of effects,<br />
linking effects to the spill source, and supporting decisions on cleanup strategies.<br />
The boundaries should also be sufficient to cover representative areas of each:<br />
• Type of substrate.<br />
• Ecological community.<br />
• Shoreline energy level.<br />
• Degree of oiling.<br />
• Cleanup method employed.<br />
4.4 Selecting <strong>Monitoring</strong> Sites<br />
When attempting to detect impacts or compare areas it is important to account for<br />
pre-existing influences on the environment.<br />
4.4.1 Stratification of Sites<br />
Wherever possible monitoring sites should be selected on the basis of one or more<br />
defined “strata” such as substrate type (cobble beaches, rock platforms), tidal<br />
elevation, or areas of biological importance (e.g. seagrass beds). This “stratification “<br />
minimises non-spill related variance and allows sites to be directly compared where<br />
the key difference is the impact of the spill or cleanup method used, not pre-existing<br />
differences like tidal elevation.<br />
4.4.2 Selection of Control Sites<br />
When comparing impacted sites to unimpacted sites, the unimpacted sites should be<br />
as similar as possible to impacted sites, should be representative of wider areas, and<br />
be free from obvious sources of confounding influences unrelated to the spill. In<br />
particular, key physical factors (i.e., temperature, salinity, currents, aspect, habitat<br />
type, shore profile, substrate) should not differ significantly between sites. Multiple<br />
sites are usually required to account for natural variability between control and impact<br />
sites.<br />
Control sites can also include areas that have been impacted by the spill and are left<br />
to recover naturally. These sites are used to assess the effects of cleanup options,<br />
and/or natural recovery. It is often difficult to convince people that leaving impacted<br />
sites uncleaned is an appropriate thing to do.<br />
4.5 Defining the Level of Accuracy Required<br />
As noted in Section 4.2, natural variation of parameters can make it difficult to obtain<br />
data that clearly show changes attributable to a spill. Generally, detection of small<br />
changes will require more sampling and replication than detection of gross changes.<br />
However, other constraints may limit the scale of the monitoring programme.<br />
The required level of accuracy will depend entirely on the objective of each monitoring<br />
study and the end-use of the data.<br />
12
<strong>Oil</strong> <strong>Spill</strong> <strong>Monitoring</strong>: Background Paper<br />
Some guidelines are provided in the <strong>Oil</strong> <strong>Spill</strong> <strong>Monitoring</strong> Handbook about what is<br />
appropriate (AMSA, 2003). For example, a few samples may be sufficient to guide<br />
response decisions in ranking oiled areas for cleanup priorities, however, data for<br />
damages assessment or legal use will require a high level of accuracy and<br />
consequently this may require a large number of samples.<br />
Even in the case cited above, there may be no clear consensus on this as it could be<br />
argued that cleanup priority in some cases may be vital in minimising environmental<br />
damage and that some precision is required. This of course would have to be<br />
assessed in consideration of the time that may be required to obtain precise data.<br />
Again, compromise is required and it is worth remembering that these monitoring<br />
programmes are usually designed and executed during an emergency situation where<br />
time and resources are likely to be limited. This is particularly true in the design of<br />
Type I monitoring programmes.<br />
4.6 Selecting Suitable Parameters for Measurement<br />
Key components to consider when deciding what parameters to include in monitoring<br />
include:<br />
• Are human, equipment and other required resources available?<br />
• Are selected parameters able to detect changes/ trends?<br />
• Can parameters be measured in a reliable, reproducible and cost-effective way?<br />
• Are parameters appropriate for the time and spatial scales of the study?<br />
• Are appropriate field techniques available?<br />
4.6.1 Initial Reconnaissance<br />
For any spill, it will nearly always be necessary to collect basic information on the type<br />
and volume of the spill, and its trajectory. This information can assist in identifying<br />
key design elements of a monitoring programme and areas where further information<br />
is required. Without knowledge about where a spill is likely to end up, it is difficult to<br />
select monitoring sites or sampling and analysis methods.<br />
In most spill situations, information on the spill trajectory can be assessed by direct<br />
spill tracking (e.g. visual observations, remote sensing), or estimated using wind and<br />
current data (manual or computer calculations) e.g:<br />
• Aerial Surveillance provides a reliable and rapid method for defining the overall<br />
extent of a spill area, and identifying oiled shorelines and those at threat from the<br />
spill. Photos, video, mapping and verbal feedback all provide basic information<br />
that can be used to define information needs and response priorities.<br />
• Ground Surveys allow more detailed observations of shoreline conditions<br />
including the physical structure, ecological character, and human use of<br />
shorelines. This monitoring approach can provide comprehensive detail on the<br />
resources and activities likely to be affected by a spill, the potential extent of oiling<br />
and level of impact, likely recovery, and logistical considerations for different<br />
response methods.<br />
• Remote Sensing includes a wide range of techniques to detect spills using<br />
remote sensing equipment (e.g. infrared thermal imaging, side-looking airborne<br />
radar, satellite images). See Brown et al., (1999) for a comprehensive review.<br />
These techniques are not always available or suitable but can provide very useful<br />
data in some situations.<br />
13
<strong>Oil</strong> <strong>Spill</strong> <strong>Monitoring</strong>: Background Paper<br />
4.6.2 Sampling of the <strong>Oil</strong><br />
Information on the oil spilled, and samples of oil from the source of a spill, should be<br />
obtained wherever possible. This is to provide information on the properties of the oil<br />
to assist in prediction of oil fate and effects, and the selection of appropriate response<br />
options. This is clearly Type I monitoring.<br />
For cost recovery and prosecution<br />
purposes, samples of the oil should<br />
also be collected from the slick and<br />
impacted areas to provide a direct link<br />
between the source of a spill, and the<br />
areas affected by it. These samples<br />
should be collected using techniques<br />
that allow chemical fingerprinting of<br />
the oil (including weathering) and<br />
should be collected periodically<br />
throughout the response. Samples<br />
should also be collected from other<br />
possible sources in the vicinity of the<br />
spill.<br />
<strong>Oil</strong> is usually sampled via collection of<br />
discrete samples that target areas<br />
where information on oil in the water<br />
is likely to be needed e.g. adjacent to<br />
aquaculture facilities, spawning areas,<br />
food gathering sites, swimming<br />
beaches, etc. If samples are to be<br />
used for comparative purposes,<br />
reference samples should also be<br />
Figure 5 Water Column Sampling<br />
(Photo: Cawthron Institute)<br />
collected from either representative areas not directly impacted by the spill, or from<br />
areas before they are impacted (but ideally, both).<br />
For all sampling, details need to be recorded by all personnel of the location, timing<br />
and nature of sampling and appropriate “Chain of Custody” procedures must be<br />
followed.<br />
4.6.3 Sampling the Water Column<br />
The water column is subject primarily to dissolved contaminants and, to a lesser<br />
extent, dispersed particulates. Background environmental conditions tend to be highly<br />
transient and will vary diurnally, seasonally, and inter-annually, as well as in relation<br />
to climatic events like storms.<br />
<strong>Monitoring</strong> programmes need to recognise and account for such variability when<br />
determining whether to monitor, and if so, when, where, and how often.<br />
In most spill situations, there will be very limited Type I water column sampling or<br />
monitoring. It is usual for grab samples to be taken at the water surface to collect<br />
samples for determination of oil or chemical characteristics to help guide decisionmaking,<br />
and for prosecution purposes. Where dispersants are used to disperse large<br />
surface slicks it is also common to use visual observations or fluorometry to monitor<br />
the effectiveness of the operation. The latter will involve sampling at a number of<br />
depths over the affected area and control areas.<br />
14
<strong>Oil</strong> <strong>Spill</strong> <strong>Monitoring</strong>: Background Paper<br />
However, water column monitoring for the assessment of a spill’s effects on<br />
phytoplankton, zooplankton or fish is rarely undertaken due to the difficulty and cost in<br />
establishing a direct cause and effect relationship with a spill. Population level data<br />
for phytoplankton, and or zooplankton and fish, should only be considered if:<br />
• There is a very high level of concern over water column organisms and<br />
• Response decisions could be influenced by the outcome of monitoring.<br />
An example of this would be where a local fishery relies on seasonal zooplankton for<br />
recruitment (e.g. juvenile lobsters). In this case monitoring may be needed to assess<br />
if zooplankton are present and what the most appropriate response decision may be.<br />
Because of potential large natural variations, establishing a cause-effect relationship<br />
is often very difficult without extensive research and timeframes seldom allow for the<br />
provision of information suitable for operational decision making.<br />
4.6.4 Sampling Sediment and Associated Biota<br />
In contrast to the water column, sediment is a relatively stable medium. The physical,<br />
chemical and biological characteristics of the sediment substratum may integrate<br />
transient changes from both dissolved contaminants in the water column and also<br />
deposited material. While substratum characteristics (e.g. sediment contaminants,<br />
ecological communities) will change over scales of months (e.g. seasonally) and<br />
years, they remain relatively stable over smaller time scales, and provide a good way<br />
of detecting change before and after an impact.<br />
Except where floating slicks affect intertidal areas, the substratum in marine systems<br />
will generally only be exposed to oil or chemical impacts when the spill products sink<br />
(are either denser that the surrounding water or oil becomes entrained within<br />
sediments). Sampling outside of shallow and intertidal areas is generally a low<br />
priority, and is very unlikely to be needed for small spills, or spills of volatile, nonpersistent<br />
oils. Where oil is thought to have impacted offshore marine sediments, the<br />
most common methods for sampling are core or grab samples collected by SCUBA<br />
divers or remote operated sampling devices from the sea surface. To accurately<br />
detect oiling in marine sediments, repetitive sampling at systematically selected sites<br />
is usually required.<br />
The identification and enumeration of seabed macrofauna is usually performed on<br />
preserved samples in the laboratory with the aid of a binocular microscope, and<br />
requires specialist expertise.<br />
The two main ecological components of the seabed environment are:<br />
• Infauna, which is the assemblage of animals (often microscopic) that live buried<br />
or partially buried with the sediment matrix (e.g. worms, bivalve shellfish).<br />
Because infaunal communities may be variable or patchy, it is standard practice<br />
to take replicate samples from any one site to provide an average picture of<br />
species richness and abundance, and provide a representative sample of the<br />
species present.<br />
• Epibiota, which refers to the animals and plants (e.g. sea stars, urchins,<br />
seaweeds) that inhabit the surface of the seabed. Epibiotic assemblages may be<br />
a significant feature of both rocky and soft-sediment habitats, although epibiota<br />
can be relatively impoverished in both. Infaunal assemblages, on the other hand,<br />
are a unique feature of soft-sediment habitats.<br />
15
<strong>Oil</strong> <strong>Spill</strong> <strong>Monitoring</strong>: Background Paper<br />
For an assessment of seafloor contaminant levels it is most relevant in ecological<br />
terms to target surface sediments (e.g. the sediment surface down to a depth of 50-<br />
100 mm) since sediment-dwelling fauna generally inhabit these sediments, and any<br />
correlation between contaminant levels and biological effects can then be determined.<br />
4.7 Determining the Method for Obtaining Data<br />
<strong>Monitoring</strong> methods for Type I monitoring are included in the <strong>Oil</strong> <strong>Spill</strong> <strong>Monitoring</strong><br />
Handbook (AMSA, 2003) and for Type I and II monitoring in the Guidelines for the<br />
Scientific Study of <strong>Oil</strong> <strong>Spill</strong> Effects (Petroleum Environmental Research Forum Project<br />
94-10, 1999) described by Robertson (2001).<br />
Most biological sampling methods require expert input and this should be sought early<br />
in the development of a programme if there is any doubt about the appropriateness of<br />
a technique, or there are questions about whether the selected method can provide<br />
the type of information required.<br />
When selecting monitoring methods, the following questions address some of the key<br />
aspects that must be considered:<br />
• Can sampling be undertaken safely?<br />
• Can appropriate data be obtained by field measurements?<br />
• Does the design account for spatial and temporal variability?<br />
• Will the study provide meaningful information in a relevant timeframe?<br />
• Will samples need to be collected?<br />
• Will sampling devices collect representative samples?<br />
• Will sampling devices contaminate or affect the sample?<br />
• Will samples contaminate or affect the sampling devices?<br />
• What size of samples are required?<br />
• Will samples need to be preserved before analysis?<br />
• Are procedures in place to track samples and field data?<br />
• Can potential sampling error be minimised (e.g. sampling protocols, training)?<br />
• Can potential sampling errors be managed (see inset)?<br />
• Can data be analysed and accessed in a timely manner?<br />
• What resources are needed and are available for the monitoring programme?<br />
4.7.1 Selecting Sample Locations within a Site<br />
The choice of sampling location selection is at the discretion of the designer of the<br />
monitoring programme and no particular method is recommended. Some commonly<br />
used methods for selecting sampling locations are:<br />
• Authoritative or Selective Sampling. In this case samples are taken from<br />
selected locations, e.g. from both oiled (or otherwise impacted) sites and unoiled<br />
(unimpacted) sites. These are assumed to be “representative”. This allows for a<br />
small number of samples, and hence is ideal for small Type I monitoring<br />
programmes, but has a relatively high potential for error.<br />
• Random Sampling. This is a more scientifically valid method but usually<br />
requires a large number of sample locations. For monitoring that may be legally<br />
challenged, or scientifically scrutinised, this method is recommended. This is<br />
unusual for Type I monitoring though.<br />
• Systematic Sampling: This sampling uses a grid or consistent pattern across<br />
the defined area. This approach is most suitable when looking for none– obvious<br />
contaminated locations, such as subsurface oil.<br />
16
<strong>Oil</strong> <strong>Spill</strong> <strong>Monitoring</strong>: Background Paper<br />
In consideration of the method personnel should also consider the need for repeated<br />
sampling or measurements. If sampling is non-destructive (e.g. counts of sessile<br />
invertebrates) then each location can be recorded and re-used. This reduces chance<br />
variation over time but requires careful consideration be given to whether each<br />
location is really representative of the site (if this is required of course).<br />
If sampling is destructive (e.g taking of sediment samples) then the location cannot be<br />
reused and care needs to be taken in the design of the programme to ensure that<br />
sampling location selection methodology remains consistent. For example, if<br />
selective sampling is undertaken on the basis of “oiled” and “unoiled” areas, a method<br />
must be developed for being able to identify oiled areas in the future when, perhaps,<br />
the presence of oil is not so obvious.<br />
4.7.2 Quadrats and Transects<br />
Area based measures (e.g. number<br />
of animals per square metre) often<br />
use small sampling perimeters or<br />
“quadrats”. The size of the quadrat<br />
used will depend on what is being<br />
sampled and the numbers that need<br />
to be counted. If the quadrat size is<br />
too big the numbers become<br />
unwieldy, if they are too small then<br />
sampling variability problems may<br />
arise. Generally, for shoreline work,<br />
an area of 0.2 to 0.3 sq m is<br />
sufficient. The number of quadrats<br />
used will be determined by the<br />
method of selecting the sample<br />
locations and the level of confidence<br />
required by the study.<br />
Transects are surveyed lines,<br />
usually passing from high to low tide,<br />
along which samples are taken. A<br />
transect is usually a straight line of a<br />
few metres to tens of metres long<br />
and perhaps 1-2 m wide, and is<br />
suited to the sampling of large,<br />
sparsely populated, or patchy<br />
epibiota. Like quadrats, transects<br />
can be positioned selectively,<br />
randomly or at regular intervals, and<br />
Figure 6 Intertidal Transect<br />
(Photo: Cawthron Institute)<br />
sampling points or quadrats can be distributed along the transect continuously,<br />
selectively, randomly, or at regular intervals.<br />
Again, selection of method is discretionary but should be consistent within a<br />
monitoring programme and, as far as possible, between programmes.<br />
17
<strong>Oil</strong> <strong>Spill</strong> <strong>Monitoring</strong>: Background Paper<br />
4.7.3 Data Types<br />
Data can be obtained in a number of forms:<br />
• Samples. <strong>Oil</strong>, sediment or biological samples will require preservation, transport,<br />
storage and eventual analysis. In terms of logistics and other management<br />
resources, samples are the most costly form of data and this should be<br />
considered when detailed laboratory analysis is required. However, samples may<br />
be collected relatively easily in the field and only analysed if required.<br />
• Field Data. This includes results from field tests and other on site assessments.<br />
It avoids the need for sample processing or analysis following collection, but does<br />
require a data management system encompassing quality assurance, data<br />
storage and retrieval, and systematic assessment.<br />
• Photo Documentation. Photographic documentation can range from video or<br />
photo-surveys of coastlines or slicks at sea to detailed photographs of quadrats or<br />
impacted plant and wildlife. Photo documentation has the advantages that skilled<br />
interpretation of data can be done later, remotely and be centralised, and that it is<br />
a fast and relatively cheap data collection process. This overcomes problems of a<br />
shortage of skilled staff and the need to calibrate estimates by different field staff.<br />
More accurate calculations of percentage cover and numbers may also be<br />
possible.<br />
• Analytical Data. This includes results of chemical and physical analysis of<br />
sediments, oils and biological samples, biological assessments of samples (e.g.<br />
plankton identification of water samples or photographs). This is usually an expert<br />
task and is consequently relatively expensive.<br />
Data, and assessments of the data, need to be made available to the appropriate<br />
response team personnel in a suitable timeframe and in a simple and usable form.<br />
Creating the mechanism for disseminating information is a response management<br />
issue. Developing mechanisms for ensuring that information is presented<br />
appropriately and on time is a monitoring programme design issue.<br />
4.8 Determining Sample Numbers and Sampling Schedule<br />
As previously discussed, sample numbers and sampling frequency depend on the<br />
objectives of the study. Sampling should adequately address spatial and temporal<br />
variation, but needs to be balanced against logistical constraints of sample collection<br />
and processing, and the ability to provide meaningful information within a relevant<br />
timeframe.<br />
Often, careful planning of sampling<br />
effort to address specific questions<br />
can reduce the number of samples<br />
that need to be collected and/or<br />
analysed. Alternatively, samples<br />
can be collected and only analysed<br />
if needed.<br />
The frequency of sampling will<br />
depend on what is being assessed<br />
and should reflect the natural<br />
cycles of the assemblages and the<br />
type of habitat being assessed at<br />
scales relevant to the parameters<br />
being measured.<br />
18<br />
Figure 7 Aerial Surveillance to Monitor<br />
Remote or Inaccessible Shorelines<br />
(Photo: Wardrop Consulting)
<strong>Oil</strong> <strong>Spill</strong> <strong>Monitoring</strong>: Background Paper<br />
4.9 Determining the Likely Duration of the Study<br />
4.10 Logistics<br />
Timing of sample collection could vary from a one-time sample collection (e.g. oil<br />
properties, key species present), up to a multi-year monitoring programme where<br />
sampling is conducted monthly or seasonally (e.g. TPH levels in shellfish or sediment,<br />
oiled wildlife surveys). Timing will depend on the questions being addressed, and the<br />
system being monitored e.g. dispersant monitoring, in the order of hours to days,<br />
shoreline impacts, in the order of days to years or decades.<br />
For any Type I monitoring, the<br />
duration of the monitoring<br />
programme will be tied directly to<br />
the operational response. That is,<br />
monitoring must provide<br />
information needed for operational<br />
decisions. Occasionally, Type I<br />
monitoring extends beyond the<br />
termination of a response, for<br />
example, testing to approve the<br />
reopening of a fishery closed<br />
during a spill.<br />
<strong>Monitoring</strong> is a core component<br />
Figure 8 With Low Speed and Good<br />
Visbility, Helicopters Provide an Effective<br />
Tool for Aerial Surveillance<br />
(Photo: Wardrop Consulting)<br />
of a spill response operation. While the initial focus of any response is to prevent<br />
further spillage and contain and clean up spilt product, someone within the response<br />
team should be assigned the role of coordinating monitoring. This is to avoid<br />
unnecessary duplication of information collection, and to ensure that adequate<br />
resources are available to undertake the monitoring necessary to provide decision<br />
makers with the information needed to appropriately plan a response.<br />
4.11 Data Management<br />
Data integrity can be compromised in many and varied ways. Losses or errors can<br />
occur at the time of collection, during sample preparation and analysis, during<br />
recording of results, and during data processing, interpretation and reporting.<br />
QA/QC programmes should always be used to minimise the risk of data being<br />
compromised and to provide a system for detecting possible sources of error. A wide<br />
range of QA/QC procedures are available. Most analytical testing laboratories will<br />
have internal procedures including sample blanks, matrix spikes, etc. It is also<br />
advisable to include a range of chemical and field blanks in a testing programme. It is<br />
particularly important during sampling for prosecution purposes that data are<br />
managed in a suitable way.<br />
A key aspect of effective data management is accurate and timely record keeping.<br />
While time may be limited during field sampling, there is no better time for recording<br />
sample information and observations. All information should relate to a specific<br />
location and date, and should use standard descriptive terminology.<br />
Once data are collected they need to be both accessible and conveyed to decisionmakers<br />
in a meaningful way. Often this is in the form of summary reports that provide<br />
an overview of findings, rather than raw data. Adequate time and resources must be<br />
allowed to compile and check data, and to convey it appropriately.<br />
19
<strong>Oil</strong> <strong>Spill</strong> <strong>Monitoring</strong>: Background Paper<br />
5.0 SUMMARY<br />
The distinction between Type I and Type II monitoring is defined according to the<br />
primary objective of the programme. Type I monitoring includes all studies relating to<br />
spill response and can be considered a response (or “operational”) activity. Type II<br />
monitoring encompasses all other monitoring activities.<br />
The type and scope of studies needed and undertaken during or after a spill response<br />
will reflect the circumstances of the particular spill.<br />
Generally, only Type I monitoring, undertaken during a spill response, will be funded by<br />
National contingency plan s through AMSA and NZ MSA. Again the scope and scale<br />
of programmes covered will vary between spills, and even within different stages of the<br />
same spill. This, in itself, should not cause confusion or uncertainty. Rather, it means<br />
that the approach to monitoring should be flexible and that monitoring programme<br />
design should reflect the circumstances of the spill and be prepared using acceptable<br />
procedures or guidelines.<br />
Perhaps the most difficult concept to define is when monitoring is both “appropriate”<br />
and “reasonable” in its scope and scale and it is not possible to state a single rule to<br />
stipulate what these terms mean for particular incidents.<br />
For all monitoring programmes appropriate and realistic objectives must be set. In the<br />
case of Type I monitoring, this will generally be done by the Incident Controller or other<br />
nominated person on the Incident Management Team. The responsibility for<br />
determining “appropriate” and “reasonable” Type II monitoring is the relevant agency<br />
commissioning the work. Programmes must then be designed to meet these<br />
objectives and to deliver results in a timeframe and format that is for appropriate for<br />
their intended purpose. Guidance for Type I monitoring is provided in the <strong>Oil</strong> <strong>Spill</strong><br />
<strong>Monitoring</strong> Handbook (AMSA, 2003) and in Attachment A. .<br />
Figure 9 Sheen from Small <strong>Spill</strong><br />
Note: <strong>Oil</strong> samples are being taken from the small boat<br />
(Photo: Wardrop Consulting)<br />
20
<strong>Oil</strong> <strong>Spill</strong> <strong>Monitoring</strong>: Background Paper<br />
6.0 REFERENCES<br />
6.1 General<br />
AMSA (<strong>Australian</strong> <strong>Maritime</strong> Safety Authority). 2000a. The Response to the “Laura D’Amato” <strong>Oil</strong> <strong>Spill</strong>:<br />
Report of the Incident Analysis Team.<br />
AMSA (<strong>Australian</strong> <strong>Maritime</strong> Safety Authority).2000b. The Response to the Port Stanvac <strong>Oil</strong> <strong>Spill</strong>: Report<br />
of the Incident Analysis Team.<br />
AMSA (<strong>Australian</strong> <strong>Maritime</strong> Safety Authority). 2003. <strong>Oil</strong> <strong>Spill</strong> <strong>Monitoring</strong> Handbook. Prepared by<br />
Wardrop Consulting and the Cawthron Institute for the <strong>Australian</strong> <strong>Maritime</strong> Safety Authority (AMSA)<br />
and the Marine Safety Authority of New Zealand (MSA). Published by AMSA, Canberra.<br />
ANZECC. 2000. <strong>Australian</strong> and New Zealand Guidelines for Fresh and Marine Water Quality - 2000.<br />
ASTM (American Society for Testing and Materials). 1986. Standard Guide for Ecological<br />
Considerations for the Use of Chemical Dispersants in <strong>Oil</strong> <strong>Spill</strong> Response - Rocky Shores. American<br />
Society for Testing and Materials - Standard: 1-4.<br />
ASTM. 1997a. Standard Guide for Surveys to Document and Assess <strong>Oil</strong>ing Conditions on Shorelines.<br />
American Society for Testing and Materials - Standard: 1-5.<br />
ASTM. 1997b. ASTM Standards on Environmental Sampling. Second Edition. ASTM West<br />
Conshohocken.<br />
AS/NZS <strong>Australian</strong> New Zealand Standard 1998. Water Quality – Sampling. Part 1 Guidance on the<br />
design of sampling programs, sampling techniques and the preservation and handling of samples.<br />
AS/NZS 5667.1:1998.<br />
Australia, Government. Department of Transport and Communications. 1992. Departmental<br />
Investigation into the Loss of the Bow Section of the Greek Registered Motor Tanker “Kirki”: The<br />
Subsequent Fire, Evacuation of the Crew and Salvage Operations from 20 July, 1991 to August<br />
1991. Report No 33.<br />
Baker, J.M and W.J. Wolff (Eds). 1987. Biological Surveys of Estuaries and Coasts. Cambridge<br />
University Press.<br />
Batten, S. D.; Allen, R.J. S.; Wotton, C.O.M. 1998. The effects of the Sea Empress oil spill on the<br />
plankton of the Southern Irish Sea. Marine Pollution Bulletin 36: 764-774.<br />
Bellette, K. J., F. A. Nicholls-Grzemski and J. T. Wiskich. 1994. An Investigation into the Use of Serum<br />
Sorbitol Dehydrogenase as a Biomarker in Fish of South <strong>Australian</strong> Coastal Waters. Report to the<br />
S.A. Environment Protection Council.<br />
Boehm, P.D.; Brown, J.S.; Page, D.S.; Burns, W.A.; Neff,J .M.; Maki, A.W.; Bence, E.A. 2003: The<br />
Chemical Baseline as a Key to Defining Continuing Injury and Recovery of Prince William Sound.<br />
Proceedings of the 2003 International <strong>Oil</strong> <strong>Spill</strong> Conference, Vancouver, Canada, 6-11 April 2003.<br />
Brown, C.E.; Fingas, M.F. 1999. <strong>Oil</strong> <strong>Spill</strong> Surveillance, <strong>Monitoring</strong> and Remote Sensing: A Global<br />
Review. Proceedings of the Twenty-Second Artic and Marine <strong>Oil</strong>spill Program (AMOP) Technical<br />
Seminar, 2-4 June 1999, Calgary, Alberta, Canada 1: 387-402.<br />
Connolly, R. 1994. Effect of <strong>Oil</strong> from the “Era” <strong>Spill</strong> on Intertidal Seagrasses and Associated Motile<br />
Vertebrates in Spencer Gulf, South Australia. Report to the S.A. Environment Council.<br />
Cooper, K. and H.L. Rees. 2002. Aquatic Environment Protection Analytical Methods No 13: Review of<br />
Standard Operating Procedures (SOPs). Centre for Environment, Fisheries and Aquaculture<br />
Science.<br />
Cowell, E.B.; Monk, D.C. 1979. Problems in ecological monitoring in Port Valdez, Alaska. Proceedings<br />
of the International <strong>Oil</strong> <strong>Spill</strong> Conference 1979.<br />
Davis, W.P., G.I. Scott, C.D. Getter, M.O. Hayes and E.R. Gundlach (1980). Methodology for<br />
Environmental Assessments of <strong>Oil</strong> and Hazardous Substances <strong>Spill</strong>s. Helgolander<br />
Meeresuntersuchungen. 33: 246-256.<br />
Dobroski, C.J.; Bogardus, R.B. 1990. A Standardized Approach to the Ecological <strong>Monitoring</strong> of <strong>Oil</strong> <strong>Spill</strong>s.<br />
Proceedings of the Thirteenth Arctic and Marine <strong>Oil</strong> <strong>Spill</strong> Program Technical Seminar, 6-8 June 1990,<br />
Edmonton, Alberta 1: 197-218.<br />
Dutton, I. 1988. <strong>Oil</strong> <strong>Spill</strong> <strong>Monitoring</strong>: An Introduction. In Proceedings of the Workshop on the Role of the<br />
Scientific Support Coordinator (SSC) in <strong>Oil</strong> <strong>Spill</strong> Response, Mackay, Queensland: 97-102<br />
Dutton, I. 1990. Research Input into <strong>Oil</strong> <strong>Spill</strong> Response. In Proceedings of the Second National<br />
Workshop on the Role of the Scientific Support Coordinator (SSC), HMAS Cerberus, Hastings,<br />
Victoria: 43-50<br />
French, D.P.; Rines, H.; Gifford, D.; Keller, A.; Pavignano, S.; Brown, G.; Ingram, B.S.; MacDonald, E.;<br />
Quirk, J.; Natzke, S.; Finkelstein, K. 1996: Primary Restoration. Guidance Document for Natural<br />
Damage Resource Assessment Under the <strong>Oil</strong> Pollution Act of 1990. Report prepared for Damage<br />
Assessment and Restoration Program, National Oceanic and Atmospheric Administration.<br />
Gilfillan, E.S.; Harner, E.J.; O'Reilly, J.E.; Burns, W.A. 1996. A Comparison of Shoreline Assessment<br />
Study Designs used for the Exxon Valdez <strong>Oil</strong> <strong>Spill</strong>. Proceedings of the Nineteenth Arctic and Marine<br />
<strong>Oil</strong> <strong>Spill</strong> Program (AMOP) Technical Seminar, 12-14 June 1996, Calgary, Alberta, Canada 1: 615-<br />
630.<br />
Gales, N. 1991. New Zealand Fur Seals and <strong>Oil</strong>: An Overview of Assessment, Treatment, Toxic Effects<br />
and Survivorship. 1991 Sanko Harvest <strong>Oil</strong> <strong>Spill</strong>. Report to the Western <strong>Australian</strong> Department of<br />
Conservation and Land Management.<br />
21
<strong>Oil</strong> <strong>Spill</strong> <strong>Monitoring</strong>: Background Paper<br />
Green, R.H.; Montagna, P. 1996. Implications for monitoring: study designs and interpretation of results.<br />
Canadian Journal of Fisheries and Aquatic Sciences 53: 2629-2636.<br />
Gregory, S.; Maura, J.; Nichols, J. 2002. The Need for Reasonable and Cost Effective Response<br />
Operations. In PEMSEA: 2002. Regional Consultative Workshop of Strengthening Recovery of Ship<br />
Pollution Clean-up Costs and Damage Claims. PEMSEA Workshop Proceedings 5. Global<br />
Environment Facility/United Nations Development Programme/International <strong>Maritime</strong> Organisation<br />
Regional Programme on Building Partnerships in Environmental Protection and Management for the<br />
Seas of East Asia (PEMSEA), 5-6 September 2001, Quezon City, Philippines. 59-68.<br />
Huguenin, M.T.; Haury, D.H.; Weiss, J.C.; Helton, D.; Manen, C.; Reinharz, E. 1996. Injury Assessment.<br />
Guidance Document for Natural Damage Resource Assessment Under the <strong>Oil</strong> Pollution Act of 1990.<br />
Report prepared for Damage Assessment and Restoration Program, National Oceanic and<br />
Atmospheric Administration.<br />
Holloway, M. 1996. Sounding Out Science. Scientific American: 82-88.<br />
ISO International Standard 1991. Water Quality – Sampling. Part 2. Guidance on sampling techniques.<br />
ISO 5667-2.<br />
Kingsford, M. and C. Battershill. 1998. Studying Temperate Marine Environments; A Handbook for<br />
Ecologists. Canterbury University Press.<br />
Lee, K.H. 2002. <strong>Oil</strong> Pollution damage Claims for Fisheries and Aquaculture: With Reference to The<br />
Korean Manual and Sea Prince Incident. In PEMSEA: 2002. Regional Consultative Workshop of<br />
Strengthening Recovery of Ship Pollution Clean-up Costs and Damage Claims. PEMSEA Workshop<br />
Proceedings 5. Global Environment Facility/United Nations Development Programme/International<br />
<strong>Maritime</strong> Organisation Regional Programme on Building Partnerships in Environmental Protection<br />
and Management for the Seas of East Asia (PEMSEA), 5-6 September 2001, Quezon City,<br />
Philippines. 69-119.<br />
Long, E.R and L.G Morgan. 1991. The Potential for Biological Effects of Sediment-Sorbed Contaminants<br />
Tested in the National Status and Trends Program. NOAA Technical Memorandum NOS OMA 52.<br />
Mearns, A.J. 1995. Confirming Response Effectiveness: An Overview and Guide to Operational<br />
<strong>Monitoring</strong>. Proceedings of the 1995 International <strong>Oil</strong> <strong>Spill</strong> Conference, Long Beach, California, 27<br />
February-2 March 1995: 97-102.<br />
Miller, C. 1999. <strong>Monitoring</strong> Polycyclic Aromatic Hydrocarbons in the Auckland Marine Environment using<br />
SPMDs and Mussels. New Zealand Water and Wastes Association, Annual Conference and Expo:<br />
311-316.<br />
Ofiara, D.D. 2002. Natural resource damage assessments in the United States: rules and procedures for<br />
compensation from spills of hazardous substances and oil in waterways under US jurisdiction.<br />
Marine Pollution Bulletin 44: 96-110.<br />
Page, D.S.; Boehm, P.D.; Gregory, S.D.; Bence, A.E.; Burns, W.A.; Mankiewicz, P.J. 1996. The natural<br />
petroleum hydrocarbon background in subtidal sediments of Prince William Sound, Alaska, USA.<br />
Environmental Toxicology and Chemistry 15: 1266-1281.<br />
Paine, R.T.; Ruesink, J.L.; Sun, A.; Soulanille, E.L.; Wonham, M.J.; Harley, C.D.G.; Brumbaugh, D.R.;<br />
Secord, D.L. 1996. Trouble on oiled waters: lessons from the Exxon Valdez oil spill. Annual Review<br />
of Ecology and Systematics 27: 197-235.<br />
Pearson, W.H.; Elston, R.A.; Bienert, R.W.; Drum, A.S.; Antrim, L.D. 1999. Why did Prince William<br />
Sound, Alaska, Pacific herring (Clupea pallasi) fisheries collapse in 1993 and 1994? Review of<br />
hypotheses. Canadian Journal of Fisheries and Aquatic Sciences 56: 711-737.<br />
Peterson, C.H.; McDonald, L.L.; Green, R.H.; Erickson, W.P. 2001. Sampling design begets conclusions:<br />
the statistical basis for detection of injury to and recovery of shoreline communities after the ‘Exxon<br />
Valdez’ oil spill. Marine Ecology – Progress Series 210: 255-283.<br />
Petroleum Environmental Research Forum (PERF) 1999. Guidelines for the Scientific Study of <strong>Oil</strong> <strong>Spill</strong><br />
Effects. PERF Project 94-10. Downloaded from http://www.api.org/ehs/guidelines.<br />
PSEP. 1997. Recommended Protocols for Measuring Selected Environmental Variables in Puget<br />
Sound.<br />
Reinharz, E.; Burlington,L. B. 1996. Restoration Planning. Guidance Document for Natural Damage<br />
Resource Assessment Under the <strong>Oil</strong> Pollution Act of 1990. Report prepared for Damage Assessment<br />
and Restoration Program, National Oceanic and Atmospheric Administration.<br />
Reinharz, E.; Michel, J. 1996. Preassessment Phase. Guidance Document for Natural Damage<br />
Resource Assessment Under the <strong>Oil</strong> Pollution Act of 1990. Report prepared for Damage Assessment<br />
and Restoration Program, National Oceanic and Atmospheric Administration.<br />
Robertson, S. 2001. Guidelines and Methods for Determining <strong>Oil</strong> <strong>Spill</strong> Effects. Proceedings of the 2001<br />
International <strong>Oil</strong> <strong>Spill</strong> Conference, Tampa, Florida, 26-29 March 2001: 1545-1548.<br />
Rutherford, K., B. Zuur and P. Race. 1994. Resource Management Ideas No 10: Reasonable Mixing - A<br />
Discussion of Reasonable Mixing in Water Quality Management. 15p.<br />
Storrie, J. 1996. <strong>Oil</strong> <strong>Spill</strong> Assessment and <strong>Monitoring</strong>: GBRMPA Approach. In Proceedings of the Sixth<br />
Scientific Support Coordinators Workshop. Launceston, Tasmania: 2.61<br />
Tasmania Government of, Dept. Primary Industries, Water and Environment. 1996. Iron Baron <strong>Oil</strong> <strong>Spill</strong><br />
July 1995: Long Term Environmental Impact and Recovery.<br />
22
<strong>Oil</strong> <strong>Spill</strong> <strong>Monitoring</strong>: Background Paper<br />
US Coast Guard/ USEPA/ American Petroleum Institute. 1997. International Petroleum Industry<br />
Environmental Conservation Association/ International <strong>Maritime</strong> Organization. 1997. Differences in<br />
Risk Perception: How Clean is Clean. Technical Report to the 1997 International <strong>Oil</strong> <strong>Spill</strong><br />
Conference, Florida USA. pp 52. US Environment Protection Agency. 2001. Methods for Collection,<br />
Storage and Manipulation of Sediments for Chemical and Toxicological Analyses: Technical Manual.<br />
USE EPA Office of Water Report EPA-823-B-01-002.<br />
Wardrop, J.A. 1993. Industry Perspective on <strong>Monitoring</strong> of Damage and Recovery in Mangrove and<br />
Other Habitats. In Proceedings of the Fourth Scientific Support Coordinators Workshop. Adelaide,<br />
SA: 109-117<br />
Wardrop, J.A. 1997. Post <strong>Spill</strong> <strong>Monitoring</strong>: A Brief Retrospective. Paper presented to the Sixth Scientific<br />
Support Coordinators Workshop. Darwin, NT.<br />
Wardrop, J.A. and B. Wagstaff. 1995. Damage Assessment and Post <strong>Spill</strong> <strong>Monitoring</strong>: A Discussion<br />
Paper. Paper presented to the Fifth Scientific Support Coordinators Workshop. Cronulla, NSW. 1995<br />
Wardrop J.A. and B. Wagstaff. 1996. Post spill environmental <strong>Monitoring</strong> and Damage Assessment. In<br />
Proceedings of <strong>Spill</strong>con ’96.<br />
Wardrop, J.A., B. Wagstaff, P. Pfennig, J. Leeder and R. Connolly. 1997. The Distribution, Persistence<br />
and Effects of Petroleum Hydrocarbons Impacted by the “Era” <strong>Oil</strong> <strong>Spill</strong> (September, 1992): Final<br />
Phase One Report (1996). Report to the Office of the Environment Protection Authority, South<br />
<strong>Australian</strong> Department of Environment and Natural Resources. pp 142.<br />
Western Australia, State Committee. 1991. Report on Pollution Response Operations at Esperance from<br />
the Wreck of the “Sanko Harvest” DMH Report No: DMH P4/ 91.<br />
Williams, B.L. 1985. Ocean Outfall Handbook. Wellington: National Water and Soil Conservation<br />
Authority.<br />
Wooley, C. 2002. The Myth of the "Pristine Environment": Past Human Impacts in Prince William Sound<br />
and the Northern Gulf of Alaska. <strong>Spill</strong> Science and Technology Bulletin 7: 89-104.<br />
6.2 <strong>Oil</strong> <strong>Spill</strong> <strong>Monitoring</strong> Studies<br />
Bennett,V.; Noviello,D. 1993: Response to the grounding of the F/V EI JYU MARU No. 21. Proceedings<br />
1993 International <strong>Oil</strong> <strong>Spill</strong> Conference, American Petroleum Institute, Washington DC: 225-229.<br />
Brodie,D. 1993: The Kirki Incident. Proceedings 1993 International <strong>Oil</strong> <strong>Spill</strong> Conference, American<br />
Petroleum Institute, Washington DC: 201-207.<br />
Collier,T.K.; Krahn,M.M.; Krone,C.A.; Johnson,L.L.; Myers,M.S.; Chan,S.; Varanasi,U. 1993: <strong>Oil</strong><br />
Exposure and Effects in Subtidal Fish following the Exxon Valdez <strong>Oil</strong> <strong>Spill</strong>. Proceedings 1993 Int’al<br />
<strong>Oil</strong> <strong>Spill</strong> Conference, American Petroleum Institute, Washington DC: 301-305.<br />
Cubit,J.D.; Connor,J.L. 1993: Effects of the 1986 Bahia Las Minas <strong>Oil</strong> <strong>Spill</strong> on Reef Flat Communities.<br />
Proceedings 1993 Int’al <strong>Oil</strong> <strong>Spill</strong> Conference, American Petroleum Institute, Washington DC: 329-<br />
334.<br />
Dauvin,J.-C. 2000: The muddy fine sand Abra alba - Melinna palmata community of the Bay of Morlaix<br />
twenty years after the Amoco Cadiz oil spill. Marine Pollution Bulletin 40: 528-536.<br />
Edgara,G.J.; Barrett,N.S. 2000: Impact of the Iron Baron oil spill on subtidal reef assemblages in<br />
Tasmania. Marine Pollution Bulletin 40: 36-49.<br />
Edward,R.; White,I. 1999: The Sea Empress <strong>Oil</strong> <strong>Spill</strong>: Environmental Impact and Recovery. Proceedings<br />
of the 1999 Int’al <strong>Oil</strong> <strong>Spill</strong> Conference, Seattle, Washington, 8-11 March 1999: 97-102.<br />
Garrity,S.D.; Levings,S.C.; Burns,K.A. 1993: Chronic <strong>Oil</strong>ing and Long-Term Effects of the 1986 Galeta<br />
<strong>Spill</strong> on Fringing Mangroves. Proceedings 1993 Int’al <strong>Oil</strong> <strong>Spill</strong> Conference, American Petroleum<br />
Institute, Washington DC: 319-324.<br />
Glegg,G.A.; Hickman,L.; Rowland,S.J. 1999: Contamination of limpets (Patella vulgata) following the<br />
Sea Empress oil spill. Marine Pollution Bulletin 38: 119-125.<br />
Glegg,G.A.; Rowland,S.J. 1996: The Braer oil spill - hydrocarbon concentrations in intertidal organisms.<br />
Marine Pollution Bulletin 32: 486-492.<br />
Houghton,J.P.; Fukuyama,A.K.; Lees,D.; Driskell,W.B.; Shigenaka,G.; Mearns,A.J. 1993: Impacts on<br />
intertidal epibiota: Exxon Valdez spill and subsequent cleanup. Proceedings 1993 Int’al <strong>Oil</strong> <strong>Spill</strong><br />
Conference, American Petroleum Institute, Washington DC: 293-300.<br />
Houghton,J.P.; Gilmour,R.H.; Lees,D.C.; Driskell,W.B.; Lindstrom,S.C. 1995: Prince William Sound<br />
Intertidal Biota - Good News and Bad News Five Years Later. Proceedings of the Eighteenth Arctic<br />
and Marine <strong>Oil</strong> <strong>Spill</strong> Program (AMOP) Technical Seminar, 14-16 June 1995, Edmonton, Alberta,<br />
Canada 2: 1075-1094.<br />
Jones,D.A.; Plaza,J.; Watt,I.; Al Sanei,M. 1998: Long-term (1991-1995) monitoring of the intertidal biota<br />
of Saudi Arabia after the 1991 Gulf War oil spill. Marine Pollution Bulletin 36: 472-489.<br />
Lamarche,A.; Owens,E.H. 1996: The Use of SCAT and Shoreclean on the "Iron Baron" <strong>Spill</strong>.<br />
Proceedings of the Nineteenth Arctic and Marine <strong>Oil</strong> <strong>Spill</strong> Program (AMOP) Technical Seminar, 12-<br />
14 June 1996, Calgary, Alberta, Canada 2: 1609-1610.<br />
Lopes,C.F.; Milanelli,J.C.C.; Prosperi,V.A.; Zanardi,E.; Truzzi,A.C. 1997: Coastal monitoring program of<br />
Sao Sebastiao channel: assessing the effects of 'Tebar V' oil spill on rocky shore populations.<br />
Marine Pollution Bulletin 34: 923-927.<br />
23
<strong>Oil</strong> <strong>Spill</strong> <strong>Monitoring</strong>: Background Paper<br />
Lougheed, L.W.; Edgar, G.J.; Snell, H.L. 2002: Biological Impacts of the Jessica <strong>Oil</strong> <strong>Spill</strong> on the<br />
Galapagos Environment. Final report v.1.10 127p. Charles Darwin Foundation, Puerto Ayora,<br />
Galapagos, Ecuador.<br />
Lunel, T.; Swannell, R.; Rusin, J.; Wood, P.; Bailey, N.; Halliwell, C.; Davies, L.; Sommerville, M.; Dobie,<br />
A.; Mitchell, D.; McDonagh, M.; Lee,K. 1995: <strong>Monitoring</strong> the Effectiveness of Response Operations<br />
During the Sea Empress Incident: a Key Component of the Successful Counter-pollution Response.<br />
<strong>Spill</strong> Science and Technology Bulletin 2: 99-112.<br />
Mearns, A.J.; Roques, P.; Henry, C.B. 1993: Measuring Efficacy of Bioremediation of <strong>Oil</strong> <strong>Spill</strong>s:<br />
<strong>Monitoring</strong>, Observations, and Lessons from the Apex <strong>Oil</strong> <strong>Spill</strong> Experience. Proceedings 1993<br />
International <strong>Oil</strong> <strong>Spill</strong> Conference, American Petroleum Institute, Washington DC: 335-343.<br />
Michel, J.; French, D.; Csulak, F.; Sperduto, M. 1997: Natural Resource Impacts from the North Cape <strong>Oil</strong><br />
<strong>Spill</strong>. Proceedings of the 1997 Int’al <strong>Oil</strong> <strong>Spill</strong> Conference, Fort Lauderdale, Florida, 7-10 April 1997:<br />
841-850.<br />
Owens, E.H.; Teal, A. 1990: A Brief Overview and Initial Results from the Winter Shoreline <strong>Monitoring</strong><br />
Program Following the Exxon Valdez Incident. Proceedings of the Thirteenth Arctic and Marine <strong>Oil</strong><br />
<strong>Spill</strong> Program Technical Seminar, 6-8 June 1990, Edmonton, Alberta 1: 451-470.<br />
Prince, R.C.; Clark, J.R.; Lindstrom, J.E.; Butler, E.L.; Brown, E.J.; Winter, G.; Grossman, M.J.; Parrish,<br />
P.R.; Bare, R.E.; Braddock, J.F.; Steinhauer, W.G.; Douglas, G.S.; Kennedy, J.M.; Barter, P.J.;<br />
Bragg, J.R.; Harner, E.J.; Atlas, R.M. 1994: Bioremediation of the Exxon Valdez oil spill: monitoring<br />
safety and efficacy. In R.E.Hinchee, B.C.Alleman, R.E.Hoeppel, & R.N.Miller (Eds.), Hydrocarbon<br />
remediation. 107-124). Boca Raton, Fl.: CRC Press.<br />
Rozas, L.P.; Minello, T.J.; Henry, C.B. 2000: An assessment of potential oil spill damage to salt marsh<br />
habitats and fishery resources in Galveston Bay, Texas. Marine Pollution Bulletin 40: 1148-1160.<br />
Simpson, R.D.; Smith, S.D.A.; Pople, A.R. 1995: The effects of a spillage of diesel fuel on a rocky shore<br />
in the sub-antarctic region (Macquarie Island). Marine Pollution Bulletin 31: 367-371.<br />
Smith, S.D.A.; Simpson, R.D. 1995: Effects of the ‘Nella Dan’ oil spill on the fauna of Durvillaea<br />
antarctica holdfasts. Marine Ecology Progress Series 121: 73-89.<br />
Smith, S.D.A.; Simpson, R.D. 1998: Recovery of benthic communities at Macquarie Island (sub-<br />
Antarctic) following a small oil spill. Marine Biology 131: 567-581.<br />
Wells, P.G.; Butler, J.N.; Hughes, J.S. (Eds). 1995: Exxon Valdez <strong>Oil</strong> <strong>Spill</strong>: Fate and Effects in Alaskan<br />
Waters, American Society for Testing and Materials Special Technical Publication (ASTM STP) 1219,<br />
Philadelphia, PA. USA p. 693.<br />
6.3 Approaches to Detecting Environmental Effects<br />
Bellan, G.; Desrosiers, G.; Willsie, A. 1988: Use of an Annelid Pollution Index for monitoring a<br />
moderately polluted littoral zone. Marine Pollution Bulletin 19: 662-665.<br />
Blind, M.W.; Aalderink, R.H. 1998: Designing a monitoring network for long-term trend detection. Water<br />
Quality International : 43-45.<br />
Boehm, P.; LeBlanc, L.; Little, A.D. 1991: <strong>Monitoring</strong> Hydrocarbons in Beaufort Sea Sediments and<br />
Organisms: Implications for <strong>Oil</strong> <strong>Spill</strong> <strong>Monitoring</strong>. Proceedings of the Fourteenth Arctic and Marine <strong>Oil</strong><br />
<strong>Spill</strong> Program Technical Seminar, 12-14 June 1991, Vancouver, British Columbia 1: 131-148.<br />
Bragg, J.R.; Prince, R.C.; Harner, E.J.; Atlas,R.M. 1993: <strong>Monitoring</strong> and Interpreting Bioremediation<br />
Effectiveness. Proceedings of the Sixteenth Arctic and Marine <strong>Oil</strong> <strong>Spill</strong> Program (AMOP) Technical<br />
Seminar, 7-9 June 1993, Calgary, Alberta: 339-340.<br />
Campagna, P.R.; Humphrey, A. 1992: Air Sampling and <strong>Monitoring</strong> at the Kuwait <strong>Oil</strong> Well Fires.<br />
Proceedings of the 15th Arctic and Marine <strong>Oil</strong> <strong>Spill</strong> Program Technical Seminar, 10-12 June 1992,<br />
Edmonton, Alberta 1: 575-592.<br />
Diamant, A.; von Westernhagen, H. 1999: Biological indicators for the detection of natural and manmade<br />
changes in coastal waters - an introduction to the MARS project. Helgol Marine Research 53:<br />
148-153.<br />
Donnay, E.; Jacques, T.G.; Sullivan, J.O. 1994: Polscale (1994): Pollution Scale, Reference System<br />
and Guide for the Quantification and Evaluation of Coastal Pollution and Clean-up Operation in <strong>Oil</strong>-<br />
Polluted Coastal Zones. Proceedings of the Seventeenth Arctic and Marine <strong>Oil</strong> <strong>Spill</strong> Program<br />
(AMOP) Technical Seminar, 8-10 June 1994, Vancouver, British Columbia 1: 411-418.<br />
Donnay, E.; Jacques, T.G.; O'Sullivan, J. 1995: Polscale (1994-95) Results of Phase 1 - Methods,<br />
Procedures and Reference Scales for Assessing and Reporting the Condition of <strong>Oil</strong> Polluted Coastal<br />
Zones. Proceedings of the Eighteenth Arctic and Marine <strong>Oil</strong> <strong>Spill</strong> Program (AMOP) Technical<br />
Seminar, 14-16 June 1995, Edmonton, Alberta, Canada 1: 257-266.<br />
Ellis, D.V. 2003: Rocky shore intertidal zonation as a means of monitoring and assessing shoreline<br />
biodiversity recovery. Marine Pollution Bulletin 46: 305-307.<br />
Gagnon, M.M.; Grice, K.; Kagi, R.I. 1999: Biochemical and Chemical Parameters for Aquatic Ecosystem<br />
Health Assessments Adapted to the <strong>Australian</strong> <strong>Oil</strong> and Gas Industry. APPEA Journal 39: 584-599.<br />
Gustafson, K.E.; Dickhut, R.M. 1997: Distribution of polycyclic aromatic hydrocarbons in southern<br />
Chesapeake Bay surface water; evaluation of three methods for determining freely dissolved water<br />
concentrations. Environmental Toxicology and Chemistry 16:452-461.<br />
24
<strong>Oil</strong> <strong>Spill</strong> <strong>Monitoring</strong>: Background Paper<br />
Hodson, P.V.; Zambon, S.; Ewert, A.; Ibrahim, I.; Kiparissis, Y.; Windle, M.; Lee, K.; Venosa, A.D. 2001:<br />
Evaluating the Efficiency of <strong>Oil</strong> <strong>Spill</strong> Countermeasures by <strong>Monitoring</strong> Changes in the Bioavailability<br />
and Toxicity to Fish of PAH from Wetland Sediments. Proceedings of the Twenty-fourth Artic and<br />
Marine <strong>Oil</strong>spill Program (AMOP) Technical Seminar (including 18th TSOCS and 3rd PHYTO), 12-14<br />
June 2001, Edmonton (Alberta), Canada: 211-222.<br />
Hyland, J.L.; Van Dolah, R.F.; Snoots, T.R. 1999: Predicting stress in benthic communities of<br />
southeastern U.S. estuaries in relation to chemical contamination of sediments. Env Toxicology and<br />
Chemistry 18: 2557-2564.<br />
Lamarche, A.; Tarpley, J. 1997: Providing Support for Day-to-day <strong>Monitoring</strong> of Shoreline Cleanup<br />
Operations. Proceedings of the Twentieth Arctic and Marine <strong>Oil</strong> <strong>Spill</strong> Program (AMOP) Technical<br />
Seminar, 11-13 June 1997, Vancouver, British Columbia, Canada 2: 1107-1120.<br />
Lambert, P.; Ackerman, F.; Fingas, M.; Goldthorp, M.; Fieldhouse, B.; Nelson, R.; Punt, M.; Whiticar, S.;<br />
Schuetz, S.; Dubois, A.; Morganti, M.; Robbin, K.; Magan, R.; Pierson, R.; Turpin, R.; Campagna, P.;<br />
Mickunas, D.; Nadeau, R.; Hiltabrand, R. 1998: Instrumentation and Techniques for <strong>Monitoring</strong> the<br />
Air Emissions during In-Situ <strong>Oil</strong>/Fuel Burning Operations. Proceedings of the Twenty-First Arctic and<br />
Marine <strong>Oil</strong> <strong>Spill</strong> Program (AMOP) Technical Seminar, 10-12 June 1998, Edmonton, Alberta, Canada<br />
2: 529-568.<br />
Landis, W.G.; McLaughlin, J.F. 2000: Design criteria and derivation of indicators for ecological position,<br />
direction and risk. Environmental Toxicology and Chemistry 19: 1059-1065.<br />
Lee, K.; Wohlgeschaffen, G.; Cobanli, S.E.; Gauthier, J.; Venosa, A.D.; Doe, K.G.; Jackman, P.M.; Lee,<br />
L.E.J.; Suidan, M.T.; Garcia-Blanco, S. 2001: <strong>Monitoring</strong> Habitat Recovery and Toxicity Reduction in<br />
an <strong>Oil</strong>ed Freshwater Wetland to Determine Remediation Success. Proceedings of the Twenty-fourth<br />
Artic and Marine <strong>Oil</strong>spill Program (AMOP) Technical Seminar (including 18th TSOCS and 3rd<br />
PHYTO), 12-14 June 2001, Edmonton (Alberta), Canada: 195-210.<br />
Mearns, A.J.; Roques, P.; Henry, C.B. 1993: Measuring Efficacy of Bioremediation of <strong>Oil</strong> <strong>Spill</strong>s:<br />
<strong>Monitoring</strong>, Observations, and Lessons from the Apex <strong>Oil</strong> <strong>Spill</strong> Experience. Proceedings 1993<br />
International <strong>Oil</strong> <strong>Spill</strong> Conference, American Petroleum Institute, Washington DC: 335-343.<br />
Neff, J.M.; Boehm, P.D.; Stubblefield, W.A.; Kropp,R.; Page,D.S.; 2003: <strong>Monitoring</strong> Recovery of Prince<br />
William Sound, Alaska, Following the Exxon Valdez <strong>Oil</strong> <strong>Spill</strong>: Bioavailability of PAH in Offshore<br />
Sediments. Proceedings of the 2003 International <strong>Oil</strong> <strong>Spill</strong> Conference, Vancouver, Canada, 6-11<br />
April 2003.<br />
Opishinski, T.; Spaulding, M.L.; Swanson, C. 1996: COASTMAP: An Integrated System for<br />
Environmental <strong>Monitoring</strong>, Modeling and Management. Proceedings of ASCE North American<br />
Water and Environmental Congress 1996 (NAWEC 1996) Anaheim, CA, 22-28 June 1996: 1-6.<br />
Owens, E.H.; Gould, J.R.; Lindstedt-Siva, J. 1993: Field Studies to Determine the Ecological Effects of<br />
Cleanup Methods on <strong>Oil</strong>ed Shorelines. Proceedings 1993 International <strong>Oil</strong> <strong>Spill</strong> Conference,<br />
American Petroleum Institute, Washington DC: 401-406.<br />
Owens, E.H. 1993: An A-B-C- of <strong>Oil</strong>ed Shorelines. Proceedings of the Sixteenth Arctic and Marine <strong>Oil</strong><br />
<strong>Spill</strong> Program (AMOP) Technical Seminar, 7-9 June 1993, Calgary, Alberta 2: 1095-1110.<br />
Owens, E.H.; Sergy, G.A. 1994: Field Guide to the Documentation and Description of <strong>Oil</strong>ed Shorelines.<br />
Emergencies Science Division, Environmental Technology Centre, Environment Canada. 66p.<br />
Pearson, W.H.; Elston, R.A.; Bienert, R.W.; Drum, A.S.; Antrim, L.D. 1996: An Analysis of the Potential<br />
for <strong>Oil</strong> <strong>Spill</strong> Effects on the Herring Population of Prince William Sound, Alaska. Proceedings of the<br />
Nineteenth Arctic and Marine <strong>Oil</strong> <strong>Spill</strong> Program (AMOP) Technical Seminar, 12-14 June 1996,<br />
Calgary, Alberta, Canada 1: 601-614.<br />
Spaulding, M.L.; Opishinski, T.; Haynes, S. 1996: COASTMAP: An Integrated <strong>Monitoring</strong> and Modeling<br />
System to Support <strong>Oil</strong> <strong>Spill</strong> Response. <strong>Spill</strong> Science and Technology Bulletin 3: 149-169.<br />
Wade, T.L.; Jackson, T.J.; McDonald, T.J.; Wilkinson, D.L.; Brooks, J.M. 2000: Oysters as Biomonitors<br />
of the Apex Barge <strong>Oil</strong> <strong>Spill</strong>. Proceedings 1993 International <strong>Oil</strong> <strong>Spill</strong> Conference, American<br />
Petroleum Institute, Washington DC: 313-317.<br />
6.4 Different Approaches to Experimental Design and Analysis<br />
Alden, R.W.I.; Weisberg, S.B.; Ranasinghe, J.A.; Dauer, D.M. 1997: Optimizing temporal sampling<br />
strategies for benthic environmental monitoring programs. Marine Pollution Bulletin 34: 913-922.<br />
Ammann, L.P.; Waller, W.T.; Kennedy, J.H.; Dickson, K.L.; Mayer,F.L. 1997: Power, sample size and<br />
taxonomic sufficiency for measures of impact in aquatic systems. Environmental Toxicology and<br />
Chemistry 16: 2421-2431.<br />
Boyer, J.N.; Sterling, P.; Jones, R.D. 2000: Maximising information from a water quality monitoring<br />
network through visualization techniques. Estuarine, Coastal and Shelf Science 50: 39-48.<br />
Champely, S.; Doledec, S. 1997: How to separate long-term trends from periodic variation in water<br />
quality monitoring. Water Research 31: 2849-2857.<br />
Chapman, M.G. 2000: A comparative study of differences among species and patches of habitat on<br />
movements of three species of intertidal gastropods. Journal of Experimental Marine Biology and<br />
Ecology 244: 181-201.<br />
Chapman, M.G. 2000: Poor design of behavioural experiments gets poor results: examples from<br />
intertidal habitats. Journal of Experimental Marine Biology and Ecology 250: 77-95.<br />
25
<strong>Oil</strong> <strong>Spill</strong> <strong>Monitoring</strong>: Background Paper<br />
Gilfillan E.S.;Page, D.S.; Parker, K.R. 2003: Multivariate Analysis of Community Structure Over Ten<br />
Years Following the Exxon Valdez <strong>Oil</strong> <strong>Spill</strong>. Proceedings of the 2003 International <strong>Oil</strong> <strong>Spill</strong><br />
Conference, Vancouver, Canada, 6-11 April 2003.<br />
Hewitt, J.E.; Thrush, S.F.; Cummings, V.J.; Turner, S.J. 1998: The effect of changing sampling scales<br />
on our ability to detect effects of large-scale processes on communities. Journal of Experimental<br />
Marine Biology and Ecology 227: 251-264.<br />
Kimura, S.; Steinbeck, J. 1999: Can post-oil spill patterns of change be used to infer recovery?<br />
Proceedings of the 1999 International <strong>Oil</strong> <strong>Spill</strong> Conference, Seattle, Washington, 8-11 March 1999:<br />
339-347.<br />
Long, E.R and L.G Morgan. 1991. The Potential for Biological Effects of Sediment-Sorbed<br />
Contaminants Tested in the National Status and Trends Program. NOAA Technical Memorandum<br />
NOS OMA 52.<br />
Maurer, D. 2000: The dark side of taxonomic sufficiency (TS). Marine Pollution Bulletin 40: 98-101.<br />
McDonald, L.L.; Erickson, W.P.; Strickland, M.D. 1995: Survey Design, Statistical Analysis, and Basis<br />
for Statistical Inferences in Coastal Habitat Injury Assessment: Exxon Valdez <strong>Oil</strong> <strong>Spill</strong>. In Wells,<br />
P.G.; Butler, J.N.; Hughes,J.S. (Eds) 1995: Exxon Valdez <strong>Oil</strong> <strong>Spill</strong>: Fate and Effects in Alaskan<br />
Waters, American Society for Testing and Materials Special Technical Publication (ASTM STP)<br />
1219, Philadelphia, PA. USA: 296-311.<br />
Miller, A.W.; Ambrose, R.F. 2000: Sampling patchy distributions: comparison of sampling designs in<br />
rocky intertidal habitats. Marine Ecology Progress Series 196: 1-14.<br />
Nicholson, M.D.; Fryer, R.J.; Ross, C.A. 1997: Designing monitoring programmes for detecting<br />
temporal trends in contaminants in fish and shellfish. Marine Pollution Bulletin 34: 821-826.<br />
Page, D.S.; Gilfillan, E.S.; Boehm, P.D. Harner, E.J. 1995: Shoreline Ecology Program for Prince<br />
William Sound, Alaska, Following the Exxon Valdez <strong>Oil</strong> <strong>Spill</strong>. Part 1 – Study Design and Methods.<br />
In Wells, P.G.; Butler, J.N.; Hughes, J.S. (Eds) 1995: Exxon Valdez <strong>Oil</strong> <strong>Spill</strong>: Fate and Effects in<br />
Alaskan Waters, American Society for Testing and Materials Special Technical Publication (ASTM<br />
STP) 1219, Philadelphia, PA. USA: 263-295.<br />
Pagola-Carte, S.; Urkiaga-Alberdi, J.; Bustamante, M.; Saiz-Salinas, J.I. 2002: Concordance degrees<br />
in macrozoobenthic monitoring programmes using different sampling methods and taxonomic<br />
resolution levels. Marine Pollution Bulletin 44: 63-70.<br />
Peres-Neto, P.R. 1999: How many statistical tests are too many? The problem of conducting multiple<br />
ecological inferences revisited. Marine Ecology Progress Series 176: 303-306.<br />
Schmolke, S.R.; Broeg, K.; Zander, S.; Bissinger, V.; Hansen, P.D.; Kress, N.; Herut, B.; Jantzen, E.;<br />
Kruner, G.; Sturm, A.; Korting, W.; von Westernhagen, H. 1999: Multivariate statistical approach to<br />
the temporal and spatial patterns of selected bioindicators observed in the North Sea during the<br />
years 1995-1997. Helgol Marine Research 53: 257-266.<br />
Schwagmeyer, P.L.; Mock, D.W. 1997: How to minimize sample sizes while preserving statistical<br />
power. Animal Behavior 54: 470-474.<br />
Sheppard, C.R.C. 1999: How large should my sample size be? Some quick guides to sample size and<br />
the power of tests. Marine Pollution Bulletin 38: 439-447.<br />
Skilleter, G.A. 1996: An experimental test of artifacts from repeated sampling in soft-sediments.<br />
Journal of Experimental Marine Biology and Ecology 205: 137-148.<br />
Underwood, A.J. 1996: Detection, interpretation, prediction and management of environmental<br />
disturbances: some roles for experimental marine ecology. Journal of Experimental Marine Biology<br />
and Ecology 200: 1-27.<br />
Underwood, A.J. 1998: Grazing and disturbance: an experimental analysis of patchiness in recovery<br />
from a severe storm by the intertidal alga Hormosira banksii on rocky shores in New South Wales.<br />
Journal of Experimental Marine Biology and Ecology 231: 291-306.<br />
Underwood, A.J. 2000: Experimental ecology of rocky intertidal habitats: what are we learning.<br />
Journal of Experimental Marine Biology and Ecology 250: 51-76.<br />
Underwood, A.J.; Chapman, M.G. 2000: Variation in abundances of intertidal populations:<br />
consequences of extremities of environment. Hydrobiologia 426: 25-36.<br />
Underwood, A.J.; Chapman, M.G.; Connell, S.D. 2000: Observations in ecology: you can't make<br />
progress on processes without understanding the patterns. Journal of Experimental Marine Biology<br />
and Ecology 250: 97-115.<br />
Van der Meer, J. 1997: Sampling design of monitoring programmes for marine benthos: a comparison<br />
between the use of fixed versus randomly selected stations. Journal of Sea Research 37: 167-179.<br />
von Westernhagen, H.; Dethlefsen, V.; Haarich, M. 2001: Can a Pollution Event be Detected Using a<br />
Single Biological Effects <strong>Monitoring</strong> Method? Marine Pollution Bulletin 42: 294-297.<br />
Walsh, C. J. 1997: A multivariate method for determining optimal subsample size in the analysis of<br />
macroinvertebrate samples. Marine and Freshwater Research 48: 241-248.<br />
26
<strong>Oil</strong> <strong>Spill</strong> <strong>Monitoring</strong>: Background Paper<br />
ATTACHMENT A: RAPID REFERENCE FOR SPILL RESPONSE MONITORING REQUIREMENTS<br />
Trigger Primary<br />
Rationale Secondary<br />
<strong>Monitoring</strong>/<br />
Objective<br />
Objectives<br />
Data Requirements<br />
<strong>Oil</strong> spill is <strong>Spill</strong><br />
at sea surveillance<br />
and tracking<br />
<strong>Oil</strong> may<br />
impact<br />
sensitive<br />
marine<br />
resources<br />
<strong>Oil</strong> or<br />
Chemical<br />
Source<br />
identification<br />
• Guide planning of cleanup activities<br />
• Indicate time and physical constraints to<br />
mounting a response, e.g. prevailing weather, site<br />
access, habitat type, etc.)<br />
• Provide information on the size, type, location,<br />
and movement of oil to identify whether sensitive<br />
areas may be impacted<br />
• Identify appropriate monitoring sites, plus<br />
sampling & analysis methods<br />
• Source investigation can usually identify the oil<br />
type and volume spilled (Type I)<br />
• Prosecution requires evidence to link spill with<br />
identified source and to eliminate alternative<br />
sources (Type II monitoring)<br />
<strong>Oil</strong> character • See above also.<br />
• To characterise oil and/or receiving waters, to link<br />
spill with effects.<br />
• Document/confirm the weathering of oil.<br />
Identification<br />
of sensitive<br />
areas<br />
• Sensitive areas must be identified to assess<br />
potential impact and effects.<br />
• Potential impact to sensitive areas determines<br />
priorities for protection, response or cleanup.<br />
Water quality • Define environmentally important oil compounds.<br />
• Provide real-time feedback of response activities<br />
such as dispersant use.<br />
• Detect low-level water borne contaminants and<br />
assess safety of water usage e.g. contact<br />
recreation, seafood gathering.<br />
Water column<br />
(marine)<br />
organisms<br />
• Resources (e.g. fish, plankton) may be of<br />
significant value<br />
• May be affected by spill or response actions<br />
• <strong>Monitoring</strong> rarely required.<br />
1. Determine the extent and character of a spill.<br />
2. Track slick movement.<br />
3. Identify areas/ resources potentially affected.<br />
4. Determine sea conditions/ other constraints.<br />
5. Plan response actions.<br />
6. Plan extent of monitoring/ assessment studies.<br />
7. Document justification for response actions (to<br />
assist cost recovery).<br />
1. Confirm source of spill.<br />
2. Collect legally defensible samples to link source<br />
to spill or to eliminate possible alternative sources<br />
3. Characterise the oil by chemical fingerprinting<br />
4. Determine the likely fate of the oil<br />
1. Determine physical character to better predict<br />
behaviour or<br />
2. To predict efficiency of response methods<br />
3. To determine weathering of the oil.<br />
1. Identify sensitive areas (geomorphology, habitat,<br />
human use etc.) and<br />
2. Prioritise for protection or cleanup.<br />
3. Identify logistics data (access limitations,<br />
equipment staging areas etc).<br />
4. Use above data to define appropriate response<br />
strategies based on NEBA.<br />
1. Define pre-spill baseline water quality.<br />
2. Monitor potential effects of dispersant use or<br />
shoreline washing.<br />
3. Identify low-level waterborne contamination.<br />
4. Assess biological exposure / bioavailability of<br />
contaminants in edible resources.<br />
5. Monitor effect of oil and response activities.<br />
1. Monitor spill and response impacts<br />
2. Document post response recovery (Type I) or<br />
post-spill recovery (Type II)<br />
27<br />
Ref. or<br />
Guideline<br />
Estimating sea state M.1<br />
Locating slicks at sea. M.2<br />
Characterising slicks at sea M.3<br />
Aerial surveillance M.4<br />
GPS tracking. -<br />
Manual or computer predictions<br />
of oil movement.<br />
GIS maps/resource database -<br />
Samples from source. M.6<br />
Samples from slick. M.6<br />
Water column samples. M.7<br />
Field detection of oil in water M.8<br />
Biological samples. G.1<br />
Sediment samples. M.9<br />
Chemical analysis. G.3<br />
Chemical analysis. G.3<br />
Physical properties of oil. G.3<br />
Sample from slicks and films. M.6<br />
Sample handling, control/<br />
management<br />
G.1<br />
GIS maps/resource database. -<br />
Aerial video surveys. M.4<br />
Expert evaluation. -<br />
Water column sampling. M.7<br />
Continuous water column<br />
sampling.<br />
M.7<br />
Sentinel organism monitoring M.10<br />
Visual monitoring of dispersant<br />
effectiveness<br />
M.5<br />
Numerous methods depending<br />
on target species<br />
-<br />
M.10<br />
CONTINUED OVERPAGE
<strong>Oil</strong> <strong>Spill</strong> <strong>Monitoring</strong>: Background Paper<br />
RAPID REFERENCE FOR SPILL RESPONSE MONITORING REQUIREMENTS CONTINUED<br />
Trigger <strong>Monitoring</strong><br />
Rationale Objectives <strong>Monitoring</strong>/Data Ref. or<br />
Type<br />
Requirements Guideline<br />
Fisheries<br />
present<br />
Effects on<br />
fisheries<br />
• <strong>Oil</strong> can cause a tainting of commercial<br />
species.<br />
1.<br />
2.<br />
Collect samples of seafood species and<br />
Analyse tissue for hydrocarbons.<br />
Taint testing<br />
Sampling of tissues<br />
M.11<br />
M.11<br />
Sample handling G.1<br />
<strong>Oil</strong> may Shoreline<br />
Video/photographic records S.4<br />
impact<br />
shoreline<br />
assessment<br />
Determine Sector/Segment<br />
boundaries<br />
S.1<br />
<strong>Oil</strong> may<br />
effect<br />
sensitive<br />
shoreline<br />
resources<br />
Sediment<br />
quality<br />
(oil on<br />
sediment)<br />
Effects on<br />
marine and<br />
coastal birds,<br />
seals/ sea lions<br />
Effects on<br />
Intertidal<br />
benthos<br />
Subtidal<br />
benthos<br />
• Geographical distribution and persistence<br />
of oil influences response and monitoring<br />
design.<br />
• Determine the effectiveness and efficiency<br />
of spill response actions<br />
• Detection of spill and response physical<br />
effects.<br />
• <strong>Oil</strong> may enter intertidal/ subtidal sediment.<br />
• Determine the effectiveness and impact of<br />
response activities.<br />
• <strong>Oil</strong>ed sediment may release oil over time.<br />
• High level of public interest.<br />
• Shoreline organisms such as birds and<br />
seals are susceptible to direct oil impacts.<br />
• Contains resources of high value;<br />
biological, human uses, cultural,<br />
commercial.<br />
• Susceptible to oil impacts.<br />
• Susceptible to response activities.<br />
• Often slow to recover from oil and<br />
response impacts.<br />
• Support decision-making for protection or<br />
restoration<br />
• Often contain resources of high value<br />
(biological, human uses, cultural,<br />
commercial).<br />
• Susceptible to oil impacts.<br />
• May be directly impacted by response<br />
actions (e.g. dispersant use).<br />
1. Collect baseline data on impacted or potentially<br />
impacted areas, e.g. oil/ physical/ ecological<br />
character, human use etc.<br />
2. Verify aerial surveys and existing.<br />
3. Assess the effectiveness and effects of<br />
response activities.<br />
4. Support decision-making for protection or<br />
restoration and document post-spill recovery<br />
1. Collect baseline information on oil in sediments<br />
and extent of sinking oil.<br />
2. Determine the likely source and extent of spill<br />
related effects.<br />
3. Assess the effectiveness and impact of<br />
response activities.<br />
4. Document post-spill recovery.<br />
1. Identify populations and seasonal<br />
susceptibility.<br />
2. Determine appropriate response strategies.<br />
3. Monitor impact of oil and response activities.<br />
1. Document baseline conditions.<br />
2. Determine the cause and extent of spill-related<br />
effects.<br />
3. Assess effectiveness and effects of response<br />
activities.<br />
4. Document post-spill recovery.<br />
1. Document baseline conditions<br />
2. Determine the actual cause and extent of spill<br />
related impact<br />
3. Assess the effectiveness and impact of<br />
response activities.<br />
4. Assist planning for protection or restoration.<br />
5. Document post-spill recovery.<br />
28<br />
Characterise substrate S.2<br />
Determine beach profile S.3<br />
Deterine surface oil S.5<br />
Determine subsurface oil S.6<br />
Field detection of petroleum S.7<br />
hydrocarbons<br />
Discrete sediment samples S.8<br />
Shoreline surveys. S.2-S.7<br />
Photo quadrats and video S.10<br />
transects.<br />
Estimating hydrocarbon<br />
content of sediments<br />
(based on analysis).<br />
S.9<br />
Shoreline surveys. S.2-S.7<br />
Databases -<br />
Expert evaluation. -<br />
Photo quadrats and video<br />
transects.<br />
Estimates of percent cover<br />
and diversity.<br />
Infauna and epifauna<br />
composition.<br />
Ground-truthed aerial<br />
photos<br />
S.10<br />
S.10<br />
S.10<br />
S.2-S.7<br />
Photo quadrats. S.10<br />
Video transects. S.10<br />
Estimates of percent cover. S.10<br />
Fauna/flora composition. S.10<br />
Habitat zones. S.10
<strong>Oil</strong> <strong>Spill</strong> <strong>Monitoring</strong>: Background Paper<br />
NOTES<br />
29