We make our customers successful. - Oerlikon Barmag
We make our customers successful. - Oerlikon Barmag
We make our customers successful. - Oerlikon Barmag

You also want an ePaper? Increase the reach of your titles
YUMPU automatically turns print PDFs into web optimized ePapers that Google loves.
LIVING SAURER.<br />
THE ANNUAL REPORT 2003.
Financial Highlights.<br />
Key data.<br />
(EUR 000) 2003 2002<br />
Change<br />
in %<br />
Sales 1 745 874 1 697 492 2.9<br />
Operating profit before sale of discontinuing operations 87 018 69 353 25.5<br />
% of sales 5.0% 4.1%<br />
Profit on sale of discontinuing operations 988 –<br />
Operating profit 88 006 69 353 26.9<br />
Net profit 47 200 33 466 41.0<br />
% of sales 2.7% 2.0%<br />
Depreciation and amortization 78 189 79 344 –1.5<br />
% of sales 4.5% 4.7%<br />
EBITDA 166 195 148 697 11.8<br />
Cash flow (Net cash from operating activities) 125 025 144 999 –13.8<br />
% of sales 7.2% 8.5%<br />
Capital expenditure 50 913 49 571 2.7<br />
Employees (year end) 10 286 10 760 –4.4<br />
Total assets 1 250 979 1 301 100 –3.9<br />
Shareholders’ equity 467 871 430 595 8.7<br />
% equity financing 37.4% 33.1%<br />
Stock market capitalization (year end) 504 568 297 036 69.9<br />
Share summary. (EUR)<br />
Shareholders’ equity per share 32.68 30.65<br />
Earnings per share 3.33 2.37<br />
Cash flow (Net cash from operating activities) 8.83 10.28<br />
Capital repayment 1) – 0.68<br />
1) The Board of Directors of Saurer Ltd. intends to propose to the General Meeting of Shareholders on May 13, 2004, a<br />
share repurchase with capital redemption for a maximum of 930 000 registered shares. The repurchase of the shares to<br />
be canceled shall be by issue of negotiable put options – around 16.60 options are foreseen per registered share. The<br />
price for this repurchase by Saurer Ltd. will be determined after the General Meeting of Shareholders. Under market<br />
conditions at the time of this communication a premium of 30% is planned.
The business year 2003. 9<br />
Financial report 2003. 40<br />
Consolidated financial statements. 49<br />
The financial report of Saurer Ltd. 80<br />
Corporate Governance. 86<br />
Addresses worldwide. 106<br />
Share statistics. 110
Saurer employees portray, photographically, their everyday life<br />
during and after work. Here or in China, with or without clients,<br />
day or night, alone or in groups, with machines or without. They<br />
show how, day in, day out, they integrate the vision in their lives<br />
and routines.
THE BUSINESS YEAR 2003.<br />
9
Dear Shareholders,<br />
For Saurer as a whole, business development was good in 2003. A gratifying revival of demand for<br />
synthetic fiber plants and for embroidery machines, further reduction of fixed costs throughout the<br />
textile machine business and an improved result for surface technology – all these outweighed recent<br />
weaknesses in transmission technology and in the natural fiber spinning business. The reported profit<br />
includes significant restructuring costs incurred as part of <strong>our</strong> Tempus program. These pre-emptive cost<br />
measures will lead to further improvements in efficiency and to substantial cost savings over the next two<br />
years. Tempus will also have a lasting effect on <strong>our</strong> culture, emphasizing customer needs, cost-effectiveness<br />
and teamwork.<br />
The Group’s order intake of EUR 1 709m was down by 5% when compared with the record high of 2002.<br />
Sales were up, however, by 3% to EUR 1 746m. The improvement in profit of EUR 14m results partly<br />
from the increase in sales, but mainly from the sustained and systematic cost reductions we have made<br />
in recent years. Earnings before interest and tax (EBIT) increased to EUR 88m from EUR 69m in the prior<br />
year. This includes restructuring costs in the textile business of EUR 25m (prior year EUR 25m). Earnings<br />
before interest, tax, depreciation and amortisation (EBITDA) rose from EUR 149m to EUR 166m. The profit<br />
before minorities improved from EUR 35m in the previous year to EUR 49m in 2003. Cash flow from operating<br />
activities was EUR 125m. Net debt was reduced by EUR 73m to EUR 32m. The degree of equity<br />
financing amounts to 37% (33% in the previous year).<br />
Strong capital investment was made in Transmission Systems – 40% of Saurer’s total investment of EUR<br />
51m, with 53% made in the textile business and 7% in Surface Technology.<br />
<strong>We</strong> regularly examine the value of capitalized goodwill using discounted cash flow analysis, to comply<br />
with the requirements of IFRS reporting rules. On the basis of <strong>our</strong> present medium-term planning, there<br />
is no impairment of goodwill.<br />
10<br />
Textile Division – from machines to total solutions.<br />
2003 saw a further shortening of the Textile machinery business cycle. After an upswing late in 2000 and<br />
a decline in the latter half of 2001 the natural fiber business revived faster than expected in the second<br />
quarter of 2002, only to subside again in the second quarter of 2003. Fortunately the synthetic fiber<br />
business, whose cycles are differently phased, compensated for this with an upswing starting late 2002,<br />
such that Textile Division sales in total showed a significant increase of 5% in 2003, up to EUR 1 275m.<br />
Order intake was down in 2003, by 5% to EUR 1 233m.
Asian markets in particular, led by China, but also Turkey, performed strongly and exceeded <strong>our</strong> expectations<br />
with a high demand for technologically advanced products. By contrast the demand in Europe<br />
and America remained stagnant, apart from a few exceptions.<br />
In natural fibers Saurer achieved an order intake in 2003 of EUR 636m (EUR 854m, –26%) and sales of<br />
EUR 733m (EUR 774m, –5%). With the slackening of demand in the second half of 2003, utilization of<br />
production capacity in the first half of 2004 will be well down from the high levels of last year. However,<br />
thanks to their high flexibility and cost discipline, <strong>our</strong> business units in the natural fiber sector are able<br />
to absorb the effects of these short cycles with swings of up to 30% of capacity utilization from one<br />
quarter to the next.<br />
Order intake for synthetic fiber plants was EUR 596m, 33% above the low level of the previous year,<br />
leading to a high order book at the end of the year. Sales were also up, by 24% to EUR 543m (prior year<br />
EUR 437m).<br />
These volume increases and the improved cost base brought the synthetic fiber plant business back into<br />
profit, with all business units in the sector showing positive results. Neumag, manufacturing machines<br />
for production of carpet yarn and synthetic staple fiber, pursued its positive trend of recent years, not<br />
only in respect of orders and sales, but also in its profit margins. <strong>Barmag</strong>’s texturizing machinery also<br />
profited from a strong market revival. Increased sales, in combination with significant cost reductions<br />
following relocation of production to China and the Czech Republic, enabled this division to return a<br />
satisfactory result again after f<strong>our</strong> years of losses. <strong>Barmag</strong>’s filament spinning machine business, which<br />
is under extreme price pressure from Japan with highly unfavorable foreign exchange rates (Euro/<br />
Yen/Dollar), and also from local competitors in China, managed a notable improvement in 2003 without<br />
achieving a break-even result yet.<br />
Despite the improved market conditions, <strong>our</strong> structural improvements in the textile business are being<br />
pursued intensively. The outs<strong>our</strong>cing programs are essentially concluded. The last major parts manufacturer<br />
in Germany, Schlafhorst Parsys, was closed at the end of August, its business to a great extent<br />
passed on to third parties. Our sales, service and production facilities in Asia are developing rapidly.<br />
Our Tempus program, started 15 months ago, aims to re-engineer business processes radically throughout<br />
the Group, realigning everything we do to achieve customer satisfaction with maximum efficiency.<br />
These measures have been defined for all business units and will be implemented largely in 2004. The<br />
legal structure in Germany has been streamlined, with the previously separate textile division companies<br />
now merged into one company with several branches; this will simplify administration and reduce taxes.<br />
The end product of Tempus will be a new company culture, increased customer benefit and reduction of<br />
fixed costs by EUR 35m in 2005. Most of the cost of this program has been accrued in 2003.<br />
11
As a provider of complete solutions in yarn production, Saurer has made great progress in 2003 and is<br />
now able to offer its <strong>customers</strong> solutions extending from project finance all the way to handover of turnkey<br />
plants. As a further sign of <strong>our</strong> commitment to innovation, Saurer introduced 13 new products in<br />
2003 and improved many others, thereby confirming and strengthening <strong>our</strong> position as market leader.<br />
12<br />
Transmission Technology:<br />
pressure on volumes and prices.<br />
2003 was a year of consolidation for Transmission Systems. Our <strong>customers</strong> in the automobile and agricultural<br />
sectors were affected by general market weakness which led to reduced demand on their part for<br />
<strong>our</strong> gearbox components. This, together with conclusion of some older contracts led to a reduction in<br />
sales of 5% to EUR 363m. Our <strong>customers</strong> faced strong price competition which they passed on to their<br />
suppliers. Graziano had to work with reduced prices, and the effect of these was not fully compensated<br />
by some occasional, non-recurring income earned in the year under report. Operating profit was reduced<br />
from 10% to 8%. Our continued efforts on the cost side will offset the price reductions at least partially<br />
in the current year. However a full recovery of the operating margin will only come from higher sales<br />
volumes; these we hope will follow from <strong>our</strong> new programs whose delivery is planned for the second half<br />
of 2004.<br />
Surface Technology strengthened.<br />
Surface Technology, which operates mainly in USA, concluded its consolidation phase in 2003 and was<br />
able to benefit from the incipient market recovery in the second half year. This led to an improved order<br />
intake of EUR 113m (+4%) and sales of EUR 107m (+1%), which brought Surface Technology back into<br />
profit. In early December first steps were taken toward divestment of Surface Technology with the sale<br />
of Xaloy’s operations in Europe. This divestment is being pursued with the aim of realizing a fair price for<br />
the Group.<br />
Saurer Textile Solutions – a worldwide network.<br />
Saurer Textile has nine business units, each of which pursues its business autonomously on a global scale.<br />
In order to exploit valuable synergies in purchasing, production, technology, marketing and administra-
tion, teams made up of members from different business units work together to address common issues<br />
and thereby maximize the efficiency of the Group as a whole. The success of this effort depends greatly<br />
on the Saurer company culture, on the willingness of management to optimize results for Saurer as a<br />
whole as well as for their own business unit. These common programs can realize cost savings in excess<br />
of EUR 20m p.a. and at the same time accelerate important projects. Clear definition of business processes<br />
and open communication of goals and interests are the foundation of this process which is one<br />
of the main strengths of Saurer Textile Solutions. The question is not one of centralized or decentralized<br />
solutions, but of efficiency and customer service.<br />
Neumag: Innovation on a broad front. Neumag’s positive business development continued in 2003 in<br />
respect of orders, sales and results. High demand for synthetic staple fibers in China led in turn to a need<br />
for staple fiber production plants, which Neumag were able to exploit most effectively. Thanks to their<br />
products’ reliability, productivity and optimal cost-effectiveness, Neumag was able to acquire a majority<br />
of the tendered contracts and thereby build up a significant share of the market. The key to this success<br />
was the company’s ability to offer complete solutions from one s<strong>our</strong>ce.<br />
Neumag also enjoyed success in its carpet yarn business. In particular the S5 compact, modular system<br />
introduced in the second half of the year was extremely well received by <strong>customers</strong> worldwide thanks to<br />
its increased throughput and ease of use. The development phase of a new generation of fleece machines,<br />
started in 2002, was concluded on time when the first large Spunbond laboratory installation was taken<br />
into service at a customer presentation day in Neumünster at the end of the year. Neumag’s structure has<br />
been realigned toward business processes as part of the Saurer Tempus program, resulting in a flatter<br />
hierarchy with only two levels of management.<br />
Successful networking in texturizing. Developments in the texturizing sector were highly satisfactory<br />
this year. Business opportunities in the lively Asian market were <strong>successful</strong>ly exploited by virtue of the<br />
worldwide supply and production network which now operates in this sector, with production based in<br />
China, Czech Republic and Germany. Increased volumes and a strengthened cost base have brought this<br />
business unit back into profit. Further measures have been introduced as part of the Tempus program<br />
and these will lower the break-even point a good deal more. Thanks to its well-run network, texturizing<br />
is the most progressive of all Saurer’s business units and best placed to exploit opportunities in <strong>our</strong> global<br />
markets. With the introduction of the MPS, a new fully modular texturizing machine with individual<br />
operation of each section, a revolutionary new concept in production technology was presented. It sets<br />
new standards in flexible small-scale production with low costs – something <strong>our</strong> <strong>customers</strong> continually<br />
strive to achieve. Its low energy consumption and ease of use are further valuable features which will<br />
help to differentiate it in the market.<br />
Success with spinning mills in China. In China, private enterprises have been building up synthetic yarn<br />
production capacity. They have shown a preference for larger machines, hoping to realize economies of<br />
13
scale. This build-up is driven by growing demand for yarn from the Chinese textile industry who foresee<br />
export opportunities deriving from WTO membership, and who also hope to replace imported textiles<br />
with cheaper local products. <strong>Barmag</strong>’s spinning mill business has profited well from this investment<br />
boom, thanks to its market-leading technology. The new-generation winders with up to 16 yarn ends<br />
per take-up position, together with cost reductions deriving from local production of spinning systems<br />
led to success in the intensive price competition. Our ability to conceive and supply complete spinning<br />
mill projects – an ability built up over years by <strong>Barmag</strong>’s engineers – bore its first fruits here. Also in China<br />
the first complete installations for making polyester-based tyre cord were sold. With better roads being<br />
built in China it is expected that polyester will replace the nylon cord which is currently used.<br />
In East Europe, orders for complete solutions were taken for technical yarn types and also in the clothing<br />
sector. With <strong>customers</strong> in Turkey, advanced production conditions enabled the sale of high-performance<br />
equipment for spinning micro-fine filament, a first in 2003. <strong>Barmag</strong>’s spinning mill business also did very<br />
well in India, where the market for synthetic fibers has revived. The component business with polymer<br />
extrusion pumps also did well, particularly the larger systems.<br />
Fancynation in Rotor-spinning. The Rotor-spinning business went through a full cycle in 2003. After<br />
an explosive first half-year, demand cooled off rapidly in the second half. Besides the chronically weak<br />
markets of Europe and America, demand slackened significantly in Turkey and China during the year.<br />
SARS, the development of cotton prices, unfav<strong>our</strong>able currency rates and under-utilized capacity all<br />
played their part in slowing demand around mid-year. However the Autocoro 360, the new generation<br />
of Schlafhorst rotor machines, was very well received by the market when it was presented in the third<br />
quarter. The new drive system not only increases productivity and quality, but enables new yarn effects<br />
for which in the past expensive add-on equipment was needed. With the fancynation module yarn effects<br />
and associated fabrics can be simulated in 3-D on the computer, then if they are liked the relevant<br />
production settings can be loaded straight onto the spinning machine. Together with external partners,<br />
<strong>customers</strong> can be offered complete solutions for entire production lines to <strong>make</strong> complex yarn effects,<br />
or for the more normal simple yarns.<br />
To cater for the lower end of the market in China a production line to <strong>make</strong> manual rotor-spinning<br />
machines was installed in Saurer’s factory at Suzhou. The first machines have already been delivered to<br />
<strong>customers</strong>. Preparations were made to move the rotor-spinning business to Rheindahlen, in order to<br />
<strong>make</strong> space at Mönchengladbach with a view to later selling the Schlafhorst facilities there as a business<br />
park. Saurer Czech, production location for semi-automatic rotor machines, achieved a good result, significantly<br />
over budget.<br />
Ring-spinning – from problem child to cash cow. The ring-spinning sector has developed well in<br />
recent years, with stable results and great flexibility. Apart from large markets such as China, India and<br />
Pakistan, which are dominated by cheap, locally produced manual machines, ring-spinning business was<br />
14
concentrated mainly on Turkey. To a lesser extent orders were taken in the middle East, Europe and South<br />
America – markets in which Zinser can compete well. With new-style electronically controlled drives and<br />
with machine types suited for manufacture of compact yarns in cotton and wool, Zinser was able to close<br />
a number of development contracts and launch several new products. In particular some first successes<br />
with large-scale projects for compact yarns demonstrated that technology had caught up in this sector,<br />
where previously it had lagged somewhat. New production technology for high-volume wearing parts<br />
promises to strengthen the developing after-sales market. A new venture in India, started in the spring<br />
of 2003 to <strong>make</strong> flyers for the local market, has got off to a good start and met its initial objectives. In<br />
cooperation with a global partner a new approach to the construction of complete ring-spinning solutions<br />
has been developed and documented to a marketable level.<br />
Winding machines hold their own in difficult currency conditions. The winding machine business<br />
unit benefited again from strong demand from Asia and maintained its high volume of sales as in the<br />
previous year. Short-term fluctuations were quickly absorbed by increased flexibility in production.<br />
However the effect of the strong euro in the dollar-oriented Asian markets was to neutralize the benefits<br />
of <strong>our</strong> cost reduction programs and prevent any improvement in margins. Efforts to improve market<br />
share in the hard-fought Chinese market were given high priority. A number of process improvements<br />
were introduced, for example exact measurement of the yarn length. These improvements will reduce<br />
the drop-out rate of the cross-wound packages in subsequent processes such as weaving and knitting by<br />
over 70%.<br />
Twisting in a headwind. The overall performance of the twisting business was poor, despite one or two<br />
flashes of success in the carpet cord and tyre cord areas. In Asian markets volumes and prices were under<br />
enormous pressure caused by unfav<strong>our</strong>able currency developments, and also by SARS in the first half<br />
of the year. In particular the Japanese, but also other local Asian competitors, exploited the currency<br />
conditions, which were fav<strong>our</strong>able for them, to win <strong>customers</strong> with attractive prices. This put margins<br />
under pressure, so not only were volumes down but margins were extremely poor on what business<br />
remained. Substantial cost reductions were achieved in the second half-year as part of the Tempus<br />
program, including reduction of the workforce by 20% in the fixed cost area, but this was not enough<br />
to compensate in 2003 for the problems outlined above. New products for manufacture of carpet yarn<br />
and special effect yarns were introduced <strong>successful</strong>ly in the second half-year; these will influence sales<br />
and profits in 2004. The twisting group was reorganized in 2003 into a fully integrated business unit with<br />
an HQ and production locations in Krefeld, Kempten and Suzhou (China).<br />
Embroidery systems <strong>successful</strong> with a new program. The embroidery systems business unit as a whole<br />
had a good year in which it was able to increase its sales and its market share. Under new management<br />
the various large-scale systems were quickly modularized and the number of parts greatly reduced, which<br />
improved the cost base. High volume orders from Asia and Turkey led to increased sales and improved<br />
margins. For Melco’s single and multi-head embroidery machines new software was introduced which<br />
15
improves productivity by permitting asynchronous operation of the individual heads. This will enable<br />
Melco to rise clearly above its competition. Melco’s expansion into Asian markets, intended to compensate<br />
for continuing weakness in the American market, was delayed and the first sales in this area were<br />
made at the end of 2003. The result was another bad year for Melco. A new spinning process for wool<br />
yarns was developed and presented to the market in the last quarter. Compared with traditional ringspinning<br />
it offers a productivity increase of 30 times per spindle. The first of these installations is already<br />
up and running with a customer in Italy.<br />
Marketing transformed. Saurer has made big steps on its way from being a textile machine manufacturer<br />
to a provider of complete solutions. For many specific applications, sometimes working with external<br />
partners, complete solutions have been developed and documented to a marketable standard. “Turnkey”<br />
is the word. <strong>We</strong> plan the factory for <strong>our</strong> customer, organize the financing, build the factory and start<br />
the production, leaving him free to concentrate on his <strong>customers</strong> and his future business. <strong>We</strong> have also<br />
searched for new ways to develop links with potential <strong>customers</strong>, looking beyond the traditional trade<br />
fairs and advertisements in professional j<strong>our</strong>nals. Focussed informational meetings, specific events for<br />
<strong>customers</strong> in <strong>our</strong> laboratories and at their premises, professionally competent advice in the fullest sense<br />
– these are <strong>our</strong> new ways of linking to clients. With <strong>our</strong> integrated service centres in the key markets we<br />
can offer service around the clock and around the world. <strong>We</strong> now need new approaches in the markets<br />
for spare parts, after-sales service and modernization; customer attitudes and competition with local<br />
pirates are quite different in the new Asian markets from what we are used to in the traditional markets<br />
of Europe and America. Our internet-based customer support systems are continually being refined and<br />
represent a very high standard for the industry today.<br />
18<br />
Consolidation of Transmission Technology.<br />
In this period of reduced market activity, Graziano was able to concentrate on the planned consolidation<br />
of its transmission systems activities. Here the main goal was to realign Graziano’s various production<br />
plants in respect of products and technologies, aiming for full integration of recent acquisitions and<br />
introduction of new products which will generate sustained growth in future years. A good number of<br />
customer projects were progressed into product development. In 2003, Graziano established itself in the<br />
market as a supplier of complete transmission systems, notably with an order from Alfa Romeo for an<br />
AWD version of the 156 model, which will be developed in collaboration with Prodrive. A high performance<br />
twin-clutch gearbox, intended for the attractive sports car market, was completed in prototype.<br />
A new manual gearbox and differential were developed and tested for the new Aston Martin DB9, which<br />
will enter production in the second half of 2004. The new Maserati Quattroporte and the Ferrari<br />
Scaglietti will be fitted in 2004 with the new AMT (Automatic Manual Transmission) gearbox developed<br />
by Graziano. In the minibus sector the Front PTO (Power Take Off) for the new VW Transporter was
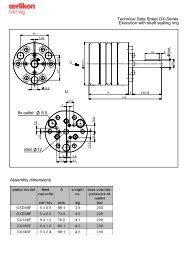
Saurer generates 70% of its textile sales in Asia.<br />
1995: 30%<br />
2002: 17%<br />
2003: 15%<br />
1995: 35%<br />
2002: 20%<br />
2003: 15%<br />
2003: 70%<br />
2002: 63%<br />
1995: 35%<br />
19
tested and approved, so this can now enter production in the second quarter of 2004. An economically<br />
priced Inverterachse was produced for use in small town buses; this will first appear in TransBus vehicles<br />
built by Dennis. Thanks to development work and initial production of timing gears for diesel engines an<br />
agreement was signed for cooperation with an automobile manufacturer in Northern Europe. Another<br />
agreement was made with Clubcar to develop a new generation of axles for their gas-driven golf carts<br />
and town vehicles, to enter serial production in 2005 after a one-year field test. In <strong>our</strong> plant in India,<br />
synchromesh units were designed and examples built for practically all Indian tractor manufacturers.<br />
However, the introduction of synchromesh gearboxes to the Indian tractor market is progressing<br />
altogether more slowly than expected, so Graziano have taken the opportunity to build up this production<br />
capability in India to supply world markets, with a plan to double the output in 2004. As part of<br />
Saurer’s Tempus program a reengineering of business processes is being undertaken at Graziano; it is<br />
hoped that by 2005 this will compensate for the reduced margins that have resulted from price erosion<br />
in recent years.<br />
20<br />
New applications, strong investment business<br />
in Surface Technology.<br />
The consolidation and refocusing of Surface Technology which was undertaken over the past two years<br />
has started to bear fruit and brought the business back into profit in the second half-year. Xaloy,<br />
manufacturing cylinders and feed screws for the plastics industry, started to recover first in Asia, then<br />
gradually in Europe and USA. The factory in Asia achieved its originally planned production level and<br />
profitability with a half-year delay. The European business of Xaloy was sold in December to the Italian<br />
O.M.G group, but is reported in the Saurer consolidated accounts burdened with the sizeable start-up<br />
cost of the new operation in the Czech Republic. In order to improve the value of Xaloy’s US operations<br />
in preparation for their planned sale, a step was taken to consolidate the market by acquiring a competitor,<br />
New Castle. This acquisition and subsequent integration of the two competing businesses had the<br />
effect of reducing the chronic over-capacity in the US market and also realized valuable synergies. The<br />
effect of these moves could be seen clearly in Xaloy’s results in the final two months of 2003.<br />
IonBond, the other branch of Surface Technology, enjoyed very satisfactory business development with<br />
a good profit and strong cash flow. The company provides diamond-hard thin-film metal coatings for<br />
tools and for decorative applications and occupies the No. 2 position in world markets for its products.<br />
Low costs and a slight rise in the markets of Europe and USA enabled a gradual improvement in the<br />
company’s result over the c<strong>our</strong>se of the year, finally attaining the satisfactory level of earlier years. New<br />
applications for coating of components and a strong order book for investment business through to 2005<br />
bear witness to the recovery of this business.
Outlook.<br />
This year it is especially hard to give a clear outlook. Currency movements between Yen, Dollar and <strong>our</strong><br />
most important currency, Euro, are a big question mark and clearly a potential threat; however their<br />
negative effects could be offset by positive developments already visible in many markets, particularly<br />
the USA.<br />
In the synthetic fiber business we have projects in prospect which will ensure utilization of existing<br />
capacity beyond the coming year-end, subject to final agreement on financing. In the natural fiber business<br />
we see a mixed picture with good prospects for ring-spinning and embroidery but a number of<br />
question marks affecting rotor-spinning and to some extent twisting.<br />
As part of the Tempus program we shall further streamline <strong>our</strong> activities in Germany and Switzerland and<br />
thereby release <strong>our</strong> non business related real estate – probably the greater part of the real estate we<br />
currently occupy in those countries will be released over the next two to five years. These properties will<br />
be restyled as business parks, rented out and subsequently sold, as we have already done at various<br />
locations. This will call for capital investment beyond normal levels in the next two years, including<br />
of c<strong>our</strong>se China where we are currently investing EUR 30m in new production facilities. Ultimately the<br />
sale of real estate no longer required for <strong>our</strong> businesses in Germany and Switzerland should realize some<br />
EUR 60m.<br />
In Transmission Technology we expect a small market improvement in the second half of 2004, based on<br />
customer forecasts.<br />
For Surface Technology with its good results and continuing market improvement we see the time is right<br />
for <strong>our</strong> planned divestment of this activity.<br />
For Saurer as a whole we expect 2004 will bring slightly lower sales and a slightly higher profit than 2003.<br />
21
Thank-you.<br />
Management and the Board sincerely thank all <strong>our</strong> employees for their contribution to Saurer’s success.<br />
Y<strong>our</strong> commitment and willingness to change have given <strong>our</strong> company the means and the strength it needs<br />
for further growth and to face the challenges which lie ahead.<br />
Prof. Dr. Manfred Timmermann and Dr. Mohamad Khouja resigned from the Management Board at the<br />
Annual General Meeting on May 14, 2003. Prof. Dr. Manfred Timmermann was a member of the Board<br />
from June 6, 1995, then Chairman from 1999 to 2002 and has made a very significant contribution to<br />
Saurer’s new direction. Dr. Mohamd Khouja was a member of the Board from June 15, 1994 and he also<br />
made a valuable contribution, particularly in the area of investor relations and liquidity management.<br />
Management and the Board thank both these gentlemen sincerely for their efforts.<br />
Prof. Dr. Giorgio Behr<br />
Chairman of the Board<br />
22<br />
Heinrich Fischer<br />
CEO and Board Delegate
A company is more than its balance sheet and income statement, its<br />
products and markets, its machines and factories. And success large-<br />
ly hinges on the spirit prevailing within the company, the values guiding<br />
the routine actions of its people and the processes governing day-to-day<br />
teamwork. With TEMPUS, Saurer endeav<strong>our</strong>s to create a set of shared<br />
values to be upheld by all employees – the “Saurer Spirit”. To this end, we<br />
have held seminars and forums for practically <strong>our</strong> entire workforce and<br />
have joined in visualizing the types of service that will delight <strong>our</strong> <strong>customers</strong><br />
and the means of providing these efficiently. The business procedures for<br />
all units were jointly redefined with the aim of boosting efficiency and<br />
customer focus, while increasing added value for <strong>our</strong> <strong>customers</strong>. <strong>We</strong> also<br />
share the determination to save an additional EUR 35 million in costs<br />
every year from 2005. Last year, <strong>our</strong> employees took photographs to express<br />
the way they experience Saurer and its system of values – pictures that<br />
document the launch of <strong>our</strong> radical transformation.
<strong>We</strong> <strong>make</strong> <strong>our</strong> <strong>customers</strong> <strong>successful</strong>. Our performance is<br />
generated from the anticipation of customer needs. <strong>We</strong> offer<br />
on-site system and service solutions.
The internationality and the performance of <strong>our</strong> staff<br />
ensure <strong>our</strong> success. Team play and opportunities for personal<br />
development are systematically cultivated.
<strong>We</strong> think and act in processes. Our swift response to client<br />
needs and <strong>our</strong> critical approach to established wisdoms are<br />
crucial to <strong>our</strong> entire operation.
Our economic strength provides us with the freedom<br />
to act. All activities are subject to an intelligent use of res<strong>our</strong>ces.<br />
Our strong Business Units and the synergies within<br />
the network guarantee sustainable added value.<br />
34
<strong>We</strong> are creating the textile future with <strong>our</strong> innovations.<br />
Our know-how, intelligence and creativity enable us to unlock<br />
new business areas and consolidate <strong>our</strong> market leadership in<br />
the world of textiles.
FINANCIAL REPORT 2003.
Management’s discussion of results. 42<br />
Consolidated financial statements.<br />
Consolidated income statement. 51<br />
Consolidated balance sheet. 52<br />
Consolidated cash flow statement. 53<br />
Consolidated statement of shareholders’ equity. 54<br />
Accounting principles. 55<br />
Notes to the consolidated financial statements. 58<br />
Principal companies and investments. 73<br />
Report of the group auditors. 74<br />
Multiple year comparison. 76<br />
Financial report of Saurer Ltd.<br />
Income statement. 81<br />
Balance sheet. 82<br />
Notes to the financial statements. 83<br />
Proposal to the General Meeting. 84<br />
Report of the statutory auditors. 85
Management’s discussion of results<br />
Overview of the business year<br />
For Saurer as a whole, business was very solid in 2003. Despite the<br />
stronger Euro and continuing pressure on margins sales increased<br />
by 2.9% over the prior year (6.6% in Swiss francs). This growth in<br />
sales led to a net profit of EUR 47m, thanks largely to Saurer’s program<br />
of business process improvement and fixed cost reduction<br />
(the TEMPUS project), which was started last year. The profit is<br />
stated after charging restructuring costs of EUR 28m (prior year<br />
EUR 29m).<br />
In the textile sector, slackening demand in the natural fiber business<br />
was compensated by recovery in the synthetic fiber market.<br />
The trend toward increased demand for high-tech products in<br />
Asian markets was continued from last year. Reorganization of the<br />
textile machine business, both operational and legal, was pursued<br />
as planned, together with <strong>successful</strong> efforts to become a provider<br />
of total solutions on a global basis.<br />
42<br />
The transmission systems business went through a consolidation<br />
phase in 2003. A combination of old projects running to conclusion<br />
and new projects still in preparation resulted in a reduction of<br />
reported sales and profit. The new businesses acquired last year<br />
are now fully integrated and an initiative has been launched to improve<br />
Graziano’s business processes, similar to the textile machine<br />
business.<br />
Surface Technology enjoyed a revival of market demand this year<br />
and also reaped the benefit of its cost improvement measures introduced<br />
earlier, enabling a welcome return to profitability. The<br />
planned divestment of this division was realized partially with the<br />
sale of Xaloy’s European units, while further steps are ongoing to<br />
divest the remainder of the business.<br />
The number of employees was reduced by 474 in 2003 (by 508<br />
after adjusting for acquisitions/divestments).
Order Intake<br />
Change Adjusted change<br />
(EUR 000) 2003 2002 in % in % 1)<br />
Saurer Textile Solutions 1 232 634 1 301 881 –5.3% –2.1%<br />
Natural Fibers 636 313 853 683 –25.5% –22.7%<br />
Europe 93 428 169 573 –44.9%<br />
North and South America 127 088 159 662 –20.4%<br />
Middle/Far East, Rest of World 415 797 524 448 –20.7%<br />
Synthetic Fibers 596 321 448 198 33.0% 37.0%<br />
Europe 74 326 73 319 1.4%<br />
North and South America 39 059 51 594 –24.3%<br />
Middle/Far East, Rest of World 482 936 323 285 49.4%<br />
Transmission Systems 363 009 380 172 –4.5% –3.7%<br />
Europe 288 492 298 743 –3.4%<br />
North and South America 60 210 72 521 –17.0%<br />
Middle/Far East, Rest of World 14 307 8 908 60.6%<br />
Discontinuing Operations (Surface Technology) 113 791 109 365 4.0% 12.2%<br />
Europe 37 937 43 237 –12.3%<br />
North and South America 59 536 57 788 3.0%<br />
Middle/Far East, Rest of World 16 318 8 340 95.7%<br />
Total Saurer 1 709 434 1 791 418 –4.6% –1.6%<br />
Europe 494 183 584 872 –15.5%<br />
North and South America 285 893 341 565 –16.3%<br />
Middle/Far East, Rest of World 929 358 864 981 7.4%<br />
1) adjusted for currency effects and acquisitions<br />
Order intake for 2003 closed at EUR 1 709m, EUR 82m (4.6%) under<br />
the high level of the previous year. Adjusted for currency and<br />
acquisition effects, however, order intake is reduced by only 1.6%<br />
from the prior year. This reduction results mainly from weaker demand<br />
in the natural fiber sector and consolidation in Transmission<br />
Systems, which together outweighed the gratifying market revival<br />
in the synthetic fiber sector and in Surface Technology.<br />
The continuing shift of textile business activity from Europe and<br />
America towards Asia and the Middle East was clearly evident in<br />
2003. Over 70% of textile business orders came from this region<br />
in 2003.<br />
Management’s discussion of results<br />
In Transmission Systems the order intake declined. 80% of new orders<br />
came from Europe, while orders from North America continued<br />
to suffer from the general weakness in demand for agricultural<br />
machinery.<br />
In Surface Technology the order intake was 4% up on the previous<br />
year. The North American market recovered in all business areas<br />
during the year and new orders were also booked in Asian markets.<br />
Business in Europe was just ahead of the previous year, after<br />
accounting for the sale of the European cylinder and screw business<br />
shortly before the year-end. Evidence of this positive business<br />
development was seen in a book to bill ratio of 1.06.<br />
43
Management’s discussion of results<br />
Sales development<br />
Change Adjusted change<br />
(EUR 000) 2003 2002 in % in % 1)<br />
Saurer Textile Solutions 1 275 371 1 211 521 5.3% 8.3%<br />
Natural Fibers 732 519 774 181 –5.4% –2.2%<br />
Europe 126 833 150 747 –15.9%<br />
North and South America 136 970 162 514 –15.7%<br />
Middle/Far East, Rest of World 468 716 460 920 1.7%<br />
Synthetic Fibers 542 852 437 340 24.1% 26.7%<br />
Europe 67 113 100 439 –33.2%<br />
North and South America 46 063 43 675 5.5%<br />
Middle/Far East, Rest of World 429 676 293 226 46.5%<br />
Transmission Systems 363 009 380 172 –4.5% –3.7%<br />
Europe 288 492 298 742 –3.4%<br />
North and South America 60 210 72 521 –17.0%<br />
Middle/Far East, Rest of World 14 307 8 909 60.6%<br />
Discontinuing Operations (Surface Technology) 107 494 105 799 1.6% 9.7%<br />
Europe 37 512 39 573 –5.2%<br />
North and South America 59 389 57 800 2.7%<br />
Middle/Far East, Rest of World 10 593 8 426 25.7%<br />
Total Saurer 1 745 874 1 697 492 2.9% 5.7%<br />
Europe 519 950 589 501 –11.8%<br />
North and South America 302 632 336 510 –10.1%<br />
Middle/Far East, Rest of World 923 292 771 481 19.7%<br />
1) adjusted for currency effects and acquisitions<br />
Compared to the previous year, group sales were up by EUR 48m.<br />
The cyclical decline in the natural fiber sector was more than compensated<br />
by a significant increase in the synthetic fiber business.<br />
The general shift of textile machine business away from Europe and<br />
North America towards Asia and the Middle East, apparent since<br />
1999, was clearly evident again this year. Business activity in China<br />
Order Backlog<br />
Change Adjusted change<br />
(EUR 000) 2003 2002 in % in % 1)<br />
Saurer Textile Solutions 391 393 451 315 –13.3% –10.6%<br />
Natural Fibers 128 206 235 632 –45.6% –44.0%<br />
Synthetic Fibers 263 187 215 683 22.0% 26.0%<br />
Transmission Systems – –<br />
Discontinuing Operations (Surface Technology) 17 628 14 881 18.5% 44.5%<br />
Total Saurer 409 021 466 196 –12.3% –8.8%<br />
1) adjusted for currency effects and acquisitions<br />
The high order intake of 2002 was not achieved this year because<br />
of weak demand in the natural fiber sector later in the year. Order<br />
44<br />
was more than double that of 2002. In Transmission Systems, with<br />
immediate order delivery, development of sales was equivalent to<br />
that of order intake described above. With the additional EUR 7m<br />
sales of New Castle Industries, acquired in August, Surface Technology<br />
closed the year with sales ahead of last year, despite the<br />
divestment of the European Xaloy business units late in the year.<br />
backlog was increased however in the synthetic fiber sector and in<br />
Surface Technology.
Development of Operating Result<br />
Management’s discussion of results<br />
(EUR 000) Jan–Jun Jul–Dec Total<br />
2003 46 989 41 017 88 006<br />
2002 11 745 57 608 69 353<br />
In particular, thanks to sustained cost reduction and process improvements,<br />
the operating result for 2003 exceeds that of the previous<br />
year by EUR 19m. In the last quarter the result was negatively impacted<br />
by restructuring costs (TEMPUS project). Apart from this the<br />
year showed constantly positive results at a good level of profit. Re-<br />
Results Saurer Textile Solutions<br />
(EUR 000) 2003 % 2002 %<br />
Natural Fibers (continuing operations)<br />
Sales 728 513 100.0% 764 462 100.0%<br />
Operating profit1) 54 384 7.5% 70 216 9.2%<br />
Depreciation and amortization 21 351 2.9% 23 112 3.0%<br />
EBITDA 75 735 10.4% 93 328 12.2%<br />
Natural Fibers (discontinuing operations – Parsys)<br />
Sales 4 006 100.0% 9 719 100.0%<br />
Operating profit1) –4 771 –119.1% –5 317 –54.7%<br />
Depreciation and amortization 815 20.3% 2 023 20.8%<br />
EBITDA –3 956 –98.8% –3 294 –33.9%<br />
Synthetic Fibers<br />
Sales 542 852 100.0% 437 340 100.0%<br />
Operating profit1) 9 487 1.7% –27 684 –6.3%<br />
Depreciation and amortization 15 032 2.8% 16 765 3.8%<br />
EBITDA 24 519 4.5% –10 919 –2.5%<br />
Total Saurer Textile Solutions<br />
Sales 1 275 371 100.0% 1 211 521 100.0%<br />
Operating profit1) 59 100 4.6% 37 215 3.1%<br />
Depreciation and amortization 37 198 2.9% 41 900 3.5%<br />
EBITDA 96 298 7.6% 79 115 6.5%<br />
Capital expenditure 26 869 26 222<br />
Employees (year end) 6 443 6 929<br />
1) including non-recurring income and expense (e.g. restructuring).<br />
In the natural fiber sector a good profit level was maintained<br />
despite reduced sales, reflecting <strong>successful</strong> cost management and<br />
operating flexibility.<br />
For comments regarding the various business units, please refer to<br />
the letter to shareholders at the beginning of this annual report.<br />
Production activity at Parsys came to an end as planned, after several<br />
years of restructuring.<br />
Synthetic fiber spinning profited from a real investment boom<br />
in China, and also from a revival of demand in India, Turkey and<br />
gular testing of the value of goodwill in the balance sheet showed<br />
no impairment of value, so as in 2002, no exceptional impairment<br />
charge was booked. The operating result shown above includes nonrecurring<br />
operating income (e.g. sale of businesses and real estate,<br />
net EUR 10m) and expense (e.g. restructuring costs of EUR 28m).<br />
Eastern Europe. In this market as in others, the ability to offer total<br />
solutions at the highest level of technology brings a clear competitive<br />
advantage.<br />
For comments regarding the various business units, please refer to<br />
the letter to shareholders at the beginning of this annual report.<br />
Outlook<br />
In the natural fiber sector, a reduced utilization of capacity must<br />
be expected in the first half of 2004. Thanks to the flexibility they<br />
have built up in recent years these business units will be able to<br />
45
Management’s discussion of results<br />
adapt to this cyclical swing very quickly. In the synthetic fiber<br />
business a good start into the new year can be expected, on account<br />
of the high order backlog. The TEMPUS project for improvement<br />
of business processes across the entire textile business unit will be<br />
Results Transmission Systems<br />
(EUR 000) 2003 % 2002 %<br />
Sales 363 009 100.0% 380 172 100.0%<br />
Operating profit1) 27 518 7.6% 36 391 9.6%<br />
Depreciation and amortization 29 902 8.2% 25 917 6.8%<br />
EBITDA 57 420 15.8% 62 308 16.4%<br />
Capital expenditure 20 138 19 916<br />
Employees (year end) 2 951 3 021<br />
1) including non-recurring income and expense (e.g. restructuring).<br />
For Transmission Systems 2003 was a year of consolidation.<br />
Limited demand in consumer markets for automobiles and in agricultural<br />
machinery led to a reduced business level for Graziano as<br />
supplier, and also to pressure on margins. In the Indian market the<br />
planned sales volume of synchromesh units for tractors was not attained<br />
yet. After several years of high sales growth, Graziano used<br />
the slow down to launch a series of projects: a comprehensive process<br />
reengineering program was started, integration of new businesses<br />
acquired in the previous year was completed, India was<br />
46<br />
continued as planned, with further cost reductions targeted.<br />
In 2004 and 2005 Saurer plans to further strengthen its foothold<br />
in China, with additional capital spending of EUR 20m over both<br />
years.<br />
built up to become an important production site for supply to<br />
international markets and a series of important customer projects<br />
were pushed ahead to secure future earnings.<br />
Outlook<br />
New projects in the pipeline should lead to recovery of volumes<br />
towards the end of 2004. The build-up of India will continue. A<br />
realignment of business processes, which has already started, will<br />
lead to improved efficiency and cost reductions.
Results Discontinuing Operations (Surface Technology)<br />
(EUR 000) 2003 % 2002 %<br />
Sales 107 494 100.0% 105 799 100,0%<br />
Operating profit1) 2 889 2.7% –4 006 –3.8%<br />
Depreciation and amortization 10 968 10.2% 11 415 10.8%<br />
EBITDA 13 857 12.9% 7 409 7.0%<br />
Capital expenditure 3 758 3 418<br />
Employees (year end) 871 786<br />
1) including non-recurring income and expense (e.g. restructuring).<br />
After two years of consolidation came the turnaround for Surface<br />
Technology. Xaloy, manufacturing cylinders and feed screws for<br />
plastic injection, and IonBond, offering industrial and decorative<br />
metal coatings, returned to profitability in the second half of 2003,<br />
with the help of the general economic recovery, and as a result also<br />
of restructuring programs introduced in recent years, thus building<br />
a solid base for the intended sale of these business units.<br />
A first step in this divestment was the profitable sale of the European<br />
Xaloy units in the last quarter of 2003. New Castle Industries<br />
Group, a US competitor, was acquired in August 2003 in order to<br />
eliminate over-capacity and exploit synergies in the North American<br />
market and thus pave the way for the sale of the US and Asian<br />
Xaloy business units.<br />
Financial and Group Results<br />
Management’s discussion of results<br />
(EUR 000) 2003 2002<br />
Operating profit 88 006 69 353<br />
Financial expense –17 771 –17 983<br />
Income taxes –21 716 –16 758<br />
Profit before minorities 48 519 34 612<br />
Financial expense was approximately at the same level as in the<br />
prior year. Reduction of net debt led to reduced interest cost, but<br />
this was compensated by the higher interest cost relating to pension<br />
liabilities, reduced gains from the repurchase of the convertible<br />
bond and the write-off of hedge accruals. In accordance with<br />
IonBond’s metal coating business also developed positively and<br />
achieved a good result in 2003. A slight market recovery together<br />
with significant cost reductions led to the improved result. Ion-<br />
Bond's strong position in the market was thereby confirmed and<br />
preparations are ongoing to offer new coating applications.<br />
Without the 171 employees of the acquired company New Castle,<br />
700 were employed in Surface Technology at the year-end.<br />
Outlook<br />
The divestment of Surface Technology will be pursued. Further improvement<br />
in business performance is expected in 2004 and this<br />
will support the <strong>successful</strong> sale of the remaining business units.<br />
IAS 32, interest expense amounting to EUR 4.1m was charged to<br />
the income statement for the 21 ⁄4% convertible bond although<br />
only an amount of EUR 2.1m was actually paid. The effective tax<br />
rate was lower than in the previous year despite a higher profit<br />
before tax, as a result of improved tax planning.<br />
47
Management’s discussion of results<br />
Key Figures and Ratios<br />
(EUR 000) 2003 2002<br />
Net Debt –32 377 –105 787<br />
Liquid assets 109 786 100 687<br />
Short-term debt –16 793 –44 728<br />
Convertible bond –84 818 –104 481<br />
Other long-term debt –40 552 –57 265<br />
Net Tangible Worth (equity minus goodwill) 351 066 305 543<br />
Shareholders’ equity 467 871 430 595<br />
Goodwill –116 805 –125 052<br />
EBITDA 166 195 148 697<br />
Operating profit 88 006 69 353<br />
Depreciation and amortization 78 189 79 344<br />
Ratios<br />
Debt-Equity-Ratio 6.9% 24.6%<br />
Net Debt/Tangible Worth 9.2% 34.6%<br />
Equity in % of Total Assets 37.4% 33.1%<br />
Net Tangible Worth in % of Total Assets 28.1% 23.5%<br />
Net Debt/EBITDA 19.5% 71.1%<br />
In 2003 the group again showed its ability to generate a strong<br />
operating and free cash flow. This was used mainly to reduce<br />
short-term debt and for repurchases of the convertible bond which<br />
matures in 2005. In total, Net Debt was reduced by EUR 73m, with<br />
Cash Flow<br />
(EUR 000) 2003 2002<br />
Cash flow from operating activities 125 025 144 999<br />
Capital expenditure (net of capital grants) –49 893 –49 571<br />
Free cash flow 75 132 95 428<br />
Proceeds from sale of fixed assets 12 795 15 417<br />
Acquisition of investments and intangible assets –10 983 –3 876<br />
As in the previous year the free cash flow derives mainly from operating<br />
activities. Mainly the reduction of current liabilities reduced<br />
it below the record level of the previous year. Additions and di-<br />
48<br />
the effect of improving significantly the Debt-Equity-Ratio and the<br />
Equity as % of Total Assets. This reduced debt burden and higher<br />
equity level equate to increased financial security and independence<br />
for Saurer.<br />
sposals of property, plant and equipment were slightly above those<br />
of the prior year. The acquisition of the New Castle Industries<br />
Group resulted in an increased use of funds for investments.
CONSOLIDATED FINANCIAL STATEMENTS.
Consolidated income statement for the years ended December 31,<br />
(EUR 000) Note* 2003 % 2002 %<br />
Sales 1 1 745 874 100.0 1 697 492 100.0<br />
Cost of goods sold –1 348 164 –77.2 –1 298 146 –76.5<br />
Gross profit 397 710 22.8 399 346 23.5<br />
Selling and distribution –112 602 –6.4 –129 781 –7.6<br />
Research and development –74 737 –4.3 –77 271 –4.6<br />
Administration and other 3 –123 353 –7.1 –122 941 –7.2<br />
Operating expenses<br />
Operating profit before sale of<br />
–310 692 –17.8 –329 993 –19.4<br />
discontinuing operations 4 87 018 5.0 69 353 4.1<br />
Profit on sale of discontinuing operations 2 988 – – –<br />
Operating profit 88 006 5.0 69 353 4.1<br />
Financial income (expense) 5 –17 771 –1.0 –17 983 –1.1<br />
Profit before income taxes 70 235 4.0 51 370 3.0<br />
Income taxes 6 –21 716 –1.2 –16 758 –0.9<br />
Profit before minorities 48 519 2.8 34 612 2.1<br />
Minority interests 16 –1 319 –0.1 –1 146 –0.1<br />
Net profit 47 200 2.7 33 466 2.0<br />
* For details see the notes to the consolidated financial statements, pages 58–72. These are an integral part of the consolidated financial statements.<br />
Earnings per share (EUR) 2003 2002<br />
Basic earnings per share 3.33 2.37<br />
Diluted earnings per share 3.32 2.37<br />
See note 7, page 62.<br />
51
Consolidated balance sheet as at December 31,<br />
Assets<br />
(EUR 000) Note* 2003 % 2002 %<br />
Cash 105 453 91 092<br />
Marketable securities 4 333 9 595<br />
Liquid assets 109 786 8.8 100 687 7.7<br />
Accounts receivable, trade 8 276 170 281 409<br />
Inventories 9 207 211 218 969<br />
Current income taxes 5 660 2 496<br />
Prepayments and accrued income 5 113 4 655<br />
Other receivables 67 120 62 521<br />
Current assets 671 060 53.6 670 737 51.6<br />
Financial assets 10 16 118 20 969<br />
Deferred income taxes 6 48 919 50 342<br />
Property, plant and equipment 11 395 228 430 409<br />
Intangible assets 12 119 654 128 643<br />
Non-current assets 579 919 46.4 630 363 48.4<br />
Total assets 1 250 979 100.0 1 301 100 100.0<br />
Liabilities and shareholders’ equity<br />
Short-term debt 13 283 18 304<br />
Short-term portion of long-term debt 13 16 510 26 424<br />
Accounts payable, trade 159 124 165 025<br />
Accruals and deferred income 83 223 87 450<br />
Current income taxes 19 506 9 276<br />
Short-term provisions 14 85 213 88 424<br />
Other current liabilities 70 329 89 228<br />
Current liabilities 434 188 34.7 484 131 37.2<br />
Long-term debt 13 125 370 161 746<br />
Long-term provisions 14 13 093 18 733<br />
Deferred income taxes 6 24 970 14 288<br />
Long-term employee benefits 15 178 056 175 091<br />
Other non-current liabilities 4 711 14 071<br />
Non-current liabilities 346 200 27.7 383 929 29.5<br />
Total liabilities 780 388 62.4 868 060 66.7<br />
Minority interests 16 2 720 0.2 2 445 0.2<br />
Share capital 17 110 228 119 813<br />
Group reserves 374 041 362 699<br />
Treasury shares –63 598 –85 383<br />
Net profit for the period 47 200 33 466<br />
Shareholders’ equity 467 871 37.4 430 595 33.1<br />
Total liabilities and shareholders’ equity 1 250 979 100.0 1 301 100 100.0<br />
* For details see the notes to the consolidated financial statements, pages 58–72. These are an integral part of the consolidated financial statements.<br />
52
Consolidated cash flow statement for the years ended December 31,<br />
(EUR 000)<br />
Cash flow from operating activities<br />
Note* 2003 2002<br />
Profit before taxes 70 235 51 370<br />
Depreciation and amortization 78 189 79 344<br />
Changes in net working capital 18 –26 007 16 235<br />
Other non-cash items 3 041 –5 850<br />
Interest (income) expense (net) 14 818 17 280<br />
Interest received 2 417 4 281<br />
Interest paid –6 890 –12 520<br />
Income taxes paid –10 778 –5 141<br />
Cash flow from operating activities 125 025 144 999<br />
Cash flow from investing activities<br />
Acquisition of investments (net) 19 –10 453 –1 538<br />
Loans (granted) repaid (net) –1 453 2 069<br />
Capital expenditure for tangible fixed assets –50 913 –49 571<br />
Capital expenditure for intangible assets –530 –2 338<br />
Capital grants received 1 020 –<br />
Sale (purchase) of marketable securities (net) 4 824 –3 984<br />
Proceeds from sale of fixed assets 12 795 15 417<br />
Cash flow from investing activities –44 710 –39 945<br />
Cash flow from financing activities<br />
Increase (decrease) in debt financing (net) –42 996 –103 541<br />
Repurchase of 21 ⁄4% convertible bond 2000–2005 –16 216 –29 246<br />
Dividends and net capital repayments to minority shareholders –348 –2 327<br />
Sale (purchase) of treasury shares (net) 8 207 –4 909<br />
Capital repayment to the shareholders of Saurer Ltd. –9 350 –<br />
Cash flow from financing activities –60 703 –140 023<br />
Foreign exchange differences on cash –5 251 –2 455<br />
Net increase (decrease) in cash 14 361 –37 424<br />
Cash as at January 1 91 092 128 516<br />
Cash as at December 31 105 453 91 092<br />
* For details see notes to the consolidated financial statements, pages 58–72. These are an integral part of the consolidated financial statements.<br />
53
Consolidated statement of shareholders’ equity<br />
Foreign Retained<br />
Capital currency earnings and<br />
Share and legal translation Hedging Treasury net income<br />
(EUR 000)<br />
Balance as at 1.1.2002 as<br />
capital reserves reserve reserve shares for the period Total<br />
originally reported<br />
Adjustment for goodwill<br />
119 813 129 543 22 954 –1 367 –80 681 231 526 421 788<br />
(IAS 21 revised) –4 794 –2 182 –6 976<br />
Balance as at 1.1.2002 restated 119 813 129 543 18 160 –1 367 –80 681 229 344 414 812<br />
Net profit 33 466 33 466<br />
21 ⁄4% convertible bond 2000–2005 –3 135 3 135 –<br />
Movements in cash flow hedges 2 956 2 956<br />
Foreign currency translation –15 730 –15 730<br />
Change in treasury shares 7 021 177 –4 702 –7 405 –4 909<br />
Balance as at 31.12.2002 119 813 133 429 2 607 1 589 –85 383 258 540 430 595<br />
Capital repayment –9 585 –519 754 –9 350<br />
Net profit 47 200 47 200<br />
21 ⁄4% convertible bond 2000–2005 –1 544 1 544 –<br />
Movements in cash flow hedges 4 887 4 887<br />
Foreign currency translation –13 716 48 –13 668<br />
Change in treasury shares –21 330 1 025 21 031 7 481 8 207<br />
Balance as at 31.12.2003 110 228 110 555 –10 603 6 524 –63 598 314 765 467 871<br />
In 2003 the carrying value of goodwill has been adjusted in accordance<br />
with IAS 21 (revised), which allows goodwill to be translated<br />
to the group's reporting currency at current exchange rates.<br />
Previously, goodwill was translated and fixed in the group’s reporting<br />
currency at the date of acquisition of foreign subsidiaries.<br />
From January 1, 2005 this accounting treatment will no longer be<br />
permissible under IAS 21 (revised). This change has been shown as<br />
an adjustment to the value of shareholders’ equity as at January<br />
1, 2002, and all comparative figures have been adjusted accordingly.<br />
The total amounts booked to equity in 2003 excluding capital<br />
transactions and profit for the period were EUR –574 (2002:<br />
EUR –17 683).<br />
The capital and legal reserves may not be freely distributed. Distribution<br />
of the retained earnings is subject to certain restrictions,<br />
since the retained earnings of the subsidiaries have first to be<br />
distributed to Saurer Ltd. in accordance with statutory and fiscal<br />
54<br />
regulations, before they are at the disposal of the shareholders’<br />
meeting of Saurer Ltd.<br />
Foreign currency translation adjustments arise from changes in the<br />
exchange rates used to translate the opening equity and net result<br />
of group companies that report in currencies other than the Euro,<br />
as well as foreign exchange differences on long-term intercompany<br />
loans of an investment nature. Share capital and treasury<br />
shares are denominated in Swiss Francs and translated to Euros at<br />
historical exchange rates.<br />
The proposal of the Board of Directors for the appropriation of the<br />
retained earnings of Saurer Ltd. is presented on page 84.<br />
Details of the movement in the hedging reserve are shown in Note 23.<br />
For share statistics see page 111.<br />
For details of treasury share transactions see Note 17.
Organization and business activity<br />
Saurer Ltd. is a corporation organized under the laws of Switzerland<br />
with legal domicile in Arbon. The main activities of Saurer<br />
Textile Solutions are the development, manufacture and sale of<br />
textile systems and of Transmission Systems the development,<br />
manufacture and sale of transmission systems. The Surface Technology<br />
Division is to be divested in the near future and for that reason<br />
is shown as Discontinuing Operations. Saurer operates worldwide.<br />
Organizational changes within the scope of consolidation<br />
During the year under review the minority shareholders of <strong>Barmag</strong><br />
AG, Remscheid, Germany were bought out. Subsequently <strong>Barmag</strong><br />
AG and the following companies were merged into W. Schlafhorst<br />
AG & Co, which was renamed to Saurer GmbH & Co KG: Neumag<br />
GmbH & Co KG, PARSYS Produktionstechnik GmbH, Saurer-Allma<br />
GmbH, Schlafhorst Autocoro GmbH, Schlafhorst Customer Support<br />
GmbH, Schlafhorst Winding Systems GmbH, Volkmann GmbH and<br />
Zinser Textilmaschinen GmbH. As of August 16, 2003 the New<br />
Castle Group, USA, was acquired. S+G Industrieschreinerei GmbH,<br />
Germany was sold effective September 30, 2003. The activities of<br />
Xaloy Olten, Switzerland, and Xaloy Czech s.r.o., Czech Republic,<br />
were sold on November 30, 2003.<br />
Principles for the consolidated financial statements<br />
General principles and accounting standards The consolidated<br />
financial statements are based on the financial statements of<br />
the individual group companies which have been drawn up in accordance<br />
with standardized accounting principles. The accounts<br />
are, in general, based on the historical cost convention. The consolidated<br />
financial statements and the individual financial statements<br />
of all companies are prepared in accordance with International<br />
Financial Reporting Standards, including International<br />
Accounting Standards and Interpretations issued by the International<br />
Accounting Standards Board (IASB).<br />
Presentation For the first time in 2003 the consolidated financial<br />
statements are presented in Euros. This reflects the fact that the<br />
Euro is the functional currency of the major part of Saurer’s business.<br />
Change in accounting principles In 2003 the carrying value of<br />
goodwill has been adjusted in accordance with IAS 21 (revised)<br />
which allows goodwill to be translated to the group’s reporting<br />
currency at current exchange rates. Previously, goodwill was translated<br />
and fixed in the group’s reporting currency at the date of<br />
acquisition of foreign subsidiaries. From January 1, 2005 this<br />
accounting treatment will no longer be permissible under IAS 21<br />
(revised). This change has been shown as an adjustment to the<br />
value of shareholders’ equity as at January 1, 2002, and all comparative<br />
figures have been adjusted accordingly.<br />
Principles of consolidation<br />
Scope of consolidation The consolidated financial statements<br />
of Saurer Ltd. include all subsidiaries in which Saurer Ltd. directly<br />
Accounting principles<br />
or indirectly controls more than 50% of the votes and the share<br />
capital. Companies acquired during the year under review are<br />
included in the consolidation as from the date of acquisition.<br />
Companies which are divested are deconsolidated as of the date<br />
when control passes to the acquiror.<br />
Investments of between 20% and 50% (associated companies), in<br />
which the group exercises a significant influence, are included in<br />
the consolidated financial statements in accordance with the<br />
equity method.<br />
Intercompany receivables, payables, transactions and cash flows<br />
are eliminated.<br />
Full consolidation In the case of consolidated subsidiaries with<br />
minority interests, 100% of all balance sheet and income statement<br />
items are included in the consolidated financial statements.<br />
The interests of third-party minority shareholders are shown separately<br />
in the balance sheet and income statement.<br />
Capital consolidation The capital consolidation is based on the Anglo-Saxon<br />
purchase method. The assets and liabilities of newly acquired<br />
subsidiaries are included at their fair values in the consolidated<br />
financial statements as from the date of acquisition. In the case<br />
of companies acquired during the year, the income earned prior to<br />
the acquisition is not included in the consolidated income statement.<br />
Intercompany profits Profits resulting from intercompany sales<br />
are eliminated insofar as the products and services concerned were<br />
not delivered to third parties on the balance sheet date.<br />
Valuation and accounting principles<br />
Foreign currency translation Business transactions in foreign<br />
currencies are translated into the respective local currency at the<br />
exchange rate ruling on the day of transaction, and monetary assets<br />
and liabilities at the year-end balance sheet rate. The resulting<br />
profits and losses are included in the income statement, with the<br />
exception of exchange differences on intercompany loans of an investment<br />
nature, which are taken directly to shareholders’ equity.<br />
At the year-end the balance sheets of non-Euro subsidiaries are<br />
translated into Euros at the year-end exchange rate, whilst the<br />
income statements and cash flow statements are translated into<br />
Euros at annual average rates. Any difference arising thereon is not<br />
included in the income statement, but taken directly to shareholders’<br />
equity. In the event of the divestment of a subsidiary, the<br />
relevant cumulative exchange rate differences from the sale are<br />
included in the income statement.<br />
Financial risk management Saurer’s international activities expose<br />
it to a variety of market risks, including currency risks. An overall<br />
risk management program coordinated by central corporate treasury<br />
staff seeks to minimize the effects of unpredictable financial<br />
markets on the financial results of the group.<br />
Currency risks, which due to the group’s activities mainly arise in<br />
U.S. Dollars, are hedged by using forward contracts.<br />
Foreign currency risks which arise from the translation of income<br />
statement and balance sheet items of foreign consolidated companies<br />
are generally not hedged.<br />
55
Accounting principles<br />
Interest risks The group’s liquid assets are invested on a shortterm<br />
basis. The group’s income and operating cash flows are substantially<br />
independent of changes in market interest, and interest<br />
exposures are generally not hedged.<br />
Credit risks Liquid assets are placed short-term with first-class<br />
banks only. The credit risk pertaining to accounts receivable is limited<br />
by the wide spread of <strong>customers</strong>, both geographically and<br />
by business activity. International accounts receivable, mainly in<br />
the textile business, are to a large extent secured by letters of credit<br />
and government export credit guarantees.<br />
Commodity price risks The price risks related to commodities<br />
used in Saurer products are low.<br />
Composition and valuation of balance sheet items<br />
Cash includes cash in hand, balances in postal and bank accounts,<br />
as well as short-term money market funds.<br />
Marketable securities are shown at year-end market value.<br />
Changes in value are included in the income statement.<br />
Accounts receivable, trade and other receivables are included at<br />
face value, less specific provisions where appropriate.<br />
Inventories Raw materials are valued at the lower of cost and<br />
market, using the FIFO or weighted average cost method. Finished<br />
goods and work in process are valued at production cost, reduced<br />
to net realizable value should this be lower than cost. Provisions<br />
are made for items of reduced salability and excess stocks. Customer<br />
payments on account are deducted from inventories.<br />
Financial assets are included at cost less provisions for permanent<br />
impairment of value.<br />
Financial Instruments Derivative financial instruments are<br />
recorded at cost and are subsequently adjusted to fair value. With<br />
the exception of financial instruments which hedge a forecasted<br />
transaction (cash flow hedges), all adjustments in fair values are<br />
included in income.<br />
The purpose of hedge accounting is to match the impact of the<br />
hedged item and the hedging instrument in the income statement.<br />
To qualify for hedge accounting, the hedging relationship must<br />
meet several strict conditions concerning documentation, hedge<br />
effectiveness and reliability of measurement. If these conditions<br />
are not met, the transaction does not qualify as a hedge for<br />
accounting purposes. In this event fair value adjustments to the<br />
value of the derivative and the hedged item are made through the<br />
income statement.<br />
Saurer uses hedge accounting exclusively for cash flow hedges.<br />
These are used to secure future cash flows which have a high probability<br />
of occurring. The hedge instrument is recorded on the balance<br />
sheet at fair value (replacement cost) and any subsequent<br />
adjustments are booked in the hedging reserve in shareholders’<br />
equity. If the hedge relates to a transaction which will subsequently<br />
be recorded on the balance sheet, the adjustments cumulated<br />
under shareholders’ equity at that time will be included in<br />
the initial book value of the asset or liability. In all other cases the<br />
cumulative changes in fair value of the hedging instrument that<br />
56<br />
have been recorded in equity are included as a charge or credit to<br />
income when the forecasted transaction is recognized.<br />
Property, plant and equipment is carried at purchase or production<br />
cost less appropriate depreciation. In the case of an impairment<br />
loss the appropriate charge is made to income. Depreciation<br />
is charged on a straight-line basis over the following periods:<br />
Furniture, fittings and equipment<br />
Years<br />
5–12<br />
IT, office equipment 3–7<br />
Vehicles, tools 4–6<br />
Machinery 6–10<br />
Buildings : – exterior constructions 30–60<br />
– interior constructions 12–25<br />
Repair and maintenance costs are expensed directly to the income<br />
statement. Costs which give rise to an increase in value are capitalized<br />
and depreciated over the remaining useful life of the assets.<br />
Financing costs incurred in respect of the construction of property,<br />
plant and equipment are taken directly to the income statement.<br />
Leased equipment Property, plant and equipment financed<br />
through long-term financial leasing contracts, and for which the<br />
company bears the major risks (financial leasing), is capitalized and<br />
depreciated like other fixed assets. The present value of the corresponding<br />
lease obligations is included as a liability under longterm<br />
liabilities.<br />
Rental costs for short-term operational leases are charged directly<br />
to the income statement. Operating leases are not included in the<br />
balance sheet; the corresponding obligations are fully reported in<br />
the notes.<br />
Goodwill is the excess of the acquisition price of investments over<br />
the related equity value at the date of acquisition and is amortized<br />
to the income statement over a maximum period of 20 years.<br />
Amortization periods in excess of 5 years are only used in the case<br />
of strategic acquisitions where a sustainable expansion of market<br />
share can be expected. In the case of the acquisition of a non-Euro<br />
company, any goodwill arising is treated as an asset of that company,<br />
held in the related currency and translated into Euros at the<br />
closing rate for the year. The amortization of goodwill is included<br />
in administration and other expenses.<br />
The carrying value of goodwill is reviewed at least annually for all<br />
investments and, if a risk of impairment is seen, a detailed valuation<br />
is performed using Discounted Cash Flow analysis over a fiveyear<br />
period. If required, adjustments are then made to reduce the<br />
carrying values of goodwill for the investments affected.<br />
Where an acquisition gives rise to negative goodwill this is released<br />
to income over a period calculated to match any related costs.<br />
The release to income is recorded together with goodwill amortization<br />
in administration and other expense.<br />
Patents, licenses and trademarks are capitalized at cost and are<br />
written off on a straight-line basis over their useful life, not exceeding<br />
10 years.
Provisions are set up for current legal and actual liabilities which<br />
are attributable to events in the past. The amount of the provisions<br />
is based on the expected use of funds for covering the liabilities.<br />
Retirement and other employee benefits Saurer companies<br />
operate various plans for providing employees with retirement benefits,<br />
which conform to local circumstances and practice in the<br />
countries concerned.<br />
These include defined benefit and defined contribution plans, under<br />
which benefits are provided through separate funds, insurance<br />
plans or unfunded arrangements. For defined benefit plans, the<br />
amount charged to the income statement consists of current service<br />
cost which includes the normal cost of financing benefits in<br />
respect of future years of service as well as net interest on the assets<br />
or obligations. Contributions to defined contribution pension<br />
schemes are charged to the income statement as incurred.<br />
For funded plans, plan assets are held separately from those of the<br />
group in independently administered funds. The group’s liability to<br />
pay future retirement benefits is determined using the “projected<br />
unit credit method” in accordance with IAS 19 (revised), and is<br />
provided in the group’s balance sheet. Actuarial gains and losses<br />
are amortized over the average remaining period of employment,<br />
insofar as they exceed 10% of the higher amount of the present<br />
value of the benefits and of the plan assets.<br />
The additional costs for early retirement and reduced working<br />
h<strong>our</strong>s are provided for at the time of the respective agreement.<br />
Employee stock options are issued with exercise prices equivalent<br />
to market prices at the date of issue and therefore no charge<br />
is made to income at the date of issue. On the exercise of the option,<br />
the difference between the exercise and market prices is offset<br />
by an equivalent gain on the sale of treasury shares.<br />
Accounting principles<br />
Convertible bond The convertible bond includes a liability and<br />
an equity component. At the time of issue the equity component<br />
is booked directly to shareholders’ equity. The difference between<br />
the liability and the nominal value is treated as interest expense<br />
over the duration of the loan.<br />
Other assets and liabilities are reported at their nominal or<br />
market value.<br />
Composition of items in the income statement<br />
Sales Revenues from products sold or services rendered are stated<br />
without turnover or value added tax, net of allowances, and are<br />
recognized when title is passed to the customer, which is generally<br />
on shipment.<br />
Research and development Research and development costs<br />
are charged to the income statement insofar as the conditions for<br />
capitalization in accordance with IAS 38 are not fulfilled. Only the<br />
costs for the development of new products and the further development<br />
of existing products are included.<br />
Income taxes Liabilities for taxes on income are calculated and<br />
provided for, irrespective of their maturity, on the basis of the<br />
expected tax rates of the relevant companies. Deferred taxes on<br />
differences between group and tax valuations as well as eliminations<br />
with an effect on the income statement are accounted for in<br />
accordance with the liability method. Deferred tax assets and liabilities<br />
are offset insofar as this is legally permissible.<br />
Tax effects from tax loss carry forwards are taken into account if it<br />
can be reasonably expected that they will be realized.<br />
Provisions for non-recoverable withholding taxes are set up in respect<br />
of retained earnings at group companies, as soon as a distribution<br />
of profits is planned.<br />
57
Notes to the consolidated financial statements<br />
Except where otherwise noted, currency amounts are stated in EUR 000<br />
1 Segment information<br />
Saurer Textile Solutions is active in the development and manufacture<br />
of yarn-making solutions for the natural and synthetic<br />
fiber industry; Transmission Systems is engaged in the development<br />
and manufacture of transmission systems for motor vehicles.<br />
Surface Technology is to be divested and is therefore shown<br />
as discontinuing operations. Saurer Textile Solutions includes real<br />
By division:<br />
58<br />
estate in Arbon, Switzerland, which was previously included in<br />
Corporate and Other. The prior year figures have been adjusted<br />
accordingly. The difference between the segment operating result<br />
and the net profit for the group is shown in the consolidated<br />
income statement. There are no significant sales transactions between<br />
the divisions.<br />
Saurer Textile Solutions 2003 % 2002 %<br />
Sales 1 275 371 100.0 1 211 521 100.0<br />
Operating profit 59 100 4.6 37 215 3.1<br />
Research and development 66 310 5.2 69 517 5.7<br />
Capital expenditure for tangible fixed assets 26 869 26 222<br />
Depreciation and amortization 37 198 41 900<br />
Segment assets (operating assets) 649 654 676 068<br />
Segment liabilities (operating liabilities) 310 613 330 321<br />
Transmission Systems<br />
Sales 363 009 100.0 380 172 100.0<br />
Operating profit 27 518 7.6 36 391 9.6<br />
Research and development 4 480 1.2 3 642 1.0<br />
Capital expenditure for tangible fixed assets 20 138 19 916<br />
Depreciation and amortization 29 902 25 917<br />
Segment assets (operating assets) 330 319 357 138<br />
Segment liabilities (operating liabilities) 95 851 121 940<br />
Discontinuing Operations (Surface Technology)<br />
Sales 107 494 100.0 105 799 100.0<br />
Operating profit (loss) 2 889 2.7 –4 006 –3.8<br />
Research and development 3 947 3.7 4 112 3.9<br />
Capital expenditure for tangible fixed assets 3 758 3 418<br />
Depreciation and amortization 10 968 11 415<br />
Segment assets (operating assets) 89 970 102 568<br />
Segment liabilities (operating liabilities) 15 087 20 967<br />
Corporate and Other<br />
Operating profit (loss) –1 501 –247<br />
Capital expenditure for tangible fixed assets 148 15<br />
Depreciation and amortization 121 112<br />
Segment assets (operating assets) 2 858 4 275<br />
Segment liabilities (operating liabilities) 3 338 3 145
By division (continued)<br />
Notes to the consolidated financial statements<br />
Total Saurer 2003 % 2002 %<br />
Sales 1 745 874 100.0 1 697 492 100.0<br />
Operating profit 88 006 5.0 69 353 4.1<br />
Research and development 74 737 4.3 77 271 4.6<br />
Capital expenditure for tangible fixed assets 50 913 49 571<br />
Depreciation and amortization 78 189 79 344<br />
Segment assets (operating assets) 1 072 801 1 140 049<br />
Unallocated assets/eliminations 178 178 161 051<br />
Total assets 1 250 979 1 301 100<br />
Segment liabilities (operating liabilities) 424 889 476 373<br />
Unallocated liabilities/eliminations 355 499 391 687<br />
Total liabilities 780 388 868 060<br />
By geographical region: 2003 2002<br />
Sales (by location of customer) 1 745 874 1 697 492<br />
Europe 519 951 589 496<br />
NAFTA 226 992 284 679<br />
South America 75 639 51 833<br />
Africa, Middle East 275 607 318 687<br />
Far East, Asia 647 685 452 797<br />
Capital expenditure for tangible fixed assets 50 913 49 571<br />
Europe 44 303 38 850<br />
NAFTA 2 131 2 998<br />
South America 61 62<br />
Africa, Middle East – –<br />
Far East, Asia 4 418 7 661<br />
Total Assets 1 250 979 1 301 100<br />
Europe 1 084 035 1 123 976<br />
NAFTA 106 198 121 617<br />
South America 2 125 2 167<br />
Africa, Middle East – –<br />
Far East, Asia 58 621 53 340<br />
59
Notes to the consolidated financial statements<br />
2 Discontinuing Operations – Surface Technology 2003 2002<br />
Order income 113 790 109 365<br />
Sales 107 494 105 799<br />
Operating profit (loss) before sale of discontinuing operations 1 901 –4 006<br />
Profit on sale of discontinuing operations 988 –<br />
Operating profit (loss) 2 889 –4 006<br />
Financial income (expense) –889 –4 594<br />
Profit (loss) before taxes 2 000 –8 600<br />
Income taxes 283 2 943<br />
Net profit (loss) 2 283 –5 657<br />
Total assets 113 209 106 103<br />
Total liabilities 85 670 48 816<br />
Cash flow from operating activities 5 003 4 259<br />
Cash flow from investing activities –7 378 –1 712<br />
Cash flow from investing activities –3 154 –1 368<br />
Employees as at December 31 871 786<br />
By Resolution dated October 4, 2002, the Board of Directors of<br />
Saurer confirmed its intention to divest Surface Technology. Xaloy<br />
Europe was sold on November 30, 2003 and the remaining business<br />
activities are expected to be sold during 2004.<br />
3 Administration and other 2003 2002<br />
Administration and other includes the following items:<br />
Amortization of goodwill –7 566 –6 263<br />
Gain on sale of real estate 5 439 7 344<br />
Gain on sale of business, excluding discontinued operations 38 –<br />
Restructuring costs –27 516 –29 269<br />
4 Operating profit before sale of discontinuing operations 2003 2002<br />
The operating profit before sale of discontinuing operations is stated after deducting the following:<br />
Wages and salaries –385 694 –408 447<br />
Social expenses and other personnel expenses –106 382 –105 351<br />
Personnel expenses –492 076 –513 798<br />
Cost of materials –763 958 –706 225<br />
Depreciation and amortization –78 189 –79 344<br />
Payments made under operating leases –8 045 –7 848<br />
Rental expense – non-cancellable rental contracts –5 747 –6 201<br />
60<br />
The profit on sale of discontinuing operations had no material<br />
effect on the income taxes for the period.
Notes to the consolidated financial statements<br />
5 Financial income (expense) 2003 2002<br />
Income (expense) from marketable securities<br />
Realized gains (losses) 175 136<br />
Unrealized gains (losses) –6 128<br />
Total income (expense) from marketable securities 169 264<br />
Interest expense from 21 ⁄ 4% convertible bond 2000–2005 (Note 13) –4 064 –5 498<br />
Interest expense from pension plans (Note 15) –8 174 –6 290<br />
Other interest expense –4 624 –9 755<br />
Interest income 2 044 4 263<br />
Income (expense) from investments 444 81<br />
Expenses from foreign exchange differences (net) –1 015 –4 270<br />
Gain (loss) on repurchases of convertible bond (Note 13) –533 3 285<br />
Other financial income (expense) net –2 018 –63<br />
Total financial income (expense) –17 771 –17 983<br />
Interest expense relating to the 21 ⁄ 4% convertible bond 2000–<br />
2005 is shown as for an equivalent loan without conversion rights,<br />
in accordance with IAS 32. The gain (loss) on repurchase of con-<br />
6 Income taxes 2003 2002<br />
Current income taxes –14 880 –15 318<br />
Deferred income taxes –6 836 –1 440<br />
Total income taxes –21 716 –16 758<br />
Using the maximum tax rate of 24.0% (2002: 24.2 %) at the company's<br />
headquarter location (Saurer Ltd., Arbon, Switzerland) applied<br />
to the profit before tax of EUR 70.2 million (2002: EUR 51.4<br />
vertible bond represents the difference between the liability value<br />
repurchased and the cash price paid (see details in Note 13).<br />
million), an expected tax charge of EUR 16.9 million (2002: EUR<br />
12.4 million) results. The effective tax charge differs from the<br />
expected tax charge for the following reasons:<br />
Profit before taxes 70 235 51 370<br />
Maximum tax rate 24.0% 24.2%<br />
Expected tax charge –16 856 –12 432<br />
Variance due to differing local tax rates –5 859 –4 897<br />
–22 715 –17 329<br />
Effect of expenses not accepted for tax purposes (including amortization of goodwill) –2 238 –9 122<br />
Prior year taxes –1 565 –1 374<br />
Effect of tax losses 2 950 17 440<br />
Effect of changes in tax rate –962 491<br />
Other influences 2 814 –6 864<br />
Effective tax charge –21 716 –16 758<br />
Effective tax rate 30.9% 32.6%<br />
61
Notes to the consolidated financial statements<br />
Deferred tax assets and liabilities arise due to differences between the group and tax valuations in the following balance sheet items:<br />
31.12.03 31.12.02<br />
Tax Tax Tax Tax<br />
assets liabilities assets liabilities<br />
Assets<br />
Accounts receivable 2 598 1 252 2 347 2 677<br />
Inventories 4 449 694 5 716 1 300<br />
Financial assets 632 8 840 2 061 17 051<br />
Property, plant and equipment 10 383 39 448 9 599 35 322<br />
Intangible assets<br />
Liabilities<br />
52 323 222 45 524 –<br />
Accounts payable 1 656 59 488 –<br />
Other short-term liabilities 4 197 4 377 6 060 2 400<br />
Long-term provisions including pension liabilities 17 306 2 643 17 881 1 837<br />
Other long term liabilities 6 071 5 309 4 918 2 362<br />
Deferred taxes from timing differences 99 615 62 844 94 594 62 949<br />
Offset of deferred tax assets and liabilities –37 874 –37 874 –48 661 –48 661<br />
Net deferred taxes from timing differences 61 741 24 970 45 933 14 288<br />
Deferred tax assets deriving from tax loss carryforwards 39 872 – 57 933 –<br />
Valuation allowances –52 694 – –53 524 –<br />
Total deferred taxes 48 919 24 970 50 342 14 288<br />
As at December 31, 2003 the company had tax loss carryforwards<br />
totaling EUR 120 million (2002: EUR 165 million)<br />
with a tax value of EUR 40 million (2002: EUR 58 million).<br />
7 Earnings per share 2003 2002<br />
Net profit attributable to shareholders 47 200 33 466<br />
Average number of ordinary shares 15 430 000 15 430 000<br />
less: treasury shares (average) –1 271 127 –1 318 298<br />
Average number of shares in circulation 14 158 873 14 111 702<br />
Dilutive effect of employee stock options 63 470 37 696<br />
Dilutive effect of convertible bond<br />
Average number of shares outstanding<br />
– –<br />
for the calculation of diluted earnings 14 222 343 14 149 398<br />
Basic earnings per share (EUR) 3.33 2.37<br />
Diluted earnings per share (EUR) 3.32 2.37<br />
8 Accounts receivable, trade 31.12.03 31.12.02<br />
Total accounts receivable, trade 276 170 281 409<br />
of which bills of exchange 8 402 6 539<br />
62<br />
Of these, EUR 3 million expire by the year 2006 and a further<br />
EUR 3 million by the year 2010. The remaining EUR 114<br />
million may be utilized after 2010.
Notes to the consolidated financial statements<br />
9 Inventories 31.12.03 31.12.02<br />
Raw materials 109 990 102 968<br />
Work in process 155 049 106 253<br />
Finished goods 68 672 81 766<br />
Total 333 711 290 987<br />
Customer payments on account –126 500 –72 018<br />
Total inventories (net) 207 211 218 969<br />
10 Financial assets 31.12.03 31.12.02<br />
Non-consolidated investments 3 099 4 036<br />
Loans 5 228 4 418<br />
Capitalized pension surplus (Note 15) 4 750 9 625<br />
Other financial assets 3 041 2 890<br />
Total financial assets 16 118 20 969<br />
11 Property, plant and equipment 2003 2002<br />
Land and Machinery and<br />
Prepayments,<br />
assets under<br />
buildings equipment construction Total Total<br />
Cost<br />
Balance as at January 1 439 749 883 472 13 268 1 336 489 1 414 152<br />
Additions 4 856 36 976 9 081 50 913 49 571<br />
Disposals –29 915 –73 469 – –103 384 –94 317<br />
Transfers – 13 146 –13 146 – –<br />
Change in scope of consolidation 4 733 –19 644 – –14 911 –2 990<br />
Foreign currency translation –13 499 –27 722 –425 –41 646 –29 927<br />
Balance as at December 31 405 924 812 759 8 778 1 227 461 1 336 489<br />
Accumulated depreciation<br />
Balance as at January 1 –231 625 –674 455 – –906 080 –935 740<br />
Depreciation –8 361 –61 412 – –69 773 –72 214<br />
Disposals 26 839 69 020 – 95 859 84 274<br />
Change in scope of consolidation – 20 998 – 20 998 321<br />
Foreign currency translation 7 602 19 161 – 26 763 17 279<br />
Balance as at December 31 –205 545 –626 688 – –832 233 –906 080<br />
Property, plant and equipment, net<br />
Balance as at January 1 208 124 209 017 13 268 430 409 478 412<br />
Balance as at December 31 200 379 186 071 8 778 395 228 430 409<br />
Value of leased assets 30 818 4 601 – 35 419 29 136<br />
Insured values 621 762 1 144 988 – 1 766 750 1 994 853<br />
Assets pledged as collateral 81 496 84 144<br />
Saurer owns a number of industrial sites and office buildings which<br />
are no longer necessary for its operations. The value of these properties<br />
is largely dependent on their future use, and for this reason<br />
it is not possible to <strong>make</strong> a reliable estimate of their fair value.<br />
However, based on market estimates, the proceeds from the possible<br />
sale of these properties are expected to be in excess of their<br />
book values.<br />
63
Notes to the consolidated financial statements<br />
12 Intangible assets 2003 2002<br />
Cost<br />
Goodwill Patents etc. Total Total<br />
Balance as at January 1 232 946 8 794 241 740 250 054<br />
Additions 1 869 530 2 399 660<br />
Disposals – –13 –13 –253<br />
Foreign currency translation –8 155 –836 –8 991 –8 721<br />
Balance as at December 31 226 660 8 475 235 135 241 740<br />
Accumulated amortization<br />
Balance as at January 1 –106 069 –5 203 –111 272 –107 124<br />
Amortization –9 001 –850 - 9 851 –10 139<br />
Disposals – 13 13 170<br />
Foreign currency translation 5 500 414 5 914 5 821<br />
Balance as at December 31 –109 570 –5 626 –115 196 –111 272<br />
Negative Goodwill – at cost<br />
Balance as at January 1 –7 459 –7 459 –7 826<br />
Arising on acquisition – – –159<br />
Foreign currency translation 533 533 526<br />
Balance as at December 31 –6 926 –6 926 –7 459<br />
Negative Goodwill – amortization<br />
Balance as at January 1 5 634 5 634 2 935<br />
Recognized as income in period 1 435 1 435 3 009<br />
Foreign currency translation –428 –428 –310<br />
Balance as at December 31 6 641 6 641 5 634<br />
Intangible assets, net<br />
Balance as at January 1 125 052 3 591 128 643 138 039<br />
Balance as at December 31 116 805 2 849 119 654 128 643<br />
The negative goodwill of EUR 7 459 arose on the acquisition of<br />
Graziano Trasmissioni CH Ltd. in 2001 and is being recognized as<br />
income over three years on a degressive scale. This will match the<br />
13 Debt 31.12.03 31.12.02<br />
Loans, mortgages and leasing liabilities secured over land and buildings 32 287 39 343<br />
Unsecured loans 24 775 44 346<br />
21 ⁄4% convertible bond 2000–2005 84 818 104 481<br />
Total long-term debt 141 880 188 170<br />
Short-term debt 283 18 304<br />
Total debt 142 163 206 474<br />
The book values of the assets pledged to secure the loans amount to EUR 81 496 (2002: EUR 84 144).<br />
64<br />
expected timing of costs required to restructure the company. The<br />
release to income is set off against goodwill amortization in other<br />
expense.
Notes to the consolidated financial statements<br />
31.12.03 31.12.02<br />
Bank Finance Convertible<br />
Maturities of long-term debt<br />
Within 1 year<br />
loans Mortgages leases bond Total Total<br />
(short-term portion) 9 720 2 788 4 002 – 16 510 26 424<br />
1 to 2 years 5 671 320 3 977 84 818 94 786 17 103<br />
2 to 5 years 7 774 – 12 315 – 20 089 131 698<br />
After 5 years 1 610 – 8 885 – 10 495 12 945<br />
Total long-term portion 15 055 320 25 177 84 818 125 370 161 746<br />
Total long-term debt 24 775 3 108 29 179 84 818 141 880 188 170<br />
Short-term and long-term debt by currency<br />
EUR 51 906 73 053<br />
USD 173 14 600<br />
CHF 87 981 108 244<br />
Other currencies 2 103 10 577<br />
Total 142 163 206 474<br />
Conditions of the 21 ⁄4% convertible bond 2000-2005 with an original<br />
issued amount of CHF 230 million:<br />
Each bond with a nominal value of CHF 5 000.00 can be converted<br />
from June 26, 2000 up to maturity on June 26, 2005 or at an<br />
earlier repayment date, free of charge into 39.68254 registered<br />
shares of Saurer Ltd. with a nominal value of CHF 11.50 each. The<br />
conversion price is CHF 126.00 per registered share. For fulfillment<br />
of the conversion right 1 825 400 registered shares of Saurer Ltd.<br />
with a nominal value of CHF 11.50 each have been reserved from<br />
conditional capital (resolution of the General Meeting of Shareholders<br />
of May 17, 2000). In accordance with IAS 32 the conversion<br />
right is valued separately and reported in shareholders' equity.<br />
In subsequent periods the liability component continues to be<br />
presented on the amortized cost basis, until extinguished on conversion<br />
or maturity of the bond. The equity conversion component<br />
was determined on the issue of the bond and is not changed in<br />
subsequent periods.<br />
The convertible bond is reported as follows in the balance sheet: 2003 2002<br />
Valuation of the liability as at January 1 104 481 131 476<br />
Bond stock repurchased –15 683 –32 530<br />
Amortization of issue costs 714 739<br />
Interest expense (Note 5) 4 064 5 498<br />
Interest at 21 ⁄4% –2 144 –2 945<br />
Foreign currency translation –6 614 2 243<br />
Valuation of the liability as at December 31 84 818 104 481<br />
The market value of the convertible bond stock was 100.05% of<br />
the nominal value as at December 31, 2003 (2002: 97.75%). The<br />
calculation of interest expense for the convertible bond is based on<br />
the effective market yield and the relative coupon of an equivalent<br />
bond without conversion right at the time of issue.<br />
During 2003, bond stock with a nominal value of CHF 25 000/<br />
EUR 16 442 was repurchased (2002: CHF 50 720/EUR 34 572). The<br />
value of the conversion rights, shown separately in shareholders’<br />
equity, was reduced in proportion to the nominal value of bond<br />
stock repurchased. The transaction resulted in a loss of EUR 533<br />
(2002: gain of EUR 3 285) (Note 5). The nominal value of the outstanding<br />
convertible bond at December 31, 2003 was CHF 138 100/<br />
EUR 88 645 (2002: CHF 163 100/EUR 112 127).<br />
65
Notes to the consolidated financial statements<br />
14 Provisions 2003 2002<br />
Warranty Restruccosts<br />
turing Other Total Total<br />
Short-term provisions 26 385 32 999 29 040 88 424 82 707<br />
Long-term provisions 2 725 3 395 12 613 18 733 20 745<br />
Balance as at January 1 29 110 36 394 41 653 107 157 103 452<br />
Charge to income 16 949 25 722 16 225 58 896 50 804<br />
Utilization –11 808 –24 558 –12 266 –48 632 –36 308<br />
Release to income<br />
Reclass within provisions and<br />
–2 801 –2 443 –4 678 –9 922 –11 971<br />
(to) from other liabilities – – 25 –9 384 –9 409 1 961<br />
Change in the scope of consolidation 270 982 – 1 252 –<br />
Foreign currency translation –449 –371 –216 –1 036 –781<br />
Balance as at December 31 31 271 35 701 31 334 98 306 107 157<br />
Short-term provisions 28 982 33 219 23 012 85 213 88 424<br />
Long-term provisions 2 289 2 482 8 322 13 093 18 733<br />
Short-term provisions are expected to be utilized during 2004. Long-term provisions are expected to be utilized as follows:<br />
1 to 2 years 1 345 1 638 2 042 5 025 10 280<br />
2 to 5 years 944 844 5 509 7 297 7 525<br />
After 5 years 771 771 928<br />
Warranty provisions are calculated on the basis of current year sales<br />
volumes, adjusted for individual claims and experience of warranty<br />
costs in prior years. Restructuring provisions are made only for<br />
significant one-time projects which have been detailed, documented<br />
and communicated in accordance with IAS 37.<br />
Major restructuring projects were initiated in 2002 within Saurer<br />
Textile Solutions, and further restructuring measures were laun-<br />
15 Long-term employee benefits 31.12.03 31.12.02<br />
Retirement and other post-employment benefits 159 731 156 909<br />
Other long-term employee benefits 18 325 18 182<br />
Total long-term employee benefits 178 056 175 091<br />
Obligations for retirement and other post-employment benefits<br />
Present value of funded obligations 253 020 285 213<br />
Present value of unfunded obligations 125 085 111 537<br />
Fair value of plan assets –247 802 –276 030<br />
Underfunding net 130 303 120 720<br />
Unrealized actuarial gains 4 478 11 737<br />
Pension surplus not capitalized 20 200 14 827<br />
Under (over) funding recognized in the balance sheet 154 981 147 284<br />
thereof as long-term employment benefits 159 731 156 909<br />
thereof included in financial assets (note 10) –4 750 –9 625<br />
66<br />
ched during 2003. Restructuring projects are also in process in<br />
Transmission Systems and Surface Technology. The total cost of<br />
restructuring charged to the income statement amounts to<br />
EUR 27 516 (2002: EUR 29 269).<br />
Other provisions cover various risks in the normal c<strong>our</strong>se of business<br />
as well as risks in connection with divestments and legal<br />
claims.
Notes to the consolidated financial statements<br />
Expense in income statement 2003 2002<br />
Current service cost 12 220 10 893<br />
Interest cost 17 997 18 508<br />
Expected net return on plan assets –11 749 –12 972<br />
Actuarial (gains) losses recognized in period 679 –469<br />
Employee contributions –1 344 –1 932<br />
Change in pension surplus not capitalized 672 2 415<br />
Total charged to income 18 475 16 443<br />
Service cost for defined contribution plans 944 1 332<br />
Actual return on plan assets 20 097 14 938<br />
Development of balance sheet obligations 2003 2002<br />
Balance as at January 1 156 909 130 267<br />
Transfer from other long-term employee benefits (“TFR”) – 30 375<br />
Curtailments and settlements – –7 240<br />
Total pension expense as above 18 475 16 443<br />
Employer’s contributions –5 833 –3 778<br />
Pensions paid from unfunded plans –9 854 –9 121<br />
Foreign currency translation 34 –37<br />
Balance as at December 31 159 731 156 909<br />
Assumptions used in actuarial calculations (weighted average)<br />
Discount rate 4.8% 4.7%<br />
Expected return on plan assets 4.6% 4.7%<br />
Future salary increases 2.6% 2.6%<br />
Future pension increases 1.3% 1.3%<br />
Other long-term employee benefits 2003 2002<br />
Balance as at January 1 18 182 48 142<br />
Transfer to post-employment benefits (“TFR”) – –30 375<br />
Service cost 8 545 5 229<br />
Benefits paid –6 315 –3 934<br />
Curtailments and settlements –1 930 –<br />
Reclassification from other liabilities 326 –<br />
Foreign currency translation –483 –880<br />
Balance as at December 31 18 325 18 182<br />
Pension costs are included with personnel costs in the relevant income<br />
statement captions. The interest cost from unfunded pension<br />
plans and certain funded pension plans is shown as a financial<br />
expense (Note 5). In 2002 the Italian accounting profession deter-<br />
mined that the ‘Trattamento di fine rapporto’ (“TFR”) – the staff<br />
leaving indemnity – should be treated as a post-employment<br />
benefit; it was therefore reclassified accordingly in that year.<br />
67
Notes to the consolidated financial statements<br />
16 Minority interests 2003 2002<br />
Balance as at January 1 2 445 11 064<br />
Minority share of profit 1 319 1 146<br />
Dividends and net capital repayments –348 –2 328<br />
Other changes in structure –478 –6 624<br />
Foreign currency translation –218 –813<br />
Balance as at December 31 2 720 2 445<br />
Other changes in structure relate to the acquisition of minority<br />
shareholdings in the former <strong>Barmag</strong> AG as well as the sale and<br />
deconsolidation of S+G Industrieschreinerei GmbH. In 2002<br />
17 Consolidated share capital 31.12.03 31.12.02<br />
Share capital of Saurer Ltd. 110 228 119 813<br />
The share capital comprises 15 430 000 fully paid registered shares<br />
with a nominal value of CHF 11.50 (2002: CHF 12.50) each. The<br />
shares outstanding are entitled to one vote each. The share capital is<br />
translated into Euros at historical exchange rates.<br />
Details concerning the shareholders are shown in Section 1.2 on page<br />
88 of the Corporate Governance Report.<br />
Authorized Capital<br />
The Board of Directors is authorized to increase the share capital up<br />
to May 16, 2004 through the issue of a maximum of 3 000 000 fully<br />
paid up registered shares with a nominal value of CHF 11.50 each, up<br />
to the maximum amount of CHF 34 500 000. Increases through firm<br />
underwriting or in partial amounts are approved. The issue price, the<br />
period of the entitlement to dividends and the type of consideration<br />
or the contribution or underwriting in kind shall be determined by the<br />
Board of Directors. The Board of Directors is authorized to exclude the<br />
subscription right of the shareholders and to allocate them to third<br />
parties in the event of the use of shares for the purpose of the acquisition<br />
of companies, parts of companies or investments, for mergers<br />
and exchange of investments as well as in the case of a share placement<br />
for the financing of such transactions. Subscription rights not<br />
exercised shall be sold by the Board of Directors at market conditions.<br />
Conditional Capital<br />
The share capital of the company shall be increased by the maximum<br />
amount of CHF 48 875 000 through the issue of 4 250 000 fully paid<br />
Purchase and sale of treasury shares<br />
Number of registered shares<br />
2003 2002<br />
Balance as at January 1 1 378 980 1 226 070<br />
Purchase 33 751 203 617<br />
Sale –297 870 –43 707<br />
Sale from employee option programs –3 000 –7 000<br />
Balance as at December 31 1 111 861 1 378 980<br />
Treasury shares are held by Saurer Ltd. and also by a subsidiary<br />
company. 464 120 treasury shares are reserved for employee stock<br />
68<br />
the textile operations in China were restructured, whereby<br />
joint venture projects were liquidated or converted to majority<br />
shareholdings through capital reduction.<br />
up registered shares with a nominal value of CHF 11.50 each, of which<br />
a) up to an amount of CHF 34 500 000, representing 3 000 000 registered<br />
shares with a nominal value of CHF 11.50 each, will be issued<br />
through the exercise of option and conversion rights, which will be<br />
granted in connection with loans or other bonds of the company or<br />
of group companies or through the exercise of option rights granted<br />
to the shareholders;<br />
b) up to an amount of CHF 14 375 000, representing 1 250 000<br />
registered shares with a nominal value of CHF 11.50 each, which are<br />
granted to the employees of the company or of group companies as<br />
a result of the exercise of stock option rights.<br />
The subscription right of the shareholders is excluded.<br />
Shareholders’ preferential subscription rights may be limited or<br />
suspended in respect of options and convertible bonds by decision of<br />
Senior Management (1) to finance acquisitions, participations or<br />
other new investments or (2) where options or convertible bonds are<br />
issued in international capital markets.<br />
When shareholders’ rights are suspended (1) the related bonds must<br />
be placed in the public domain at prevailing market conditions and (2)<br />
the exercise price for the new shares on conversion must be equal to<br />
the market price for shares when the bonds are issued.<br />
Conditions for authorized and conditional capital<br />
The number of the new shares to be issued on the basis of Articles 6<br />
and 7 of the Articles of Incorporation of Saurer Ltd. may not exceed<br />
a total of 5 000 000.<br />
option plans (see Note 20). Purchases and sales of treasury shares<br />
occurred at market prices.
Notes to the consolidated financial statements<br />
18 Changes in net working capital 2003 2002<br />
(Increase)/decrease in accounts receivable, trade and other –3 333 –38 970<br />
(Increase)/decrease in inventories (net) 5 819 39 331<br />
(Decrease)/increase in accounts payable, trade and other –22 918 19 737<br />
Other changes in net working capital –5 575 –3 863<br />
Total changes in net working capital –26 007 16 235<br />
19 Acquisition/divestment of investments<br />
Acquisition of consolidated investments<br />
2003 2002<br />
Accounts receivable 3 179 –<br />
Inventories 1 736 –<br />
Property, plant and equipment 12 354 –<br />
Goodwill 1 869 –<br />
Other assets 2 268 –<br />
Current liabilities –3 433 –<br />
Non-current liabilities –2 376 –<br />
Minority shareholders’ interests 371 –<br />
Net assets acquired 15 968 –<br />
Other (payment installments/refunds for acquisitions made in previous years) 2 564 1 127<br />
Acquisition price 18 532 1 127<br />
Paid in the year under review –18 532 –1 127<br />
Less cash acquired – –<br />
Cash flow from acquisition of consolidated investments –18 532 –1 127<br />
Cash flow from acquisition of non-consolidated investments –686 –675<br />
Cash flow from acquisition of investments –19 218 –1 802<br />
Divestment of consolidated investments<br />
Selling price 9 650 –<br />
Received in the year under review 7 911 –<br />
Less cash divested –446 –<br />
Cash flow from divestment of consolidated investments 7 465 –<br />
Cash flow from divestment of non-consolidated investments 1 300 264<br />
Cash flow from divestment of investments 8 765 264<br />
Net cash flow from acquisition/divestment of investments –10 453 –1 538<br />
The net assets disposed of comprise the following:<br />
Cash 446 –<br />
Accounts receivable 1 487 –<br />
Inventories 2 424 –<br />
Property, plant and equipment 6 267 –<br />
Other assets (including intercompany accounts of Saurer settled from proceeds) 7 939 –<br />
Current liabilities –9 832 –<br />
Minority shareholders’ interests –107 –<br />
Net assets divested 8 624 –<br />
In 2003 Saurer acquired the New Castle Group in the USA and bought<br />
out the remaining minority shareholders of <strong>Barmag</strong> AG, Germany, as<br />
well as selling Xaloy Europe (the operations of Xaloy in Olten, Switzerland<br />
and Xaloy Czech s.r.o., Czech Republic) and a 51% holding in<br />
S+G Industrieschreinerei GmbH, Germany. In addition, a further in-<br />
stallment was paid for Graziano Trasmissioni CH Ltd (UK) which was<br />
acquired in 2001. In 2002 a refund was received in respect of the<br />
DEMM acquisition, and a payment was made for the Graziano<br />
Trasmissioni CH Ltd. (UK) acquisition.<br />
69
Notes to the consolidated financial statements<br />
20 Stock options<br />
Saurer maintains a long-term program for employee stock options.<br />
The shares required to cover this program were purchased on the<br />
market. As at December 31, 2003 the total number of treasury<br />
shares reserved for this purpose was 464 120. The conditional<br />
capital, which is also available for this program (Note 17), has not<br />
been used to date. The options granted as at December 31, 2003<br />
have exercise prices between CHF 23.25 und CHF 75.60. The<br />
At December 31, 2003 the following options were outstanding:<br />
70<br />
Year Exercise Senior Board of<br />
Number of Options granted Price CHF1) Employees2) Management2) Directors2) Total<br />
Options held 2003 52.25 92 300 30 500 18 000 140 800<br />
2002 23.25 50 500 45 500 37 000 133 000<br />
2000 75.60 8 000 33 000 33 500 74 500<br />
1999 73.50 29 600 41 000 37 500 108 100<br />
1997 49.50 1 000 – 2 220 3 220<br />
Total number of<br />
1994 36.50 4 500 – – 4 500<br />
options outstanding 185 900 150 000 128 220 464 120<br />
1) Exercise prices have been and will be adjusted over the years parallel to changes in nominal value of the stock (dilution protection).<br />
2) Including former members and employees.<br />
Movements in the number of options outstanding are shown in the following table:<br />
exercise prices correspond to the market prices at the time of<br />
issue. They are not adjusted (no repricing), except for reductions<br />
equal to the reductions of the nominal share value (dilution<br />
protection). The options are blocked for between 2 and 5 years<br />
and are valid for 5 to 6 years, except for 7 720 options that were<br />
issued before 1998.<br />
Senior Board of<br />
Employees1) Management1) Directors1) Total<br />
Options outstanding as at 1.1.2002 190 730 148 500 116 000 455 230<br />
Options granted 77 500 45 500 27 000 150 000<br />
Options exercised – –7 000 – –7 000<br />
Options expired –51 180 –61 500 –50 000 –162 680<br />
Options outstanding as at 31.12 2002 217 050 125 500 93 000 435 550<br />
Transfer between categories –23 500 – 23 500 –<br />
Options granted 92 300 30 500 – 122 800<br />
Options granted against payment3) – – 18 000 18 000<br />
Options exercised – –3 000 – –3 000<br />
Options expired –99 950 –3 000 –6 280 –109 230<br />
Options outstanding as at 31.12.2003 185 900 150 000 128 220 464 120<br />
Value of options granted in 2002 (EUR 000) 2) 232 136 81 449<br />
Value of options granted in 2003 (EUR 000) 3) 662 218 39 919<br />
Net earnings from exercising options in 2002 (EUR 000) 4) – 44 – 44<br />
Net earnings from exercising options in 2003 (EUR 000) 4) – 39 – 39<br />
1) Including former members and employees.<br />
2) Valued with Black-Scholes option pricing model at CHF 4.39. Options were issued on February 8, 2002 with an exercise price of CHF 24.25.<br />
3) Valued with Black-Scholes option pricing model at CHF 10.90. Options were issued on November 20, 2003 with an exercise price of CHF 52.25. The Board<br />
of Directors acquired each option for CHF 7.60 cash payment (Black-Scholes minus a deduction for non-tradability of options).<br />
4) Net earnings for the recipient: market value minus exercise price minus transaction fees.
21 Related parties<br />
Notes to the consolidated financial statements<br />
In the years 2003 and 2002 there were no transactions or balances with related parties, except as noted in Section 5 on pages 99 to 102<br />
of the Corporate Governance Report.<br />
22 Contingent liabilities 31.12.03 31.12.02<br />
Discounted notes 317 250<br />
Guarantees in favor of third parties 9 964 13 534<br />
Others 990 1 054<br />
Total contingent liabilities 11 271 14 838<br />
The management and employees of Saurer are committed to complying<br />
with local laws and regulatory requirements in the c<strong>our</strong>se of<br />
their business activities. As of the date of this report, Saurer is not<br />
23 Financial instruments<br />
At December 31 the following types of financial instruments were held:<br />
involved in any litigation and is not aware of any pending litigation<br />
which could have a material impact on the consolidated financial<br />
statements.<br />
2003 2002<br />
Currency related Contract Positive Negative Contract Positive Negative<br />
instruments<br />
Forward foreign<br />
amount fair values fair values amount fair values fair values<br />
exchange rate contracts<br />
Over the counter<br />
146 931 10 691 –345 73 884 3 908 –159<br />
currency options 13 478 – –13 2 578 – –74<br />
Cross currency swaps<br />
Total of currency<br />
9 286 – –86 8 254 – –439<br />
related instruments 169 695 10 691 –444 84 716 3 908 –672<br />
Interest rate swaps 29 029 50 –601 – – –<br />
The positive and negative fair values are included in the balance<br />
sheet in other receivables and payables respectively.<br />
All of the currency related instruments mature within one year.<br />
Interest rate swaps with a contract amount of approximately<br />
EUR 25 million in connection with a sale and leaseback transaction<br />
run until 2010. The contract amount indicates the volume of<br />
business outstanding at the balance sheet date and does not<br />
represent amounts at risk.<br />
The table below shows the movements in the hedging reserve in shareholders’ equity in respect of cash flow hedges:<br />
2003 2002<br />
Balance as at January 1 1 589 –1 367<br />
Changes in fair value 9 936 2 707<br />
Realized gains or losses transferred to the income statement –2 707 1 367<br />
Deferred tax effect –2 342 –1 118<br />
Foreign currency translation 48 –<br />
Balance as at December 31 6 524 1 589<br />
71
Notes to the consolidated financial statements<br />
24 Other financial obligations<br />
As at December 31, 2003 obligations for future capital expenditure amounted to EUR 5 137 (2002: EUR 12 571).<br />
72<br />
Due within: Due after<br />
Future obligations from: 1 year 2–5 years 5 years<br />
Operational leasing 5 626 4 639 35<br />
Rental contracts 5 035 13 574 5 558<br />
Total other financial obligations 10 661 18 213 5 593<br />
25 Events subsequent to the balance sheet date<br />
As of February 2, 2004 the group acquired M&J Fibretech A/S,<br />
Denmark. The remaining companies in the Xaloy Group in North<br />
America and Asia were sold effective March 8, 2004. No other<br />
events occurred between the balance sheet date and the date of<br />
this report which could have a significant impact on the consolidated<br />
financial statements for 2003.<br />
26 Currency rates applied 2003 2002<br />
Income Balance Income Balance<br />
Currency statement sheet statement sheet<br />
1 CHF 0.66 0.64 0.68 0.69<br />
1 USD 0.88 0.79 1.06 0.95<br />
1 GBP 1.44 1.42 1.59 1.53<br />
1 CNY 0.11 0.10 0.13 0.12<br />
These financial statements were authorized for issue by the Board of Directors of Saurer Ltd. on March 10, 2004. A resolution to<br />
approve the financial statements will be proposed at the General Meeting of Shareholders on May 13, 2004.
Share % share Consol-<br />
Company Location Currency capital holding idation Function<br />
Group<br />
Principal companies and investments<br />
Saurer AG Arbon, CH CHF 177 445 000 C<br />
Aktiengesellschaft Adolph Saurer Arbon, CH CHF 10 000 000 100 C<br />
S.B. Holding, Inc. Panama, Rep. of Panama 1) 100 C<br />
Saurer Group Investments Ltd. George Town, Grand Cayman CHF 474 469 301 100 C<br />
Saurer Management AG Winterthur, CH CHF 100 000 100 C<br />
Saurer Holding, Inc. Denver, CO, USA USD 5 058 000 100 C<br />
SAC Saurer Automotive Components BV<br />
Saurer Textile Solutions<br />
Rotterdam, NL EUR 11 344 505 100 C<br />
<strong>Barmag</strong> Beijing Machinery Ltd. Beijing, China CNY 6 619 000 60 C<br />
<strong>Barmag</strong> do Brasil Ltda. Sao Leopoldo, Brazil BRL 18 585 000 99 C<br />
<strong>Barmag</strong> Far East Ltd. Hong Kong, HK HKD 100 000 100 C<br />
<strong>Barmag</strong> India (Private) Ltd. Mumbai, India INR 50 000 000 100 C<br />
<strong>Barmag</strong> Textile Machinery (Wuxi) Co. Ltd. Wuxi, China CNY 58 059 000 100 C<br />
<strong>Barmag</strong> Textile Machinery Suzhou Co. Ltd. Suzhou, China CNY 17 452 000 100 C<br />
<strong>Barmag</strong>-Spinnzwirn GmbH Chemnitz, D DEM 4 000 000 100 C<br />
Melco Industries, Inc. Denver, CO, USA USD 2 407 000 100 C<br />
Saurer (Japan) Co. Ltd. Osaka, Japan JPY 30 000 000 83 C<br />
Saurer Czech a.s. Cerveny-Kostelec, ´<br />
CZ CZK 127 074 000 96 C<br />
Saurer Hamel AG Arbon, CH CHF 14 160 000 100 C<br />
Saurer, Inc. Charlotte, NC, USA USD 3 000 000 100 C<br />
Saurer Textile Systems Far East Ltd. Hong Kong, HK HKD 250 000 100 C<br />
Saurer Twisting Systems (Suzhou) Co. Ltd. Suzhou, China CNY 14 906 000 100 C<br />
Saurer Beteiligungs AG Mönchengladbach, D EUR 250 000 49 P<br />
Saurer GmbH & Co KG Mönchengladbach, D EUR 41 000 000 100 C<br />
Saurer Verwaltungs GmbH Mönchengladbach, D EUR 250 000 49 P<br />
Schlafhorst Asia Ltd. Hong Kong, HK HKD 275 000 100 C<br />
Schlafhorst Electronics GmbH Mönchengladbach, D EUR 1 050 000 51 C<br />
Texparts GmbH Fellbach, D DEM 50 000 100 C<br />
W. Reiners Verwaltungs GmbH<br />
Transmission Systems<br />
Mönchengladbach, D DEM 75 000 000 100 C<br />
APRILIA Ingranaggi S.p.A. Aprilia, I EUR 1 500 000 100 C<br />
DEMM Officine Meccaniche S.p.A. Porretta Terme, I EUR 4 650 000 100 C<br />
Graziano Trasmissioni CH Ltd. Doncaster, UK GBP 40 000 100 C<br />
Graziano Trasmissioni India Ltd. New Dehli, India INR 280 000 000 100 C<br />
Graziano Trasmissioni North America, Inc. Duluth, GA, USA USD 1 100 C<br />
Graziano Trasmissioni S.p.A. Cascine Vica Rivoli, I EUR 44 300 000 100 C<br />
Graziano Trasmissioni UK Ltd. Cambridge, UK GBP 40 000 100 C<br />
I.T.T. S.r.l. Cervere, I EUR 2 600 000 100 C<br />
Surface Technology (Discontinuing operations)<br />
IonBond AG Olten Olten, CH CHF 3 000 000 100 C<br />
IonBond LLC Madison Heights, MI, USA USD 1 100 C<br />
IonBond Ltd. Consett, UK GBP 1 150 000 100 C<br />
New Castle Group New Castle, PA, USA USD 4 100 100 C<br />
Xaloy Asia (Thailand) Ltd. Chonburi, Thailand THB 100 000 000 100 C<br />
Xaloy, Inc. Pulaski, VA, USA USD 1 000 100 C<br />
Xaloy Japan KK<br />
1) Shares without par value.<br />
Consolidation method:<br />
Yokohama, Japan JPY 10 000 000 100 C<br />
C = Full consolidation Financial companies<br />
P = Proportional consolidation Services<br />
Research and development<br />
Production<br />
Marketing and sales<br />
73
Report of the group auditors<br />
Report of the group auditors<br />
to the general meeting of Saurer Ltd., Arbon<br />
As auditors of the group, we have audited the consolidated financial statements (income statement, balance<br />
sheet, cash flow statement, statement of shareholders’ equity and notes to the consolidated financial statements,<br />
on pages 51 to 73) of Saurer Ltd. for the year ended December 31, 2003.<br />
These consolidated financial statements are the responsibility of the board of directors. Our responsibility is to<br />
express an opinion on these consolidated financial statements, based on <strong>our</strong> audit. <strong>We</strong> confirm that we meet<br />
the legal requirements concerning professional qualification and independence.<br />
Our audit was conducted in accordance with auditing standards promulgated by the Swiss profession and with<br />
the International Standards on Auditing, which require that an audit be planned and performed to obtain reasonable<br />
assurance about whether the consolidated financial statements are free from material misstatement. <strong>We</strong><br />
have examined on a test basis evidence supporting the amounts and disclosures in the consolidated financial statements.<br />
<strong>We</strong> have also assessed the accounting principles used, significant estimates made and the overall consolidated<br />
financial statement presentation. <strong>We</strong> believe that <strong>our</strong> audit provides a reasonable basis for <strong>our</strong> opinion.<br />
In <strong>our</strong> opinion, the consolidated financial statements give a true and fair view of the financial position, the<br />
results of operations and the cash flows in accordance with the International Financial Reporting Standards (IFRS)<br />
and comply with Swiss law.<br />
<strong>We</strong> recommend that the consolidated financial statements submitted to you be approved.<br />
PricewaterhouseCoopers AG<br />
Daniel Ketterer Beat Inauen<br />
St. Gallen, March 10, 2004<br />
74
MULTIPLE YEAR COMPARISON.
Multiple year comparison<br />
Income Statement (EUR 000) 2003 2002 2001 2000 1999<br />
Sales<br />
Natural fibers 732 519 774 181 730 552 768 999 574 134<br />
Synthetic fibers 542 852 437 340 458 849 294 932 –<br />
Saurer Textile Solutions 1 275 371 1 211 521 1 189 401 1 063 931 574 134<br />
Transmission Systems 363 009 380 172 282 208 213 684 169 473<br />
Discontinuing Operations – Surface Technology 107 494 105 799 117 115 143 064 119 194<br />
Other – – 4 188 4 851 4 608<br />
Total sales 1 745 874 1 697 492 1 592 912 1 425 530 867 409<br />
Gross profit 397 710 399 346 362 450 353 666 181 718<br />
Operating expenses before impairment charge<br />
and sale of discontinuing operations –310 692 –329 993 –347 426 –276 492 –217 208<br />
Impairment charge – – –50 838 – –<br />
Profit on sale of discontinuing operations 988 – – – –<br />
Operating profit (loss) 88 006 69 353 –35 814 77 174 –35 490<br />
of which Saurer Textile Solutions1) 59 100 37 215 – 58 170 47 211 –51 530<br />
Transmission Systems<br />
Discontinuing Operations –<br />
27 518 36 391 30 844 25 119 15 232<br />
Surface Technology 2 889 –4 006 –8 197 5 786 2 774<br />
Net financial income (expense) –17 771 –17 983 –19 693 –17 464 3 223<br />
Profit (loss) before taxes 70 235 51 370 – 55 507 59 710 –32 267<br />
Income taxes –21 716 –16 758 5 316 –14 194 –11 684<br />
Minority interests –1 319 –1 146 –1 123 –1 046 –906<br />
Net profit (loss) 47 200 33 466 –51 314 44 470 –44 857<br />
EBITDA (operating profit before depreciation and amortization)<br />
Total 166 195 148 697 100 142 151 009 22 976<br />
of which Saurer Textile Solutions1) 96 298 79 115 40 962 90 043 –17 893<br />
Transmission Systems<br />
Discontinuing Operations –<br />
57 420 62 308 52 007 41 917 28 345<br />
Surface Technology 13 857 7 409 5 658 19 270 13 855<br />
Depreciation and amortization<br />
Total 78 189 79 344 85 118 73 835 58 466<br />
as % of sales 4.5% 4.7% 5.3% 5.2% 6.7%<br />
of which Saurer Textile Solutions1) 37 198 41 900 48 294 42 832 33 637<br />
Transmission Systems<br />
Discontinuing Operations –<br />
29 902 25 917 21 163 16 798 13 113<br />
Surface Technology 10 968 11 415 13 855 13 484 11 081<br />
Order intake, order backlog<br />
Order intake 1 709 435 1 791 418 1 440 566 1 521 522 886 891<br />
Order backlog 409 021 466 196 379 982 518 503 167 646<br />
Cash flow<br />
Net cash from operating activities 125 025 144 999 116 590 109 512 –9 091<br />
as % of sales 7.2% 8.5% 7.3% 7.7% –1.0%<br />
Capital expenditure 50 913 49 571 64 014 73 611 63 254<br />
of which Saurer Textile Solutions1) 26 869 26 222 28 844 33 728 25 201<br />
Transmission Systems<br />
Discontinuing Operations –<br />
20 138 19 916 29 255 31 088 20 839<br />
Surface Technology 3 758 3 418 5 265 8 577 17 111<br />
The years 1999 to 2002 are restated for the translation of goodwill amortization at current rather than fixed historical currency rates.<br />
1) From 2003 Saurer Textile Solutions includes real estate in Arbon, Switzerland, which was previously included in Corporate/Other. The year 2002 has been<br />
restated for ease of comparison.<br />
76
Balance sheet (EUR 000) 31.12.03 31.12.02 31.12.01 31.12.00 31.12.99<br />
Assets<br />
Liquid assets 109 786 100 687 133 998 86 895 158 483<br />
Accounts receivable, trade 276 170 281 409 261 315 279 588 195 862<br />
Inventories 207 211 218 969 244 498 230 593 180 749<br />
Prepayments, other receivables 77 893 69 672 54 805 48 840 32 856<br />
Current assets 671 060 670 737 694 616 645 916 567 950<br />
Financial assets, deferred taxes 65 037 71 311 75 321 55 836 24 848<br />
Property, plant and equipment 395 228 430 409 478 411 442 326 357 963<br />
Intangible assets 119 654 128 643 138 040 190 046 38 261<br />
Non-current assets 579 919 630 363 691 772 688 208 421 072<br />
Total assets<br />
Liabilities and shareholders’ equity<br />
1 250 979 1 301 100 1 386 388 1 334 124 989 022<br />
Short-term debt 16 793 44 728 149 390 87 524 96 481<br />
Accounts payable, trade 159 124 165 025 165 877 160 902 82 008<br />
Provisions, accruals and deferred income 168 436 175 874 166 328 169 025 123 223<br />
Other current liabilities 89 835 98 504 64 291 53 630 29 398<br />
Current liabilities 434 188 484 131 545 886 471 081 331 110<br />
Long-term debt<br />
Provisions, deferred taxes,<br />
125 370 161 746 192 605 188 612 137 115<br />
other non-current liabilities 220 830 222 183 221 996 193 404 108 434<br />
Non-current liabilities 346 200 383 929 414 601 382 016 245 549<br />
Total liabilities 780 388 868 060 960 487 853 097 576 659<br />
Minority interests 2 720 2 445 11 064 11 297 1 981<br />
Shareholders’ equity 467 871 430 595 414 837 469 730 410 382<br />
Total liabilities and shareholders’ equity 1 250 979 1 301 100 1 386 388 1 334 124 989 022<br />
Equity financing ratio 37.4% 33.1% 29.9% 35.2% 41.5%<br />
The years 1999 to 2002 are restated for the translation of goodwill at current rather than fixed historical currency rates.<br />
Employees (full time equivalents)<br />
Multiple year comparison<br />
Number of employees (year end) 10 286 10 760 11 520 11 219 7 774<br />
of which Saurer Textile Solutions 6 443 6 929 7 632 8 346 5 134<br />
Transmission Systems<br />
Discontinuing Operations –<br />
2 951 3 021 3 006 1 826 1 581<br />
Surface Technology 871 786 857 1 025 1 041<br />
Europe 8 033 8 936 9 823 9 230 6 077<br />
of which Switzerland 334 437 522 546 534<br />
NAFTA 654 747 804 1 070 1 078<br />
Asia 1 531 1 015 831 858 619<br />
Rest of World 68 62 62 62 –<br />
Personnel expenses (EUR 000) 2003 2002 2001 2000 1999<br />
Wages and salaries<br />
Social security and<br />
385 694 408 447 417 037 365 849 268 434<br />
other personnel expenses 106 382 105 351 110 914 92 297 71 717<br />
Total 492 076 513 798 527 951 458 146 340 151<br />
77
Multiple year comparison<br />
Income Statement (CHF 000) 2003 2002 2001 2000 1999<br />
Sales<br />
Natural fibers 1 113 795 1 135 800 1 103 419 1 199 630 918 615<br />
Synthetic fibers 825 406 641 622 693 041 460 091 –<br />
Saurer Textile Solutions 1 939 201 1 777 422 1 796 460 1 659 721 918 615<br />
Transmission Systems 551 955 557 751 426 245 333 345 271 157<br />
Discontinuing Operations – Surface Technology 163 445 155 218 176 889 223 179 190 711<br />
Other – – 6 325 7 568 7 373<br />
Total sales 2 654 601 2 490 391 2 405 919 2 223 813 1 387 856<br />
Gross profit 604 718 585 882 547 441 551 715 290 748<br />
Operating expenses before impairment charge<br />
and sale of discontinuing operations –472 407 –484 136 –524 750 –431 324 –347 533<br />
Impairment charge – – –76 786 – –<br />
Profit on sale of discontinuing operations 1 502 – – – –<br />
Operating profit (loss) 133 813 101 746 –54 095 120 391 –56 785<br />
of which Saurer Textile Solutions1) 89 862 54 598 –87 860 73 649 –82 448<br />
Transmission Systems<br />
Discontinuing Operations –<br />
41 841 53 392 46 587 39 186 24 371<br />
Surface Technology 4 393 –5 879 –12 381 9 026 4 439<br />
Net financial income (expense) –27 021 –26 381 –29 744 –27 243 5 156<br />
Profit (loss) before taxes 106 792 75 365 –83 839 93 148 –51 629<br />
Income taxes –33 019 –24 585 8 029 –22 143 –18 694<br />
Minority interests –2 006 –1 682 –1 696 –1 631 –1 450<br />
Net profit (loss) 71 767 49 098 –77 506 69 374 –71 773<br />
EBITDA (operating profit before depreciation and amortization)<br />
Total 252 699 218 151 151 252 235 573 36 760<br />
of which Saurer Textile Solutions1) 146 422 116 070 61 869 140 466 –28 629<br />
Transmission Systems<br />
Discontinuing Operations –<br />
87 307 91 414 78 551 65 390 45 351<br />
Surface Technology 21 070 10 867 8 545 30 061 22 168<br />
Depreciation and amortization<br />
Total 118 886 116 405 128 561 115 182 93 545<br />
as % of sales 4.5% 4.7% 5.3% 5.2% 6.7%<br />
of which Saurer Textile Solutions1) 56 560 61 472 72 943 66 817 53 819<br />
Transmission Systems<br />
Discontinuing Operations –<br />
45 466 38 022 31 964 26 204 20 980<br />
Surface Technology 16 677 16 746 20 926 21 035 17 729<br />
Order intake, order backlog<br />
Order intake 2 599 196 2 628 189 2 175 818 2 373 558 1 419 026<br />
Order backlog 637 214 678 129 563 211 793 315 268 233<br />
Cash flow<br />
Net cash from operating activities 190 101 212 728 176 097 170 837 –14 545<br />
as % of sales 7.2% 8.5% 7.3% 7.7% –1.0%<br />
Capital expenditure 77 413 72 726 96 686 114 832 101 207<br />
of which Saurer Textile Solutions1) 40 854 38 470 43 566 52 615 40 321<br />
Transmission Systems<br />
Discontinuing Operations –<br />
30 620 29 219 44 186 48 497 33 343<br />
Surface Technology 5 714 5 014 7 952 13 380 27 377<br />
The years 1999 to 2002 are restated for the translation of goodwill amortization at current rather than fixed historical currency rates.<br />
1) From 2003 Saurer Textile Solutions includes real estate in Arbon, Switzerland, which was previously included in Corporate/Other. The year 2002 has been<br />
restated for ease of comparison.<br />
78
Multiple year comparison<br />
Balance sheet (CHF 000) 31.12.03 31.12.02 31.12.01 31.12.00 31.12.99<br />
Assets<br />
Liquid assets 171 036 146 459 198 613 132 950 253 572<br />
Accounts receivable, trade 430 245 409 338 387 323 427 772 313 379<br />
Inventories 322 814 318 512 362 396 352 810 289 198<br />
Prepayments, other receivables 121 350 101 346 81 232 74 726 52 570<br />
Current assets 1 045 445 975 655 1 029 564 988 258 908 719<br />
Financial assets, deferred taxes 101 321 103 730 111 641 85 430 39 756<br />
Property, plant and equipment 615 726 626 073 709 103 676 764 572 741<br />
Intangible assets 186 409 187 125 204 603 290 772 61 217<br />
Non-current assets 903 456 916 928 1 025 347 1 052 966 673 714<br />
Total assets<br />
Liabilities and shareholders’ equity<br />
1 948 901 1 892 583 2 054 911 2 041 224 1 582 433<br />
Short-term debt 26 162 65 062 221 427 133 913 154 369<br />
Accounts payable, trade 247 899 240 292 245 864 246 182 131 213<br />
Provisions, accruals and deferred income 262 406 269 319 246 532 258 610 197 157<br />
Other current liabilities 139 954 129 545 95 292 82 054 47 037<br />
Current liabilities 676 421 704 218 809 115 720 759 529 776<br />
Long-term debt<br />
Provisions, deferred taxes,<br />
195 314 235 274 285 481 288 579 219 384<br />
other non-current liabilities 344 031 323 187 329 044 295 910 173 495<br />
Non-current liabilities 539 345 558 461 614 525 584 489 392 879<br />
Total liabilities 1 215 766 1 262 679 1 423 640 1 305 248 922 655<br />
Minority interests 4 237 3 556 16 399 17 285 3 169<br />
Shareholders’ equity 728 898 626 348 614 872 718 691 656 609<br />
Total liabilities and shareholders’ equity 1 948 901 1 892 583 2 054 911 2 041 224 1 582 433<br />
Equity financing ratio 37.4% 33.1% 29.9% 35.2% 41.5%<br />
The years 1999 to 2002 are restated for the translation of goodwill at current rather than fixed historical currency rates.<br />
Employees (full time equivalents)<br />
Number of employees (year end) 10 286 10 760 11 520 11 219 7 774<br />
of which Saurer Textile Solutions 6 443 6 929 7 632 8 346 5 134<br />
Transmission Systems<br />
Discontinuing Operations –<br />
2 951 3 021 3 006 1 826 1 581<br />
Surface Technology 871 786 857 1 025 1 041<br />
Europe 8 033 8 936 9 823 9 230 6 077<br />
of which Switzerland 334 437 522 546 534<br />
NAFTA 654 747 804 1 070 1 078<br />
Asia 1 531 1 015 831 858 619<br />
Rest of World 68 62 62 62 –<br />
Personnel expenses (CHF 000) 2003 2002 2001 2000 1999<br />
Wages and salaries<br />
Social security and<br />
586 448 599 230 629 889 570 720 429 495<br />
other personnel expenses 161 754 154 560 167 524 143 982 114 747<br />
Total 748 202 753 790 797 413 714 702 544 242<br />
79
FINANCIAL REPORT OF SAURER LTD.
Saurer Ltd. – Income statement for the years ended December 31,<br />
Revenues (CHF) Note* 2003 2002<br />
Revenues from investments 13 227 073 8 705 891<br />
Interest income 9 212 239 11 272 385<br />
Other income 1 9 712 030 5 050 047<br />
Taxes – 42 252<br />
Extraordinary income 2 1 437 845 –<br />
Total revenues 33 589 187 25 070 575<br />
Expenses<br />
Administration expense –2 096 361 –1 448 888<br />
Finance expense (including value adjustments) –1 085 208 –1 088 262<br />
Interest expense –6 068 996 –6 881 490<br />
Taxes –142 406 –<br />
Other expenses 3 –11 645 965 –590 177<br />
Total expenses –21 038 936 –10 008 817<br />
Net income 12 550 251 15 061 758<br />
* For details see notes to the financial statements, page 83.<br />
81
Saurer Ltd. – Balance sheet as at December 31,<br />
Assets (CHF) Note* 2003 2002<br />
Cash 10 182 208 3 409 096<br />
Marketable securities<br />
Current accounts receivable<br />
6 798 15 825<br />
Third parties 1 118 031 332 965<br />
Group companies 11 363 657 69 742 645<br />
Accrued income 1 694 377 4 133 440<br />
Current assets<br />
Loans<br />
24 365 071 77 633 971<br />
Third parties 211 420 211 420<br />
Group companies<br />
Investments<br />
271 310 797 203 693 056<br />
Group companies 666 145 601 656 572 217<br />
Non-current assets 937 667 818 860 476 693<br />
Total assets 962 032 889 938 110 664<br />
Liabilities and shareholders’ equity<br />
Short-term debt<br />
Third parties 910 734 77 341<br />
Group companies 15 702 931 60 798 600<br />
Short-term provisions 182 055 180 000<br />
Accruals and deferred income 1 696 662 10 845 562<br />
Current liabilities<br />
Long-term debt<br />
18 492 382 71 901 503<br />
21 ⁄ 4% convertible bond 2000–2005 138 100 000 163 100 000<br />
Group companies 177 336 881 72 125 786<br />
Long-term provisions 50 324 030 50 324 030<br />
Non-current liabilities 365 760 911 285 549 816<br />
Total liabilities 384 253 293 357 451 319<br />
Share capital 177 445 000 192 875 000<br />
General legal reserves 61 904 473 61 904 473<br />
Reserve for treasury shares 101 130 000 135 140 000<br />
Unappropriated retained earnings 237 300 123 190 739 872<br />
Shareholders’ equity 4 577 779 596 580 659 345<br />
Total liabilities and shareholders’ equity 962 032 889 938 110 664<br />
* For details see notes to the financial statements, page 83.<br />
82
Notes (CHF)<br />
Saurer Ltd. – Notes to the financial statements<br />
Explanation to the financial statements<br />
Saurer shareholders participate legally in Saurer Ltd., which controls the companies listed on page 73. The consolidated financial<br />
statements are of primary importance economically. The statutory financial statements of Saurer Ltd. are in this context to be viewed as<br />
a supplement.<br />
1 Other income<br />
Other income includes a gain of CHF 8.1 million from repurchasing the 21 ⁄4% convertible bond, which to a large extent was deferred<br />
in prior year.<br />
2 Extraordinary income<br />
A liquidation dividend of CHF 1.4 million was received from IBSI Progiciels & Systemes SA, France. This amount was previously written off.<br />
3 Other expenses<br />
Other expenses include foreign exchange losses in the amount of CHF 9.7 million on USD-denominated loans held with group companies<br />
as well as a loss of CHF 0.4 million from writing down an investment.<br />
4 Development of shareholders’ equity<br />
General Reserve for Unappropriated<br />
Share capital reserves treasury shares retained earnings Total<br />
Balance as at 1.1.2002 192 875 000 61 904 473 124 840 000 185 978 114 565 597 587<br />
Net income for the year 2002 15 061 758 15 061 758<br />
Transfer to reserve for treasury shares 10 300 000 –10 300 000 –<br />
Balance as at 31.12.2002 192 875 000 61 904 473 135 140 000 190 739 872 580 659 345<br />
Net income for the year 2003 12 550 251 12 550 251<br />
Capital repayment –15 430 000 –15 430 000<br />
Transfer from reserve for treasury shares –34 010 000 34 010 000 –<br />
Balance as at 31.12.2003 177 445 000 61 904 473 101 130 000 237 300 123 577 779 596<br />
5 Authorized and conditional capital<br />
See note 17 on page 68.<br />
6 Contingent liabilities 31.12.03 31.12.02<br />
Guarantees<br />
The guarantees are given in favor of Saurer subsidiary companies.<br />
564 489 000 447 811 000<br />
7 Treasury shares<br />
Treasury shares are held by Saurer Ltd. and a subsidiary company. Details of treasury shares (including purchases and sales) are shown in<br />
Note 17 on page 68.<br />
8 Significant shareholders<br />
See section 1.2 on page 88 of the Corporate Governance Report.<br />
9 Investments<br />
See page 73.<br />
10 Convertible bond<br />
See Note 13 on pages 64 and 65.<br />
83
Saurer Ltd. – Proposal to the General Meeting of Shareholders<br />
Appropriation of retained earnings (CHF)<br />
Retained earnings brought forward 190 739 872<br />
Net income for the financial year 2003 12 550 251<br />
Transfer from reserve for treasury shares 34 010 000<br />
Unappropriated retained earnings 237 300 123<br />
The Board of Directors proposes to the General Meeting of Shareholders that the unappropriated retained earnings be carried forward<br />
to new account.<br />
84
Report of the statutory auditors<br />
to the general meeting of Saurer Ltd., Arbon<br />
As statutory auditors, we have audited the accounting records and the financial statements (income statement,<br />
balance sheet and notes on pages 81 to 84) of Saurer Ltd. for the year ended December 31, 2003.<br />
These financial statements are the responsibility of the board of directors. Our responsibility is to express an opinion<br />
on these financial statements, based on <strong>our</strong> audit. <strong>We</strong> confirm that we meet the legal requirements concerning<br />
professional qualification and independence.<br />
Our audit was conducted in accordance with auditing standards promulgated by the Swiss profession, which require<br />
that an audit be planned and performed to obtain reasonable assurance about whether the financial statements<br />
are free from material misstatement. <strong>We</strong> have examined on a test basis evidence supporting the amounts<br />
and disclosures in the financial statements. <strong>We</strong> have also assessed the accounting principles used, significant<br />
estimates made and the overall financial statement presentation. <strong>We</strong> believe that <strong>our</strong> audit provides a reasonable<br />
basis for <strong>our</strong> opinion.<br />
In <strong>our</strong> opinion, the accounting records and the financial statements and the proposed appropriation of available<br />
earnings comply with Swiss law and the company's articles of incorporation.<br />
<strong>We</strong> recommend that the financial statements submitted to you be approved.<br />
PricewaterhouseCoopers AG<br />
Daniel Ketterer Beat Inauen<br />
St. Gallen, March 10, 2004<br />
Saurer Ltd. – Report of the statutory auditors<br />
85
CORPORATE GOVERNANCE.
88<br />
Saurer Textile Solutions<br />
H. Fischer*<br />
S. Kross, P. Stiefenhofer<br />
J. Röttgering<br />
Embroidery<br />
Dr. J. Henz<br />
Neumag<br />
Dr. C. Voigtländer<br />
Ringspinning Systems<br />
H. Kamp<br />
1. Group structure and shareholders.<br />
1.1 Group structure. Saurer Ltd. is a corporation organized under the laws of Switzerland with legal<br />
domicile in Arbon. The activities of the group are divided into two main operating divisions: Saurer<br />
Textile Solutions and Transmission Systems. The Board of Directors intends to divest the Surface Technology<br />
activities and these are consequently disclosed separately as discontinuing operations.<br />
* Member of Senior Management.<br />
Rotor Spinning Systems<br />
J. Cundill<br />
Spinning Machines<br />
M. Stillger<br />
Texparts<br />
J. Steiger<br />
Saurer Ltd.<br />
Board of Directors<br />
CEO and Delegated Member of the Board of Directors<br />
H. Fischer*<br />
Finance, Controlling, CFO<br />
P. Stiefenhofer*<br />
Texturing Machines<br />
K. Karrasch<br />
Twisting<br />
Dr. D. Burger<br />
Winding Systems<br />
G. Küsters<br />
Corporate Communications<br />
Dr. C. Ackermann<br />
S. Lalive d’Epinay as from<br />
April 1, 2004<br />
Transmission Systems<br />
Dr. M. Lamberto*<br />
G. Sarti, A. Prono, S. Puglisi,<br />
S. Piazza<br />
Corporate Development<br />
J. Steiger*<br />
IonBond<br />
Dr. M. Marchetti*<br />
R. Ahuja, R. Bonetti,<br />
E. Denisse, A. Stevenson<br />
The major companies of Saurer are set out in the list of principal companies and investments on page 73.<br />
1.2 Significant shareholders. At the end of 2003 the following shareholders were registered:<br />
Shareholders Number of shares Number of shareholders<br />
Individuals 11.45% 87.51%<br />
Corporate entities 46.78% 12.49%<br />
Treasury shares 7.21% –<br />
Shares in the process of transfer 34.57% –<br />
Internal Audit<br />
H. Beumer<br />
Surface Technology<br />
Xaloy<br />
W. Cox*
According to information available to the company, there is no shareholder with a beneficial ownership<br />
exceeding 5%.<br />
1.3 Cross-shareholdings. There are no cross-shareholdings.<br />
2. Capital structure.<br />
2.1 Capital. The issued share capital of Saurer Ltd. is CHF 177 445 000, comprising 15 430 000 fully paid<br />
registered shares with a nominal value of CHF 11.50 each.<br />
2.2 Authorized and conditional capital. Details of the authorized and conditional capital are set out in<br />
Note 17 on page 68<br />
2.3 Changes of capital. Information on movements in the capital structure for 2003 and 2002 are set<br />
out in the consolidated statement of shareholders’ equity on page 54. The movements for the year 2001<br />
are set out in the consolidated statement of shareholders’ equity on page 26 of the Annual Report 2002,<br />
which is available on the group’s homepage, www.saurer.com.<br />
2.4 Shares and participation certificates. Each registered share is entitled to one vote at the General<br />
Meeting of Shareholders. Voting rights may only be exercised after the shareholder has been registered<br />
in the share register. All shares are entitled to full dividend rights. The voting rights of treasury shares<br />
held by the company or its subsidiaries are suspended. In the event of a capital increase through the<br />
issue of new shares, the existing shareholders have subscription rights in proportion to their existing<br />
shareholding, unless the General Meeting of Shareholders restricts or excludes such rights for important<br />
reasons, especially in connection with the acquisition of investments or employee participation.<br />
Saurer Ltd. has not issued (non-voting) participation certificates.<br />
2.5 Bonus certificates. Saurer Ltd. has not issued bonus certificates.<br />
2.6 Limitations on transferability and nominee registrations. There are no restrictions either for Swiss<br />
nor for non-Swiss investors with regard to registration in the share register. Similarly there are no limits<br />
89
egarding the number of shares eligible for voting rights to be registered. However, in accordance with<br />
the articles of incorporation, supported by the law, there is an obligation to report participations which<br />
exceed or fall below 5, 10, 20, 331 ⁄ 3, 50 and 662 ⁄ 3 percent respectively. In the event that a participation<br />
of 331 ⁄ 3 is attained, the holder of this participation is obliged to submit a public tender offer (according<br />
to the bylaws of the company as well as the Swiss Federal Act on Stock Exchanges and Securities Trading<br />
– “SESTA” – of 1995, Articles 20 and 32).<br />
Registered shares not physically in existence, including the rights associated therewith, may only be transferred<br />
by assignment. Saurer Ltd. must be notified for assignments to be valid. If registered shares not<br />
physically in existence are managed by a bank on the instruction of a shareholder, such registered<br />
shares may only be transferred with the cooperation of the bank.<br />
2.7 Convertible bonds and options. Details of the convertible bond are set out in Note 13 on pages 64<br />
and 65, and details of stock options are set out in Note 20 on page 70.<br />
3. Board of Directors.<br />
3.1 Members. The Board of Directors consists of a minimum of three and a maximum of nine members.<br />
Name Nationality Position Date of first appointment<br />
Prof. Dr. Giorgio Behr Swiss Chairman, non-executive June 6, 1995<br />
Ulrich Schmidt German Deputy chairman, non-executive May 16, 2000<br />
Heinrich Fischer Swiss Delegated member, executive member May 18, 1998<br />
Heinz Bachmann Swiss Non-executive member May 14, 2003<br />
Alexis Fries Swiss Non-executive member May 16, 2002<br />
Hans-Georg Härter German Non-executive member May 16, 2002<br />
Prof. Dr. Günther Schuh German Non-executive member May 16, 2002<br />
3.2 Education, professional background, other activities and functions. None of the non-executive<br />
members of the Board was a member of Saurer’s management in the three financial years preceding the<br />
current year, except for Heinz Bachmann. None of the non-executive members of the Board has important<br />
business connections with Saurer, except as noted in 5.1 below. None of the members of the<br />
Board exercises official functions or holds political posts.<br />
90
Prof. Dr. Giorgio Behr<br />
Education: Law School University of Zurich, Swiss Certified Public Accountant, Attorney, Visiting Scholar<br />
University of Washington.<br />
Professional background: After ten years with KPMG, he joined the industrial group Hesta. In 1984 he<br />
started his own consulting company Behr Deflandre & Snozzi BDS. In 1991 he took control of the Bircher<br />
Reglomat Group together with the management, and in 2001 of the Cellpack Group.<br />
Activities in governing and supervisory bodies: Professor at the University of St.Gall Business School.<br />
Member of the Board of the Hilti Group, Liechtenstein. Co-founder and member of the Board of the<br />
Bellevue Group. Member of the Supervisory Board of the European Financial Reporting Advisory Group<br />
EFRAG. Previously chairman of the standard setter Swiss GAAP FER and the group of experts in accounting<br />
of the SWX Swiss Exchange.<br />
Permanent management and consultancy functions for Swiss and foreign interest groups: None.<br />
Special Board assignments: Chairman.<br />
Ulrich Schmidt<br />
Education: Degree in Engineering, Technical University of Hannover.<br />
Professional background: Head of Development, Imperial-<strong>We</strong>rke Bünde (1967 to 1972). Head of Development,<br />
AEG, Nuremberg (1972 to 1980). Head of Production, Cooling and Freezing, AEG, Nuremberg<br />
(1981 to 1986). Head of Drilling Division, Hilti AG, Schaan (1986 to 1993). Member of the Executive<br />
Board, Hilti AG, Schaan (1994 to 1999). Since 2000 consultant.<br />
Activities in governing and supervisory bodies: Member of the Board of Plaston AG, Widnau and Hilcona<br />
AG, Liechtenstein.<br />
Permanent management and consultancy functions for Swiss and foreign interest groups: None.<br />
Special Board assignments: Deputy Chairman. Member of the Audit Committee.<br />
Heinrich Fischer<br />
Education: Master of Applied Physics & Electrical Engineering, ETH, Zurich. MBA, University of Zurich.<br />
Professional background: F<strong>our</strong> years R&D in electronics after obtaining Master’s degree. From 1980 to<br />
1990 Balzers Division of Unaxis Group: Director of Staff, Technology and Vice President, Business Unit<br />
Coating Equipment. From 1991 to 1996 Unaxis (formerly <strong>Oerlikon</strong> Bührle Holding AG): Executive Vice<br />
President, Corporate Development.<br />
Activities in governing and supervisory bodies: Member of the Board of ESEC SA, Schweiter AG, ISE AG.<br />
Permanent management and consultancy functions for Swiss and foreign interest groups: None.<br />
Special Board assignments: Delegated Member and Chief Executive Officer, Saurer (since April 1, 1996).<br />
Heinz Bachmann<br />
Education: Degree in Engineering, Technical University for Textile Industry, Reutlingen.<br />
Professional background: Member of Group Management and Technical Manager, <strong>We</strong>llington Industries<br />
Ltd, South Africa (1967 to 1974). Managing Director, responsible for R&D and production, Lauffenmühle<br />
91
Group, Tiengen (1975 to 1980). Chief Representative of Schubert & Salzer Ltd, Ingolstadt. Director and<br />
member of Group Management of Rieter Ltd, Winterthur (1981 to 1989). CEO, Saurer Textile Systems<br />
(1990 to April 30, 2003).<br />
Activities in governing and supervisory bodies: Member of the Board of Burckhardt Compression AG,<br />
Hunziker AG, Graf & Cie. AG, Schneider Electric AG and Scholl-Then AG. Chairman Santex Group. Guest<br />
Professor, China Textile University, Shanghai. Academic Consultant of College of Textile Development<br />
Committee, China Textile University, Shanghai.<br />
Permanent management and consultancy functions for Swiss and foreign interest groups: Chairman,<br />
Swiss Association of Machinery Manufacturers (Textile Machinery Group), Swissmem. Board member of<br />
CEMATEX (European Committee of Textile Machinery Manufacturers). Chairman, Swiss Turkish Business<br />
Council.<br />
Alexis Fries<br />
Education: Degree in Physics, ETH Zurich.<br />
Professional background: From 1980 various positions with ABB (formerly BBC Brown Boveri) in Switzerland,<br />
Philippines, Japan and Hong Kong. Executive Vice President, ABB Zurich, and member of the<br />
Group Executive Committee of ABB (1993 to 1998), Head of Power Generation Division (1998 to 1999).<br />
Executive Vice President, ABB ALSTOM Power, Brussels, Manager of Gas Turbines Division (1999 to 2001).<br />
Since 2001 President, ALSTOM Power, Paris, member of the Group Management of ALSTOM.<br />
Activities in governing and supervisory bodies: Member of the group management of ALSTOM.<br />
Permanent management and consultancy functions for Swiss and foreign interest groups: None.<br />
92<br />
1 2 3 4 5
6 7<br />
1. Prof. Dr. Giorgio Behr<br />
2. Ulrich Schmidt<br />
3. Heinrich Fischer<br />
4. Heinz Bachmann<br />
5. Alexis Fries<br />
6. Hans-Georg Härter<br />
7. Prof. Dr. Günther Schuh<br />
Hans-Georg Härter<br />
Education: Training in Mechanical Engineering, State Technician’s Certificate in machine design, construction<br />
and assembly at the Technicians’ Day School, Berlin, degree in Engineering from the Meersburg Academy.<br />
Professional background: From 1973 various management functions within the ZF Group. Member of<br />
Board of Management, ZF Group. From 2002 Chief Executive Officer, ZF Sachs AG, Schweinfurt.<br />
Activities in governing and supervisory bodies: Chief Executive Officer, ZF Sachs AG, Schweinfurt.<br />
Permanent management and consultancy functions for Swiss and foreign interest groups: None.<br />
Prof. Dr. Günther Schuh<br />
Education: Dr.-Ing., Dipl.-Wirt. Ing., RWTH Aachen. Postdoctoral lectureship qualification, University of<br />
St.Gall Business School.<br />
Professional background: Lectureships and professorships at University of St.Gall. From 2002 fully<br />
tenured Professor for Production Engineering, RWTH Aachen University. Member of the Board of Directors<br />
of the Laboratory for Machine Tools and Production Engineering (WZL) of RWTH Aachen University<br />
and Member of the Board of Directors of the Fraunhofer IPT Aachen.<br />
Activities in governing and supervisory bodies: Member of the Board of Gallus Holding AG, St.Gall,<br />
Deputy Chairman of Schott Zwiesel AG, Zwiesel, Member of the Board of Peiniger Röro GmbH, Gelsenkirchen.<br />
Chairman of the Board of Virtuelle Fabrik AG, St.Gall, and GPS AG, St.Gall.<br />
Permanent management and consultancy functions for Swiss and foreign interest groups: Designated<br />
Director of the Kühne Institute for Logistics at the University of St.Gall (HSG).<br />
Special Board assignments: Chairman of the Audit Committee.<br />
93
3.3 Cross-involvement. There is no cross-involvement among the Boards of Directors of listed companies.<br />
3.4 Elections and terms of office. The members of the Board of Directors are generally elected for the<br />
period of one year, which is defined as the period between one Annual General Meeting of the Shareholders<br />
and the following Annual General Meeting. Members may continue to be re-elected until they<br />
reach the age of 70.<br />
3.5 Internal organizational structure. The Board of Directors of Saurer Ltd. (the “company”) has adopted<br />
written “Internal Regulations” for the management of the company and of its subsidiaries pursuant<br />
to article 716b of the Swiss Code of Obligations (Company Law), the rules of the SWX Swiss Exchange<br />
and the company’s Articles of Association.<br />
3.5.1 Allocation of tasks within the Board of Directors. The Board elects a Chairman and a<br />
Deputy Chairman. Until such election or in the absence of the Chairman and Deputy Chairman the<br />
longest serving Director presides over the Board. The Chairman of the Board is also Chairman of the<br />
“Committee of the Board” if this is appointed (see 3.5.2).<br />
The Board also elects the Chairman of the Audit Committee. He must not be Chairman of the Board at<br />
the same time. The head of Internal Audit and Risk Management reports to him.<br />
The Delegated Member of the Board is at the same time CEO of the company.<br />
The Board elects a Secretary to the Board and the company who need not be a Board member. Normally<br />
this function is assigned to the CFO.<br />
94
3.5.2 Committees.<br />
Audit Committee. The members of the Audit Committee are:<br />
Prof. Dr. Günther Schuh Chairman<br />
Ulrich Schmidt Member<br />
Günther Schultz, external consultant, who is not a member of the Board of Directors, but has a contractual<br />
consulting relationship.<br />
Mr. Schultz, Swiss Certified Public Accountant, is a retired partner of KPMG, Zurich. He was previously head of<br />
Auditing Services of KPMG Switzerland and Chairman of the Swiss Institute of Certified Public Accountants.<br />
The Audit Committee advises and supports the Board in all matters related to external audit, internal audit, risk<br />
management, accounting policies and practices and compliance with adopted accounting standards.<br />
Committee of the Board. A Committee of the Board, consisting of three members, can be appointed<br />
if the Board has seven or more members and if the Board so decides. The Board can delegate certain<br />
functions to this committee. While the Committee of the Board is defined in the internal regulations, in<br />
the past it has not been appointed.<br />
Other Committees. Given the small size of the Board, important matters such as nomination, compensation<br />
and management development are discussed by the full Board of Directors.<br />
If fast and decisive action is required, the Board has on rare occasions in the past appointed ad-hoc<br />
committees for certain limited tasks. For several months at the end of 2001 and early 2002 the Board<br />
established a committee to review restructuring projects.<br />
3.5.3 Work methods of the Board. The Board meets as often as the business requires, but no fewer<br />
than f<strong>our</strong> times per fiscal year. Board meetings last from one to two days.<br />
A quorum of a majority of the Directors is required for resolutions to be valid. Resolutions are adopted<br />
by simple majority, with the Chairman casting the decisive vote in case of a tie.<br />
The Audit Committee normally meets three times a year, but not less than twice. Meetings last usually<br />
for half a day. The Chairman of the Audit Committee reports about issues and decisions to the full<br />
Board at the next Board meeting.<br />
95
The CEO as Delegated Member regularly attends Board meetings, as does the CFO who has been<br />
elected as Secretary.<br />
Heads of strategic business units and business unit managers are regularly invited to present their<br />
budgets and strategic plans to the full Board.<br />
3.6 Definition of areas of responsibility. While the Board of Directors has delegated the executive<br />
management of the company and the group to the CEO and to the Senior Management, the following<br />
decisions remain with the Board:<br />
> Define the ultimate direction and strategy of the group.<br />
> Determine the top level organizational structure of the group.<br />
> Approve the yearly budgets and annual reports, reporting and accounting policies.<br />
> Based on recommendations of the Audit Committee and the work of Internal Audit, ensure that internal<br />
control systems of the group are adequate.<br />
> Determine the appropriate capital structure.<br />
> Appoint and remove members of the Senior Management, assess the next lower level of Senior<br />
Management. Discuss on an annual basis as part of a strategic management development process<br />
(SMD) the reviews of upper management levels. The focus is on key management positions of Saurer<br />
and its business units.<br />
> Elect the Chairman and Deputy Chairman as well as the Chairman of the Audit Committee.<br />
> Decide about the establishment of a Committee of the Board (see 3.5.2.).<br />
> Decide about subsidiaries, investments, acquisitions, financial market transactions, financing, assuming<br />
liabilities and granting of guarantees if they exceed certain limits that have been delegated to<br />
the CEO. While the limit for raising external financing on an aggregate basis below CHF 50 million has<br />
been delegated to the CEO, all other limits of delegation to the CEO are CHF 15 million or lower.<br />
3.7 Information and control instruments. Saurer’s reporting system uses professional consolidation<br />
software. Income statements and full balance sheets are reported and consolidated on a monthly basis,<br />
including other information pertinent to an up-to-date controlling system, such as sales and margin<br />
details, headcount and capital spending.<br />
While a yearly budget is established and approved in the period of October to December of the prior<br />
year, updated year-end projections are reported f<strong>our</strong> times a year.<br />
Specific treasury information is reported on a weekly and monthly basis.<br />
96
Business unit leaders report trends and developments in business, revenues, costs and financial positions<br />
on a monthly basis.<br />
The Saurer reporting system supports value management with a view to compensation programs (see<br />
Section 5). For all business units operating profit and net operating assets must be reported, which<br />
allows the determination of asset turns and return on operating assets.<br />
In cases of specific initiatives, such as restructuring, the Board in the past has asked for special ad-hoc<br />
reporting.<br />
Risk Management is conducted with a variety of instruments, such as strategic business planning,<br />
regular business reviews, financial planning and reporting at multiple levels within the organization, with<br />
the Board of Directors maintaining the oversight role.<br />
For all business units, specific risk maps have been established. These risk maps are updated on a regular<br />
basis as a result of internal audits, risk reporting and periodic and systematic reviews with the management.<br />
The Head of Internal Audit and Risk Management, Hans Beumer reports directly to the Audit Committee<br />
of the Board of Directors. Mr. Beumer is an Economist, Dutch Certified Public Accountant and Certified<br />
Internal Auditor, who trained with Arthur Andersen. He previously worked in Internal Audit and Finance<br />
Management at Boehringer Mannheim Group, Amsterdam, was Head of Internal Audit and Head of<br />
Group Reporting at adidas-Salomon, Herzogenaurach, and latterly CFO of Dutch Broadcasting Services,<br />
Hilversum.<br />
4.1 Members.<br />
4. Senior Management.<br />
Name Nationality Function<br />
Heinrich Fischer Swiss CEO Saurer, Delegated Member of the Board of Directors,<br />
CEO Saurer Textile Solutions<br />
Peter Stiefenhofer Swiss CFO Saurer, CFO Saurer Textile Solutions<br />
Walter Cox USA CEO Xaloy Group<br />
Dr. Marcello Lamberto Italian CEO Transmission Systems<br />
Dr. Marco Marchetti Swiss Member of Senior Management of IonBond<br />
Josef Steiger Swiss Corporate Development Saurer, CEO Business Unit Texparts<br />
97
4.2 Education, professional background, other activities and functions. None of the members of the<br />
Senior Management is a member of governing and supervisory bodies of important Swiss or foreign<br />
organizations outside of Saurer, with the exception of Heinrich Fischer, as noted in 3.2 above. None of<br />
the members holds permanent management or consultancy functions for important Swiss or foreign interest<br />
groups, and none of the members has official functions or holds political posts.<br />
Heinrich Fischer See 3.2 above.<br />
Peter Stiefenhofer<br />
Education: Degree in Economics and Business Administration, University of Zurich. Swiss Certified Public<br />
Accountant. Advanced Executive C<strong>our</strong>se (Northwestern University – Kellogg).<br />
Professional background: Auditor and systems consultant with KPMG. Group Controller, Zellweger<br />
Group. Vice President Finance and Operations, Zellweger Analytics, Inc., USA.<br />
Tasks previously carried out for Saurer: None.<br />
Walter Cox<br />
Education: B.A., Economics, DePauw University, USA.<br />
Professional background: Controller, Operations Manager, and Treasurer, Virginia Transformer Corporation,<br />
USA. Joined Xaloy, Inc. in 1983. CFO and later President of Xaloy, Inc.<br />
Tasks previously carried out for Saurer: President, Xaloy, Inc.<br />
Dr. Marcello Lamberto<br />
Education: Doctor in Mechanical Engineering from Politecnico Torino.<br />
Professional background: Metallurgist within the Product Development Department at Fiat Cars. Chief<br />
Metallurgist and Quality Manager at Rockwell CVC (joint-venture between Rockwell International and<br />
Iveco, manufacturing axles for trucks). From October 1984 various positions at Graziano Trasmissioni<br />
(Quality Manager, Operations Manager, assistant to the Managing Director, General Manager and CEO).<br />
Tasks previously carried out for Saurer: None.<br />
Dr. Marco Marchetti<br />
Education: Master’s Degree in Economics, University of Milan. PhD (Milan and Zurich). Advanced Management<br />
Program, Harvard Business School. Swiss Certified Public Accountant.<br />
Professional background: Audit Manager, Price Waterhouse. M&A Manager/Division Controller Rieter<br />
Automotive system. CFO, Rhodia Industrial Yarns.<br />
Tasks previously carried out for Saurer: None.<br />
Josef Steiger<br />
Education: Degree in Engineering, ETH Zurich. Degree in Business Administration from HSG (University<br />
of St.Gall Business School).<br />
98
Professional background: Relationship Manager for Corporate finance for Swiss multinational companies<br />
at Chase Manhattan Bank, Zurich. Managing Director of Multirac Export AG, Baar. Head of Sales at<br />
Rieter AG, Winterthur.<br />
Tasks previously carried out for Saurer: General Manager, Texparts GmbH until December 31, 2003.<br />
4.3 Management contracts. Saurer does not have management contracts with third parties.<br />
5. Compensation, shareholdings and loans to<br />
Directors and Senior Management.<br />
5.1 Content and method of compensation. For the Board of Directors, the following forms of compensation<br />
apply:<br />
> Board fees cash<br />
> Other cash compensations (expense allowances, company cars)<br />
> Consulting fees for special projects*<br />
> Saurer employee stock option program<br />
* Board members of Saurer have special experience in the areas of finance, process management, innovation<br />
management, Asian markets or textile and automotive industry. In order to <strong>make</strong> use of this<br />
experience beyond the limited framework of Board meetings, Saurer occasionally extends consulting and<br />
review assignments to Board members. These assignments in the past were limited to projects with an<br />
effort from 5 to 40 workdays. Consulting assignments are compensated with fees comparable to market.<br />
Board fees and other cash compensations have been decided by the full Board.<br />
The Chairman and the CEO decided the allocation of stock options to Board members.<br />
The following methods of compensation are applied on the level of Senior Management:<br />
> Base salary cash<br />
> Cash bonuses, also including payments under the stock option program for employees of Graziano<br />
(transmission systems)<br />
> Other cash compensations (expense allowances, company cars, etc.)<br />
> Pension fund and other benefit allocations<br />
> Saurer employee stock option program<br />
99
Saurer does not issue stock to employees or Board members, unless acquired through the stock option<br />
programs.<br />
The Graziano stock option program pertains to Graziano stock. On a consolidated group level, the program<br />
in substance amounts to a phantom stock program resulting in cash compensation, since no<br />
Graziano stock is issued without being purchased back immediately.<br />
The basic philosophy of compensation for Senior Management can be summarized as follows:<br />
While the overall compensation over the midterm must be in line with the market, the yearly compensation<br />
should clearly reflect the financial results of the group or of the unit of responsibility. Variable elements<br />
(cash bonus and return from stock options) should constitute a significant portion of the total<br />
compensation.<br />
All cash bonuses are related to elements of profit (operating profit, net income) and of assets and cash<br />
management (net debt, return on net operating assets, selected assets).<br />
Saurer measures operating profit and net operating assets for all business units on a worldwide consolidated<br />
basis, which allows compensation for key figures such as asset turns and returns on net operating<br />
assets.<br />
All senior managers and managers of business units have several yearly objectives with pre-defined<br />
ranges of cash bonuses. The minimum of cash bonuses is zero.<br />
Compensation and objectives of Senior Management and business unit managers are defined between<br />
the CEO and the Chairman, and approved by the full Board of Directors once a year.<br />
100
5.2 Compensations in detail.<br />
Summary Table – 2003 Compensation.<br />
All amounts in EUR except where otherwise stated.<br />
Other cash<br />
Salaries & Cash payments Contribution<br />
Annual Compensation board fees bonuses 1) and fees 2) Total cash to pensions<br />
Non-Executive Members of the Board 403 288 – 194 458 597 746 –<br />
Members of the Senior Management 1 297 160 1 784 106 145 228 3 226 495 377 125<br />
Former Members of the Board<br />
Former Members of the<br />
– 693 252 371 877 1 065 129 –<br />
Senior Management 31 569 – – 31 569 14 924<br />
Individual with highest compensation3) 111 423 963 329 44 336 1 119 088 79 449<br />
Chairman of the Board 78 921 – 82 830 161 751 –<br />
Number of Number of Number of Number of Value of Value of Gain from<br />
options options options shares loans options options<br />
Long Term Compensation issued4) held5) exercised held6) outstanding issued4) exercised<br />
Non-Executive Directors of the Board 18 000 112 720 – 126 957 – 39 066 –<br />
Members of the Senior Management 30 500 124 000 3 000 1 000 – 218 645 39 701<br />
Former Members of the Board<br />
Former Members of the<br />
– 15 500 – 500 – – –<br />
Senior Management – 26 000 – – – – –<br />
Individual with highest compensation3) 3 000 7 000 – – – 21 506 –<br />
Chairman of the Board 8 000 35 000 – 126 357 – 17 363 –<br />
1) Cash bonuses paid in 2003 refer to the performance in the prior year. This also includes payments under the Graziano stock<br />
option plan.<br />
2) In 2003 no severance payments were included in this amount.<br />
The cash payments to a former member of the board are compensation for a board membership at a subsidiary, combined<br />
also with significant legal and tax consulting work on a success basis. The “cash bonus” stands for the gain from exercising<br />
stock options of the subsidiary.<br />
3) A member of the senior management (not the CEO). The bonus mainly originated from a long term incentive program.<br />
4) A total of 140 800 options were issued, of which 92 300 with a value of EUR 661 670 were allocated to non-executive<br />
employees. The share options granted provide the right to purchase one share per option. The closing price at the grant date<br />
was CHF 52.25 per share, the exercise price also CHF 52.25 per share. These options will vest 50% two years after the date<br />
of grant and 100% three years after grant. They will expire five years after grant on November 19, 2008. These options are not<br />
tradeable, and had a tax value as of date of grant of CHF 10.90 (EUR 7.17), calculated based on the Black-Scholes method.<br />
Strike prices have a dilution protection, they are adjusted in line with changes of the nominal value of the Saurer shares.<br />
101
5) Options held as of December 31, 2003.<br />
6) Saurer does not issue shares to board members or senior management, except if acquired under the stock option program.<br />
102<br />
Shares owned were therefore either acquired on the market or through exercising options.<br />
6. Shareholders’ participation rights.<br />
6.1 Voting rights restrictions and representation. Each issued registered share has one voting right.<br />
However, the voting rights of treasury shares are suspended while they are under the control of Saurer<br />
Ltd. or its subsidiaries.<br />
A shareholder may be represented only by another shareholder with a written proxy.<br />
Year issued Options held Exercise price (CHF) Duration (years)<br />
Non-Executive Directors of the Board 2003 18 000 52.25 5<br />
(Directors acquired the options issued in 2002 33 000 23.25 5<br />
2003 for CHF 7.60 per option) 2000 32 000 75.60 5<br />
1999 27 500 73.50 5<br />
1997 2 220 49.50 8<br />
Total 112 720<br />
Members of the Senior Management 2003 30 500 52.25 5<br />
2002 45 500 23.25 5<br />
2000 20 000 75.60 5<br />
1999 26 000 73.50 5<br />
1999 2 000 73.50 6<br />
Total 124 000<br />
Former Members of the Board 2002 4 000 23.25 5<br />
2000 1 500 75.60 5<br />
1999 10 000 73.50 5<br />
Total 15 500<br />
Former Members of the Senior Management 2000 13 000 75.60 5<br />
1999 13 000 73.50 5<br />
Total 26 000<br />
6.2 Statutory quorums. In general the shareholders’ meeting passes its resolutions and conducts its<br />
votes by simple majority of the voting rights represented, without regard for the number of shareholders<br />
present or the share capital represented, unless the requirements of the law or the articles of incorporation<br />
are contrary.
A requisite majority of at least two-thirds of the voting rights represented is required for the following<br />
resolutions:<br />
> Change in the company’s purpose.<br />
> Introduction of voting shares or a restriction in voting rights.<br />
> Restriction on the transferability of registered shares (“Vinkulierung”).<br />
> Authorized or conditional increase of capital.<br />
> Increase of capital from reserves, in exchange for contributions in kind or the granting of special<br />
privileges.<br />
> Restriction or exclusion of subscription rights.<br />
> Transfer of the domicile of the company.<br />
> Dissolution of the company.<br />
A requisite majority of at least two thirds of the whole share capital is required for the following resolutions:<br />
> Change or removal of the requirement to report participations in the company above certain thresholds,<br />
and the obligation to submit a public tender offer.<br />
> Change or removal of the regulation concerning minimum and maximum number of members of the<br />
Board of Directors and their period of office, as well as the voting out of a majority of the members<br />
of the Board of Directors, if the resolution is proposed or supported by a shareholder or group of shareholders<br />
who have not reported their participations in the company in accordance with the requirement<br />
mentioned in 2.6 above, and have not submitted a public tender offer.<br />
6.3 Convocation of the general meeting of shareholders. The convocation of the general meeting of<br />
shareholders occurs at least 20 days before the general meeting in the official publication organ of the<br />
company (“Swiss Official Gazette of Commerce”). In addition the Board of Directors sends an invitation<br />
by mail to the shareholders and beneficiaries of shares registered in the share register.<br />
6.4 Agenda. The invitation to the general meeting of shareholders mentions all business to be discussed<br />
as well as proposals of the Board of Directors or of shareholders who have asked for an item to<br />
be placed on the agenda. No resolution can be passed unless the business to be discussed and the related<br />
proposals have been properly announced, except for the convocation of an extraordinary general<br />
meeting or the proposal for a special audit.<br />
Shareholders representing share capital of one million Swiss francs nominal value may ask for an item to<br />
be placed on the agenda. The request must be submitted in writing at least twenty days before the<br />
invitation to the meeting of shareholders is issued.<br />
103
6.5 Registrations in the share register. The company maintains a share register in which the details of<br />
the owners and beneficiaries of the registered shares are recorded.<br />
No entries may be made in the share register and no share certificates may be issued from the date on<br />
which the invitation to the general meeting is issued until the day after the general meeting.<br />
104<br />
7. Changes of control and defence measures.<br />
7.1 Duty to <strong>make</strong> an offer. If an investor acquires a minimum of 331 ⁄ 3 of the capital and voting rights<br />
of Saurer Ltd., there is an obligation to submit a public tender offer.<br />
7.2 Clauses on changes of control. Under a change of control provision, some executives have provisions<br />
whereby their normal contractual severance of 12 months is extended by 6 months. Severance of<br />
executives in Italy according to the law can be as long as 24 months.<br />
8. Auditors.<br />
8.1 Mandate and term of office. The group auditors PricewaterhouseCoopers AG, St.Gall, were first<br />
appointed as group auditors for the financial year 1990. The auditor-in-charge, Mr. Daniel Ketterer first<br />
took up office for the financial year 2003.<br />
8.2 Audit fees. The total audit fee charged by PricewaterhouseCoopers worldwide for the financial year<br />
2003 amounts to EUR 1 340 000 (2002: EUR 1 278 000). The audit fees charged by other auditors for<br />
the financial year 2003 amount to EUR 115 000 (2002: EUR 93 000).<br />
8.3 Other fees. Fees charged by PricewaterhouseCoopers in respect of non-audit work for the financial<br />
year 2003 amount to EUR 237 000 (2002: EUR 151 000).
8.4 Supervisory and control instruments. The Board of Directors monitors the work and audit results<br />
of the external auditors through the Audit Committee (see 3. above), which meets at least twice a year<br />
with the external auditors. The Audit Committee further reviews the level of the external audit fees. Internal<br />
Audit also coordinates its work program with the external auditors.<br />
9. Information policy.<br />
Saurer publishes information on sales and order income on a quarterly basis and condensed interim<br />
financial information for the first half of the fiscal year. The financial information for the first half year is<br />
published in the form of a letter to shareholders, which is also available on the group’s homepage,<br />
www.saurer.com. The quarterly information on sales and order income is made available on the group’s<br />
homepage. The group also provides price sensitive information in accordance with the ad-hoc publicity<br />
requirements of the Listing Rules of the SWX Swiss Exchange. Details are available on the group’s<br />
homepage, www.saurer.com (under the Investor Relations and News Center pages). For information,<br />
please contact Simone Lalive d’Epinay, Corporate Communications, Phone +41 (0) 52 264 09 14, Fax<br />
+41 (0) 52 264 09 10.<br />
Important dates for 2004 are as follows:<br />
Publication of first quarter orders and sales: April 22, 2004<br />
Annual General Meeting of Shareholders: May 13, 2004<br />
Publication of half-year results: July 27, 2004<br />
Publication of third quarter orders and sales: October 18, 2004<br />
105
ADDRESSES WORLDWIDE.
Company Address Telephone/fax Internet/e-Mail Management<br />
Saurer<br />
Saurer AG Textilstrasse 2 T +41 71 447 52 91 www.saurer.com<br />
CH-9320 Arbon F +41 71 447 52 88 info@sgm.saurer.com<br />
Saurer Management AG Bahnhofplatz 12 T +41 52 264 09 11 www.saurer.com<br />
CH-8401 Winterthur F +41 52 264 09 10 info@sgm.saurer.com<br />
Saurer Group Investments Ltd. Campbell Corporate Services Ltd T +1 809 949 26 48<br />
The Bank of Nova Scotia Building F +1 809 949 26 48<br />
P.O. Box 268, George Town T +377 97 70 40 43<br />
Grand Cayman, Cayman Island F +377 97 70 40 44<br />
British <strong>We</strong>st Indies<br />
Aktiengesellschaft Adolph Saurer Textilstrasse 2 T +41 71 447 52 91 www.saurer.com<br />
CH-9320 Arbon F +41 71 447 52 88 info@sgm.saurer.com<br />
Saurer Textile Solutions<br />
Addresses worldwide.<br />
Saurer GmbH & Co. KG Landgrafenstrasse 45 T +49 2161 28 0 www.textile.saurer.com<br />
D-41069 Mönchengladbach F +49 2161 28 26 45 info@textile.saurer.com<br />
P.O. Box 100435<br />
D-41004 Mönchengladbach<br />
Sales & Customer Support Jan Röttgering<br />
Technology & Logistics Stefan Kross<br />
Branch:<br />
Allma Leonhardstrasse 19 T +49 831 688 0 www.allma.saurer.com Dr. Dirk Burger<br />
D-87437 Kempten F +49 831 688 320 info@allma.saurer.com<br />
P.O. Box 2580<br />
D-87415 Kempten<br />
<strong>Barmag</strong> Leverkuser Strasse 65 T +49 2191 67 0 www.barmag.com Klaus Karrasch<br />
D-42897 Remscheid F +49 2191 67 1204 info@barmag.de Martin Stillger<br />
Neumag Christianstrasse 168–170 T +49 4321 305 0 www.neumag.de Dr. Carsten Voigtländer<br />
D-24536 Neumünster F +49 4321 305 212 sales@neumag.de<br />
Schlafhorst-Rotorspinning Blumenberger Strasse 143–145 T +49 2161 28 2880 www.schlafhorst.de John Cundill<br />
D-41061 Mönchengladbach F +49 2161 28 2803 info@schlafhorst.de<br />
P.O. Box 100435<br />
D-41004 Mönchengladbach<br />
Schlafhorst-Winding Carlstrasse 60 T +49 2161 28 0 www.schlafhorst.de Gerard Küsters<br />
D-52531 Übach-Palenberg F +49 2161 28 5302 info@schlafhorst.de<br />
P.O. Box 12 60<br />
D-52527 Übach-Palenberg<br />
Volkmann <strong>We</strong>eserweg 60 T +49 2151 717 01 www.volkmann.saurer.com Dr. Dirk Burger<br />
D-47804 Krefeld F +49 2151 717 478 info@volkmann.saurer.com<br />
P.O. Box 102365<br />
D-47723 Krefeld<br />
Zinser Hans-Zinser-Strasse 1–3 T +49 7163 14 0 www.zinser-texma.com Heinz Wilhelm Kamp<br />
D-73061 Ebersbach F +49 7163 14 250 info@zinser-texma.com<br />
P.O. Box 1480<br />
D-73058 Ebersbach<br />
Brazil:<br />
<strong>Barmag</strong> do Brasil – Av. São Borja No. 2266 T +55 51 579 8500 www.barmag.com.br Volker Lübke<br />
Máquinas e Equipamentos Ltda. 93032-000 São Leopoldo – F +55 51 588 1363 barmag@barmag.com.br<br />
Rio Grande do Sul (RS), Brazil<br />
Schlafhorst do Brasil Ltda. Rua Domingos Afonso 460-térreo T +55 11 6101 2010 Günter Bammer<br />
Vila Santa Clara F +55 11 6916 6680 schlafhorst@schlafhorst.com.br<br />
BR-03161-090 São Paulo (SP), Brazil<br />
China:<br />
<strong>Barmag</strong> Beijing Machinery Co., Ltd. 18, Tian Shui Yuan Dong Jie T +86 01 6501 8821 www.barmag.com Dieter Abele<br />
Chaoyang District F +86 01 6501 9014 bbm@barmagpek.com.cn<br />
PRC-100026 Beijing, PR China<br />
<strong>Barmag</strong> Far East Ltd. Units 3806B–3807 T +852 2827 4314 www.barmag.com<br />
38th Floor, Wu Chung House F +852 2827 5250 barmaghk@netvigator.com Matthias Rudolph<br />
213 Queen’s Road East<br />
PRC-Wanchai, Hong Kong, PR China<br />
<strong>Barmag</strong> Textile Machinery 35, Baiyu Road T +86 512 67630 813 www.barmag.com Joachim Diezl<br />
(Suzhou) Co., Ltd. Suzhou Industrial Park F +86 512 67630 799<br />
PRC-215021 Suzhou,<br />
Jiangsu Province, PR China<br />
107
Addresses worldwide.<br />
Company Address Telephone/fax Internet/e-Mail Management<br />
<strong>Barmag</strong> Textile Machinery Changjiang Nan Road 28–75 T +86 510 5342 721 www.barmag.com Tony Yung<br />
(Wuxi) Co., Ltd. Land Lord No. 100 F +86 510 5342 799 yung@btw.saurer.com<br />
PRC-214028 Wuxi New District<br />
Wuxi, Jiangsu Province, PR China<br />
Saurer Textile Systems Units 3806B–3807 T +852 286 603 08 Sindy Wong<br />
Far East Ltd. 38th Floor, Wu Chung House F +852 286 605 09 info@stsfe.saurer.com<br />
No. 213 Queen’s Road East<br />
Wanchai, Hong Kong, PR China<br />
Saurer Textile Systems 35, Baiyu Road T +86 512 6763 0086 Xu Linfeng<br />
(Suzhou) Co. Ltd. Suzhou Industrial Park F +86 512 6763 0586 info@suzhou.saurer.com<br />
PRC-215021 Suzhou,<br />
Jiangsu Province, PR China<br />
Schlafhorst Asia Ltd. Units 3806B–3807 T +852 2866 35 01 Heinz Wilhelm Kamp<br />
38th Floor, Wu Chung House F +852 2861 27 15 wscasia@compuserve.com Jan Röttgering<br />
No. 213 Queen’s Road East<br />
PRC-Wanchai, Hong Kong, PR China<br />
Czech Republic:<br />
<strong>Barmag</strong> Czech Republic s.r.o. U Veze 8 T +420 48 24 278 41 Herbert Rönchen<br />
CZ-46107 Liberec F +420 48 24 278 45<br />
Bratislavska 2939 T +420 519 36 37 22<br />
CZ-69002 Breclav 2 F +420 519 36 37 23<br />
<strong>Barmag</strong> Elektro CZ, spol. s.r.o. Obornik 31 T +420 583 412 836 www.barmag.com Josef Tempir<br />
CZ-78901 Zabreh F +420 583 412 838 barmag@raz-dva.cz<br />
Saurer Czech a.s. Lhota 261 T +420 491 469 200 www.czech.saurer.com Daniel Svrcina<br />
CZ-54941 Cerven´y-Kostelec F +420 491 469 502 info@czech.saurer.com<br />
Germany:<br />
<strong>Barmag</strong>-Spinnzwirn GmbH Zwickauer Strasse 247 T +49 371 2388 0 www.barmag-chemnitz.de Christoph Kückels<br />
D-09116 Chemnitz F +49 371 2388 349 info@barmag-chemnitz.de<br />
Schlafhorst Waldnieler Strasse 73 T +49 2161 28 0 www.schlafhorst.de Knut Richter<br />
Electronics GmbH D-41068 Mönchengladbach F +49 2161 28 3575 info@schlafhorst-electronics.de Manfred Tillmann<br />
India:<br />
Saurer India Pvt. Ltd. Empire Industries Complex T +91 22 56527900 Khurshed M. Thanawalla<br />
414, Senapati Bapat Marg, Lower Parel F +91 22 5652790 management@saurerindia.com<br />
Mumbai 400 013, India<br />
Schlafhorst Jyoti Studios Compound T +91 22 238 60 350 Soumitri Mohan Sen<br />
Marketing Company Ltd. K.B.A. Irani Bridge (Ken. Br.) F +91 22 238 78 439 smclbom@bom3.vsnl.net.in<br />
Mumbai 400 007, India<br />
Mexico:<br />
Saurer Mexico SA de C.V. Av. Sor Juana Inés de la Cruz T +52 55 5565 6200 Manuel Herrero Dominguez<br />
No.14–7° piso F +52 55 55 65 6305 labsdm@axtel.net<br />
Col. San Lorenzo C.P.<br />
MEX-54000 Tlalnepantla,<br />
Estado de México<br />
Switzerland:<br />
Saurer Hamel AG Textilstrasse 2 T +41 71 447 51 11 www.saurerhamel.com Dr. Jürg Henz<br />
CH-9320 Arbon F +41 71 447 54 11 info@saurerhamel.com<br />
USA:<br />
Melco Industries Inc. 1575 <strong>We</strong>st, 124th Avenue T +1 303 457 1234 www.melco.com Dr. Jürg Henz<br />
USA-Denver, CO 80234 F +1 303 252 0508 info@melco.com<br />
Saurer Inc. 8801 South Boulevard T +1 704 554 08 00 www.saurerinc.com Dan Loftis<br />
P.O. Box 240828 F +1 704 554 73 50 info@saurerinc.com<br />
USA-Charlotte, NC 28224<br />
Transmission Technology<br />
Graziano Trasmissioni Group S.p.A. Via Cumiana 14 T +39 011 9570 1 www.grazianotrasmissioni.it Marcello Lamberto<br />
I-10090 Cascine Vica Rivoli (TO) F +39 011 959 4803 info@grazianotrasmissioni.it<br />
India:<br />
Graziano Trasmissioni India Pvt. Ltd. Plot no. 14, Udyog Kendra T +91 120 235 0820 www.grazianotrasmissioni.it Marcello Lamberto<br />
Greater Noida, District Ghaziabad F +91 120 235 0830 gtindia@grazianotrasmissioni.it<br />
Uttar Pradesh 201 304, India<br />
Italy:<br />
Aprilia Ingranaggi S.p.A. Via Nettunense, 250 T +39 06 92661111 www.grazianotrasmissioni.it Alberto Prono<br />
I-04011 Aprilia (LT) F +39 06 9269678 info@grazianotrasmissioni.it<br />
DEMM S.p.A. Via Mazzini, 230 T +39 0534 20111 www.grazianotrasmissioni.it Salvatore Puglisi<br />
I-40046 Porretta Terme (BO) F +39 0534 20283 info@grazianotrasmissioni.it<br />
108
Company Address Telephone/fax Internet/e-Mail Management<br />
Graziano Trasmissioni S.p.A. Via Cumiana 14 T +39 011 9570 1 www.grazianotrasmissioni.it Marcello Lamberto<br />
I-10090 Cascine Vica Rivoli (TO) F +39 011 959 4803 info@grazianotrasmissioni.it<br />
I.T.T. S.r.l. Frazione Grinzano T +39 0172 471 511 www.grazianotrasmissioni.it Marcello Lamberto<br />
I-12040 Cervere (CN) F +39 0172 474 601 info@grazianotrasmissioni.it<br />
UK:<br />
Graziano Trasmissioni CH Ltd. Balby, Doncaster T +44 1302 733 617 www.grazianotrasmissioni.it Gianni Sarti<br />
GB-DN4 8DW South Yorkshire F +44 1302 733 656 info@grazianotrasmissioni.it<br />
Graziano Trasmissioni UK Ltd. 9, Harley Industrial Park, Paxton Hill T +44 1480 403 453 www.grazianotrasmissioni.it Mike Finnigan<br />
St. Neots-Huntingdon F +44 1480 403 454 enquiries@grazianouk.com<br />
GB-Cambs PE19 6TA<br />
USA:<br />
Graziano Trasmissioni 2222 Northmont Parkway, Suite 300 T +1 770 476 0496 www.grazianotrasmissioni.it Dave McPherson<br />
North America Inc. USA-Duluth, GA 30096 F +1 770 623 3290 info@grazianotrasmissioni.it<br />
Surface Technology<br />
IonBond AG Olten Industriestrasse 211 T +41 62 287 86 86 www.ionbond.com a.i. Marco Marchetti<br />
CH-4600 Olten F +41 62 287 87 93 info@ch.ionbond.com<br />
Japan:<br />
Xaloy Japan KK Daiichi Yamashita-cho T + 81 45 661 3508 www.xaloy.com Gunther Hoyt<br />
Building, 74-1 Yamashita-cho F + 81 45 661 3507 info@us.xaloy.com<br />
Naka-ku, Yokohama 231, Japan 231<br />
Thailand:<br />
Xaloy Asia (Thailand) Ltd. 700/446 Moo Amata Nakorn T +66 38 717 084 www.xaloy.com Tim Farley<br />
Industrial Estate 4 F +66 38 458 177 info@th.xaloy.com<br />
Donhuaroh<br />
TH-Muang Chonburi 2000<br />
Addresses worldwide.<br />
UK:<br />
IonBond Ltd. Unit 36, No. 1 Industrial Estate T +44 1 207 500 823 www.ionbond.com John Alan Stevenson<br />
Medomsley Road F +44 1 207 590 254 info@uk.ionbond.com<br />
GB-Consett, Durham DH8 6TS<br />
USA:<br />
IonBond LLC 1598 East Lincoln Avenue T +1 248 398 91 00 www.ionbond.com Rajiv Ahuja<br />
USA-Madison Heights, MI 48071 F +1 248 398 21 10 info@us.ionbond.com<br />
New Castle Industries Inc. 1399 County Line Road T +1 724 656 5600 www.xaloy.com Walter Gene Cox<br />
USA-New Castle, PA 16107 F +1 724 656 5620 info@us.xaloy.com<br />
Xaloy Inc. 102 Xaloy Way T +1 540 980 7560 www.xaloy.com Walter Gene Cox<br />
USA-Pulaski, VA 24301 F +1 540 980 5670 info@us.xaloy.com<br />
Xaloy Inc. 72 Stard Rd. T +1 603 929 8200 www.xaloy.com Walter Gene Cox<br />
USA-Seabrook, NH 03874 F +1 603 929 8331 info@us.xaloy.com<br />
109
SHARE STATISTICS.
Saurer registered share 2003 2002 2001 2000 1999<br />
Symbol SWX: SAUN, Security No. 1 234 514 nom. CHF 11.50 nom. CHF 12.50 nom. CHF 12.50 nom. CHF 13.30 nom. CHF 13.30<br />
(Shares were split ten-for-one in August 2001. The prior years have been restated.)<br />
Nominal share capital<br />
Number of shares 15 430 000 15 430 000 15 430 000 15 430 000 15 430 000<br />
Nominal share capital (CHF) 177 445 000 192 875 000 192 875 000 205 219 000 205 219 000<br />
Conditional capital1) Number of shares (for convertible bond) 3 000 000 3 000 000 3 000 000 3 000 000 –<br />
Nominal value (CHF) 34 500 000 37 500 000 37 500 000 39 900 000 –<br />
Number of shares (for stock option plans) 1 250 000 1 250 000 1 250 000 1 250 000 1 250 000<br />
Nominal value (CHF) 14 375 000 15 625 000 15 625 000 16 625 000 16 625 000<br />
Authorized capital 1) (for capital market transactions)<br />
Share statistics.<br />
Number of shares 3 000 000 3 000 000 3 000 000 3 000 000 1 250 000<br />
Nominal value (CHF) 34 500 000 37 500 000 37 500 000 39 900 000 16 625 000<br />
Shares issued (year end)<br />
Number of shares 15 430 000 15 430 000 15 430 000 15 430 000 15 430 000<br />
Shares with rights to dividends (year end)<br />
Number of shares 14 318 139 14 051 020 14 203 930 14 200 890 14 242 670<br />
Treasury shares (year end)<br />
Number of shares 1 111 861 1 378 980 1 226 070 1 229 110 1 187 330<br />
Distributions (in respect of the financial year shown)<br />
Capital repayment per share (CHF) 2) – 1.00 – 0.80 –<br />
Total distributions (CHF)<br />
(shown for year of payment)<br />
15 430 000 – 12 344 000 – 26 231 000<br />
Stock market capitalization<br />
Year end (CHF) 786 065 831 432 068 865 426 117 900 1 065 066 750 1 095 261 323<br />
Key data per share (EUR)<br />
Earnings (loss) per share (EUR) 3) 33.3 2.37 –3.61 3.13 –3.13<br />
Cash flow (EUR) (Net cash from operating activities) 8.83 10.28 8.20 7.70 –0.64<br />
Shareholders’ equity (EUR) 3) 32.68 30.65 29.21 33.02 28.66<br />
Key data per share (CHF)<br />
Earnings (loss) per share (CHF) 3) 5.06 3.48 –5.46 4.88 –5.01<br />
Cash flow (CHF) (Net cash from operating activities) 13.43 15.07 12.39 12.01 –1.02<br />
Shareholders’ equity (CHF) 3) 50.91 44.58 43.29 50.52 45.86<br />
Stock market prices (CHF)<br />
High (CHF) 59.00 40.75 79.00 114.00 89.30<br />
Low (CHF) 22.45 22.50 21.00 70.00 62.20<br />
Year end (CHF) 54.90 30.75 30.00 75.00 76.90<br />
1) The total of new shares issued must not exceed 5 000 000. See also Note 17, page 68.<br />
2) The Board of Directors of Saurer Ltd. intends to propose to the General Meeting of Shareholders on May 13, 2004, a share repurchase with capital redemption<br />
for a maximum of 930 000 registered shares. The repurchase of the shares to be canceled shall be by issue of negotiable put options – around 16.60<br />
options are foreseen per registered share. The price for this repurchase by Saurer Ltd. will be determined after the General Meeting of Shareholders. Under<br />
market conditions at the time of this communication a premium of 30% is planned.<br />
3) The years 1999 to 2002 are restated for the translation of goodwill and goodwill amortization at current rather than fixed historical currency rates.<br />
111
Imprint.<br />
Publisher: Saurer Ltd.<br />
Concept/Design: New Identity Ltd.<br />
Text: Saurer Corporate Communications<br />
Print: Linkgroup<br />
© Saurer Ltd. 2004<br />
Saurer Ltd.<br />
Textilstrasse 2<br />
CH-9320 Arbon<br />
Phone +41 71 447 52 91<br />
Fax +41 71 447 52 88<br />
www.saurer.com