Ground and Flight Testing of a Boeing 737 Center Wing Fuel Tank ...
Ground and Flight Testing of a Boeing 737 Center Wing Fuel Tank ...
Ground and Flight Testing of a Boeing 737 Center Wing Fuel Tank ...

Create successful ePaper yourself
Turn your PDF publications into a flip-book with our unique Google optimized e-Paper software.
DOT/FAA/AR-01/63<br />
Office <strong>of</strong> Aviation Research<br />
Washington, D.C. 20591<br />
<strong>Ground</strong> <strong>and</strong> <strong>Flight</strong> <strong>Testing</strong> <strong>of</strong> a<br />
<strong>Boeing</strong> <strong>737</strong> <strong>Center</strong> <strong>Wing</strong> <strong>Fuel</strong> <strong>Tank</strong><br />
Inerted With Nitrogen-Enriched Air<br />
Michael Burns<br />
William M. Cavage<br />
Federal Aviation Administration<br />
William J. Hughes Technical <strong>Center</strong><br />
Airport <strong>and</strong> Aircraft Safety<br />
Research <strong>and</strong> Development Division<br />
Atlantic City International Airport, NJ 08405<br />
August 2001<br />
Final Report<br />
This document is available to the U.S. public<br />
Through the National Technical Information<br />
Service (NTIS), Springfield, Virginia 22161.<br />
U.S. Department <strong>of</strong> Transportation<br />
Federal Aviation Administration
NOTICE<br />
This document is disseminated under the sponsorship <strong>of</strong> the U.S.<br />
Department <strong>of</strong> Transportation in the interest <strong>of</strong> information exchange.<br />
The United States Government assumes no liability for the contents or<br />
use there<strong>of</strong>. The United States Government does not endorse<br />
products or manufacturers. Trade or manufacturer's names appear<br />
herein solely because they are considered essential to the objective <strong>of</strong><br />
this report. This document does not constitute FAA certification policy.<br />
Consult your local FAA aircraft certification <strong>of</strong>fice as to its use.<br />
This report is available at the Federal Aviation Administration William J.<br />
Hughes Technical <strong>Center</strong>'s Full-Text Technical Reports page:<br />
actlibrary.tc.faa.gov in Adobe Acrobat portable document format<br />
(PDF).
1. Report No.<br />
DOT/FAA/AR-01/63<br />
4. Title <strong>and</strong> Subtitle<br />
2. Government Accession No. 3. Recipient's Catalog No.<br />
GROUND AND FLIGHT TESTING OF A BOEING <strong>737</strong> CENTER WING<br />
FUEL TANK INERTED WITH NITROGEN-ENRICHED AIR<br />
7. Author(s)<br />
Michael Burns <strong>and</strong> William M. Cavage<br />
9. Performing Organization Name <strong>and</strong> Address<br />
Federal Aviation Administration<br />
William J. Hughes Technical <strong>Center</strong><br />
Airport <strong>and</strong> Aircraft Safety<br />
Research <strong>and</strong> Development Division<br />
Fire Safety Section, AAR-422<br />
Atlantic City International Airport, NJ 08405<br />
12. Sponsoring Agency Name <strong>and</strong> Address<br />
U.S. Department <strong>of</strong> Transportation<br />
Federal Aviation Administration<br />
Office <strong>of</strong> Aviation Research<br />
Washington, DC 20591<br />
15. Supplementary Notes<br />
16. Abstract<br />
Technical Report Documentation Page<br />
5. Report Date<br />
August 2001<br />
6. Performing Organization Code<br />
AAR-422<br />
8. Performing Organization Report No.<br />
DOT/FAA/AR-01/63<br />
10. Work Unit No. (TRAIS)<br />
11. Contract or Grant No.<br />
13. Type <strong>of</strong> Report <strong>and</strong> Period Covered<br />
Final Report<br />
14. Sponsoring Agency Code<br />
ANM-100<br />
A series <strong>of</strong> aircraft flight <strong>and</strong> ground tests were performed by the Federal Aviation Administration (FAA) <strong>and</strong> the <strong>Boeing</strong><br />
Company to evaluate the effectiveness <strong>of</strong> ground-based inerting (GBI) as a means <strong>of</strong> reducing the flammability <strong>of</strong> fuel tanks in<br />
the commercial transport fleet. <strong>Boeing</strong> made available a model <strong>737</strong>-700 for modification <strong>and</strong> testing. A nitrogen-enriched air<br />
(NEA) distribution manifold, designed, built, <strong>and</strong> installed by <strong>Boeing</strong>, allowed for deposit <strong>of</strong> the ground-based NEA into the<br />
center wing tank (CWT). The fuel tank was instrumented with gas sample tubing <strong>and</strong> thermocouples to allow for a measurement<br />
<strong>of</strong> fuel tank inerting <strong>and</strong> heating during the testing. The FAA developed an in-flight gas-sampling system, integrated with eight<br />
oxygen analyzers, to continuously monitor the ullage oxygen concentration at eight different locations. Other data such as fuel<br />
load, air speed, altitude, <strong>and</strong> similar flight parameters were made available from the aircraft data bus. A series <strong>of</strong> ten tests were<br />
performed (five flight, five ground) under different ground <strong>and</strong> flight conditions to demonstrate the ability <strong>of</strong> GBI to reduce fuel<br />
tank flammability.<br />
The CWT was inerted with NEA to approximately 8% oxygen concentration by volume for each test. The aircraft condition was<br />
then set (fuel load, wind condition, <strong>and</strong> flight condition), <strong>and</strong> the oxygen concentration in the CWT was continuously monitored.<br />
Results showed that, under quiescent conditions, the oxygen concentration in the fuel tank remained somewhat constant, keeping<br />
the CWT inert (below 10 to 12% oxygen by volume) for relatively long periods <strong>of</strong> time. However, due to the cross venting<br />
configuration <strong>of</strong> <strong>Boeing</strong> aircraft, certain wind conditions created cross venting within the CWT which allowed for significant<br />
increases in the oxygen concentration. Some flight conditions also contributed to cross venting <strong>and</strong> created high oxygen<br />
concentrations within the fuel tank. A modification to the vent system prevented cross flow within the CWT <strong>and</strong> created a<br />
significant increase in the amount <strong>of</strong> the time the tank remained below 10% oxygen, even at low to moderate fuel loads.<br />
17. Key Words<br />
Nitrogen-enriched air, Ullage washing, Volume flow rate,<br />
<strong>Fuel</strong> tank inerting, Oxygen concentration, Total hydrocarbon<br />
19. Security Classif. (<strong>of</strong> this report)<br />
Unclassified<br />
20. Security Classif. (<strong>of</strong> this page)<br />
Unclassified<br />
18. Distribution Statement<br />
Form DOT F 1700.7 (8-72) Reproduction <strong>of</strong> completed page authorized<br />
This Document is available to the public through the National<br />
Technical Information Service (NTIS), Springfield, Virginia<br />
22161<br />
21. No. <strong>of</strong> Pages<br />
34<br />
22. Price
TABLE OF CONTENTS<br />
EXECUTIVE SUMMARY vii<br />
1. INTRODUCTION 1<br />
Page<br />
1.1 Background 1<br />
1.2 <strong>Ground</strong>-Based Inerting 1<br />
1.3 Scope 2<br />
2 EQUIPMENT AND PROCEDURES 2<br />
2.1 Equipment 2<br />
2.1.1 Test Specimen 2<br />
2.1.1.1 Air Cycle Machines 3<br />
2.1.1.2 Nitrogen-Enriched Air Distribution Manifold 3<br />
2.1.2 Instrumentation <strong>and</strong> Data Acquisition 4<br />
2.1.2.1 Oxygen Analysis System 4<br />
2.1.2.2 Thermocouple Locations 7<br />
2.1.2.3 Other Available Data 7<br />
2.1.2.4 Data Acquisition System 7<br />
2.1.3 Nitrogen-Enriched Air Generator 7<br />
2.2 Test Procedures 9<br />
2.2.1 <strong>Ground</strong> <strong>Testing</strong> 9<br />
2.2.2 <strong>Flight</strong> <strong>Testing</strong> 9<br />
3. ANALYSIS 10<br />
3.1 Data Analysis 10<br />
3.1.1 Time 10<br />
3.1.2 Nitrogen-Enriched Air Oxygen Concentration 11<br />
3.2 Inerting Solutions 11<br />
3.2.1 Exact Solution 11<br />
3.2.2 Empirical Solution 12<br />
iii
4. DISCUSSION OF RESULTS 12<br />
4.1 <strong>Ground</strong> <strong>Testing</strong> 12<br />
4.1.1 <strong>Center</strong> <strong>Wing</strong> <strong>Tank</strong> Ullage Washing 13<br />
4.1.2 Wind Effects 16<br />
4.1.3 <strong>Fuel</strong> Load Effects 16<br />
4.2 <strong>Flight</strong> <strong>Testing</strong> 20<br />
4.2.1 <strong>Center</strong> <strong>Wing</strong> <strong>Tank</strong> Cross-Venting Effect 20<br />
4.2.2 <strong>Fuel</strong> Effects at Altitude 22<br />
5. SUMMARY 27<br />
6. REFERENCES 27<br />
LIST OF FIGURES<br />
Figure Page<br />
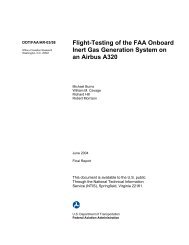
1 <strong>Boeing</strong> <strong>737</strong>-700 Aircraft 3<br />
2 <strong>Boeing</strong> <strong>737</strong>-700 CWT Plan View 3<br />
3 Schematic <strong>of</strong> Onboard Oxygen Analysis System 5<br />
4 Industrial NEA Generator Used for the GBI <strong>Testing</strong> 8<br />
5 Flow-Regulating Cart Used to Dispense NEA for the GBI <strong>Testing</strong> 8<br />
6 Illustration <strong>of</strong> Inflow Outflow Model With Perfect Mixing 11<br />
7 <strong>Ground</strong> Test 1—Ullage Washing Average Oxygen Concentration Data 14<br />
8 <strong>Ground</strong> Test 1—Nondimenstional Ullage-Washing Data 14<br />
9 <strong>Ground</strong> Test 2—Ullage Washing Average Oxygen Concentration Data 15<br />
10 <strong>Ground</strong> Test 2—Nondimenstional Ullage-Washing Data 15<br />
11 Calm Winds CWT NEA Dispersion Data 17<br />
12 Simulated High Winds CWT NEA Dispersion Average Bay Data 17<br />
iv
13 Simulated High Winds CWT NEA Dispersion Individual Port Data 18<br />
14 Comparison <strong>of</strong> NEA Dispersion for Two Wind Conditions 18<br />
15 Twenty-Percent <strong>Fuel</strong> Load NEA Dispersion Data—<strong>Fuel</strong>ed After Inerting 19<br />
16 Eighty-Percent <strong>Fuel</strong> Load NEA Dispersion Data— <strong>Fuel</strong>ed After Inerting 19<br />
17 Zero <strong>Fuel</strong> Load <strong>Flight</strong> Test NEA Dispersion Data With Cross-Venting<br />
Configuration 21<br />
18 Zero <strong>Fuel</strong> Load <strong>Flight</strong> Test NEA Dispersion Data Without Cross Venting 21<br />
19 Average CWT O2 Concentration Increase Comparison Plot for Both Cross-Vented<br />
<strong>and</strong> No Cross-Flow <strong>Flight</strong>s 22<br />
20 Twenty-Percent <strong>Fuel</strong> Load <strong>Flight</strong> Test NEA Dispersion Data Without Cross Venting 23<br />
21 Forty-Percent <strong>Fuel</strong> Load <strong>Flight</strong> Test NEA Dispersion Data Without Cross Venting 24<br />
22 Eighty-Percent <strong>Fuel</strong> Load <strong>Flight</strong> Test NEA Dispersion Data Without Cross Venting 24<br />
23 Average CWT O2 Concentration Increase Comparison Plot for Different <strong>Fuel</strong><br />
Loads for Entire <strong>Flight</strong> 25<br />
24 Change in Average CWT O2 Concentration Comparison Plot for Different <strong>Fuel</strong><br />
Loads During Cruise 26<br />
25 Change in Average CWT O2 Concentration Comparison Plot for Different <strong>Fuel</strong><br />
Loads During Climb 26<br />
LIST OF TABLES<br />
Table Page<br />
1 Summary <strong>of</strong> <strong>Ground</strong> Tests 9<br />
2 Summary <strong>of</strong> <strong>Flight</strong> Tests 10<br />
v/vi
EXECUTIVE SUMMARY<br />
Significant emphasis has been placed on fuel tank safety since the TWA flight 800 accident in<br />
July 1996. One proposed method <strong>of</strong> reducing the flammability <strong>of</strong> fuel tanks is fuel tank inerting,<br />
which is commonly used by the military. However, the systems weight, resource requirements,<br />
<strong>and</strong> low dispatch reliability have indicated that military fuel tank inerting systems would not be<br />
practical for application in transport airplanes. An Aviation Rulemaking Advisory Committee<br />
(ARAC) working group has stated that a potentially cost-effective method <strong>of</strong> fuel tank<br />
flammability reduction is ground-based inerting (GBI). <strong>Ground</strong>-based inerting is defined by<br />
inerting fuel tanks during ground operations, when the threat <strong>of</strong> explosion is perceived to be the<br />
greatest <strong>and</strong> slowly allow the tanks to lose the protection over time. Although significant<br />
research has been performed to quantify the ability <strong>of</strong> nitrogen or nitrogen-enriched air (NEA) to<br />
inert a commercial transport fuel tank, ground-based inerting had never been attempted in an<br />
operational aircraft before.<br />
A series <strong>of</strong> aircraft flight <strong>and</strong> ground tests were performed by the Federal Aviation<br />
Administration (FAA) <strong>and</strong> the <strong>Boeing</strong> Company to evaluate the effectiveness <strong>of</strong> GBI as a mean<br />
<strong>of</strong> reducing the flammability <strong>of</strong> fuel tanks in the commercial transport fleet. <strong>Boeing</strong> made<br />
available a model <strong>737</strong>-700 for modification <strong>and</strong> testing. A nitrogen-enriched air (NEA)<br />
distribution manifold, designed, built, <strong>and</strong> installed by <strong>Boeing</strong>, allowed for deposit <strong>of</strong> the<br />
ground-based NEA into the center wing tank (CWT). The fuel tank was instrumented with gassample<br />
tubing <strong>and</strong> thermocouples to allow for a measurement <strong>of</strong> fuel tank inerting <strong>and</strong> heating<br />
during testing. The FAA developed an in-flight gas sampling system, integrated with eight<br />
oxygen analyzers, to continuously monitor the ullage oxygen concentration at eight different<br />
locations. Other data such as fuel load, air speed, altitude, <strong>and</strong> similar flight parameters were<br />
made available from the aircraft data bus. A series <strong>of</strong> ten tests were performed (five flight, five<br />
ground) under different ground <strong>and</strong> flight conditions to demonstrate the ability <strong>of</strong> GBI to reduce<br />
fuel tank flammability.<br />
The CWT was inerted with NEA, produced by an industrial gas generator to approximately 8%<br />
oxygen concentration by volume for each test. The aircraft condition was then set (fuel load,<br />
wind condition, flight condition) <strong>and</strong> the oxygen concentration in the CWT was continuously<br />
monitored. The tank was inerted in approximately 1.8 volume tank exchanges, which is slightly<br />
greater then the exact solution predicted. Results with low fuel loads showed that, under<br />
quiescent conditions, the oxygen concentration in the fuel tank remained somewhat constant,<br />
keeping the CWT inert (below 10 to 12% oxygen by volume) for relatively long periods <strong>of</strong> time.<br />
However, due to the cross venting configuration <strong>of</strong> <strong>Boeing</strong> aircraft built in the Seattle area,<br />
certain wind conditions created cross flows within the CWT, which allowed for significant<br />
increases in the oxygen concentration. Some flight conditions also contributed to cross venting<br />
<strong>and</strong> created high oxygen concentrations within the fuel tank. A modification to the vent system<br />
prevented cross flow within the CWT <strong>and</strong> created a significant increase in the time that the<br />
oxygen concentration remained below 10%, even at low to moderate fuel loads. High fuel load<br />
tests quickly became noninert, since the consumption <strong>of</strong> fuel induces airflow into the vent,<br />
increasing the ullage oxygen concentration.<br />
vii/viii
1. INTRODUCTION.<br />
1.1 BACKGROUND.<br />
Significant emphasis has been placed on fuel tank safety since the TWA flight 800 accident in<br />
July 1996. Following the accident, the Federal Aviation Administration (FAA) has issued<br />
numerous Airworthiness Directives <strong>and</strong> a proposed comprehensive regulation to correct potential<br />
ignition sources in fuel tanks <strong>and</strong> has conducted research into methods that could eliminate or<br />
significantly reduce the exposure <strong>of</strong> transport airplanes to flammable vapors. The latter has been<br />
in response to a new FAA policy that strives to eliminate or reduce the presence or consequences<br />
<strong>of</strong> flammable fuel tank vapors. This has included fuel tank inerting, which is commonly used by<br />
the military. However, the systems weight, resource requirements, <strong>and</strong> low dispatch reliability<br />
have indicated that military fuel tank inerting systems would not be practical for application to<br />
transport airplanes.<br />
Recently, a fuel tank inerting working group was formed by the Aviation Rulemaking Advisory<br />
Committee (ARAC) in response to a recent task assigned by the FAA to evaluate a proposed rule<br />
that would require a reduction in flammability <strong>of</strong> some or all commercial transport fuel tanks. A<br />
previous ARAC working group has stated that a potentially cost-effective method <strong>of</strong> fuel tank<br />
flammability reduction is ground-based inerting (GBI), but further study is needed to quantify<br />
the cost [1]. An FAA study has indicated that the cost <strong>of</strong> implementing GBI could be less than<br />
initially predicted by the ARAC, although the study did not consider aircraft modification<br />
costs [2]. The new working group has been charged with examining fuel tank inerting methods<br />
to reduce or eliminate the flammability <strong>of</strong> all or some fuel tanks in the commercial transport fleet<br />
while developing regulatory text as well as determining cost <strong>and</strong> benefit <strong>of</strong> the proposed rule<br />
change.<br />
One focus <strong>of</strong> the new ARAC working group is inerting <strong>of</strong> heated center wing tanks (HCWTS).<br />
Most modern commercial transport aircraft have a center wing fuel tank, which is contained<br />
within the center section <strong>of</strong> the wing <strong>and</strong> is not primary to any engine. The vast majority <strong>of</strong> these<br />
tanks have heat sources under them in the form <strong>of</strong> air cycle machines that reject heat when<br />
operating, contributing to fuel tank flammability. These tanks have been identified by the 1998<br />
ARAC report as potentially more flammable <strong>and</strong> statistically more susceptible to explosions [1].<br />
1.2 GROUND-BASED INERTING.<br />
<strong>Ground</strong>-based inerting is defined as inerting fuel tanks during ground operations. This inerting is<br />
believed to provide extended protection into flight depending on the fuel load, ground time, <strong>and</strong><br />
flight pr<strong>of</strong>ile as the tanks cool <strong>and</strong> exposure to flammable vapors is reduced. Although<br />
significant research has been performed to quantify the ability <strong>of</strong> nitrogen or nitrogen-enriched<br />
air (NEA) to inert a commercial transport fuel tank, ground-based inerting has never been<br />
attempted on an operational aircraft.<br />
GBI would involve ullage washing, which is a process that displaces the air in the fuel tank<br />
empty space, also known as ullage, with nitrogen gas or NEA. NEA is a term used to describe<br />
low-purity nitrogen (90%-98% pure), generally generated via a gas separation process. Ullage<br />
washing would be accomplished by providing the nitrogen or NEA to a supply line that feeds a<br />
1
simple fuel tank inerting manifold. Air, <strong>and</strong> particularly oxygen, readily dissolve in fuel. When<br />
a commercial transport airplane takes <strong>of</strong>f after fueling, the resulting decrease in fuel tank<br />
pressure allows some <strong>of</strong> the air to escape solution <strong>and</strong> enter the ullage space <strong>of</strong> the fuel tank.<br />
Since oxygen dissolves more readily than nitrogen in fuel, this can increase the oxygen<br />
concentration <strong>of</strong> the fuel tank significantly, although the total amount <strong>of</strong> gas evolving from the<br />
fuel is small. The resultant effect is higher ullage oxygen concentrations for both inerted <strong>and</strong><br />
noninerted fuel tanks, particularly for tanks that are mostly full.<br />
1.3 SCOPE.<br />
This report documents a series <strong>of</strong> tests performed in conjunction with the <strong>Boeing</strong> Company on a<br />
model <strong>737</strong>-700 designed to demonstrate the ability <strong>of</strong> GBI to inert <strong>and</strong> continuously provide<br />
protection to a commercial transport airplane center wing fuel tank (CWT). The tank was inerted<br />
with NEA generated on-site via a gas separation process, using hollow fiber membrane (HFM)<br />
technology [3]. The fuel tank was instrumented to continuously monitor the oxygen<br />
concentration at eight different locations in the tank. Additional instrumentation allowed for<br />
correlation <strong>of</strong> parameters with the increase in oxygen concentration in the CWT. Five ground<br />
<strong>and</strong> five flight tests were performed to highlight the effects <strong>of</strong> high winds, fuel load, ascent, <strong>and</strong><br />
descent as well as the cross-venting configuration.<br />
2. EQUIPMENT AND PROCEDURES.<br />
The testing was performed in conjunction with the <strong>Boeing</strong> Company, using a production aircraft.<br />
<strong>Boeing</strong> personnel provided all aircraft engineering, modification, support personnel, <strong>and</strong><br />
equipment. The primary responsibility <strong>of</strong> the FAA was to develop a test plan with the <strong>Boeing</strong><br />
Company <strong>and</strong> to provide the instrumentation to measure oxygen concentration at eight locations<br />
in the CWT throughout the pressure <strong>and</strong> temperature regime <strong>of</strong> the testing.<br />
2.1 EQUIPMENT.<br />
2.1.1 Test Specimen.<br />
A <strong>Boeing</strong> <strong>737</strong>-700 airplane was provided by the <strong>Boeing</strong> Company for the testing, prior to its<br />
delivery to the end user. This aircraft has the same fuel system as all next generation B-<strong>737</strong>s<br />
(see figure 1). The aircraft has a basic operating weight <strong>of</strong> 94,570 lbs with a gross take<strong>of</strong>f weight<br />
<strong>of</strong> 171,000 lbs. It has a take<strong>of</strong>f distance <strong>of</strong> 6,263 ft at max gross take<strong>of</strong>f weight <strong>and</strong> a maximum<br />
l<strong>and</strong>ing weight <strong>of</strong> 134,000 lbs with a l<strong>and</strong>ing distance <strong>of</strong> 3,160 feet. The maximum cruise speed<br />
<strong>of</strong> the aircraft is Mach 0.82 at a maximum altitude <strong>of</strong> 41,000 feet.<br />
The center wing tank has a capacity <strong>of</strong> 28,803 pounds <strong>of</strong> fuel (4,299 gals). It is contained in the<br />
center wing section <strong>of</strong> the aircraft, within the body <strong>and</strong> the inner sections <strong>of</strong> the wing root, <strong>of</strong>ten<br />
referred to as the cheek section. The empty CWT ullage volume is 598 normal cubic feet for the<br />
purpose <strong>of</strong> inerting the tank with NEA. The main tanks each hold 17,258 lbs <strong>of</strong> fuel (2,576 gals)<br />
<strong>and</strong> are contained entirely within the wings.<br />
2
2.1.1.1 Air Cycle Machines.<br />
FIGURE 1. BOEING <strong>737</strong>-700 AIRCRAFT<br />
As is the case with most commercial transport airplanes, the <strong>Boeing</strong> <strong>737</strong>-700 has air cycle<br />
machines (ACM) (two) below the center wing tank used for heating <strong>and</strong> air conditioning. These<br />
machines generate heat when operating, increasing the temperature <strong>of</strong> the center wing fuel tank.<br />
2.1.1.2 Nitrogen-Enriched Air Distribution Manifold.<br />
The test aircraft CWT was modified with an NEA distribution manifold, consisting <strong>of</strong> aluminum<br />
tubing with flexible tubing used for connections from section to section. Each section <strong>of</strong> tubing<br />
had several nozzles designed to distribute the NEA in the different bays <strong>of</strong> the CWT. The<br />
manifold was fed by a gas input connector on one CWT access door in the ACM bay under the<br />
aircraft. Figure 2 gives a top view <strong>of</strong> the tank, illustrating the installation <strong>of</strong> the distribution<br />
manifold.<br />
FIGURE 2. BOEING <strong>737</strong>-700 CWT PLAN VIEW<br />
3
2.1.2 Instrumentation <strong>and</strong> Data Acquisition.<br />
The <strong>Boeing</strong> Company provided the data acquisition system <strong>and</strong> most instrumentation. This<br />
minimized time for test setup <strong>and</strong> configuration as the <strong>Boeing</strong> personnel were familiar with this<br />
test equipment. FAA, Fire Safety Section personnel at the William J. Hughes Technical <strong>Center</strong><br />
provided the eight-channel onboard oxygen analysis system (OBOAS).<br />
2.1.2.1 Oxygen Analysis System.<br />
The OBOAS was developed by the FAA to allow for the simultaneous measurement <strong>of</strong> oxygen<br />
concentration at eight different locations in the center wing tank. The numbers in figure 2<br />
identify the eight sampling locations. The system consisted <strong>of</strong> a regulated sample train with<br />
flow-through oxygen sensors in line <strong>and</strong> ancillary equipment. Two identical four-channel<br />
systems were developed. Each four-channel system was self-contained in a st<strong>and</strong>ard 19-inch<br />
half rack designed to meet the <strong>Boeing</strong> flight test airworthiness requirements. Each system has<br />
four independent sample trains that draw an ullage sample in the fuel tank, regulate the sample<br />
pressure, expose the sample to the oxygen sensor, <strong>and</strong> redeposit the sample back in the fuel tank.<br />
This portion <strong>of</strong> the system is known as the onboard ullage sampling system (OBUSS). Each<br />
oxygen sensor has a companion analyzer mounted on the same 19-inch rack. Also mounted on<br />
each rack are a four-channel inlet pressure controller <strong>and</strong> a single-outlet pressure controller<br />
electronic unit. These electronic units support the five pressure regulator/controllers in each<br />
four-channel unit. Figure 3 shows a block diagram illustrating the primary components <strong>of</strong> the<br />
oxygen measurement system with the sample flow path, signal, <strong>and</strong> power flow highlighted.<br />
2.1.2.1.1 Oxygen Analyzers.<br />
The oxygen analyzers were flow-through oxygen sensors that used an electrolytic cell to<br />
determine the partial pressure <strong>of</strong> oxygen <strong>and</strong> presented a calibrated volumetric oxygen<br />
concentration based on sample pressure. This technology has been successfully applied in<br />
laboratory <strong>and</strong> process control applications <strong>and</strong> was used in its infancy on previous FAA flight<br />
tests <strong>of</strong> inerting systems. The oxygen sensor was remote to the analyzer <strong>and</strong> attached to the<br />
analyzer via a cable. This allowed for the analyzer to be external to the OBUSS while the sensor<br />
was not. Each analyzer had a 0 to 1 volt output. These signals were passed to the <strong>Boeing</strong> data<br />
acquisition system for collection with other pertinent test data.<br />
2.1.2.1.2 Onboard Ullage Sampling System.<br />
The OBUSS collected samples from the fuel tank, conditioned it for oxygen analysis, <strong>and</strong><br />
returned the sample to the tank. The sample was drafted from the fuel tank via a sample line that<br />
was installed by <strong>Boeing</strong> personnel. The sample enters the OBUSS via the sample-input<br />
connector <strong>and</strong> then passes through a flash arrestor <strong>and</strong> a fluid trap (numbers 3 <strong>and</strong> 1 in figure 3)<br />
that contains a float shut<strong>of</strong>f valve. The sample then passes through a selector valve, which<br />
allows for exposure <strong>of</strong> the system to calibration gas <strong>and</strong> also allows for a channel to be shut <strong>of</strong>f.<br />
Next, the sample passes through an active pressure regulator/controller, which actively controls<br />
the inlet sample pressure to a vacuum pressure below the lowest expected atmospheric pressure<br />
in the fuel tank (around 3 psia). The sample is then pumped to a pressure just above ambient sea<br />
4
5<br />
FIGURE 3. SCHEMATIC OF ONBOARD OXYGEN ANALYSIS SYSTEM
level pressure (14.7 psia) in two stages with a diaphragm pump (number 5 in figure 3). Next, the<br />
sample passes through a water separator <strong>and</strong> a needle valve where the initial flow conditions are<br />
set before each test <strong>and</strong> then through a flow meter (number 8 in figure 3) which gives the sample<br />
flow rate. Finally, the sample passes through the flow-through oxygen sensor <strong>and</strong> through a<br />
check valve (numbers 9 <strong>and</strong> 11 in figure 3). The four sample trains in each system are then<br />
united to a single outlet <strong>and</strong> pass through the outlet pressure controller, another flash arrestor,<br />
<strong>and</strong> then through a bypass valve (number 14 in figure 3) back to the fuel tank. The bypass valve<br />
allows for the sample to be sent to an outflow valve as opposed to back to the fuel tank. The<br />
outlet pressure controller actively controls the outlet flow back to the tank to give a sample<br />
pressure just above sea level, keeping a constant pressure between the diaphragm pump <strong>and</strong> the<br />
outlet controller.<br />
To allow for safe operation <strong>of</strong> the system during ground <strong>and</strong> flight conditions, many safety<br />
features were employed in the design <strong>of</strong> the OBUSS. Each four-channel sample train is<br />
contained in a vented box that minimized exposure <strong>of</strong> the operator <strong>and</strong> crew to hazardous vapors<br />
in the event <strong>of</strong> a leak in the sample train. Each channel is constructed <strong>of</strong> both stainless steal <strong>and</strong><br />
Nylon (grade 11) tubing with Swagelok® connections. The box contains an air supplied ejector<br />
that requires a minimum <strong>of</strong> three st<strong>and</strong>ard cubic feet per minute (SCFM) <strong>of</strong> compressed air at 40<br />
psig or greater to draft a set amount <strong>of</strong> air. This ejector maintains constant negative pressure in<br />
the OBUSS, continuously purging air from the inside <strong>of</strong> the box to prevent buildup <strong>of</strong> any<br />
hazardous vapors in the event <strong>of</strong> a sample leak. Maintaining negative box pressure also prevents<br />
escape <strong>of</strong> hazardous vapors from the OBUSS into the aircraft cabin. Each sample train has a<br />
fluid trap/float shut<strong>of</strong>f valve <strong>and</strong> a water separator. These prevent fuel, fuel vapor, condensation,<br />
<strong>and</strong> water vapor from contaminating the sample train or damaging the in-line oxygen sensor.<br />
Each four-channel system has one, eight-head diaphragm pump (two per channel) which supplies<br />
the displacement required in a safe manner to move the sample through the sample train at all<br />
fuel tank altitudes <strong>and</strong> temperatures. All electrical components indigenous to the OBUSS are<br />
mounted exterior to the containment box. This allows for the separation <strong>of</strong> potentially<br />
flammable vapors in the containment box <strong>and</strong> a potential arc or spark from a faulty electrical<br />
circuit. A failure modes <strong>and</strong> effects criticality analysis (FMECA) <strong>of</strong> the OBUSS was performed.<br />
This lead to several small improvements in the OBUSS design that allowed for <strong>Boeing</strong> flight<br />
safety representatives to approve the OBOAS for limited use on <strong>Boeing</strong> flight test aircraft.<br />
2.1.2.1.3 Onboard Oxygen Analysis System Operation.<br />
The OBOAS was adjusted <strong>and</strong> calibrated before each test <strong>and</strong> essentially could run unattended<br />
by personnel. For increased safety, FAA personnel monitored the equipment continuously to<br />
ensure quick identification <strong>of</strong> any system failures that could create an unsafe condition on the<br />
aircraft. The system was started every morning <strong>and</strong> allowed to run for approximately 2 hours to<br />
reach a stable temperature, which allows for more accurate readings. The system was then<br />
calibrated by selecting the calibration port <strong>of</strong> each sample train with a selector valve <strong>and</strong><br />
bypassing the return to the outflow valve. The system has the option <strong>of</strong> sampling from a<br />
calibration port, which could be supplied with air or a calibration gas, <strong>and</strong> bypassing the tank<br />
return to the atmosphere so as not to contaminate the ullage space with the calibration gas. The<br />
system was calibrated with a calibration mixture <strong>of</strong> 16% oxygen by volume in a balance <strong>of</strong><br />
nitrogen. This “downstream calibration” allows for more accurate measurement <strong>of</strong> oxygen<br />
concentration in the area <strong>of</strong> greatest interest (8%-12% range (by volume)) while sacrificing very<br />
6
little accuracy at ambient (20.9%). Each sample train selector valve was then turned to sample<br />
input <strong>and</strong> outflow was redirected back to the tank.<br />
2.1.2.2 Thermocouple Locations.<br />
Thermocouples were located in <strong>and</strong> around the CWT to allow for measurement <strong>of</strong> temperature.<br />
Temperature was measured at each sample location to provide knowledge <strong>of</strong> the flammability <strong>of</strong><br />
the sample location. The outside air temperature was also measured to provide information on<br />
the external aircraft conditions.<br />
2.1.2.3 Other Available Data.<br />
Data from the aircraft data bus was made available for purposes <strong>of</strong> the testing. <strong>Ground</strong> tests used<br />
fuel quantity to verify the test condition fuel load. <strong>Flight</strong> tests also stored airspeed, altitude, <strong>and</strong><br />
Mach number in addition to heading data that was deemed useful in determining flight<br />
conditions. During ground testing, a mobile ground weather station was used to obtain<br />
temperature, wind speed, <strong>and</strong> wind direction.<br />
2.1.2.4 Data Acquisition System.<br />
The data acquisition system used was designed, built, <strong>and</strong> certified by <strong>Boeing</strong> for the purposes <strong>of</strong><br />
flight test <strong>and</strong> evaluation. It was a multiplexed data system that uses data modulation to create a<br />
data stream for storage or discrimination. The system was integrated with the aircraft ARINC<br />
bus to obtain aircraft data in parallel with all installed sensors.<br />
The data was stored on tape <strong>and</strong> also displayed via an analysis computer that discriminated the<br />
essential signals to allow for real-time display <strong>of</strong> data. The oxygen analyzer output was digitally<br />
filtered before being stored on tape to reduce high frequency noise evident in the signal. The<br />
source <strong>and</strong> path <strong>of</strong> this noise is still unknown.<br />
2.1.3 Nitrogen-Enriched Air Generator.<br />
The industrial gas generator used to provide NEA to the airplane CWT was a general-purpose,<br />
<strong>of</strong>f-the-shelf HFM gas separator with a skid-mounted compressor. The unit required 150 amps<br />
<strong>of</strong> 440 Vac three-phase power <strong>and</strong> was equipped with an oxygen analyzer <strong>and</strong> purity alarm. The<br />
unit contained five gas separation modules, each 6 inches in diameter, allowing the unit to<br />
generate as much as 125 cubic feet per minute (CFM) <strong>of</strong> 95% NEA (5% oxygen by volume)<br />
without the need for an accumulator tank. The purity <strong>of</strong> the NEA gas (oxygen concentration)<br />
can be adjusted with the purity control valve to values from 14% oxygen by volume (NEA 86%)<br />
to less than 1% oxygen by volume (NEA 99% or greater). A picture <strong>of</strong> the NEA generator can<br />
be seen in figure 4.<br />
7
FIGURE 4. INDUSTRIAL NEA GENERATOR USED FOR THE GBI TESTING<br />
The NEA was supplied through a flow meter mounted on a cart with two pressure regulators.<br />
This equipment, shown in figure 5, allowed for the output <strong>of</strong> the NEA machine (125 CFM at 100<br />
psi on a 1-inch line) to be regulated to about 95 CFM on a 2-inch line with less then 2.5 psi back<br />
pressure during deposit. This allowed for safe deposit <strong>of</strong> the NEA in the fuel tank via the<br />
inerting manifold inlet. Low flow pressures must be maintained to prevent structural damage<br />
from tank overpressurization, which is usually the result <strong>of</strong> a failure causing a refuel overflow.<br />
The combination <strong>of</strong> fuel <strong>and</strong> NEA flowing into the CWT <strong>and</strong> out the vent system could result in<br />
tank pressures in excess <strong>of</strong> the design pressure, provided the NEA input pressure was high<br />
enough.<br />
FIGURE 5. FLOW-REGULATING CART USED TO DISPENSE NEA FOR<br />
THE GBI TESTING<br />
8
2.2 TEST PROCEDURES.<br />
All tests were performed at King County International Airport in Seattle, Washington. The<br />
planned testing consisted <strong>of</strong> five ground tests <strong>and</strong> four to five flight tests. The option <strong>of</strong><br />
eliminating cross venting from the tank was left open in case undesirable results were obtained in<br />
the first flight test. This provided for the reiteration <strong>of</strong> the first flight test <strong>and</strong> thus created a total<br />
<strong>of</strong> five flight tests.<br />
Before each test began, the NEA generator was reconfigured to supply ambient air to the aircraft<br />
fuel tank, allowing the tank to be purged <strong>and</strong> ensuring a consistent initial oxygen concentration<br />
(approximately 20.9% oxygen by volume). At the start <strong>of</strong> each test, the data acquisition system<br />
was started <strong>and</strong> the NEA was directed into the tank. The tank was considered ready for testing<br />
when all sensors read approximately 8% oxygen concentration by volume. Next, the auxiliary<br />
power unit (APU) was started, ground power was switched <strong>of</strong>f, <strong>and</strong> the air cycle machines were<br />
started. Lastly, the aircraft was operated in accordance with the test plan.<br />
2.2.1 <strong>Ground</strong> <strong>Testing</strong>.<br />
The ground testing portion <strong>of</strong> the test plan required several tests under different fuel loads <strong>and</strong><br />
wind conditions. Due to the limitations in the test schedule <strong>and</strong> logistics, the existing wind<br />
conditions were used <strong>and</strong> noted instead <strong>of</strong> seeking out the ideal wind conditions. In one case, a<br />
fan directing air across one wing’s vent scoop, simulated the effect <strong>of</strong> wind with one vent<br />
blocked by a building, loading bridge, or similar related support equipment. Table 1 gives a list<br />
<strong>of</strong> tests with fuel load, test condition, <strong>and</strong> test duration.<br />
It has been observed that certain wind conditions may vent the ullage <strong>of</strong> a CWT due to the cross<br />
ventilation design <strong>of</strong> the tank. Quantification <strong>of</strong> these detrimental wind conditions was beyond<br />
the scope <strong>of</strong> this research. It has been hypothesized that the effect <strong>of</strong> wind on the oxygen<br />
concentration <strong>of</strong> a CWT is a function <strong>of</strong> wind speed <strong>and</strong> direction.<br />
TABLE 1. SUMMARY OF GROUND TESTS<br />
Test <strong>Fuel</strong> Load Condition Duration<br />
1 0% Inert to 8%, calm winds, APU on 2 hours<br />
2 0% Inert to 8%, simulated winds, APU on 2 hours<br />
3 80% Inert to 8% before fuel, high natural winds, APU on 2 hours<br />
4 80% Inert to 8% after fuel, high natural winds, APU on 2 hours<br />
5 20% Inert to 8% before fuel, simulated calm winds, APU on 2 hours<br />
2.2.2 <strong>Flight</strong> <strong>Testing</strong>.<br />
The focus <strong>of</strong> the flight testing was to determine the effect <strong>of</strong> the fuel load on the inert ullage<br />
space <strong>and</strong> how long the tank would tend to remain inert during representative operations. An<br />
effort was made to keep the tests as consistent as possible from test to test to allow for fair<br />
comparison. The exception to this was the duration <strong>of</strong> the ground operation portion <strong>of</strong> the test to<br />
the flight portion. This was varied to illustrate the effect <strong>of</strong> blocking one vent exit on the ullage<br />
9
oxygen concentration. After test 1, one vent was blocked to prevent cross flow within the CWT.<br />
To prevent repeating some or all <strong>of</strong> the ground tests, the worst case (test 5, 80% fuel load) was<br />
extended to include a 2-hour ground duration period. Table 2 gives a listing <strong>of</strong> flight tests with<br />
fuel load, condition, ground duration, <strong>and</strong> flight duration.<br />
TABLE 2. SUMMARY OF FLIGHT TESTS<br />
<strong>Ground</strong> <strong>Flight</strong><br />
Test <strong>Fuel</strong> Load<br />
Condition<br />
Duration Duration<br />
1 0% Inert to 8%, APU on, st<strong>and</strong>ard flight pr<strong>of</strong>ile 20 minutes 2 hours<br />
2 0% Inert to 8%, APU on, st<strong>and</strong>ard flight pr<strong>of</strong>ile 20 minutes 2 hours<br />
3 20% Inert to 8%, APU on, st<strong>and</strong>ard flight pr<strong>of</strong>ile 30 minutes 2 hours<br />
4 40% Inert to 8%, APU on, st<strong>and</strong>ard flight pr<strong>of</strong>ile 30 minutes 2 hours<br />
5 80% Inert to 8%, APU on, st<strong>and</strong>ard flight pr<strong>of</strong>ile 2 hours 2 hours<br />
3. ANALYSIS.<br />
Ullage washing can be described as an exchange <strong>of</strong> gases at different oxygen concentrations.<br />
The inerting gas is supplied to the fuel tank ullage space by means <strong>of</strong> a manifold, allowing for<br />
distribution <strong>of</strong> the NEA within in the fuel tank. The inerting gas displaces the existing ullage<br />
headspace gas which consists <strong>of</strong> air (20.9% oxygen by volume) <strong>and</strong> fuel vapor. As NEA is<br />
supplied to the fuel tank, the oxygen concentration is reduced to a level that approaches, but<br />
theoretically never reaches the oxygen concentration <strong>of</strong> the inerting gas (i.e., NEA 95% is 5%<br />
oxygen by volume).<br />
3.1 DATA ANALYSIS.<br />
Much <strong>of</strong> the data is presented in a nondimensional format to allow for comparison <strong>of</strong> the aircraft<br />
inerting data with data collected in the lab, as well as to allow numbers to be easily applied to<br />
any ullage-washing scenario. Averaging was employed to simplify the presentation <strong>of</strong> the<br />
oxygen concentration <strong>of</strong> the CWT.<br />
3.1.1 Time.<br />
It is advantageous to present the data in a manner which is easily applied to all fuel tanks <strong>and</strong> all<br />
NEA flow rates. It can be hypothesized that the volume <strong>of</strong> NEA deposited within the tank<br />
dictates how quickly or slowly a vented fuel tank becomes inert, given the assumption that the<br />
tank is homogenous <strong>and</strong> stores no gas (100% mixing, in flow = out flow). It also follows that<br />
this volume <strong>of</strong> gas divided by the total volume <strong>of</strong> the tank would be constant, given a fixed<br />
purity <strong>of</strong> gas deposited. To accomplish this, the time scale <strong>of</strong> the data was nondimensionalized<br />
by applying the flow rate <strong>and</strong> fuel tank volume, giving what has become known as the<br />
volumetric tank exchange.<br />
Volumetric <strong>Tank</strong> Exchange<br />
=<br />
10<br />
Time ∗Volume<br />
Flow Rate<br />
<strong>Fuel</strong> <strong>Tank</strong> Volume
This conversion allows for meaningful comparisons <strong>of</strong> data from different experiments with<br />
different tank sizes <strong>and</strong> flow rates.<br />
3.1.2 Nitrogen-Enriched Air Oxygen Concentration.<br />
In an effort to compare the data with previously acquired ullage washing data, it was desired to<br />
present the inerting data by nondimensionalizing the measured tank oxygen concentration in<br />
terms <strong>of</strong> inerting gas purity. The described theory states that the tank oxygen concentration is<br />
brought to the purity <strong>of</strong> the inerting gas over time by simply displacing the ullage space gas.<br />
This implies that the ratio <strong>of</strong> the difference between the oxygen concentration <strong>of</strong> air (ambient<br />
conditions) <strong>and</strong> the ullage in time <strong>and</strong> air <strong>and</strong> the NEA gas purity being added to the tank have a<br />
constant relationship, given a fixed volume <strong>of</strong> gas deposited. This can be described by the<br />
following relationship for the nondimensional factor referred to as the tank inerting ratio.<br />
where:<br />
<strong>Tank</strong> Inerting Ratio<br />
[ O<br />
[ O<br />
2 Amb<br />
2 Amb<br />
] − [<br />
] − [<br />
O2 Amb = Oxygen concentration <strong>of</strong> ambient air<br />
O2 = Oxygen concentration <strong>of</strong> inerting gas (NEA)<br />
NEA<br />
=<br />
O<br />
O<br />
2 ullage<br />
2 NEA<br />
O2 Ullage = Oxygen concentration <strong>of</strong> the ullage (function <strong>of</strong> time)<br />
3.2 INERTING SOLUTIONS.<br />
3.2.1 Exact Solution.<br />
An exact solution to fuel tank inerting was created by using a perfect mixing model to develop<br />
an equation in terms <strong>of</strong> the rate <strong>of</strong> change <strong>of</strong> ullage oxygen concentration with respect to time.<br />
Figure 6 illustrates the solution concept based on the premise that the sum <strong>of</strong> the inflow <strong>and</strong><br />
outflow is equal to the time rate <strong>of</strong> change <strong>of</strong> the tank oxygen content.<br />
FIGURE 6. ILLUSTRATION OF INFLOW OUTFLOW MODEL WITH PERFECT MIXING<br />
11<br />
]<br />
]
Application <strong>of</strong> this concept gives the following simplification.<br />
where: x = [O2 NEA] – [O2]<br />
− dx<br />
1<br />
=<br />
Q&<br />
V<br />
x <strong>Tank</strong><br />
The solution <strong>of</strong> this equation can be manipulated to allow for comparison <strong>of</strong> the exact solution to<br />
existing nondimensional experimental data. This was determined to be the following:<br />
dt<br />
O2 − O2<br />
( t)<br />
−<br />
= 1 − e<br />
O − O<br />
2<br />
Amb Qt V<strong>Tank</strong><br />
Amb<br />
2<br />
NEA<br />
This simply states that the tank inerting ratio is equal to 1 minus e to the negative volumetric<br />
tank exchange. This equation allows for comparison <strong>of</strong> the exact solution with data that has been<br />
nondimensionalized in accordance with section 3.1. The complete solution had been developed<br />
by Dr. Richard Lyon <strong>and</strong> Constantine Sarkos <strong>and</strong> is given in an appendix A <strong>of</strong> reference 3.<br />
3.2.2 Empirical Solution.<br />
The nondimensional methods described in section 3.1 allow for the creation <strong>of</strong> an empirical<br />
curve based on previously acquired inerting data for different purities <strong>and</strong> flow rates <strong>of</strong> NEA.<br />
An empirical relationship between volumetric tank exchange <strong>and</strong> inerting ratio had been<br />
developed with previous ullage-washing experiments performed by the FAA. These experiments<br />
quantified the amount <strong>of</strong> NEA needed at a given purity level (oxygen concentration) to inert a<br />
rectangular tank, with one NEA nozzle <strong>and</strong> one vent, <strong>of</strong> any volume. This empirical relationship<br />
assumes a fourth-order polynomial curve fit [3]. The equation is given below.<br />
<strong>Tank</strong> Inerting Ratio<br />
- 0.0145x<br />
In this equation, x is the volumetric tank exchange.<br />
4. DISCUSSION OF RESULTS.<br />
=<br />
4<br />
+ 0.1345x<br />
3<br />
- 0.5275x<br />
2<br />
+ 1.0873x - 0.0121<br />
The discussion <strong>of</strong> results was split into ground testing <strong>and</strong> flight testing. This data describes<br />
inerting <strong>of</strong> an operational aircraft in a flight test environment.<br />
4.1 GROUND TESTING.<br />
The ground testing data focuses on three distinct research areas. The first is to validate the<br />
amount <strong>of</strong> NEA required to inert a compartmentalized CWT to 8% oxygen concentration. The<br />
second is to examine the qualitative effects <strong>of</strong> wind <strong>and</strong> simulated crosswind on an inert CWT.<br />
The last is to examine the quantitative effects <strong>of</strong> fuel load on an inert ullage during ground<br />
operations.<br />
12
The data is generally presented in terms <strong>of</strong> an average <strong>of</strong> the three primary areas <strong>of</strong> the CWT, the<br />
center body section, the left cheek, <strong>and</strong> the right cheek. The center body section <strong>of</strong> the center<br />
wing fuel tank is the area <strong>of</strong> the tank contained within the fuselage area <strong>of</strong> the aircraft that has<br />
three spanwise bays with a total <strong>of</strong> four sample ports. One sample port within the center body<br />
section was considered redundant (port 2) as it resided very close to a second sample port<br />
(port 3); therefore, three ports were used when calculating the average oxygen concentration <strong>of</strong><br />
the center bay area <strong>of</strong> the CWT. The left <strong>and</strong> right cheek areas are areas <strong>of</strong> the CWT that are<br />
within the wing hub area. Each cheek area contains five bays <strong>of</strong> differing orientation to the wing<br />
cord with two sample ports used to calculate the average oxygen concentration. These areas<br />
consistently exhibited different behaviors, indicating very little ullage gas interaction between<br />
the three areas, while the sample ports within these areas consistently behaved similarly to one<br />
another. For this reason, the data is <strong>of</strong>ten presented in terms <strong>of</strong> the average oxygen concentration<br />
in the three areas described.<br />
4.1.1 <strong>Center</strong> <strong>Wing</strong> <strong>Tank</strong> Ullage Washing.<br />
Before each test, the CWT <strong>of</strong> the test article was inerted to the desired oxygen concentration (8%<br />
oxygen by volume), to the best ability <strong>of</strong> the test team, using the NEA generator via the NEA<br />
distribution manifold installed in the tank. The initial test resulted in the CWT being inerted to a<br />
much lower oxygen concentration than desired due to the lag in the sampling system.<br />
Eventually, fuel clogged portions <strong>of</strong> the distribution manifold <strong>and</strong> equal distribution <strong>of</strong> NEA to<br />
each fuel tank bay became impossible. The distribution manifold used flexible hose to extend<br />
from bay to bay, which allowed for fuel to collect. A more advanced design would minimize<br />
low points <strong>and</strong> provide for proper draining to prevent this. At that point, to obtain the desired<br />
oxygen concentration in the fuel tank ullage, it was washed unevenly with NEA 92.5% for an<br />
extended period until all oxygen analyzers read approximately 8% oxygen.<br />
Figure 7 gives a plot <strong>of</strong> average oxygen concentration versus time during ground test 1. This<br />
graph also has a line <strong>of</strong> constant 8% oxygen concentration highlighting when each tank area<br />
reached the desired inert level. In this case, it was for an empty tank (0% fuel) with 95% NEA at<br />
a flow rate <strong>of</strong> 90 CFM. This data was nondimensionalized in the manner outlined in section 3.1<br />
<strong>and</strong> is given figure 7. In figure 8, the inerting data are compared with the exact <strong>and</strong> empirical<br />
solutions identified in section 3.2. Figure 8 illustrates a volumetric tank exchange (VTE) <strong>of</strong> 1.75<br />
required to achieve the desired inerting ratio, which is slightly greater then the theoretical value<br />
given by the exact solution <strong>of</strong> 1.7 <strong>and</strong> significantly greater then the empirical relationship that<br />
results in a VTE <strong>of</strong> 1.5.<br />
<strong>Ground</strong> test 2 ullage-washing data are presented in figures 9 <strong>and</strong> 10, which are similar to ground<br />
test 1. For the second ground test, it was approximated that the correct volume <strong>of</strong> NEA was<br />
calculated that would be required to inert the tank to 8% oxygen concentration, <strong>and</strong> that amount<br />
<strong>of</strong> NEA 95% was supplied to the distribution manifold at 90 CFM. However, figure 10<br />
illustrates a VTE <strong>of</strong> approximately 1.85. The discrepancy between these two tests is most likely<br />
due to limitations in flow rate <strong>and</strong> oxygen analyzer accuracy.<br />
13
Inerting Ratio<br />
Oxygen Concentration (% Vol)<br />
25<br />
20<br />
15<br />
10<br />
5<br />
0<br />
8% Line<br />
0 2 4 6 8 10 12 14 16<br />
Time (minutes)<br />
Empty CWT 90 CFM, 95% NEA<br />
Average <strong>Center</strong> Bay<br />
Average Left Cheek<br />
Average Right Cheek<br />
FIGURE 7. GROUND TEST 1—ULLAGE WASHING AVERAGE OXYGEN<br />
CONCENTRATION DATA<br />
1<br />
0.9<br />
0.8<br />
0.7<br />
0.6<br />
0.5<br />
0.4<br />
0.3<br />
0.2<br />
0.1<br />
0<br />
Inerting Target = 0.81<br />
Empty CWT 90 CFM, 95% NEA<br />
Measured Data<br />
Exact Solution<br />
Empirical Equation<br />
0 0.5 1 1.5 2 2.5<br />
Volumetric <strong>Tank</strong> Exchange<br />
FIGURE 8. GROUND TEST 1—NONDIMENSTIONAL ULLAGE-WASHING DATA<br />
14<br />
18<br />
3
Oxygen Concentration (% Vol)<br />
25<br />
20<br />
15<br />
10<br />
5<br />
0<br />
8% Line<br />
0 2 4 6 8 10 12<br />
Time (minutes)<br />
Empty CWT 90 CFM, 95% NEA<br />
Average <strong>Center</strong> Bay<br />
Average Left Cheek<br />
Average Right Cheek<br />
FIGURE 9. GROUND TEST 2—ULLAGE WASHING AVERAGE OXYGEN<br />
CONCENTRATION DATA<br />
Inerting Ratio<br />
1<br />
0.9<br />
0.8<br />
0.7<br />
0.6<br />
0.5<br />
0.4<br />
0.3<br />
0.2<br />
0.1<br />
0<br />
Inerting Target = 0.81<br />
0 0.5 1 1.5 2 2.5<br />
Volumetric <strong>Tank</strong> Exchange<br />
Empty CWT 90 CFM, 95% NEA<br />
Measured Data<br />
Exact Solution<br />
Empirical Equation<br />
FIGURE 10. GROUND TEST 2—NONDIMENSTIONAL ULLAGE-WASHING DATA<br />
15<br />
14
Both figures 7 <strong>and</strong> 9 illustrate that the manifold was not completely balanced given the flow<br />
conditions <strong>of</strong> the test. The oxygen concentration <strong>of</strong> the cheeks decreased at a faster rate,<br />
resulting in an uneven distribution <strong>of</strong> NEA. The outflow <strong>of</strong> the tank is through the vent system<br />
ports which are located in each cheek area. This had the effect <strong>of</strong> decreasing the efficiency <strong>of</strong><br />
the inerting process by a small factor from the theoretical solution. The FAA empirical data<br />
illustrates a greater efficiency <strong>of</strong> inerting. This is most likely due to the accuracy <strong>of</strong> the oxygen<br />
analyzer used for the testing, but more information is needed to validate or refute the FAA<br />
empirical data illustrating a VTE <strong>of</strong> 1.5 is required to inert a fuel tank ullage to an 8% oxygen<br />
concentration with NEA 95%.<br />
4.1.2 Wind Effects.<br />
To examine the effect <strong>of</strong> wind on the ability <strong>of</strong> the CWT to remain inert, the tank was inerted on<br />
two different occasions with zero fuel load <strong>and</strong> allowed to sit on condition for 2 hours. As<br />
previously discussed, the condition consisted <strong>of</strong> remaining parked at the test location with the air<br />
cycle machines running for 2 hours. One test was with quiescent wind conditions while the other<br />
test had a fan blowing over the right wing vent only, to simulate a crosswind effecting only one<br />
vent. This created a differential pressure between the CWT wing vents to determine the effect<br />
on the ullage oxygen concentration.<br />
The results <strong>of</strong> the quiescent <strong>and</strong> simulated crosswind tests are seen in figures 11 <strong>and</strong> 12,<br />
respectively. These illustrate that under quiescent conditions the NEA dispersed very little (not<br />
measurable); however, the simulated crosswind had a pr<strong>of</strong>ound effect on the average oxygen<br />
concentration <strong>of</strong> the left cheek area, which is where the right wing vent opens to the CWT. The<br />
average oxygen concentration in the left cheek reached 10% in less than 20 minutes, illustrating<br />
a need to limit cross venting <strong>of</strong> a CWT under some conditions <strong>of</strong> GBI for aircraft with crossvented<br />
fuel tanks. Figure 13 gives the oxygen concentration data from the seven port locations<br />
used to calculate the average values, further highlighting the need to limit cross venting. This<br />
graph shows that the port closest to the vent exit (5) reached 10% in less than 15 minutes, only 6<br />
minutes after the simulated wind began.<br />
Figure 14 compares the overall average CWT oxygen concentration for both wind conditions,<br />
illustrating the pr<strong>of</strong>ound effect <strong>of</strong> the simulated crosswind.<br />
4.1.3 <strong>Fuel</strong> Load Effects.<br />
To determine the effect <strong>of</strong> fuel loads on an inert ullage during ground operations, the CWT was<br />
inerted twice to 8% oxygen concentration <strong>and</strong> then loaded with fuel to 20% <strong>and</strong> 80%,<br />
respectively. The aircraft remained on condition (packs running) for 1.5 to 2 hours. The average<br />
oxygen concentration for the three CWT areas is presented for the 20% <strong>and</strong> 80% fuel case in<br />
figures 15 <strong>and</strong> 16, respectively.<br />
16
Oxygen Concentration (% vol)<br />
Oxygen Concentration (% vol)<br />
8<br />
7<br />
6<br />
5<br />
4<br />
3<br />
2<br />
1<br />
0<br />
18<br />
16<br />
14<br />
12<br />
10<br />
8<br />
6<br />
4<br />
2<br />
0<br />
0 20 40 60 80 100 120 140<br />
Time (minutes)<br />
Zero <strong>Fuel</strong> - Calm Day<br />
Cross Vented CWT<br />
Average <strong>Center</strong> Bay<br />
Average Left Cheek<br />
Average Right Cheek<br />
FIGURE 11. CALM WINDS CWT NEA DISPERSION DATA<br />
0 20 40 60 80 100 120 140<br />
Time (minutes)<br />
Zero <strong>Fuel</strong> - Simulated Wind<br />
Cross Vented CWT<br />
Average <strong>Center</strong> Bay<br />
Average Left Cheek<br />
Average Right Cheek<br />
FIGURE 12. SIMULATED HIGH WINDS CWT NEA DISPERSION AVERAGE BAY DATA<br />
17
Oxygen Concentration (% Vol)<br />
20.0<br />
18.0<br />
16.0<br />
14.0<br />
12.0<br />
10.0<br />
8.0<br />
6.0<br />
4.0<br />
2.0<br />
0.0<br />
Start Wind<br />
0 20 40 60 80 100 120 140<br />
Time (minutes)<br />
Empty CWT, Simulated Wind<br />
Port 1 Port 2<br />
Port 4 Port 5<br />
Port 6 Port 7<br />
Port 8<br />
FIGURE 13. SIMULATED HIGH WINDS CWT NEA DISPERSION INDIVIDUAL<br />
PORT DATA<br />
Oxygen Concentration (% vol)<br />
14<br />
12<br />
10<br />
8<br />
6<br />
4<br />
2<br />
0<br />
0 20 40 60 80 100 120 140<br />
Time (minutes)<br />
Cross Vented CWT<br />
Average CWT O 2 Concentration<br />
0 <strong>Fuel</strong>, Calm Wind<br />
0 <strong>Fuel</strong>, Simulated Wind<br />
FIGURE 14. COMPARISON OF NEA DISPERSION FOR TWO WIND CONDITIONS<br />
18
Oxygen Concentration (% vol)<br />
10<br />
9<br />
8<br />
7<br />
6<br />
5<br />
4<br />
3<br />
2<br />
1<br />
Stop <strong>Fuel</strong>ing<br />
Start <strong>Fuel</strong>ing<br />
0<br />
0 20 40 60 80 100 120 140 160 180<br />
Time (minutes)<br />
20% <strong>Fuel</strong> - Simulated Calm<br />
Cross Vented CWT<br />
Average <strong>Center</strong> Bay<br />
Average Left Cheek<br />
Average Right Cheek<br />
FIGURE 15. TWENTY-PERCENT FUEL LOAD NEA DISPERSION DATA—FUELED<br />
AFTER INERTING<br />
Oxygen Concentration (% vol)<br />
18<br />
16<br />
14<br />
12<br />
10<br />
8<br />
6<br />
4<br />
2<br />
0<br />
Start <strong>Fuel</strong>ing<br />
Stop <strong>Fuel</strong>ing<br />
0 20 40 60 80 100<br />
Time (minutes)<br />
80% <strong>Fuel</strong> - Natural Wind<br />
Cross Vented CWT<br />
Average <strong>Center</strong> Bay<br />
Average Left Cheek<br />
Average Right Cheek<br />
FIGURE 16. EIGHTY-PERCENT FUEL LOAD NEA DISPERSION DATA—<br />
FUELED AFTER INERTING<br />
19<br />
120
The effect <strong>of</strong> fueling on the inert ullage space was substantial but did not cause the average<br />
oxygen concentration in any <strong>of</strong> the three main areas <strong>of</strong> the tank to increase significantly above<br />
10% oxygen by volume. The 80% fuel case had the highest increase in oxygen concentration<br />
with the 20% fuel case having about half the effect. The increase in oxygen concentration was<br />
attributed to dissolved gases being released from the fuel during refueling, but more information<br />
<strong>and</strong> testing is needed to validate this hypothesis.<br />
During the ground condition, the 20% fuel load case illustrates no significant effect <strong>of</strong> the fuel on<br />
the ullage oxygen concentration after refueling. The effect <strong>of</strong> the higher fuel load on the inert<br />
ullage for the 80% fuel case cannot be determined, as high winds caused a rapid increase in<br />
oxygen concentration that would far overshadow any effect the fuel would have displayed. The<br />
80% fuel case was repeated, except the fuel was loaded before the ullage was inerted. The<br />
inerting <strong>of</strong> the previously fueled tank presented no unique problems; however, again, high winds<br />
prevented visualizing any effect <strong>of</strong> the fuel load on the tank oxygen concentration.<br />
4.2 FLIGHT TESTING.<br />
The flight testing data focuses on two distinct research areas. The first is to validate the<br />
assumption that the CWT cross-vented configuration <strong>of</strong> most <strong>Boeing</strong> aircraft will not allow for<br />
proper dispersion <strong>of</strong> the NEA during normal flight operations. The second is to quantify the<br />
effects <strong>of</strong> fuel load on the inert ullage during normal flight operations.<br />
The data is generally presented in terms <strong>of</strong> an average <strong>of</strong> the three primary areas <strong>of</strong> the CWT <strong>and</strong><br />
the flight pr<strong>of</strong>ile data to illustrate take<strong>of</strong>f, ascent, cruise, <strong>and</strong> descent. Comparison plots are also<br />
presented that highlight a specific effect such as the effect <strong>of</strong> fuel load as it pertains to climb or<br />
fuel burn at cruise.<br />
4.2.1 <strong>Center</strong> <strong>Wing</strong> <strong>Tank</strong> Cross-Venting Effect.<br />
The effect <strong>of</strong> the cross-venting configuration on the dispersion <strong>of</strong> NEA in the CWT <strong>of</strong> the<br />
aircraft was again examined in a flight test. The aircraft CWT was inerted to 8%, <strong>and</strong> after a<br />
brief settling period, the air cycle machines were operated for 20 minutes on the ground. The<br />
aircraft then briefly taxied to a runway <strong>and</strong> took <strong>of</strong>f. The aircraft proceeded to an altitude <strong>of</strong><br />
35,000 feet, as prescribed by air traffic control, <strong>and</strong> then did several st<strong>and</strong>ard maneuvers at<br />
altitude. Figure 17 illustrates the pr<strong>of</strong>ound effect <strong>of</strong> these maneuvers. After 1 hour <strong>of</strong> flight, the<br />
pilot trimmed the aircraft in an intentional sideslip to create a differential pressure between the<br />
wing tip vents to allow for fuel tank vent cross-flow. This data illustrates that the three primary<br />
CWT areas had an average oxygen concentration <strong>of</strong> less then 10% for only approximately 40-50<br />
minutes at cruise altitude.<br />
These data were repeated after an aircraft modification was performed to prevent cross venting<br />
<strong>of</strong> the CWT by blocking one vent channel. The pilot repeated the flight pr<strong>of</strong>ile <strong>and</strong> test<br />
procedures as best as possible. Figure 18 illustrates the pr<strong>of</strong>ound difference <strong>of</strong> eliminating cross<br />
venting on the ability <strong>of</strong> the tank to remain inert during normal flight operations. The average<br />
oxygen concentration in each bay remained below 10% for virtually the entire flight until<br />
20
Oxygen Concentration (% vol)<br />
25<br />
20<br />
15<br />
10<br />
5<br />
0<br />
Zero <strong>Fuel</strong><br />
Cross Vented CWT<br />
Average <strong>Center</strong> Bay<br />
Average Left Cheek<br />
Average Right Cheek<br />
Altitude Trace<br />
0 50 100 150 200 250<br />
Time (minutes)<br />
FIGURE 17. ZERO FUEL LOAD FLIGHT TEST NEA DISPERSION DATA WITH<br />
CROSS-VENTING CONFIGURATION<br />
Oxygen Concentration (% vol)<br />
25<br />
20<br />
15<br />
10<br />
5<br />
0<br />
Zero <strong>Fuel</strong><br />
No Cross Venting<br />
Average <strong>Center</strong> Bay<br />
Average Left Cheek<br />
Average Right Cheek<br />
Altitude Trace<br />
0 50 100 150 200 250 300<br />
Time (minutes)<br />
FIGURE 18. ZERO FUEL LOAD FLIGHT TEST NEA DISPERSION DATA WITHOUT<br />
CROSS VENTING<br />
21<br />
40000<br />
35000<br />
30000<br />
25000<br />
20000<br />
15000<br />
10000<br />
5000<br />
0<br />
40000<br />
35000<br />
30000<br />
25000<br />
20000<br />
15000<br />
10000<br />
5000<br />
0<br />
Altitude (ft)<br />
Altitude (ft)
descent. During descent, the oxygen concentration <strong>of</strong> the tank rose sharply as expected, as<br />
outside air rushed in the vents to equalize pressure between the outside <strong>and</strong> inside <strong>of</strong> the CWT.<br />
Figure 19 compares the overall average fuel tank oxygen concentration for both tests starting at<br />
take<strong>of</strong>f. This highlights the effect <strong>of</strong> eliminating cross venting on the ability to maintain a low<br />
oxygen concentration in a fuel tank during flight operations after ground-based inerting.<br />
Oxygen Concentration (% vol)<br />
18<br />
16<br />
14<br />
12<br />
10<br />
8<br />
6<br />
4<br />
2<br />
0<br />
Climb <strong>and</strong> Cruise, 0 <strong>Fuel</strong><br />
Take<strong>of</strong>f at Time 0<br />
Vent Modified for No X Flow<br />
No Vent Modification<br />
0 20 40 60 80 100 120 140 160<br />
Time (minutes)<br />
FIGURE 19. AVERAGE CWT O2 CONCENTRATION INCREASE COMPARISON PLOT<br />
FOR BOTH CROSS-VENTED AND NO CROSS-FLOW FLIGHTS<br />
4.2.2 <strong>Fuel</strong> Effects at Altitude.<br />
To study the effect <strong>of</strong> fuel load on an inert ullage, figure 18 was employed to establish a baseline<br />
<strong>of</strong> NEA dispersion without cross venting <strong>and</strong> no fuel in the CWT. The CWT average oxygen<br />
concentration increased approximately 1.5% during the ascent <strong>and</strong> 2-hour cruise. The three<br />
remaining flight tests each use the same basic flight pr<strong>of</strong>ile with three different fuel loads.<br />
Figure 20 gives the average oxygen concentration in the three primary areas <strong>of</strong> the CWT for a<br />
flight test using the st<strong>and</strong>ard flight pr<strong>of</strong>ile with a 20% fuel load. The unusually steep increase in<br />
average right-cheek oxygen concentration, at approximately 90 minutes <strong>and</strong> lasting for<br />
approximately 30 minutes, could be explained by the large decrease in temperature that bay sees<br />
at that point in the flight, but more data is needed to explain this behavior. The average oxygen<br />
concentration <strong>of</strong> the CWT is below 10% for the vast majority <strong>of</strong> the flight. As fuel is used from<br />
the CWT, ambient air flows into the vent system to equalize the pressure, increasing the oxygen<br />
concentration in the ullage <strong>of</strong> the fuel tank. Since the CWT fuel is used first, the increase should<br />
22
e evidenced early in the flight, with the degree <strong>and</strong> duration depending upon the fuel load in<br />
question.<br />
Oxygen Concentration (% vol)<br />
25<br />
20<br />
15<br />
10<br />
5<br />
0<br />
20% <strong>Fuel</strong> Load<br />
No Cross Venting<br />
Average <strong>Center</strong> Bay<br />
Average Left Cheek<br />
Average Right Cheek<br />
Altitude Trace<br />
0 50 100 150 200 250 300 350<br />
Time (minutes)<br />
FIGURE 20. TWENTY-PERCENT FUEL LOAD FLIGHT TEST NEA DISPERSION<br />
DATA WITHOUT CROSS VENTING<br />
Figures 21 <strong>and</strong> 22 illustrate the same average oxygen concentration data for 40% <strong>and</strong> 80% fuel<br />
load, respectively, given the same st<strong>and</strong>ard flight pr<strong>of</strong>ile. These cases experienced a marked<br />
increase in oxygen concentration, as would be expected, as more air flows into the vent the<br />
greater amount <strong>of</strong> fuel is used. The 80% fuel load had a 2-hour sit time added to the test plan to<br />
duplicate the 80% full fuel ground case. It was illustrated that, without cross venting <strong>of</strong> the<br />
CWT, the oxygen concentration in the ullage only rose, on average, less then 1% over the 2-hour<br />
period.<br />
To compare the effects <strong>of</strong> fuel load as it pertains to flight operations, the overall average CWT<br />
oxygen concentration was plotted for the four fuel load flight tests. Figure 23 gives the change<br />
in average CWT oxygen concentration during the four flight tests without cross venting at each<br />
fuel load tested. This illustrates the effect <strong>of</strong> fuel load on the increase in ullage oxygen<br />
concentration for the flight pr<strong>of</strong>ile previously discussed. As expected, the greater the fuel load,<br />
the greater the effect on the ullage oxygen concentration. As more fuel is used, more air enters<br />
the fuel tank <strong>and</strong> raises the oxygen concentration.<br />
23<br />
40000<br />
35000<br />
30000<br />
25000<br />
20000<br />
15000<br />
10000<br />
5000<br />
0<br />
Altitude (ft)
Oxygen Concentration (% vol)<br />
25<br />
20<br />
15<br />
10<br />
5<br />
0<br />
40% <strong>Fuel</strong> Load<br />
No Cross Venting<br />
Average <strong>Center</strong> Bay<br />
Average Left Cheek<br />
Average Right Cheek<br />
Altitude Trace<br />
0 50 100 150 200 250 300<br />
Time (minutes)<br />
FIGURE 21. FORTY-PERCENT FUEL LOAD FLIGHT TEST NEA DISPERSION<br />
DATA WITHOUT CROSS VENTING<br />
Oxygen Concentration (% vol)<br />
25<br />
20<br />
15<br />
10<br />
5<br />
0<br />
80% <strong>Fuel</strong> Load<br />
No Cross Venting<br />
Average <strong>Center</strong> Bay<br />
Average Left Cheek<br />
Average Right Cheek<br />
Altitude Trace<br />
0 50 100 150 200 250 300 350<br />
Time (minutes)<br />
FIGURE 22. EIGHTY-PERCENT FUEL LOAD FLIGHT TEST NEA DISPERSION<br />
DATA WITHOUT CROSS VENTING<br />
24<br />
40000<br />
35000<br />
30000<br />
25000<br />
20000<br />
15000<br />
10000<br />
5000<br />
0<br />
40000<br />
35000<br />
30000<br />
25000<br />
20000<br />
15000<br />
10000<br />
5000<br />
0<br />
Altitude (ft)<br />
Altitude (ft)
Oxygen Concentration Change (% vol)<br />
9<br />
8<br />
7<br />
6<br />
5<br />
4<br />
3<br />
2<br />
1<br />
0<br />
Climb <strong>and</strong> Cruise with No X Venting<br />
Take<strong>of</strong>f at Time 0<br />
80% <strong>Fuel</strong> Load<br />
40 % <strong>Fuel</strong> Load<br />
20% <strong>Fuel</strong> Load<br />
Zero <strong>Fuel</strong><br />
0 20 40 60 80 100 120 140 160<br />
Time (minutes)<br />
FIGURE 23. AVERAGE CWT O2 CONCENTRATION INCREASE COMPARISON<br />
PLOT FOR DIFFERENT FUEL LOADS FOR ENTIRE FLIGHT<br />
To illustrate the effect <strong>of</strong> fuel burn, the fuel concentration during cruise, expressed as a<br />
percentage <strong>of</strong> fuel load, was plotted against oxygen concentration (figure 24). Examining figure<br />
24, it can be seen that both the 40% <strong>and</strong> the 80% fuel load tests burned the same fuel quantity at<br />
altitude (30% <strong>of</strong> the fuel load), but the 80% fuel case oxygen concentration during the 80% fuel<br />
load test rose, on average, 1.5% more. This is the combined effect <strong>of</strong> the larger fuel load having<br />
a greater amount <strong>of</strong> dissolved oxygen being liberated from the fuel <strong>and</strong> a smaller ullage to affect.<br />
It is presumed that the primary effect is due to the smaller ullage, but further tests <strong>and</strong> analysis<br />
are required to quantify the effect <strong>of</strong> the fuel on the ullage oxygen concentration. The 1.5%<br />
difference accounts for less then half <strong>of</strong> the difference in the total increase in average ullage<br />
oxygen concentration during the 40% <strong>and</strong> 80% fuel load tests. The cruise portion <strong>of</strong> the 80%<br />
fuel load test started with the oxygen concentration being 2.5% greater then the cruise portion <strong>of</strong><br />
the 40% fuel load test. This is presumed to be (in part) because the larger fuel load liberated<br />
more oxygen during the climb portion <strong>of</strong> the flight test. Also, the 80% fuel load test took <strong>of</strong>f<br />
with over a 1% greater oxygen concentration in the CWT.<br />
Figure 25 gives the oxygen concentration with respect to altitude during the climb portion <strong>of</strong> the<br />
0%, 20%, 40%, <strong>and</strong> 80% fuel load tests. The 40% <strong>and</strong> 80% fuel load cases illustrate a similar<br />
behavior; however, the 80% fuel case has a marked increase in oxygen concentration during the<br />
last 5 to 10 thous<strong>and</strong> feet <strong>of</strong> climb even though both tests used a similar amount <strong>of</strong> fuel load<br />
during climb (10%). This also was presumed to be in part due to larger fuel load liberating a<br />
greater amount <strong>of</strong> oxygen during climb <strong>and</strong> effecting a smaller space.<br />
25
Oxygen Concentration (% vol)<br />
18<br />
16<br />
14<br />
12<br />
10<br />
8<br />
6<br />
4<br />
2<br />
0<br />
0% 10% 20% 30% 40% 50% 60% 70% 80%<br />
<strong>Fuel</strong> Load<br />
Cruise Speed at Altitude<br />
No Cross Venting<br />
80% <strong>Fuel</strong><br />
40% <strong>Fuel</strong><br />
20% <strong>Fuel</strong><br />
FIGURE 24. CHANGE IN AVERAGE CWT O2 CONCENTRATION COMPARISON<br />
PLOT FOR DIFFERENT FUEL LOADS DURING CRUISE<br />
Oxygen Concentration Change(% vol)<br />
2.0<br />
1.8<br />
1.6<br />
1.4<br />
1.2<br />
1.0<br />
0.8<br />
0.6<br />
0.4<br />
0.2<br />
0.0<br />
0-35K Foot Climb<br />
No Cross Venting<br />
80% <strong>Fuel</strong><br />
40% <strong>Fuel</strong><br />
20% <strong>Fuel</strong><br />
0% <strong>Fuel</strong><br />
0 5000 10000 15000 20000 25000 30000 35000 40000<br />
Altitude (ft)<br />
FIGURE 25. CHANGE IN AVERAGE CWT O2 CONCENTRATION COMPARISON<br />
PLOT FOR DIFFERENT FUEL LOADS DURING CLIMB<br />
26
5. SUMMARY.<br />
<strong>Ground</strong>-based inerting was successfully executed on a <strong>Boeing</strong> <strong>737</strong>-700 in a flight test<br />
environment. The CWT was inerted with 95% NEA, using approximately 1.8 tank volume<br />
exchanges <strong>of</strong> inerting gas, also known as the volumetric tank exchange (VTE). During quiescent<br />
wind ground tests <strong>and</strong> the ground test without CWT cross venting, the ullage oxygen<br />
concentration was relatively stable. The small increases measured would have allowed the<br />
average tank oxygen concentration to remain below 10% for over 4 hours, even with a fuel load<br />
<strong>of</strong> 80%. Simulated <strong>and</strong> real-wind conditions created rapid increases in oxygen concentration in<br />
the CWT. However, with the installation <strong>of</strong> a device to prevent cross venting <strong>of</strong> the tank, the<br />
wind effects on these test points were eliminated. <strong>Flight</strong> tests with <strong>and</strong> without cross venting<br />
highlight this pr<strong>of</strong>ound effect on fuel tank inerting in flight. During a flight test with no fuel <strong>and</strong><br />
a cross-vented center wing tank, the average ullage oxygen concentration remained below 10%<br />
for about 1 hour <strong>of</strong> flight <strong>and</strong> local oxygen concentrations rose above 10% in less then 45<br />
minutes. With cross venting eliminated, under the same test scenario, the average oxygen<br />
concentration was maintained below 10% through the entire cruise portion <strong>of</strong> the flight.<br />
Increased fuel loads had a negative effect on the time the average oxygen concentration <strong>of</strong> the<br />
tank remained below 10%. While the 20% fuel load test remained below 10% oxygen for the<br />
entire cruise portion <strong>of</strong> the flight test, the 80% fuel load remained below 10% for less than 15<br />
minutes. As expected, during descent air entering the center wing tank to equalize pressure,<br />
created large <strong>and</strong> immediate increases in ullage oxygen concentration.<br />
6. REFERENCES.<br />
1. “<strong>Fuel</strong> <strong>Tank</strong> Harmonization Working Group Final Report,” Aviation Rulemaking<br />
Advisory Committee, July 1998.<br />
2. Cavage, William, “The Cost <strong>of</strong> Implementing <strong>Ground</strong>-Based <strong>Fuel</strong> <strong>Tank</strong> Inerting in the<br />
Commercial Fleet,” DOT/FAA/AR-00/19, May 2000.<br />
3. Burns, Michael <strong>and</strong> Cavage, William M., “Inerting <strong>of</strong> a Vented Aircraft <strong>Fuel</strong> <strong>Tank</strong> Test<br />
Article With Nitrogen-Enriched Air,” DOT/FAA/AR-01/6, April 2001.<br />
27/28