A Study of Gene Linkage and Mapping Using - Association for ...
A Study of Gene Linkage and Mapping Using - Association for ...
A Study of Gene Linkage and Mapping Using - Association for ...

Create successful ePaper yourself
Turn your PDF publications into a flip-book with our unique Google optimized e-Paper software.
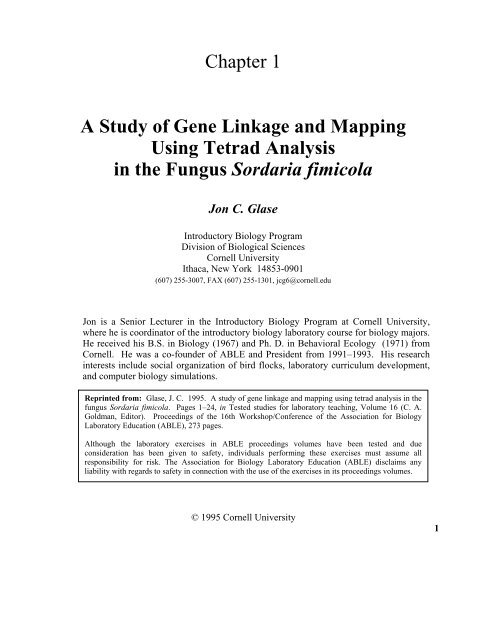
Chapter 1<br />
A <strong>Study</strong> <strong>of</strong> <strong>Gene</strong> <strong>Linkage</strong> <strong>and</strong> <strong>Mapping</strong><br />
<strong>Using</strong> Tetrad Analysis<br />
in the Fungus Sordaria fimicola<br />
Jon C. Glase<br />
Introductory Biology Program<br />
Division <strong>of</strong> Biological Sciences<br />
Cornell University<br />
Ithaca, New York 14853-0901<br />
(607) 255-3007, FAX (607) 255-1301, jcg6@cornell.edu<br />
Jon is a Senior Lecturer in the Introductory Biology Program at Cornell University,<br />
where he is coordinator <strong>of</strong> the introductory biology laboratory course <strong>for</strong> biology majors.<br />
He received his B.S. in Biology (1967) <strong>and</strong> Ph. D. in Behavioral Ecology (1971) from<br />
Cornell. He was a co-founder <strong>of</strong> ABLE <strong>and</strong> President from 1991–1993. His research<br />
interests include social organization <strong>of</strong> bird flocks, laboratory curriculum development,<br />
<strong>and</strong> computer biology simulations.<br />
Reprinted from: Glase, J. C. 1995. A study <strong>of</strong> gene linkage <strong>and</strong> mapping using tetrad analysis in the<br />
fungus Sordaria fimicola. Pages 1–24, in Tested studies <strong>for</strong> laboratory teaching, Volume 16 (C. A.<br />
Goldman, Editor). Proceedings <strong>of</strong> the 16th Workshop/Conference <strong>of</strong> the <strong>Association</strong> <strong>for</strong> Biology<br />
Laboratory Education (ABLE), 273 pages.<br />
Although the laboratory exercises in ABLE proceedings volumes have been tested <strong>and</strong> due<br />
consideration has been given to safety, individuals per<strong>for</strong>ming these exercises must assume all<br />
responsibility <strong>for</strong> risk. The <strong>Association</strong> <strong>for</strong> Biology Laboratory Education (ABLE) disclaims any<br />
liability with regards to safety in connection with the use <strong>of</strong> the exercises in its proceedings volumes.<br />
© 1995 Cornell University<br />
1
2 Tetrad Analysis<br />
Contents<br />
Introduction ......................................................................................................2<br />
Materials...........................................................................................................3<br />
Notes <strong>for</strong> the Instructor.....................................................................................3<br />
Student Outline.................................................................................................4<br />
Literature Cited.................................................................................................21<br />
Appendix A: Student Data <strong>and</strong> <strong>Study</strong> Questions with Answers ......................22<br />
Introduction<br />
The laboratory presented here has been used in the introductory course <strong>for</strong> biology majors at<br />
Cornell University <strong>for</strong> the past 15 years. It was designed to accomplish the following objectives:<br />
1. to rein<strong>for</strong>ce knowledge <strong>of</strong> meiosis <strong>and</strong> its importance in transmission genetics,<br />
2. to introduce the concepts <strong>of</strong> gene linkage <strong>and</strong> mapping,<br />
3. to provide experience with fungal life cycle stages <strong>and</strong> with sterile methods <strong>for</strong> manipulating<br />
microorganisms,<br />
4. to illustrate the use <strong>of</strong> the chi-square statistical test <strong>for</strong> selecting between different genetic<br />
models, <strong>and</strong><br />
5. to show application <strong>of</strong> the probability laws to the study <strong>of</strong> biological problems.<br />
The fungi, especially those ascomycetes that produce isolated, ordered tetrads, have been<br />
fundamentally important to the teaching <strong>of</strong> genetics (Cassell <strong>and</strong> Mertens, 1968; Fincham, 1971).<br />
We selected the genus Sordaria over Neurospora <strong>for</strong> this study because <strong>of</strong> the absence <strong>of</strong> asexual,<br />
conidiospores in Sordaria. This reduces considerably the problem <strong>of</strong> accidental contamination <strong>of</strong><br />
cultures. S. fimicola is a species that has been extensively studied (El-Ani et al., 1961; El-Ani <strong>and</strong><br />
Olive, 1975) <strong>and</strong> <strong>for</strong> which numerous genetic markers are available. Spore color genes that have<br />
been studied in this species (Olive, 1956) are especially useful <strong>for</strong> teaching purposes because they<br />
allow tetrad analysis <strong>of</strong> intact asci <strong>and</strong> direct observation <strong>of</strong> the effects <strong>of</strong> crossing over. We chose<br />
S. fimicola over S. brevicollis, another species in this genus that has been used <strong>for</strong> teaching<br />
purposes, because S. fimicola does not undergo the spindle overlap during the second meiotic<br />
division that occurs in S. brevicollis (Chen <strong>and</strong> Olive, 1965). Spindle overlap makes tetrad analysis<br />
less direct <strong>and</strong> reduces its pedagogical effectiveness in illustrating the genetic implications <strong>of</strong><br />
meiosis. However, since S. brevicollis is a heterothallic species, all <strong>of</strong> its perithecia contain asci<br />
resulting from interstrain mating. This makes locating asci suitable <strong>for</strong> tetrad analysis easier than in<br />
S. fimicola, which is homothallic.<br />
The version <strong>of</strong> the laboratory described here involves examining the results <strong>of</strong> mating between<br />
mutant strains <strong>for</strong> two spore color genes (tan spore <strong>and</strong> gray spore) in order to map these genes <strong>and</strong><br />
determine if they are linked. The laboratory extends over 3 weeks. Students set up the cross during<br />
the first week. Asci mature during the second week <strong>and</strong> are held in the refrigerator until the third<br />
week when tetrad analysis occurs <strong>and</strong> data are shared among the class. Included in the Appendix is<br />
a set <strong>of</strong> study questions (<strong>and</strong> answers) designed to help students with the analysis <strong>and</strong> interpretation<br />
<strong>of</strong> these data. This laboratory can be accomplished in one 3-hour laboratory if the genetic cross is<br />
set up <strong>for</strong> the students about 10 days ahead <strong>of</strong> time.<br />
An alternate, simpler approach that requires more laboratory time is to have students begin with<br />
tetrad analysis <strong>of</strong> the wild type-mutant crosses (wild type × gray spore; wild type × tan spore).<br />
These data allow each gene to be mapped in isolation <strong>of</strong> the other gene. This is then followed by
Tetrad Analysis 3<br />
tetrad analysis <strong>of</strong> the mutant-mutant cross <strong>and</strong> these data are only used to determine linkage. The<br />
analysis <strong>of</strong> the mutant-mutant cross included here is more complex because students are using data<br />
to both map genes <strong>and</strong> determine if they are linked. Though more complex, we think that this <strong>for</strong>m<br />
<strong>of</strong> analysis is more educationally effective because it requires application <strong>of</strong> both <strong>of</strong> Mendel’s<br />
principles <strong>of</strong> inheritance <strong>and</strong> a knowledge <strong>of</strong> meiosis with each ascus examined.<br />
This study can be extended in a number <strong>of</strong> ways <strong>for</strong> use in upper-level biology courses, such as<br />
genetics. The genetic model most emphasized in this study is the unlinked model, but students<br />
could use the same approach to develop detailed predictions <strong>for</strong> the linked model (with genes on<br />
opposite or on the same side <strong>of</strong> the centromere). All models presented here consider only single<br />
crossovers. The effect <strong>of</strong> multiple crossovers <strong>and</strong> the use <strong>of</strong> mapping functions <strong>and</strong> the Poisson<br />
distribution to estimate real map distances from recombination map distances can also be included.<br />
Finally, a study <strong>of</strong> aberrant asci in Sordaria fimicola (Fincham, 1971) can lead to a consideration <strong>of</strong><br />
such modern topics as gene conversion <strong>and</strong> the Holliday model <strong>for</strong> recombination by crossing over.<br />
For more in<strong>for</strong>mation, see Chapter 6 on mapping functions <strong>and</strong> Chapter 18 on gene conversion <strong>and</strong><br />
the Holliday model in the text by Suzuki et al. (1989).<br />
Materials<br />
Compound microscopes, 10X <strong>and</strong> 40X objectives, binocular heads if possible (1 per student)<br />
Inoculating loops (1 per student)<br />
Alcohol lamps or equivalent (1 per pair <strong>of</strong> students)<br />
Bottles <strong>of</strong> alcohol <strong>for</strong> disinfecting bench tops (1 per pair <strong>of</strong> students)<br />
Microscope slides <strong>and</strong> coverslips (4 boxes per lab <strong>for</strong> making wet mounts)<br />
Boxes <strong>of</strong> kimwipes (1 per pair <strong>of</strong> students)<br />
Dropper bottles filled with water (1 per pair <strong>of</strong> students)<br />
Stock plates <strong>of</strong> gray spore <strong>and</strong> tan spore Sordaria strains (1 each per four students, used to set up<br />
crosses)<br />
Sterile agar plates <strong>for</strong> making crosses (2 per pair <strong>of</strong> students)<br />
Permanent markers (1 per student)<br />
Lens paper <strong>for</strong> cleaning microscope lenses<br />
Matches <strong>for</strong> lighting burners<br />
Notes <strong>for</strong> the Instructor<br />
1. Media preparation: The media we use <strong>for</strong> Sordaria plates is made from the following recipe: 17<br />
g corn meal agar, 10 g sucrose, 7 g glucose, 1 g yeast extract, 0.1 g KH2PO4, <strong>and</strong> 1 liter water.<br />
Autoclave media at 15 psi <strong>for</strong> 20–30 minutes. Let the plates age <strong>for</strong> 2–3 days be<strong>for</strong>e plating.<br />
2. Stock plates can be purchased from Carolina Biological Supply Co. (gray spore, #15-6293; tan<br />
spore, #15-6295). Inoculate your stock plates about 7 days be<strong>for</strong>e you want students to set up<br />
the crosses.<br />
3. Mating plates: After the crosses have been made store in a 25°C incubator. Invert the plates<br />
after 1–2 days. About 7 days after the crosses are set up, start to monitor the plates <strong>for</strong> spore<br />
release. Spores will appear as fine dust on the inner surface <strong>of</strong> the petri dish lid. When spores<br />
are seen, store the plates in a refrigerator until the students need them. You can also make test<br />
squashes to directly observe the asci. Immature spores have little color <strong>and</strong> are granular in<br />
appearance. Over-ripe asci break easily <strong>and</strong> release their spores.
4 Tetrad Analysis<br />
Student Outline<br />
Introduction<br />
Early genetic studies with the fruit fly, Drosophila melanogaster, suggested that a mechanism<br />
must exist to allow exchange <strong>of</strong> genetic material between homologous chromosomes. Microscopic<br />
studies <strong>of</strong> meiosis show that this exchange, called crossing over, takes place during prophase I when<br />
double-chromatid, homologous chromosomes are in synapsis. During crossing over, breakagerefusion<br />
points called chiasmata develop between synapsed chromosomes. These chiasmata result<br />
from pieces <strong>of</strong> the two homologues being switched in an equal <strong>and</strong> reciprocal fashion. Crossing<br />
over combines genetic material that had previously been on separate homologues <strong>and</strong> produces<br />
individuals with increased genetic variation. <strong>Gene</strong>ticists also came to realize that crossing over<br />
could be used as an important tool <strong>for</strong> learning more about the location <strong>of</strong> genes on chromosomes.<br />
They reasoned that if chiasmata can <strong>for</strong>m at any point between two homologous chromosomes, then<br />
the frequency <strong>of</strong> crossing over in the region between two different genes on a chromosome should<br />
vary directly with the physical distance between the genes. When this hypothesis was confirmed it<br />
was possible to begin mapping the positions <strong>of</strong> genes on chromosomes.<br />
In most genetic studies, a cross, or mating, is made between parents whose genotypes may be<br />
partially known. These parents contain gametes that have resulted from many meiotic divisions<br />
within their gamete-producing structures. Each meiotic division produces four haploid nuclei<br />
collectively called a tetrad. In most organisms the products <strong>of</strong> each meiotic division are not kept<br />
separate but become part <strong>of</strong> a “pool” <strong>of</strong> meiotic products (gametes). The mating activities <strong>of</strong> the<br />
parents combine these meiotic products in a r<strong>and</strong>om fashion to produce the next generation. Thus,<br />
in most organisms, it is impossible to examine the assortment <strong>of</strong> alleles in an individual meiotic<br />
division. However, such a genetic description <strong>of</strong> an individual meiotic division would be<br />
particularly advantageous in studying the occurrence <strong>and</strong> frequency <strong>of</strong> crossing over.<br />
In certain fungi, such as the pink bread mold, Neurospora crassa, <strong>and</strong> Sordaria fimicola,<br />
meiosis occurs within a structure called an ascus, which isolates each tetrad. The four products <strong>of</strong><br />
meiosis occur within the ascus in the order in which they arose during meiosis. With these<br />
organisms a special type <strong>of</strong> genetic analysis called tetrad analysis can be used. In tetrad analysis,<br />
the genetic make-up <strong>of</strong> each cell <strong>of</strong> a tetrad can be studied with respect to a particular trait, <strong>and</strong> this<br />
in<strong>for</strong>mation can be related to the meiotic division that produced the tetrad. Tetrad analysis makes it<br />
possible to determine when crossing over has occurred, <strong>and</strong> to use this in<strong>for</strong>mation to determine if<br />
genes are linked <strong>and</strong> to map the locations <strong>of</strong> genes on chromosomes.<br />
Fertilization consists <strong>of</strong> two separate, sequential events. First, fusion <strong>of</strong> the contents <strong>of</strong> two<br />
cells, called plasmogamy, <strong>for</strong>ms one cell with two haploid nuclei. Second, fusion <strong>of</strong> the haploid<br />
nuclei, called karyogamy, <strong>for</strong>ms a zygote with a diploid nucleus. In most organisms, karyogamy<br />
immediately follows plasmogamy. In the fungi, cells with two nuclei (called dikaryotic cells)<br />
remain <strong>for</strong> extended periods <strong>of</strong> time. Only at a later time when karyogamy occurs is a diploid<br />
zygote <strong>for</strong>med. In most fungi, the zygote is the only diploid stage in the life cycle.<br />
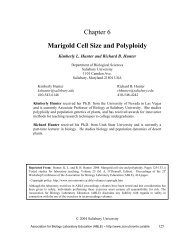
In Sordaria fimicola (Figure 1.1), the multicellular fungal body is composed <strong>of</strong> haploid cells<br />
arranged in long filaments called hyphae; the whole network <strong>of</strong> filaments is called a mycelium. If<br />
conditions are right, the fungus <strong>for</strong>ms sex organs containing numerous haploid nuclei. Nuclei then<br />
migrate from one organ to the other where they pair up. Budding <strong>of</strong>f <strong>for</strong>ms dikaryotic hyphae.<br />
Karyogamy occurs within an ascus primordium to <strong>for</strong>m a diploid zygote. Each zygote immediately<br />
undergoes meiosis, producing four haploid nuclei which each divide once, mitotically, yielding a<br />
total <strong>of</strong> eight haploid cells. Each cell develops a resistant cell wall <strong>and</strong> is called an ascospore. All<br />
<strong>of</strong> these events occur within an elongate sac called an ascus, so that at maturity an ascus contains<br />
eight ascospores arranged in a precise manner. Clusters <strong>of</strong> asci develop within a special spore
Tetrad Analysis 5<br />
dispersal structure called a perithecium. As the spores within each ascus mature, the ascus tip<br />
ruptures, <strong>and</strong> hydrostatic pressure within the ascus propels the spores out <strong>of</strong> the perithecium. The<br />
entire life cycle from spore germination to production <strong>of</strong> new spores in perithecia takes about 10<br />
days.<br />
Figure 1.1. The life cycle <strong>of</strong> the fungus Sordaria fimicola (modified from Rush<strong>for</strong>th, 1976).<br />
One important feature <strong>of</strong> ascus-<strong>for</strong>ming fungi is their special spore <strong>for</strong>mation process. The<br />
meiotic <strong>and</strong> mitotic divisions producing eight ascospores from one zygote are subject to the physical<br />
limitations imposed by the shape <strong>of</strong> the ascus. The long, thin ascus causes both meiotic spindles<br />
<strong>and</strong> the mitotic spindles to be aligned during spore <strong>for</strong>mation. As a result, the positioning <strong>of</strong> the<br />
ascospores directly reflects the arrangement <strong>of</strong> homologous chromosome pairs during metaphase I<br />
<strong>of</strong> meiosis. Also, since ascospores are haploid, all alleles are phenotypically expressed. The<br />
equivalence <strong>of</strong> genotype <strong>and</strong> phenotype in their haploid cells <strong>and</strong> their short generation time are two<br />
additional reasons <strong>for</strong> the extensive use <strong>of</strong> these fungi in genetics.
6 Tetrad Analysis<br />
The spore color <strong>of</strong> the normal (wild type) Sordaria is black. This phenotype is due to the<br />
production <strong>of</strong> the pigment melanin <strong>and</strong> its deposition in the cell walls. Several different genes are<br />
involved in the control <strong>of</strong> the melanin biosynthetic pathway <strong>and</strong> each gene has two possible allelic<br />
<strong>for</strong>ms. The gray spore gene has two allelic <strong>for</strong>ms: the wild type allele (g + ) <strong>and</strong> a mutant allele (g).<br />
The tan spore gene also has two <strong>for</strong>ms: a wild type allele (t + ) <strong>and</strong> a mutant allele (t). Normal black<br />
spores are produced only if both wild type alleles are present at the loci <strong>of</strong> both genes. Thus, black<br />
ascospores have the genotype g + t + (remember, spores are haploid). Those with the genotype g t +<br />
are gray, while g + t ascospores are tan. Ascospores that are g t show a cumulative effect <strong>of</strong> the two<br />
mutations <strong>and</strong> are colorless.<br />
Microscopic study shows that Sordaria has seven different chromosomes (n = 7). Are the gray<br />
spore <strong>and</strong> tan spore genes located on the same or on different chromosomes? <strong>Gene</strong>s that are located<br />
on the same chromosome are called linked genes. <strong>Gene</strong>s on different chromosomes are called<br />
unlinked genes. Today you will initiate a cross between the gray ascospore mutant strain <strong>and</strong> the<br />
tan ascospore mutant strain <strong>of</strong> Sordaria fimicola. In two weeks, you will use tetrad analysis to<br />
collect data from this cross <strong>and</strong> you will apply a knowledge <strong>of</strong> meiosis <strong>and</strong> Mendel’s two principles<br />
<strong>of</strong> inheritance to determine if the tan spore <strong>and</strong> gray spore genes are linked or unlinked <strong>and</strong> to map<br />
the location <strong>of</strong> each gene on its chromosome.<br />
Setting Up the Gray Spore × Tan Spore Cross<br />
1. Each pair <strong>of</strong> students should obtain two petri dishes containing cornmeal-glucose agar<br />
supplemented with 0.1% yeast extract. In addition, the class will be sharing several stock<br />
culture plates <strong>of</strong> the two mutants.<br />
2. Disinfect the work surface where you will be setting up the genetic crosses by thoroughly<br />
wiping the bench top with an ethanol saturated paper towel.<br />
3. With a marking pen, divide the bottoms <strong>of</strong> your petri dishes into fourths. Label each quadrant<br />
with a g + t or g t + as shown in Figure 1.2.<br />
Figure 1.2. Appearance <strong>of</strong> petri dish bottom <strong>for</strong> receiving inocula to make the gray spore (g t + ) ×<br />
tan spore (g + t) cross.<br />
4. Flame an inoculating loop with your alcohol burner. Lift the lid <strong>of</strong> one <strong>of</strong> the stock culture<br />
plates slightly <strong>and</strong> cool the inoculating loop by touching it to the lid’s sterile inner surface. Use<br />
the loop to cut a small piece <strong>of</strong> agar (about 3 mm square) containing abundant mycelial growth.<br />
5. Quickly transfer this inoculum to the center <strong>of</strong> the appropriate quadrant <strong>of</strong> one <strong>of</strong> your petri<br />
plates. Lift the lid <strong>of</strong> this plate just enough to allow insertion <strong>of</strong> the loop.
Tetrad Analysis 7<br />
6. Reflame your loop <strong>and</strong> repeat this procedure with both mutant stock cultures until all quadrants<br />
are appropriately inoculated. Flame the loop after your last transfer <strong>of</strong> inoculum.<br />
7. Carefully label each petri plate with your name <strong>and</strong> date <strong>of</strong> inoculation. <strong>Using</strong> two small pieces<br />
<strong>of</strong> tape, tape the plate closed <strong>and</strong> give it to your laboratory instructor.<br />
8. When you are finished, disinfect the lab bench again using an ethanol saturated paper towel.<br />
Your plates will be placed in an incubator at 25°C. When the perithecia that result from these<br />
genetic crosses are mature (about 8–10 days), the dishes will be placed in a refrigerator <strong>and</strong> returned<br />
to you two weeks from the day you per<strong>for</strong>med the cross. The following section provides<br />
in<strong>for</strong>mation to help you underst<strong>and</strong> the results obtained from this cross.<br />
Predictions And Data Collection<br />
Two weeks ago, you set up a cross between the gray spore mutant strain <strong>and</strong> the tan spore<br />
mutant strain <strong>of</strong> Sordaria fimicola.<br />
gray spore strain<br />
g t +<br />
×<br />
tan spore strain<br />
Because the parental strains have different alleles <strong>for</strong> both genes, you will be able to observe the<br />
interaction <strong>of</strong> both genes in determining spore color. Recall that black spores have a wild type<br />
allele <strong>for</strong> each gene (g + t + ) <strong>and</strong> colorless ascospores have a mutant allele <strong>for</strong> each gene (g t).<br />
How will you collect data <strong>and</strong> interpret the results from this cross in order to decide if the two<br />
genes are linked? The answer to this question can be simply derived if you return to the process <strong>of</strong><br />
meiosis <strong>and</strong> Mendel’s principle <strong>of</strong> independent assortment.<br />
According to the Principle <strong>of</strong> Independent Assortment, if two genes are unlinked they should<br />
assort independently <strong>of</strong> each other at metaphase I <strong>of</strong> meiosis. Independent assortment <strong>of</strong> the tan <strong>and</strong><br />
gray spore genes will lead to certain predictable results in the cross involving the two mutant strains.<br />
Linked genes will not assort independently, <strong>and</strong>, if this is the case, the results from the mutantmutant<br />
cross will be quite different from those in the unlinked situation. The criterion, then, <strong>for</strong><br />
deciding if two genes are linked or unlinked is whether they show independent assortment. Let us<br />
consider these two situations <strong>and</strong> examine the predictions that each makes <strong>for</strong> the cross you will<br />
initiate today.<br />
Unlinked <strong>Gene</strong> Hypothesis<br />
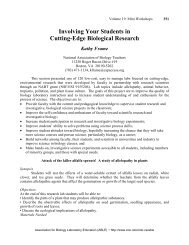
Consider Figure 1.3. Because pairs <strong>of</strong> homologous chromosomes line up independently <strong>of</strong> each<br />
other at metaphase I <strong>of</strong> meiosis, two possible arrangements <strong>of</strong> two pairs <strong>of</strong> homologous<br />
chromosomes (Pair 1 <strong>and</strong> Pair 2) are possible. Assume that stipple chromosomes <strong>for</strong> both pairs<br />
came from one parent, <strong>and</strong> the black chromosomes came from the other parent. In a large number<br />
<strong>of</strong> cells undergoing meiosis, one-half <strong>of</strong> the cells will have both black chromosomes on one side <strong>of</strong><br />
the spindle’s equator <strong>and</strong> both stipple chromosomes on the other side (Arrangement A). In the other<br />
one-half <strong>of</strong> the cells, the chromosomes will have Arrangement B.<br />
g + t
8 Tetrad Analysis<br />
Figure 1.3. The independent arrangement <strong>of</strong> two pairs <strong>of</strong> homologous chromosomes (Pair 1 <strong>and</strong> 2)<br />
on the spindle’s equator at metaphase I <strong>of</strong> meiosis. Black <strong>and</strong> stipple show parental origin <strong>of</strong><br />
chromosomes.<br />
In Figure 1.4, the upper homologous pair bears the alleles <strong>for</strong> the tan spore gene <strong>and</strong> the lower<br />
pair bears the alleles <strong>for</strong> the gray spore gene. If we assume that the stipple chromosomes <strong>for</strong> both<br />
pairs came from the tan spore parent (g + t) then the alleles present on the stipple chromosomes<br />
would be g + <strong>and</strong> t. If the black chromosomes come from the gray spore parent (g t + ), then the<br />
alleles present should be g <strong>and</strong> t + . Figure 1.4A <strong>and</strong> B show the two possible arrangements <strong>of</strong> these<br />
chromosomes, due to independent assortment, <strong>and</strong> the resulting ascus types. Both kinds <strong>of</strong> asci<br />
shown in Figure 1.4 are the type produced by a meiotic division in which no crossing-over<br />
occurred; only two genotypes <strong>of</strong> spores are present in each ascus <strong>and</strong> they are arranged in a 4:4<br />
pattern. In Figure 1.4A, one-half <strong>of</strong> the spores have a g + t genotype like the tan parent; the other half<br />
have a g t + genotype like the gray parent. This ascus arrangement is called a Parental Ditype (PD)<br />
ascus: ditype because only two genotypes are represented in the ascus <strong>and</strong> parental because both<br />
genotypes are like those <strong>of</strong> the parents. In Figure 1.4B there are also only two genotypes present<br />
(g + t + <strong>and</strong> g t) but neither is like the parents’ genotypes. This ascus arrangement is called a Non-<br />
Parental Ditype (NPD) ascus: ditype, again, because only two genotypes are represented <strong>and</strong> nonparental<br />
because both genotypes differ from the parents.<br />
Situations C <strong>and</strong> D <strong>of</strong> Figure 1.4 show two examples <strong>of</strong> single crossovers occurring between the<br />
centromere <strong>and</strong> the tan locus (C), <strong>and</strong> the centromere <strong>and</strong> the gray locus (D). Recall that there are<br />
four different ways a crossover can occur between the non-sister chromatids <strong>for</strong> each pair <strong>of</strong><br />
homologous chromosomes. In all such cases, an ascus results which contains spores <strong>of</strong> all four<br />
genotypes, arranged in a 2:2:2:2 sequence. It is also possible <strong>for</strong> both chromosomes to be involved<br />
in single crossovers. Some <strong>of</strong> these will produce asci with four spore genotypes in a 2:2:2:2<br />
arrangement (Figure 1.4E); others (Figure 1.4F) will yield asci with only two spore genotypes, but<br />
arranged in a 2:4:2 pattern. All <strong>of</strong> these non-4:4 asci are called Tetratype (T) asci.<br />
Situation G <strong>and</strong> H in Figure 1.4 show how some multiple crossovers involving the chromatids<br />
<strong>of</strong> a single chromosome type can lead to asci that are PD or NPD even though crossover did occur.<br />
We shall later discuss how the occurrence <strong>of</strong> these additional, crossover-produced PD <strong>and</strong> NPD asci<br />
will be a source <strong>of</strong> error in attempts to map the locations <strong>of</strong> these genes. However, since these types<br />
<strong>of</strong> crossovers produce equal numbers <strong>of</strong> PD <strong>and</strong> NPD asci, their existence does not change our<br />
expectations <strong>for</strong> the tan spore × gray spore cross. In summary, we can state the prediction <strong>of</strong> the<br />
unlinked gene hypothesis in the following deductive logic <strong>for</strong>mat:<br />
If the gray spore <strong>and</strong> tan spore genes are unlinked, then the two genes should assort<br />
independently <strong>and</strong> the frequency <strong>of</strong> PD <strong>and</strong> NPD asci should be equal.<br />
� In the space provided below each ascus, fill in the genotypes <strong>for</strong> the four pairs <strong>of</strong> spores <strong>for</strong> each<br />
ascus shown in Figure 1.4. Several have been done <strong>for</strong> you.
Tetrad Analysis 9<br />
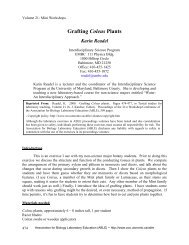
Figure 1.4. Predicted ascus types from the unlinked gene hypothesis <strong>for</strong> the tan <strong>and</strong> gray ascospore<br />
color genes. Note: Black homologues come from the gray spore strain; stipple homologues come<br />
from the tan spore strain. A-B show independent assortment with no crossing over; C-D show<br />
examples <strong>of</strong> crossovers involving a single pair <strong>of</strong> chromosomes. Situations E to H are shown on the<br />
next page.
10 Tetrad Analysis<br />
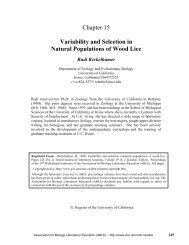
Figure 1.4 (continued). Predicted ascus types from the unlinked gene hypothesis <strong>for</strong> the tan <strong>and</strong><br />
gray ascospore color genes. Note: Black homologues come from the gray spore strain; stipple<br />
homologues come from the tan spore strain. E-F show examples <strong>of</strong> crossovers involving both pairs<br />
<strong>of</strong> chromosomes <strong>and</strong> G-H shows examples <strong>of</strong> double crossovers between one pair <strong>of</strong> homologous<br />
chromosomes. (* Even though the ascus in F has only two spore-color phenotypes <strong>and</strong> they are the<br />
parental phenotypes, this is still classified as a tetratype ascus because the spores are in a non-4:4<br />
arrangement.)
Linked <strong>Gene</strong> Hypothesis<br />
Tetrad Analysis 11<br />
If both spore-coloration genes are located on the same pair <strong>of</strong> homologous chromosomes, they<br />
will be inherited together because they are physically linked together. In Figure 1.5, the right-h<strong>and</strong><br />
homologue came from the tan spore parent (it has a t <strong>and</strong> g + allele) while the left-h<strong>and</strong> homologue<br />
came from the gray spore parent (it has a t + <strong>and</strong> g allele). If the two genes are linked <strong>and</strong> no<br />
crossing over occurs (Figure 1.5A), only PD asci will result. In Figure 1.5B, a crossover occurs<br />
between the tan spore gene locus <strong>and</strong> its centromere. In Figure 1.5C, the crossover is between the<br />
two gene loci. Both produce T asci. Note: The placement <strong>of</strong> the gray <strong>and</strong> tan gene loci in this<br />
diagram is arbitrary <strong>and</strong> does not imply anything about their true locations.<br />
Obviously, if a single chiasma can <strong>for</strong>m between two chromatids, several chiasmata can also<br />
<strong>for</strong>m, resulting from double, triple or higher order crossovers. Also, since there are two sets <strong>of</strong><br />
chromatids available, it is possible <strong>for</strong> more than two chromatids to be involved in crossovers at the<br />
same time. A two-chromatid, double crossover is shown in Figure 1.5E. Figure 1.5D <strong>and</strong> F show<br />
four-chromatid double crossovers. Notice that some multiple crossovers (Figure 1.5E <strong>and</strong> F) are not<br />
genetically detectable, because they produce PD or NPD asci. These types <strong>of</strong> multiple crossover<br />
cause us to underestimate map unit distances. Notice also that the NPD ascus produced in Figure<br />
1.5F could be interpreted as evidence <strong>for</strong> non-linkage. However, because the probability <strong>of</strong> multiple<br />
crossovers is low <strong>and</strong> because multiple crossovers produce, on average, equal numbers <strong>of</strong> PD <strong>and</strong><br />
NPD asci, this complication does not change our expectations <strong>for</strong> the tan spore × gray spore cross.<br />
In summary, if two genes are linked, we would expect mostly PD <strong>and</strong> T asci, but only a small<br />
proportion <strong>of</strong> NPD asci. We can state the prediction <strong>of</strong> the linked gene hypothesis in the following<br />
deductive logic <strong>for</strong>mat:<br />
If the gray spore <strong>and</strong> tan spore genes are linked, then the two genes should not assort<br />
independently <strong>and</strong> the PD asci frequency should be greater than the NPD asci frequency.<br />
� In the space provided below each ascus, fill in the genotypes <strong>for</strong> the four pairs <strong>of</strong> spores <strong>for</strong> each<br />
ascus shown in Figure 1.5. Several have been done <strong>for</strong> you.<br />
<strong>Mapping</strong> <strong>Gene</strong>s on Chromosomes<br />
The exchange <strong>of</strong> genetic material between homologous chromosomes which occurs during<br />
crossing over creates a major exception to Mendel’s principle <strong>of</strong> segregation. Recall that the<br />
segregation <strong>of</strong> alleles from the two parents occurs during anaphase I <strong>of</strong> meiosis, that is, during the<br />
first division <strong>of</strong> meiosis. If crossing over occurs, however, the alleles rearranged by the crossover<br />
are not segregated until anaphase II <strong>of</strong> meiosis, that is, during the second division <strong>of</strong> meiosis. Thus,<br />
it is said that crossing over leads to second division segregation <strong>of</strong> the alleles involved in the<br />
crossover. <strong>Gene</strong> mapping became possible when it was realized that the frequency <strong>of</strong> second<br />
division segregation was related to the physical distance separating the genes involved.<br />
In Figure 1.4C, notice that only four <strong>of</strong> the eight ascospores are genetically changed due to<br />
crossover; the two tan spores with copies <strong>of</strong> chromatid 1 <strong>and</strong> the two gray spores with copies <strong>of</strong><br />
chromatid 3. These spores are called recombinant ascospores because they contain chromosomes<br />
that have been changed by the crossover, <strong>and</strong> are now a combination <strong>of</strong> the parental chromosomes.<br />
The other four spores that bear chromosomes not affected by the crossover <strong>and</strong> are still like the<br />
parental chromosomes, are called non-recombinant ascospores.<br />
� <strong>Study</strong> Figure 1.4D <strong>and</strong> identify the recombinant <strong>and</strong> non-recombinant spores resulting from that<br />
crossover.
12 Tetrad Analysis<br />
Figure 1.5. Predicted ascus types from the linked gene hypothesis <strong>for</strong> the tan <strong>and</strong> gray spore<br />
coloration genes. Black homologue comes from the gray spored strain; stipple homologue comes<br />
from the tan spored strain.
Tetrad Analysis 13<br />
Some thought should convince you that only crossing over between the spore color gene locus<br />
<strong>and</strong> its centromere will result in a T ascus. Crossover beyond the gene locus or on the other arm <strong>of</strong><br />
the chromosome will not affect the gene under consideration. If we assume that crossing over can<br />
occur at any point along a chromosome, it is logical that the probability <strong>of</strong> a crossover occurring<br />
between a gene locus <strong>and</strong> the centromere will be proportional to the locus-centromere distance.<br />
There<strong>for</strong>e, we can use the frequency (proportion) <strong>of</strong> crossover-produced recombinant ascospores as<br />
a measure <strong>of</strong> the relative distance separating the gene locus <strong>and</strong> the centromere. <strong>Gene</strong>ticists define<br />
a crossover map unit as the distance on a chromosome that produces one recombinant post-meiotic<br />
product per 100 post-meiotic products. Here, the number <strong>of</strong> map units would be equal to the<br />
number <strong>of</strong> recombinant ascospores per 100 total ascospores (both recombinant <strong>and</strong> nonrecombinant).<br />
map units =<br />
recombinant spores<br />
Total spores (recomb + non-recomb)<br />
x 100<br />
Given that map units express the % recombinant spores resulting from crossovers <strong>and</strong> each<br />
single crossover produces 4 recombinant spores <strong>and</strong> 4 non-recombinant spores, the map unit<br />
distance is always one half the frequency <strong>of</strong> crossing over <strong>for</strong> the gene.<br />
Notice that if you are using tetrad analysis to map genes in a cross involving two genes, you<br />
must differentiate between tetratype asci that result from single crossovers affecting only one gene,<br />
such as those shown in Figure 1.4C <strong>and</strong> 1.4D, <strong>and</strong> tetratype asci that result from double crossovers<br />
affecting both genes, such as those shown in Figure 1.4E <strong>and</strong> F. We shall return to this idea later in<br />
this study.<br />
<strong>Using</strong> tetrad analysis, geneticists have been able to obtain genetic maps <strong>of</strong> chromosomes <strong>of</strong><br />
many organisms. These maps indicate the sequence <strong>of</strong> genes on chromosomes <strong>and</strong> the relative<br />
locations <strong>of</strong> these genes. However, because a genetic map is based on crossover frequencies, the<br />
relative distances between genes do not correspond to real, physical distances. That is, although the<br />
sequence <strong>of</strong> genes is correct, some genes may be closer together <strong>and</strong> others farther apart than<br />
genetic maps indicate. This is because some regions <strong>of</strong> chromosomes have a greater, or lesser,<br />
tendency to <strong>for</strong>m crossovers than other regions. For example, the centromere seems to inhibit<br />
crossing over <strong>and</strong> genes located close to it do not crossover as much as they should based solely on<br />
their physical location.<br />
Squashing Perithecia<br />
Unlike many fungi, Sordaria is self-fertile <strong>and</strong> some <strong>of</strong> the perithecia you will examine have<br />
resulted from intrastrain matings. Perithecia resulting from self-mating will contain asci with all<br />
tan or all gray ascospores. Since an ascus must contain at least two different phenotypes in order to<br />
detect a crossover, you will be concerned exclusively with perithecia that have resulted from<br />
interstrain matings. Perithecia containing interstrain asci (with spores <strong>of</strong> at least two different<br />
phenotypes) should be most abundant in the areas <strong>of</strong> the dish where the two strains grew together.<br />
1. Each pair <strong>of</strong> students should assemble the following equipment: inoculating loop, microscope<br />
slides <strong>and</strong> coverslips, dropper bottle with water, two petri dishes with the gray spore (g t + ) × tan<br />
spore (g + t) cross, <strong>and</strong> a box <strong>of</strong> kimwipes.<br />
2. Place a drop <strong>of</strong> water on a clean microscope slide.<br />
3. Remove the petri dish lid.
14 Tetrad Analysis<br />
4. Now, remove 10 to 15 perithecia by scraping the loop’s tip back <strong>and</strong> <strong>for</strong>th over the surface <strong>of</strong><br />
the agar. Do not dig into the agar.<br />
5. Place the perithecia into the drop on the slide <strong>and</strong> uni<strong>for</strong>mly distribute the perithecia throughout<br />
the drop. Place a cover slip over the perithecia <strong>and</strong> water.<br />
6. Place a kimwipe over your finger (to avoid putting a fingerprint on the cover slip) <strong>and</strong> push<br />
down gently, but a little firmly, on the cover slip. If you rub the cover slip back <strong>and</strong> <strong>for</strong>th (very<br />
slightly) over the slide, you will spread the asci better.<br />
7. View the slide with the compound microscope first with the 10X objective in place.<br />
8. Select <strong>for</strong> study only those perithecia that contain asci with more than one spore phenotype.<br />
Identify the phenotypes <strong>of</strong> the spores in each ascus with the 40X objective in place. Figure 1.6<br />
shows two properly squashed perithecia.<br />
Figure 1.6. Photomicrograph <strong>of</strong> Sordaria fimicola showing two well-spread perithecia suitable <strong>for</strong><br />
tetrad analysis.<br />
Data Collection<br />
Properly squashed perithecia will eject their asci in a radial arrangement, like the spokes <strong>of</strong> a<br />
wheel. In collecting data it is best to start at one point, systematically moving in a clockwise or<br />
counterclockwise fashion, categorizing each ascus that can be clearly seen until a full circle has<br />
been completed. You will need to focus carefully to see all the spores in an ascus. Note that the<br />
ascus narrows on the end that connects it to the fungal mycelium. Locating the narrowed, broken<br />
end will allow you to properly classify any isolated asci that may be found on your slides.<br />
1. To be most successful at identifying spore phenotypes as you use the microscope to examine<br />
perithecial squashes be sure to:<br />
(a) keep light intensity low so you can see color differences better,<br />
(b) focus up <strong>and</strong> down carefully to see all eight ascospores,<br />
(c) avoid immature asci (their spores will have a granular appearance <strong>and</strong> very little color), <strong>and</strong><br />
(d) seek your instructor’s help until you become confident in your ability to identify the phenotypes.<br />
2. As you classify asci, write down in abbreviated <strong>for</strong>m the sequence <strong>of</strong> spores within each ascus.<br />
For example, the ascus in Figure 1.4E could be represented as CCBBGGTT (from left to right)
Tetrad Analysis 15<br />
or, since all spore phenotypes are in duplicate due to the mitotic division after meiosis, more<br />
simply CBGT.<br />
3. Each individual should classify at least 30 asci to insure an adequate sample size <strong>for</strong> the class<br />
data. Enter individual data in Table 1.1.<br />
In addition to PD <strong>and</strong> NPD asci, you will see a variety <strong>of</strong> T asci, some with all four spore<br />
phenotypes <strong>and</strong> some with only two phenotypes in a 2:2:2:2 or a 2:4:2 arrangement. However, there<br />
are some restrictions on the types <strong>of</strong> two-phenotype asci that are possible. Black <strong>and</strong> gray only or<br />
black <strong>and</strong> tan only are not possible (either in a 4:4 or non-4:4 arrangement) because these<br />
arrangements require more wild type alleles than are available in a mutant × mutant cross.<br />
Likewise, colorless <strong>and</strong> gray only or colorless <strong>and</strong> tan only are not possible (either in a 4:4 or non-<br />
4:4 arrangement) because these arrangements require more mutant alleles than are available. In<br />
other words, two-phenotype asci can only include the phenotypes tan <strong>and</strong> gray or colorless <strong>and</strong><br />
black.<br />
4. Go back through your asci descriptions <strong>and</strong> identify each ascus as either PD, NPD, or T in Table<br />
1.1. Remember: (1) PD asci are 4 gray:4 tan or reverse; (2) NPD asci are 4 colorless:4 black or<br />
reverse; <strong>and</strong> (3) T asci are all others (all four phenotypes or two phenotypes in a 2:2:2:2 or 2:4:2<br />
arrangement, but the phenotypes must be gray <strong>and</strong> tan or colorless <strong>and</strong> black).<br />
Data Analysis And Trans<strong>for</strong>mation<br />
Your class will collaborate in analysis <strong>and</strong> trans<strong>for</strong>mation <strong>of</strong> data collected in this study. Be<br />
sure to obtain a complete copy <strong>of</strong> all <strong>of</strong> the class data; you will need these data when you address<br />
the study questions associated with this chapter. (Note: You will need to use the chi-square test as<br />
part <strong>of</strong> the data analysis <strong>of</strong> this study.) The following sections discuss each <strong>of</strong> the major objectives<br />
<strong>of</strong> this study.<br />
<strong>Linkage</strong> or Non-<strong>Linkage</strong><br />
The criterion to be used in deciding if the two genes are linked or not is whether they assort<br />
independently; unlinked genes do, linked genes do not. As discussed earlier, if the tan <strong>and</strong> gray<br />
spore genes are unlinked, we expect equal numbers <strong>of</strong> parental ditype asci (PD) <strong>and</strong> non-parental<br />
ditype (NPD) asci. Determine the total number <strong>of</strong> PD <strong>and</strong> NPD asci observed by the whole class<br />
<strong>and</strong> use the chi square test to compare these numbers with the expected values assuming the genes<br />
are unlinked (see study question 1).<br />
� Complete Table 1.2 using the class data assembled from individual Tables 1.1.<br />
<strong>Gene</strong> <strong>Mapping</strong><br />
Tetratype (T) asci result from crossing over between homologous chromosomes. However, as<br />
shown in Figures 1.4 <strong>and</strong> 1.5, some crossovers affect just one gene, while others affect both genes.<br />
In using tetrad analysis data to map the gray <strong>and</strong> tan spore genes, you must determine whether the<br />
alleles <strong>for</strong> one or both genes were switched by the crossover that produced each tetratype ascus you<br />
observed. <strong>Using</strong> the in<strong>for</strong>mation that follows, each pair <strong>of</strong> students should analyze the tetratype asci<br />
they recorded in Table
16 Tetrad Analysis<br />
Table 1.1. Data collected from a genetic cross between the gray <strong>and</strong> tan spore strains<br />
<strong>of</strong> Sordaria fimicola. (Note: C = colorless, B = black, T = tan, G = gray spore.)
Tetrad Analysis 17<br />
1.1 <strong>and</strong> record the correct number <strong>of</strong> recombinant <strong>and</strong> non-recombinant spores <strong>for</strong> each gene in that<br />
table. You will then combine individual data to estimate map locations <strong>for</strong> the two genes based on<br />
all <strong>of</strong> the class data.<br />
We must assume that NPD <strong>and</strong> PD asci contain only non-recombinant ascospores (even though<br />
some <strong>of</strong> these asci resulted from multiple crossing over, as we shall discuss shortly). For each NPD<br />
<strong>and</strong> PD ascus you recorded in Table 1.1, place a 0 in the Recomb. spores <strong>and</strong> an 8 in the Nonrecomb.<br />
spores column <strong>of</strong> both the tan <strong>and</strong> gray spore gene categories. In the case <strong>of</strong> the T asci, to<br />
determine which genes were affected by crossing over you must determine which genes show<br />
second division segregation. Examine the genotypes <strong>for</strong> the spores in the ascus shown in Figure<br />
1.4C. If there is no crossover between a gene’s locus <strong>and</strong> the centromere then according to<br />
Mendel’s principle <strong>of</strong> segregation the gene’s alleles will show first-division segregation. First<br />
division segregation produces a 2:2 arrangement <strong>of</strong> genotypes within the ascus <strong>for</strong> that gene<br />
(recognizing that adjacent spores are genetically identical). A crossover between the gene’s locus<br />
<strong>and</strong> the centromere will lead to second division segregation <strong>and</strong> the arrangement <strong>of</strong> genotypes<br />
within the ascus will be 1:1:1:1 or 1:2:1 <strong>for</strong> that gene. In Figure 1.4C, notice that the arrangement<br />
<strong>for</strong> the gray spore gene is g + :g + :g :g , but t : t + : t + : t <strong>for</strong> the tan spore gene. This observation<br />
indicates that during the meiotic division that produced this ascus a crossover occurred <strong>for</strong> the tan<br />
spore gene but not the gray spore gene. Had you observed this ascus, you would know that only the<br />
chromosome with the tan spore gene was changed due to the crossover <strong>and</strong> that the four<br />
recombinant ascospores resulting from that crossover should be associated with the tan spore gene.<br />
There<strong>for</strong>e, in Table 1.1 you would place a 4 into the Recomb. spores <strong>and</strong> Non-recomb. spores<br />
columns <strong>for</strong> the tan spore category <strong>and</strong> a 0 in the Recomb. spores <strong>and</strong> an 8 into the Non-recomb.<br />
spores column <strong>for</strong> the gray spore category.<br />
Look at the pattern <strong>of</strong> genotypes shown <strong>for</strong> the ascus shown in Figure 1.4D. Which gene is<br />
showing second division segregation? Had you observed this ascus, you would know that only the<br />
chromosome with the gray spore gene was changed due to the crossover <strong>and</strong> that the four<br />
recombinant ascospores resulting from that crossover should be associated with the gray spore gene.<br />
There<strong>for</strong>e, in Table 1.1 you would place a 4 into the Recomb. spores <strong>and</strong> Non-recomb. spores<br />
columns <strong>for</strong> the gray spore category <strong>and</strong> a 0 in the Recomb. spores <strong>and</strong> an 8 into the Non-recomb.<br />
spores column <strong>for</strong> the tan spore category.<br />
Look at the pattern <strong>of</strong> genotypes shown <strong>for</strong> the asci shown in Figure 1.4E <strong>and</strong> F. Which genes<br />
show second division segregation? Notice that all eight ascospores in these asci are recombinant:<br />
four are recombinant <strong>for</strong> the one gene, <strong>and</strong> four <strong>for</strong> the other gene. When you observe asci <strong>of</strong> these<br />
types, you would place a 4 in the Recomb. <strong>and</strong> Non-recomb. spores columns <strong>of</strong> both gene<br />
categories.<br />
This same approach is used whether one assumes that the genes are unlinked or linked. For<br />
example, in the ascus in Figure 1.5B, the pattern <strong>of</strong> genotypes <strong>for</strong> the two genes indicate that both<br />
genes were affected by the crossover. This would occur if the gray <strong>and</strong> tan genes are located on the<br />
same side <strong>of</strong> the chromosome relative to the centromere <strong>and</strong> a crossover had occurred between the<br />
centromere <strong>and</strong> the gene locus nearest the centromere. If you had observed this ascus, you would<br />
place a 4 in the Recomb. spores <strong>and</strong> a 4 in the Non-recomb. spores column <strong>for</strong> both gene categories,<br />
since both genes were affected by the crossover.<br />
If you had observed the pattern <strong>of</strong> genotypes <strong>for</strong> the ascus shown in Figure 1.5C, you would<br />
place a 4 in the Recomb. spores <strong>and</strong> the Non-recomb. spores column <strong>for</strong> the gray spore gene <strong>and</strong> a 0<br />
in the Recomb. spores <strong>and</strong> an 8 in the Non-recomb. spores column <strong>for</strong> the tan spore gene, because<br />
only alleles <strong>of</strong> the gray gene are showing second division segregation. Verify that this is true.<br />
1. For each ascus you recorded in Table 1.1, enter the four spore genotypes in the space provided<br />
<strong>and</strong> determine the numbers <strong>of</strong> recombinant <strong>and</strong> non-recombinant spores <strong>for</strong> each gene.
18 Tetrad Analysis<br />
2. Complete Table 1.3 using the class data assembled from individual Tables 1.1.<br />
3. To estimate the map locations <strong>of</strong> the two genes, whether unlinked or linked, simply determine<br />
the total number <strong>of</strong> recombinant spores <strong>for</strong> each gene <strong>and</strong> divide by total spores observed (see<br />
study question 2). Note: A check on your computations would be to ascertain that total spores<br />
observed <strong>for</strong> both genes (non-recombinant spores + recombinant spores) is the same number.<br />
Comparison with Published Map Locations<br />
Published gene-centromere map locations <strong>for</strong> the two genes are approximately 27 map units <strong>for</strong><br />
the tan spore gene <strong>and</strong> 33 map units <strong>for</strong> the gray spore gene (Olive, 1956). You should use the chi<br />
square test to determine if your estimated map locations differ significantly from these values.<br />
Since map units are really the percent <strong>of</strong> all the spores that are recombinant spores, you might be<br />
inclined to use non-recombinant spores <strong>and</strong> recombinant spores as the categories in the chi square<br />
test. However, since the observed values in your chi square categories represent your sample size,<br />
you need to select categories that accurately reflect the amount <strong>of</strong> in<strong>for</strong>mation you have collected.<br />
Since the number <strong>of</strong> spores, whether non-recombinant or recombinant, is really a function <strong>of</strong> the<br />
number <strong>of</strong> asci you observed, you must use crossover <strong>and</strong> non-crossover asci as categories in the<br />
test. So, <strong>for</strong> example, if a gene is 27 map units from its centromere, recognizing that each crossover<br />
produces one-half recombinant <strong>and</strong> one-half non-recombinant spores, you would expect 54%<br />
crossover asci <strong>and</strong> 46% non-crossover asci . Your observed values will be the actual number <strong>of</strong><br />
crossover asci <strong>and</strong> non-crossover asci <strong>for</strong> that gene. The expected values would be the total number<br />
<strong>of</strong> asci seen by the class times 0.54 <strong>for</strong> the expected crossover asci <strong>and</strong> times 0.46 <strong>for</strong> the expected<br />
non-crossover asci (see study question 3).<br />
� Complete Table 1.4 using the class data assembled from individual Tables 1.1.<br />
Table 1.2. Class data showing the number <strong>of</strong> Parental Ditype (PD),<br />
Non-Parental Ditype (NPD), <strong>and</strong> Tetratype (T) asci from a genetic cross<br />
between the tan <strong>and</strong> gray spore strains <strong>of</strong> Sordaria fimicola .<br />
Ascus type<br />
Parental Ditype (PD)<br />
Non-Parental Ditype (NPD)<br />
Tetratype (T)<br />
Number counted<br />
Table 1.3. Class data showing recombinant <strong>and</strong> non-recombinant spores<br />
<strong>for</strong> the tan <strong>and</strong> gray spore genes <strong>of</strong> Sordaria fimicola from a genetic cross<br />
between the two mutant strains.<br />
Spores<br />
Recombinant<br />
Non-recombinant<br />
Total<br />
Gray Spore <strong>Gene</strong><br />
Tan Spore <strong>Gene</strong>
Table 1.4. Class data showing observed <strong>and</strong> expected crossover<br />
<strong>and</strong> non-crossover asci <strong>for</strong> the tan <strong>and</strong> gray spore genes <strong>of</strong><br />
Sordaria fimicola from a genetic cross between the two mutant strains.<br />
Asci<br />
Observed Crossover 1<br />
Observed Non-crossover 2<br />
Expected Crossover 3<br />
Expected Non-crossover 4<br />
Tan Spore <strong>Gene</strong><br />
Gray Spore <strong>Gene</strong><br />
1. T asci with recombinant spores <strong>for</strong> gene<br />
2. PD <strong>and</strong> NPD asci <strong>and</strong> T asci without recombinant spores <strong>for</strong> gene<br />
3. (Total asci examined × 0.54) <strong>for</strong> the tan spore gene or (total asci examined × 0.66)<br />
<strong>for</strong> the gray spore gene<br />
4. (Total asci examined × 0.46) <strong>for</strong> the tan spore gene or (total asci examined × 0.34)<br />
<strong>for</strong> the gray spore gene<br />
Tetrad Analysis 19<br />
Testing a Complete <strong>Gene</strong>tic Model<br />
You will now use the published gene-centromere map distances to predict the frequencies <strong>of</strong><br />
PD, NPD, <strong>and</strong> T asci assuming that the tan <strong>and</strong> gray spore genes are unlinked. Consult Figure 1.7<br />
with respect to the following discussion.<br />
If the distance between the tan locus <strong>and</strong> its centromere is 27 map units, then the frequency <strong>of</strong><br />
meiotic divisions with a single crossover between the tan locus <strong>and</strong> its centromere is equal to 0.54.<br />
There<strong>for</strong>e, the frequency <strong>of</strong> meiotic divisions with no crossover <strong>for</strong> that gene will be 0.46 (1.00 –<br />
0.54). If the distance between the gray locus <strong>and</strong> its centromere is 33 map units, then the frequency<br />
<strong>of</strong> meiotic divisions with a single crossover between the gray locus <strong>and</strong> its centromere is equal to<br />
0.66. In turn, the frequency <strong>of</strong> meiotic divisions with no crossovers <strong>for</strong> the gray gene would be 0.34<br />
(1.00 – 0.66). The predicted frequency <strong>of</strong> asci resulting from no crossovers in meiosis (i.e., PD <strong>and</strong><br />
NPD asci) would be as follows:<br />
Frequency <strong>of</strong> meiotic divisions with no<br />
crossover between tan gene <strong>and</strong> its<br />
centromere<br />
(0.46)<br />
×<br />
×<br />
Frequency <strong>of</strong> meiotic divisions with no<br />
crossover between gray gene <strong>and</strong> its<br />
centromere<br />
(0.34)<br />
= 0.16<br />
Since unlinked genes show independent assortment, half <strong>of</strong> the asci resulting from no crossover<br />
would be PD, <strong>and</strong> the other half NPD. There<strong>for</strong>e, (Predicted frequency <strong>of</strong> PD asci) =<br />
(Predicted frequency <strong>of</strong> NPD asci) = 0.16/2 = 0.08.<br />
A single crossover between either gene <strong>and</strong> its centromere or a simultaneous single crossover<br />
between both genes <strong>and</strong> their centromeres would all produce T asci. There<strong>for</strong>e, the predicted<br />
frequency <strong>of</strong> T asci would be the sum <strong>of</strong> the products <strong>of</strong> the independent probabilities <strong>of</strong> all three <strong>of</strong><br />
these events, or
20 Tetrad Analysis<br />
Predicted T asci frequency = (0.54 × 0.34) + (0.66 × 0.46) + (0.54 × 0.66) = 0.84<br />
Tan gray tan <strong>and</strong> gray<br />
Crossover crossover crossovers<br />
only only<br />
� Test this genetic model by per<strong>for</strong>ming the chi square test described in study question 4.<br />
Figure 1.7. The relationship between map unit distance <strong>and</strong> the expected frequencies <strong>of</strong> meiotic<br />
divisions with <strong>and</strong> without single crossovers <strong>for</strong> two unlinked genes<br />
Multiple Crossover as an Error Source in Tetrad Analysis<br />
After you have completed this analysis you should consider again the occurrence <strong>of</strong> multiple<br />
crossing over <strong>and</strong> its influence on your mapping attempts. We have assumed that all PD <strong>and</strong> NPD<br />
asci result from meiotic divisions without crossover <strong>and</strong> that all spores in PD <strong>and</strong> NPD asci are nonrecombinant.<br />
Yet, as shown in Figures 1.4 <strong>and</strong> 1.5, some multiple crossovers produce PD <strong>and</strong> NPD<br />
asci. Did your chi square analysis in question 4 <strong>of</strong> the observed frequencies <strong>of</strong> the three ascus types<br />
(PD, NPD, <strong>and</strong> T) show significantly more PD <strong>and</strong> NPD <strong>and</strong> proportionally fewer T asci than<br />
expected based on single crossovers?<br />
Because <strong>of</strong> the production <strong>of</strong> PD <strong>and</strong> NPD asci by multiple crossing over some <strong>of</strong> the spores in<br />
your Non-recomb. spores columns <strong>of</strong> Table 1.1 are really recombinant spores. Also, some T asci<br />
contain eight recombinant spores due to multiple crossovers, but only show second division<br />
segregation <strong>for</strong> a single gene (see Figure 1.5D). Since map units are % recombinant spores,<br />
multiple crossovers cause us to underestimate map units.<br />
Because each crossover is an independent event, the probability <strong>of</strong> two crossovers occurring<br />
together is the product <strong>of</strong> their independent probabilities. Thus, the probability <strong>of</strong> multiple crossing<br />
over is small if genes are close together, but increases rapidly as genes are further apart. <strong>Gene</strong>ticists<br />
minimize the problem <strong>of</strong> multiple crossing over by only mapping genes that are close together. The<br />
gene-centromere map units <strong>for</strong> the gray <strong>and</strong> tan genes cited above were obtained by adding together<br />
map units <strong>for</strong> other linked genes located between these genes <strong>and</strong> their centromeres. Thus, you may<br />
find that your estimates may differ significantly from these values.
Literature Cited<br />
Tetrad Analysis 21<br />
Cassell, P., <strong>and</strong> T. R. Mertens. 1968. A laboratory exercise on the genetics <strong>of</strong> ascospore color in<br />
Sordaria fimicola. The American Biology Teacher, 30(5):367–372.<br />
Chen, K.-C., <strong>and</strong> L. S. Olive. 1965. The genetics <strong>of</strong> Sordaria brevicollis. II. Biased segregation<br />
due to spindle overlap. <strong>Gene</strong>tics, 51:761–766.<br />
El-Ani, A. S., <strong>and</strong> L. S. Olive. 1975. <strong>Gene</strong>tics <strong>of</strong> Sordaria fimicola. IX. <strong>Linkage</strong> group II.<br />
American Journal <strong>of</strong> Botany, 62:166─171.<br />
El-Ani, A. S., L. S. Olive, <strong>and</strong> Y. Kitani. 1961. <strong>Gene</strong>tics <strong>of</strong> Sordaria fimicola. IV. <strong>Linkage</strong> group I.<br />
American Journal <strong>of</strong> Botany, 48:716─723.<br />
Fincham, J. R. S. 1971. <strong>Using</strong> fungi to study genetic recombination. Ox<strong>for</strong>d Biology Reader No.<br />
2, Ox<strong>for</strong>d University Press, London, 16 pages.<br />
Olive, L. S. 1956. <strong>Gene</strong>tics <strong>of</strong> Sordaria fimicola. I. Ascospore color mutants. American Journal <strong>of</strong><br />
Botany, 43:97–107.<br />
Rush<strong>for</strong>th, S. R. 1976. The plant kingdom. Prentice-Hall, New Jersey, 348 pages..<br />
Suzuki, D. T. 1989. An introduction to genetic analysis. W. H. Freeman, New York, 768 pages.
22 Tetrad Analysis
Tetrad Analysis 23
24 Tetrad Analysis