DEREGULATED WHOLESALE ELECTRICITY PRICES IN EUROPE
DEREGULATED WHOLESALE ELECTRICITY PRICES IN EUROPE
DEREGULATED WHOLESALE ELECTRICITY PRICES IN EUROPE

You also want an ePaper? Increase the reach of your titles
YUMPU automatically turns print PDFs into web optimized ePapers that Google loves.
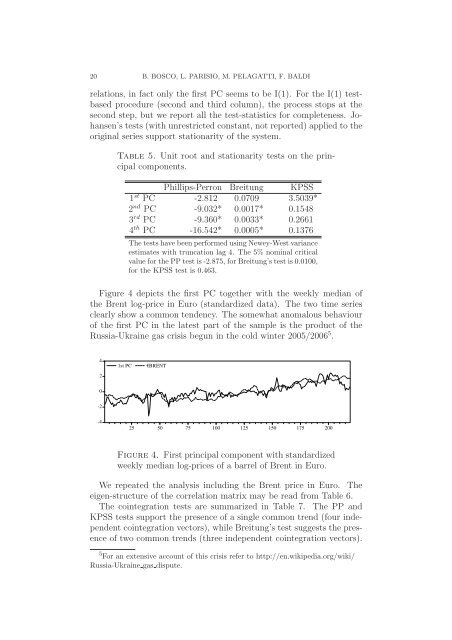
20 B. BOSCO, L. PARISIO, M. PELAGATTI, F. BALDI<br />
relations, in fact only the first PC seems to be I(1). For the I(1) testbased<br />
procedure (second and third column), the process stops at the<br />
second step, but we report all the test-statistics for completeness. Johansen’s<br />
tests (with unrestricted constant, not reported) applied to the<br />
original series support stationarity of the system.<br />
Table 5. Unit root and stationarity tests on the principal<br />
components.<br />
Phillips-Perron Breitung KPSSa<br />
1 st PC -2.812* 0.0709* 3.5039*<br />
2 nd PC -9.032* 0.0017* 0.1548*<br />
3 rd PC -9.360* 0.0033* 0.2661*<br />
4 th PC -16.542* 0.0005* 0.1376*<br />
The tests have been performed using Newey-West variance<br />
estimates with truncation lag 4. The 5% nominal critical<br />
value for the PP test is -2.875, for Breitung’s test is 0.0100,<br />
for the KPSS test is 0.463.<br />
Figure 4 depicts the first PC together with the weekly median of<br />
the Brent log-price in Euro (standardized data). The two time series<br />
clearly show a common tendency. The somewhat anomalous behaviour<br />
of the first PC in the latest part of the sample is the product of the<br />
Russia-Ukraine gas crisis begun in the cold winter 2005/2006 5 .<br />
4<br />
2<br />
0<br />
-2<br />
-4<br />
1st PC €BRENT<br />
25 50 75 100 125 150 175 200<br />
Figure 4. First principal component with standardized<br />
weekly median log-prices of a barrel of Brent in Euro.<br />
We repeated the analysis including the Brent price in Euro. The<br />
eigen-structure of the correlation matrix may be read from Table 6.<br />
The cointegration tests are summarized in Table 7. The PP and<br />
KPSS tests support the presence of a single common trend (four independent<br />
cointegration vectors), while Breitung’s test suggests the presence<br />
of two common trends (three independent cointegration vectors).<br />
5For an extensive account of this crisis refer to http://en.wikipedia.org/wiki/<br />
Russia-Ukraine gas dispute.