fecal elastase 1 and vitamin d3 in patients with osteoporotic bone ...
fecal elastase 1 and vitamin d3 in patients with osteoporotic bone ...
fecal elastase 1 and vitamin d3 in patients with osteoporotic bone ...

Create successful ePaper yourself
Turn your PDF publications into a flip-book with our unique Google optimized e-Paper software.
February 25, 2008 EUROPEAN JOURNAL OF MEDICAL RESEARCH<br />
69<br />
fractures such as forearm, hip <strong>and</strong> sp<strong>in</strong>e. A st<strong>and</strong>ardized<br />
osteodensitometry via dual energy X-ray absorptiometry<br />
(DEXA) was performed on all <strong>patients</strong>. If<br />
DEXA revealed T-scores lower than –2,5 SD (accord<strong>in</strong>gly<br />
to actual WHO-def<strong>in</strong>ition [16] this means severe<br />
osteoporosis) <strong>patients</strong> matched our criteria <strong>and</strong> f<strong>in</strong>ally<br />
167 could be <strong>in</strong>cluded <strong>in</strong> our study. Exclusion criteria<br />
were: ages under 40 or over 86 years; steatorrhea; pancreatic-biliary<br />
obstructions; actual <strong>and</strong> relevant alcohol<br />
consumption; medication <strong>with</strong> <strong>in</strong>fluence on osteological<br />
<strong>and</strong>/or endocr<strong>in</strong>e parameters (hepar<strong>in</strong>, ketoconazol,<br />
glucocorticoids, thiacide-diuretics, psychopharmacological<br />
agents, carbamazep<strong>in</strong>); chronic or severe<br />
concommitant diseases.<br />
CONTROLS<br />
Twenty healthy persons between 40 <strong>and</strong> 60 years of<br />
age served as controls.<br />
BIOCHEMICAL MEASUREMENTS<br />
Blood samples were taken from all participants once at<br />
a fixed time <strong>in</strong> the mor<strong>in</strong><strong>in</strong>g. The specific study parameters<br />
were parathormone ("INTACT PTH"-kit from<br />
Nichols Institute Diagnostics, San Juan Capistrano,<br />
California; double-sided immuno-radiometric assay),<br />
1,25(OH) 2 Vitam<strong>in</strong> D 3 (“1,25(OH) 2 Vitam<strong>in</strong> D”-kit<br />
from Immun Diagnostik, Bensheim, Germany; competitive<br />
radio receptor assay), 25(OH)Vitam<strong>in</strong> D 3<br />
(“25(OH) Vitam<strong>in</strong> D”-kit from Immun Diagnostik,<br />
Bensheim, Germany; competitive prote<strong>in</strong>-b<strong>in</strong>d<strong>in</strong>g-assay),<br />
calcium <strong>and</strong> phosphate from serum as well as<br />
pancreatic <strong>elastase</strong> 1 ("Pankreatic Elastase 1"-kit from<br />
ScheBo Biotech, Giessen, Germany; double-sided enzyme-immuno<br />
assay) from feces of <strong>patients</strong> <strong>and</strong> con-<br />
trols. The body mass <strong>in</strong>dex (BMI) was also determ<strong>in</strong>ed<br />
<strong>in</strong> all.<br />
OSTEODENSITOMERTY<br />
St<strong>and</strong>ardized osteodensitometry via dual energy X-ray<br />
absorptiometry (DEXA) was carried out <strong>in</strong> all participants.<br />
A Lunar DPX densitometer (LUNAR Radiation<br />
Corporation, Madison, Wiscons<strong>in</strong>) was used for measurement<br />
of BMD. The three scan regions <strong>in</strong>cluded<br />
lumbar vertebra 2 to 4 ap <strong>and</strong> lateral as well as Ward`s<br />
triangle <strong>in</strong> the neck of the left femur. The results were<br />
determ<strong>in</strong>ed as T-score of a normal reference collective<br />
of young healthy persons of approx. 30 years of age,<br />
therefore, at a time of "peak <strong>bone</strong> mass".<br />
STATISTICAL ANALYSIS<br />
Results are presented by mean values <strong>and</strong> st<strong>and</strong>ard deviation.<br />
The follow<strong>in</strong>g methods were applied for statistical<br />
analysis: a s<strong>in</strong>gle factor variance analysis, the<br />
Scheffé-Test, the non-parametric Kurskal-Wallis-Test<br />
<strong>with</strong> subsequent Dunn-Test as well as the t-Test for<br />
<strong>in</strong>dependent r<strong>and</strong>om samples <strong>with</strong> <strong>and</strong> <strong>with</strong>out the<br />
Welche´s correction. The Pearons´s correlation coefficient<br />
<strong>and</strong> also the non-parametric Spearman correlation<br />
coefficient were applied for f<strong>in</strong>d<strong>in</strong>g any connections<br />
[17, 18].<br />
RESULTS<br />
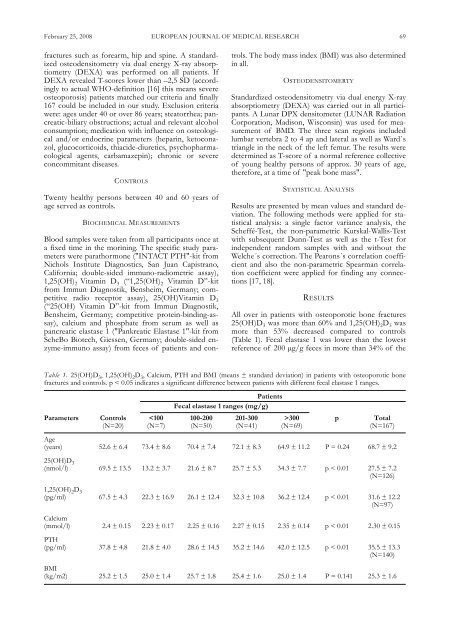
All over <strong>in</strong> <strong>patients</strong> <strong>with</strong> <strong>osteoporotic</strong> <strong>bone</strong> fractures<br />
25(OH)D 3 was more than 60% <strong>and</strong> 1,25(OH) 2D 3 was<br />
more than 53% decreased compared to controls<br />
(Table 1). Fecal <strong>elastase</strong> 1 was lower than the lowest<br />
reference of 200 µg/g feces <strong>in</strong> more than 34% of the<br />
Table 1. 25(OH)D 3, 1,25(OH) 2D 3, Calcium, PTH <strong>and</strong> BMI (means ± st<strong>and</strong>ard deviation) <strong>in</strong> <strong>patients</strong> <strong>with</strong> <strong>osteoporotic</strong> <strong>bone</strong><br />
fractures <strong>and</strong> controls. p < 0.05 <strong>in</strong>dicates a significant difference between <strong>patients</strong> <strong>with</strong> different <strong>fecal</strong> <strong>elastase</strong> 1 ranges.<br />
Patients<br />
Fecal <strong>elastase</strong> 1 ranges (mg/g)<br />
Parameters Controls 300 p Total<br />
(N=20) (N=7) (N=50) (N=41) (N=69) (N=167)<br />
Age<br />
(years) 52.6 ± 6.4 73.4 ± 8.6 70.4 ± 7.4 72.1 ± 8.3 64.9 ± 11.2 P = 0.24 68.7 ± 9.2<br />
25(OH)D 3<br />
(nmol/l) 69.5 ± 13.5 13.2 ± 3.7 21.6 ± 8.7 25.7 ± 5.3 34.3 ± 7.7 p < 0.01 27.5 ± 7.2<br />
(N=126)<br />
1,25(OH) 2D 3<br />
(pg/ml) 67.5 ± 4.3 22.3 ± 16.9 26.1 ± 12.4 32.3 ± 10.8 36.2 ± 12.4 p < 0.01 31.6 ± 12.2<br />
(N=97)<br />
Calcium<br />
(mmol/l) 2.4 ± 0.15 2.23 ± 0.17 2.25 ± 0.16 2.27 ± 0.15 2.35 ± 0.14 p < 0.01 2.30 ± 0.15<br />
PTH<br />
(pg/ml) 37.8 ± 4.8 21.8 ± 4.0 28.6 ± 14.5 35.2 ± 14.6 42.0 ± 12.5 p < 0.01 35.5 ± 13.3<br />
(N=140)<br />
BMI<br />
(kg/m2) 25.2 ± 1.5 25.0 ± 1.4 25.7 ± 1.8 25.4 ± 1.6 25.0 ± 1.4 P = 0.141 25.3 ± 1.6