THE ANNUAL REPORT 2002 - Oerlikon Barmag
THE ANNUAL REPORT 2002 - Oerlikon Barmag
THE ANNUAL REPORT 2002 - Oerlikon Barmag

You also want an ePaper? Increase the reach of your titles
YUMPU automatically turns print PDFs into web optimized ePapers that Google loves.
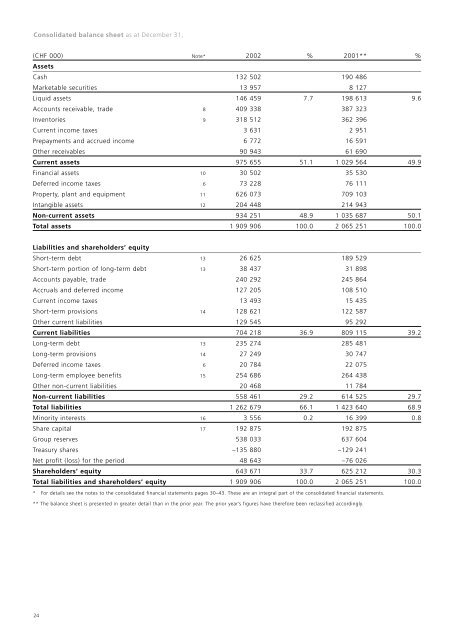
Consolidated balance sheet as at December 31,<br />
(CHF 000) Note* <strong>2002</strong> % 2001** %<br />
Assets<br />
Cash 132 502 190 486<br />
Marketable securities 13 957 8 127<br />
Liquid assets 146 459 7.7 198 613 9.6<br />
Accounts receivable, trade 8 409 338 387 323<br />
Inventories 9 318 512 362 396<br />
Current income taxes 3 631 2 951<br />
Prepayments and accrued income 6 772 16 591<br />
Other receivables 90 943 61 690<br />
Current assets 975 655 51.1 1 029 564 49.9<br />
Financial assets 10 30 502 35 530<br />
Deferred income taxes 6 73 228 76 111<br />
Property, plant and equipment 11 626 073 709 103<br />
Intangible assets 12 204 448 214 943<br />
Non-current assets 934 251 48.9 1 035 687 50.1<br />
Total assets 1 909 906 100.0 2 065 251 100.0<br />
Liabilities and shareholders’ equity<br />
Short-term debt 13 26 625 189 529<br />
Short-term portion of long-term debt 13 38 437 31 898<br />
Accounts payable, trade 240 292 245 864<br />
Accruals and deferred income 127 205 108 510<br />
Current income taxes 13 493 15 435<br />
Short-term provisions 14 128 621 122 587<br />
Other current liabilities 129 545 95 292<br />
Current liabilities 704 218 36.9 809 115 39.2<br />
Long-term debt 13 235 274 285 481<br />
Long-term provisions 14 27 249 30 747<br />
Deferred income taxes 6 20 784 22 075<br />
Long-term employee benefits 15 254 686 264 438<br />
Other non-current liabilities 20 468 11 784<br />
Non-current liabilities 558 461 29.2 614 525 29.7<br />
Total liabilities 1 262 679 66.1 1 423 640 68.9<br />
Minority interests 16 3 556 0.2 16 399 0.8<br />
Share capital 17 192 875 192 875<br />
Group reserves 538 033 637 604<br />
Treasury shares –135 880 –129 241<br />
Net profit (loss) for the period 48 643 –76 026<br />
Shareholders’ equity 643 671 33.7 625 212 30.3<br />
Total liabilities and shareholders’ equity 1 909 906 100.0 2 065 251 100.0<br />
* For details see the notes to the consolidated financial statements pages 30–43. These are an integral part of the consolidated financial statements.<br />
** The balance sheet is presented in greater detail than in the prior year. The prior year’s figures have therefore been reclassified accordingly.<br />
24