

Thermophysics 2012 - Conference Proceedings
Thermophysics 2012 - Conference Proceedings
Thermophysics 2012 - Conference Proceedings

Create successful ePaper yourself
Turn your PDF publications into a flip-book with our unique Google optimized e-Paper software.
<strong>Thermophysics</strong> <strong>2012</strong> ‐ <strong>Conference</strong> <strong>Proceedings</strong><br />
17 th International Meeting of Thermophysical Society<br />
31 st October to 2 th November <strong>2012</strong><br />
Podkylava, Slovak Republic<br />
Slovak Academy of Science in Bratislava
Copyright © <strong>2012</strong> Brno University of Technology, Czech Republic<br />
All rights reserved. No part of this publication or the information contained herein may be<br />
reproduced, stored in a retrieval system, or transmitted in any form or by any means, electronic,<br />
mechanical, by photocopying, recording or otherwise, without written prior permission from<br />
the publisher.<br />
Although all care is taken to ensure the integrity and quality of this publication and the<br />
information herein, no responsibility is assumed by the publishers or the author for any damage<br />
to property or persons as a result of operation or use of this publication and/or the information<br />
contained herein.<br />
Book cover design: Vladimír Dvonka, Michal Veselý<br />
Printed by: Brno University of Technology, Faculty of Chemistry, <strong>2012</strong><br />
ISBN: 978‐80‐214‐4599‐4<br />
2
Acknowledgment<br />
Publication of this book was financially supported by the Czech Ministry of Education, Youth<br />
and Sports, under project No MSM 6840770031.<br />
Committees<br />
INTERNATONAL SCIENTIFIC COMMITTEE<br />
Rachel Becker, Civil and Environmental Engineering, Technion, Haifa, ISRAEL<br />
Vlastimil Bohac, Institute of Physics SAC, Bratislava, SLOVAK REPUBLIC<br />
Robert Cerny, Faculty of Civil Engineering CTU, Prague, CZECH REPUBLIC<br />
Dariusz Gawin, Department of Building Physics & Building Materials, Technical University of<br />
Lodz, Lodz, POLAND<br />
Hans‐Peter Ebert, Bavarian Center for Applied Energy Research, Würzburg, GERMANY<br />
John Grunewald, Faculty of Architecture, Dresden University of Technology, Dresden,<br />
GERMANY<br />
Shuichi Hokoi, Department of Architecture and Architectural Engineering, Faculty of<br />
Engineering, Kyoto University, Kyoto, JAPAN<br />
Ludovit Kubicar, Institute of Physics SAC, Bratislava, SLOVAK REPUBLIC<br />
Xinying Lu, Department of Civil Engineering, Tsinghua University, Beijing, CHINA<br />
Zbysek Pavlik, FCE CTU, Prague, CZECH REPUBLIC<br />
Bimal Kumar Sarkar, Department of Physics, Galgotias University, Greater Noida, INDIA<br />
Jay Sanjayan, Faculty of Engineering & Industrial Sciences, Swinburne University of<br />
Technology, Hawthorn, AUSTRALIA<br />
Henryk Sobczuk, Faculty of Environmental Engineering, Lublin University of Technology,<br />
Lublin, POLAND<br />
Oldrich Zmeskal, Faculty of Chemistry BUT, Brno, CZECH REPUBLIC<br />
3
ORGANIZING COMMITTEE<br />
Vlastimil Bohac, SAS, Bratislava, Slovak Republic<br />
Oldrich Zmeskal, FCH BUT, Brno, Czech Republic<br />
Zbysek Pavlik, FCE CTU, Prague, Czech Republic<br />
Viliam Vretenar, SAS, Bratislava, Slovak Republic<br />
Danica Fidrikova, SAS, Bratislava, Slovak Republic<br />
Marian Markovic, SAS, Bratislava, Slovak Republic<br />
Tomas Bzatek, FCH BUT, Brno, Czech Republic<br />
4
HISTORY OF CONFERENCE<br />
The first workshop was organized by prof. Stefan Barta on January 22,<br />
1996 at the Department of Physics, Faculty of Electrical Engineering and Information<br />
Technology at the Slovak University of Technology in Bratislava. The Termophysicʹs meetings<br />
have been established as periodical meetings of scientists working in the field of investigation of<br />
thermophysical properties of materials and the problems of heat transfer and measurement of<br />
thermophysical and other transport properties of materials.<br />
The <strong>Thermophysics</strong> as the working group of the Slovak Physical Society<br />
was established on the meeting at the Department of <strong>Thermophysics</strong> of the Slovak Academy of<br />
Sciences in Bratislava on June 13, 1997. The aim of the constitution of the working group is to<br />
exchange actual information in the field of heat transfer phenomena.<br />
Dr. Lʹudovít Kubičár acted as the coordinator of the group and organized meetings at the<br />
Institute of Physics of the Slovak Academy of Sciences in Bratislava in the years ‐ 1997, 1998 and<br />
1999.<br />
Then Dr. Libor Vozár from Faculty of Natural Sciences at the Constantine<br />
the Philosopher University in Nitra coordinated the activities of the society for the years 2000,<br />
2001 and 2002. The workshops were organized in Nitra, in Račková dolina and Kočovce,<br />
respectively.<br />
Next years, the <strong>Thermophysics</strong> workshop was held in Kočovce again. Dr.<br />
Peter Matiasovský, working for the Institute of Construction and Architecture at the Slovak<br />
Academy of Sciences in Bratislava, being the chairman of Thermophysical Society for the years<br />
2003, 2004 and 2005 was taking the chair of the workshops.<br />
The last three years the <strong>Thermophysics</strong> workshop was held in Kočovce<br />
again. Dr. Jozefa Lukovičova from research group at the Department of Physics of Faculty of<br />
Civil Engineering at the Slovak University of Technology in Bratislava was taking the chair of<br />
the workshops for the years 2006, 2007 and 2008.<br />
5
Since 2009 to 2011, the <strong>Thermophysics</strong> workshop was held in<br />
Valtice. Prof. Oldrich Zmeskal (working at the Institute of Physical and Applied Chemistry and<br />
Centre of Material Research at the Faculty of Chemistry of the Brno University of Technology in<br />
Brno) and prof. Robert Cerny (working at the Department of Materials Engineering and<br />
Chemistry at the Faculty of Civil Engineering of the Czech Technical University in Prague) were<br />
taking the chairs of the workshops.<br />
<strong>Thermophysics</strong> <strong>2012</strong> will be held in Guesthouse Adam in the village of<br />
Podkylava. Guesthouse Adam is surrounded in picturesque hilly region covered with hamlets<br />
and caters to all groupsʹ visitors and tourists. The guesthouse was built with the financial<br />
support of the European Union funds and has embarked its operation in May 2006. Dr.<br />
Vlastimil Bohac, SAS, Bratislava, Slovak Republic in cooperation with previous organizers<br />
prof. Zmeskal and prof. Cerny taken the chairmanship for the next 3 years 2013‐2015.<br />
6
Content<br />
Ivan Baník, Jozefa Lukovičová, Gabriela Pavlendová<br />
Unsolved Problems in Physics of Chalcogenide Glasses and the Barrier‐cluster Model ....................... 10<br />
Vlastimil Boháč, Peter Dieška, ViliamVretenár<br />
The measurement of thermophysical properties of sandstone by pulse transient method using<br />
model for cuboid form samples and influence of heat loss effect ............................................................. 23<br />
Patrícia Ekkertová, Ivana Šimková, Martin Brček, Tatiana Durmeková,<br />
Vlastimil Boháč<br />
Influences of temperature change and moisture content on the thermal conductivity of rocks ............. 33<br />
Danica Fidríková, Ľudovít Kubičár, Peter Dieška<br />
Determination of moisture diffusivity in sandstones using diffusion model ......................................... 41<br />
Andrés Gómez Ruiz, Ľudovít Kubičár, Viliam Vretenár<br />
Simulations of Hot‐Ball sensors using COMSOL ................................................................................ 48<br />
Martin Keppert, Zbyšek Pavlík, Pavel Reiterman, Robert Černý<br />
Mechanical and durability properties of cement‐based composites containing solid waste<br />
incineration residues .............................................................................................................................. 53<br />
Jan Kočí, Jiří Maděra, Jaromír Žumár, Zbyšek Pavlík, Robert Černý<br />
Evolution algorithms as tool for optimization of water vapour transport properties of cellular<br />
concrete .................................................................................................................................................. 60<br />
Dana Koňáková, Monika Čáchová, Martin Keppert, Pavel Reiterman,<br />
Eva Vejmelková, Václav Kočí, Robert Černý<br />
Basic, Mechanical, Thermal, and Hygric Properties of Autoclaved Aerated Concrete ......................... 67<br />
Olga Koronthalyova, Peter Mihalka<br />
Simplified modelling of hygric performance of a hysteretic building material exposed to cyclic<br />
changes of relative humidity .................................................................................................................. 73<br />
Jozef Kováč, Anton Trník, Igor Medveď<br />
Calcite influence on the thermal diffusivity of ceramic samples in the temperature range 25 –<br />
600°C ..................................................................................................................................................... 81<br />
Ľudovít Kubičár, Danica Fidríková, Vladimír Štofanik<br />
Monitoring of the temperature‐moisture regime of the wall of St. Martin Cathedral tower in<br />
Bratislava ............................................................................................................................................... 85<br />
Tereza Kulovaná, Eva Vejmelková, Martin Keppert, Petr Konvalinka,<br />
Michal Ondráček, Martin Sedlmajer, Robert Černý<br />
Mechanical and durability properties of concrete with pozzolanic admixture ...................................... 90<br />
Svetozár Malinarič, Peter Krupa<br />
Modification of the dynamic plane source method ................................................................................. 98<br />
Peter Matiasovsky, Peter Mihalka<br />
Determination of poromechanical coupling parameters for calcium silicate boards ............................ 105<br />
7
Peter Matiasovsky, Peter Mihalka, Lubomir Bagel<br />
Application of generalised Wiener mixing formula at modelling transport properties of porous<br />
materials ............................................................................................................................................... 111<br />
Peter Matiasovsky, Bozena Vasilkovova, Peter Mihalka<br />
Capillary condensation sorption model and its validity for highly porous building materials............ 116<br />
E. Martines‐Lopez, L. Lira‐Cortés<br />
Analysis of Luikov´s model in the process of heat and moisture transfer inside of a slab of<br />
ceramic ................................................................................................................................................. 123<br />
S. Olof Mundt‐Petersen, Petter Wallentén, Tomi Toratti, Jorma Heikkinen<br />
Moisture risk evaluation and determination of required measures to avoid mould damage<br />
using the Folos 2D visual mould chart ................................................................................................ 134<br />
Ján Ondruška, Anton Trník, Dagmar Jandeková, Pavel Reiterman, Igor Medveď<br />
The comparison of DTA and DSC curves for concrete with metakaolin addition ............................... 142<br />
Milena Pavlíková, Zbyšek Pavlík, Petra Volfová, Viktor Kaulich, Anton Trník,<br />
Ján Ondruška, Robert Černý<br />
Experimental analysis of plasters with increased heat storage capacity .............................................. 147<br />
Zbyšek Pavlík, Milena Pavlíková, Petra Volfová, Martin Keppert, Robert Černý<br />
Early age properties of cement paste with pozzolanic admixture ........................................................ 157<br />
Milena Pavlíková, Martin Keppert, Patra Volfová, Jan Fořt, Jaromír Žumár,<br />
Zbyšek Pavlík<br />
Application of diatomite as partial Portland cement replacement in mortar mix design .................... 165<br />
Zbyšek Pavlík, Martin Keppert, Milena Pavlíková, Jaromír Žumár<br />
The use of municipal solid waste incineration materials in concrete production ................................ 173<br />
Milena Pavlíková, Radka Pernicová, Jaromír Žumár, Jan Fořt, Zbyšek Pavlík<br />
Chosen physical properties of flours ..................................................................................................... 180<br />
Rudolf Podoba, Anton Trník, Igor Štubňa<br />
DC Conductivity of Waste Calcite – Clay Ceramics in The Temperature Range 20 – 1050 °C ......... 186<br />
Ľuboš Podobník, Rudolf Podoba, Igor Štubňa, Peter Bačík<br />
The firing temperature of Gothic bricks from Pác ................................................................................ 192<br />
B. K. Sarkar, G. Pavlendova, I. Banik, A. S. Verma<br />
Electronic and Thermal properties of Zinc Chalcogenides based on Density Function Theory .......... 198<br />
Invited lecture: Peter Šimon, Oldřich Zmeškal, Jaroslav Šesták<br />
Application of fractals in condensed‐state processes ............................................................................ 207<br />
Stanislav Šťastník, Jiří Vala<br />
Identification of thermal characteristics of a high‐temperature thermal accumulator ......................... 214<br />
Invited lecture: Ismail H. Tavman, Alpaslan Turgut<br />
Applications of thermophysics in science and industry – Nanofluids and Polymer<br />
Nanocomposites ................................................................................................................................... 223<br />
Jan Toman, Tomáš Korecký<br />
Thermal expansion measurement of lining boards .............................................................................. 231<br />
8
Vratislav Tydlitát, Jan Zákoutský, Robert Černý<br />
Heat Inertia Correction of Data Measured by a Conduction Calorimeter. .......................................... 235<br />
Eva Vejmelková, Michal Ondráček, Robert Černý<br />
Application of zeolite as alternative binder in concrete ....................................................................... 241<br />
Invited lecture: Bert Verstraeten, Jichuan Xiong, Christ Glorieux<br />
Determination of the thermal diffusivity of paint and the thickness of a paint layer by<br />
photothermal IR thermography ............................................................................................................ 247<br />
Viliam Vretenár, Ľudovít Kubičár, Vlastimil Boháč<br />
Monitoring of concrete setting and hardening by thermophysical measurements .............................. 251<br />
Oldrich Zmeskal, Lenka Dohnalova, Stanislav Nespurek<br />
Study of PCM material diffusivity ...................................................................................................... 258<br />
Janusz Zmywaczyk, Piotr Koniorczyk, Marek Preiskorn, Bogdan Machowski<br />
Identification of heat transfer coefficient inside a hollow cylinder containing a gas‐dynamic<br />
control block of medium‐range ballistic missile ................................................................................... 265<br />
List of participants ................................................................................................................................. 272<br />
9
Unsolved Problems in Physics of Chalcogenide Glasses and the<br />
Barrier‐cluster Model<br />
10<br />
Ivan Baník, Jozefa Lukovičová, Gabriela Pavlendová<br />
Department of Physics, Faculty of Civil Engineering, Slovak University of Technology,<br />
Radlinského 11, 813 68 Bratislava, Slovak Republic, ivan.banik@stuba.sk<br />
Abstract: The paper briefly summarizes the basic knowledge of chalcogenide glasses with an emphasis on<br />
unsolved problems in this area. Although there was much attention devoted to the research of<br />
chalcogenide glasses in the last decades, many questions about the nature of processes taking place in<br />
these substances still remain unanswered. So far there is no generally accepted model of chalcogenide<br />
glasses. The laws of optical and electrical phenomena, such as photoluminescence, photoconductivity,<br />
optical absorption in the exponential tail (Urbach`s rule) photoexpansion, Meyer‐Neldel rule in electrical<br />
conductivity are not reliably explained. Mechanisms associated with phase changes caused by light in<br />
these substances are not sufficiently understood, despite the fact that these phenomena are widely used in<br />
practice, for example, by recording information. The paper discusses the possibility of explanations of<br />
some mentioned phenomena based on the barrier‐cluster model of non‐crystalline semiconductor.<br />
Keywords: chalcogenide glasses, optical absorption, photoluminescence, photoconductivity, Urbach`s<br />
rule, Meyer‐Neldel rule, barrier‐cluster model<br />
1. Introduction<br />
The physical properties of non‐crystalline materials are much more complex than those of<br />
crystals. The wide‐range research in this area is very extensive. Non‐crystalline solids present<br />
an extremely wide variety of materials because they also include many component systems, in<br />
which the stoichiometric abundance of particular substances is not needed. Moreover, these<br />
materials are mostly metastable systems, and their metastable state depends on the sample<br />
preparation. A little deviation in this procedure may lead to quite different metastable state,<br />
and thus to the formation of a different non‐crystalline material. From thermodynamic view<br />
point, an amorphous solid is in a non‐equilibrium state; therefore its structure and bond<br />
configurations are not fixed but can be changed, sometimes reversibly, not only by thermal<br />
treatment but also by light irradiation.<br />
Much attention has been paid for the last few decades to clarification of the structure and<br />
physical properties of chalcogenide glasses [1‐5. The experimental facts pile up, but the theory<br />
remains behind. There is no satisfactory model and argument goes on even on its most<br />
fundamental starting points. No model has been suggested yet that would explain sufficiently<br />
the wide range of observed phenomena. The problem has not been solved even by the most<br />
modern technical means.<br />
The chalcogenide glasses are very attractive materials 4‐8 for application in integrated and<br />
fiber optics due to a number of specific properties in comparison to other optical materials. The<br />
chalcogenide glasses exhibit excellent transmission in the infrared spectral region, usually up to<br />
~ 12 μm. Chalcogenide glasses exhibit high refractive index, low phonon energy. These glasses<br />
have good solubility towards rare earth elements ions and high chemical and thermal stability.
They provide an opportunity to obtain fluorescence and possible laser action at longer<br />
wavelengths than available from oxide or fluoride vitreous hosts.<br />
2. Actual physical problems of chalcogenide glasses<br />
Although the chalcogenide glasses (CHG) are widely used in modern techniques and technology 1,<br />
4‐8, many of physical processes in these materials remain to be a mystery. The first fundamental<br />
considerations of non‐crystalline semiconductors are reviewed in reference [2. Subsequent<br />
developments are described in 3.<br />
Further on we will recall some partial open and discussed problems of physics of<br />
chalcogenide glasses.<br />
Electron spectrum and electrical conductivity<br />
Regarding the electron spectrum of amorphous semiconductors, pioneering ideas in this<br />
direction were developed by N.F.Mott ‐ Nobel Prize holder for the work in the field of<br />
amorphous materials. These ideas mostly concern the physical insights related to the concepts:<br />
mobility gap, gap‐states, optical edge, hopping and so on. At high temperatures in chalcogenide<br />
glasses prevails the transport in delocalized states, which is in many ways similar in character<br />
as the transport in crystalline semiconductors. At low temperatures dominates so called<br />
hopping transport. An important Mott’s theoretical contribution were works related to<br />
ʺhopping transport.ʺ Very famous is Motto’s ¼ law [2. Although many questions regarding<br />
electrical transport were already explained, yet many questions in this area remains open. The<br />
question of electron spectrum of chalcogenide glasses has not been reliably solved yet. The most<br />
serious problem is the problem of the density of states in the mobility gap.<br />
Optical absorption<br />
The biggest mystery in terms of optical absorption is the existence of exponential tails of optical<br />
absorption [1‐3. These tails deeply interfere into the forbidden band of semiconductor. The<br />
opinion prevails that their formation is the result of the tails’ density of states in forbidden<br />
band. The tails’ density of states is attributed exponential course, which raises a number of<br />
serious doubts. It is unlikely that different chalcogenide glasses can have a very similar slope of<br />
exponential tails of optical absorption and hence similar exponential tails of the density of<br />
states. Even Mott himself in his monograph [2. considered such an ʺimprobabilityʺ. So far there<br />
is no generally accepted explanation of the exponential tails and related Urbach’s rules.<br />
Photoconductivity<br />
Photoconductivity shows quite often typical exponential temperature dependence. This applies<br />
only in some temperature range. The course of photoconductivity in the graph lnσph (1/T) in a<br />
wider temperature range is usually much more complex. The mentioned exponential (in the<br />
graph linear) dependence passes at lower temperatures into fixer on some nonzero value. With<br />
increasing temperature photoconductivity reaches maximum, afterwards comes almost<br />
immediately exponential (linear) decrease, sometimes combined with a subsequent minimum.<br />
11
Serious explanation of this course does not exist yet. A possible explanation was presented in<br />
[9], based on the barrier‐cluster model.<br />
Photoluminescence<br />
Regarding photoluminescence, the major features of the chalcogenide semiconductors are [1‐3.:<br />
Stokke’s shift, Street’s Law, a phenomenon known as fatigue of photoluminescence (this means<br />
the initial onset of the photoluminiscence to the relatively high level and its subsequent gradual<br />
reduction to the steady, substantially lower value). So far even the nature of excitation<br />
photoluminiscence curve is not explained. This problem is also connected to the question: why<br />
photoluminescence excitation efficiency is highest in the range of exponential tail of optical<br />
absorption, hence the Urbach’s tail area. These phenomena are not yet theoretically (as a model)<br />
adequately understood. Possible explanation for those phenomena was presented in [10], which<br />
are also based on the barrier‐cluster model.<br />
Electroabsorption<br />
A strong electric field ‐ as first discovered by Kolomijec [2] ‐ increases light absorption<br />
coefficient. Relatively small change of the absorption coefficient ‐ as demonstrated by<br />
measurements ‐ increases with increasing photon energy, as well as the square of field intensity.<br />
Several attempts to interpret the phenomenon were based on the assumption that it is so called<br />
Frenkel‐Poole effect. Such an explanation is not universally accepted. Different explanation has<br />
been published in paper [10].<br />
Meyer‐Neldel rule<br />
Semiconductors are usually characterized by the temperature dependence of their electrical<br />
conductivity, σ = σ0 exp(‐ W/kT), where σ0 is a constant and W – activation energy. For many<br />
classes of materials, especially amorphous hydrogenated silicon, chalcogenide glasses, organic<br />
semi‐insulators, experimental evidence suggests that a correlation exists between the activation<br />
energies and pre‐exponential factors in the following form [6, 11]: exp ( bW ) , here b is<br />
0 00<br />
the constant. The value EMN = 1/b is the MN‐energy and TMN = EMN/k) the MN‐temperature. The<br />
relation 0 00 exp ( bW ) represents Meyer‐Neldel empirical rule (MNR). Explanation of<br />
Meyer‐Neldel rule is a serious problem, because it covers a wide range of phenomena. Itʹs not<br />
just the electrical conductivity of chalcogenide glasses and other disordered semiconductorts,<br />
but also a number of important processes. This includes for example, diffusion, catalysis,<br />
crystallization, and others. MNR, also often referred to as the compensation rule concerns far<br />
wider field of phenomena such as electrical conductivity. It also applies to many chemical and<br />
biological processes.<br />
Phototransformation processes<br />
Photostructural processes today are quite important and widely used in technology, especially<br />
by recording information [1]. Yet their physical nature is little explored. These phenomena can<br />
be used in photolithographic applications, holographic records, in the manufacture of optical<br />
gratings and so on. Best way to their understanding seems to be the idea of the existence of<br />
12
clusters in chalcogenide glasses and assumption that light induces structural changes of<br />
clusters. Direct evidences, however, do not exist yet. Photostructural effects may take different<br />
forms. Phototransformation of clusters may be under certain circumstances, reversible, which is<br />
important for the repeated entry of information.<br />
3. State of physics of chalcogenide glasses<br />
In the following we will give some physicists’ views on the situation in the examination in the<br />
area of amorphous semiconductors, particularly chalcogenide glasses.<br />
In the paper [13] authors K. Shimakawa, Y. Ikeda, S. Kugler state: “Although a great number of<br />
studies have been undertaken to understand the characteristics of electronic and optical<br />
properties of amorphous semiconductors in the last three decades, many of these properties are<br />
still not clear. It is well known that amorphous chalcogenides show a metastable photoinduced<br />
transformation of structural network and microscopic defect structures [1‐5]. Some of these<br />
properties are fairly well understood, while some are still the matter of debate”.<br />
In the paper [14] authors K. Tanaka and S. Nakayama mention: „However, the concept of the<br />
mobility edge seems to be still vague. Little work has been reported for the value of the mobility<br />
gap in real materials, and theoretical sudies predicting mobility‐edge energies are few. No<br />
reliable experimental methods have been established for evaluating the mobility gap. The<br />
relationship between the mobility gap and the other empirical gaps is unclear, and accordingly,<br />
we are still unconvinced of the mobility‐gap concept“.<br />
One of the most widespread explanation of the MNR is based on the statistical shift of the Fermi<br />
level with temperature. In this approach, the conductivity is due to charge carries at the<br />
mobility edge, so that E is the difference between the mobility edge and the Fermi level, which<br />
is assumed to vary linearly with T. Correspondingly, E in Eq. (1) should be replaced by E (1‐<br />
const.T), leading to the MNR.<br />
Authors J. Fortner, V. G. Karpov, and Marie‐Louise Saboundgi in their paper [15] state, that<br />
such an explanation of MNR is for the liquid semiconductors unrealistic. For the liquid<br />
semiconductors rules this out as universal explanation since E becomes negative. Another<br />
approach suggested by Yelon et al is based on the multiexcitational character of the processes<br />
responsible for the MNR. An explanation based on a statistical shift of the Fermi energy with<br />
temperature is shown to be unrealistic. Multiphonon hopping is suggested as an explanation of<br />
the temperature and composition dependence of the electrical conductivity. This mechanism<br />
has the advantage of being universally valid for amorphous, crystalline, and liquid<br />
semiconductors. In conclusion, it has been shown that the electrical conductivity of liquid<br />
semiconductor yields a slope for the MNR which rules out the conventional explanation in<br />
terms of the statistical shift of the EF. Hopping is suggested to be a dominant conduction<br />
mechanism for these liquids.<br />
Arthur Yelon, Bijan Movaghar in the paper [16] state “The older model of MNR, based on the<br />
movement of the Fermi level in an exponential single particle density of states cannot be<br />
generally correct, as it assumes absorption of a single phonon. Thus, even in the presence of an<br />
exponential density of states, it would be necessary to take into account the entropy of the<br />
multiphonon process”.<br />
Tanaka: In spite of tremendous effort dedicated to chalcogenide glasses, the structure and<br />
properties of these materials have not been completely understood yet. It was pointed out many<br />
years ago that no ESR signal was detected in amorphous chalcogenides (a‐Se, a‐As2S3). This<br />
13
observation, viz the absence of spins in chalcogenide glasses, led Anderson [17] and Street and<br />
Mott [18] to formulate their negative effective correlation energy (negative‐U) models, in terms<br />
of charge defects. But, Tanaka [12] has questioned the presence of the charged defects on the<br />
basis of optical absorption measurements on highly purified As2S3 samples.<br />
Mott: The present state of physics of non‐crystalline semiconductors seems to be incredibly<br />
complex. The Nobel Prize winner N. Mott, in the introduction to the second edition of his work<br />
[2] (edited in the Russian language in 1982) characterized this state in these words: ”There were<br />
never so many discrepancies as there are now in the physics of non‐crystalline solids”. If he<br />
lived, he would probably observe again: ”This state is not better now, but rather worse”.<br />
H. Overhof in his lecture at the remembrance of N. Mott‘s anniversary [19, 20] has not only<br />
praised Mott‘s great contribution to the physics of non‐crystalline solids, but he also introduced<br />
a very important idea at the end of his performance: ”It seems to me, as far as the theory of non‐<br />
crystalline semiconductors is concerned, that one of the fundamental pillars of the pedestal, on<br />
which such a theory should rest, is still unknown to us.” This is to some extent quite crude,<br />
however true.<br />
Remarks: We can not agree with the idea that the exponential tails of optical absorption are<br />
caused by the distribution of density states in the mobility gap. Of course, the possible density<br />
of states can to some extent influence exponential tails, but we do not consider it the primary<br />
cause of such tails. We consider the participation of phonons in absorption the primary cause of<br />
tail formation. By this it is easy to explain ʺuniversalityʺ of tails’ exponential character and also<br />
practically the same slope in a rich variety of semiconducting materials. Something like this can<br />
not be provided by the density of states of various and varied materials. In our interpretation,<br />
the distribution of the density of states is a secondary factor. This is in agreement with the<br />
characteristics of a‐Si, respectively a‐Si:H, in which the standard exponential tails appear just<br />
after the elimination of free bonds, thus after the hydrogenation. Thus the tails appear after the<br />
forbidden zone purification.<br />
4. Barrier‐cluster model (BCM)<br />
The barrier‐cluster model of the CHG assumes that an amorphous semiconductor consists of<br />
microscopic regions separated from each other by potential barriers [9, 10, 21‐24]. These micro‐<br />
regions are created in chalcogenide glasses by closed clusters. Potential barriers can be depicted<br />
inside the conduction and valence bands of an amorphous material. The barriers restrict the<br />
transition of low energy conduction electrons from one region to another. At the lower margin<br />
of the conduction band, a sub‐band with carriers of low average mobility (μ1) is created. The<br />
states with energy above the peaks of barriers are delocalized. They create a sub‐band with a<br />
high average mobility (μ2). The barrier‐cluster model with closed clusters for the chalcogenide<br />
glasses is able to give simple explanations for the general properties of these glasses.<br />
Barrier‐cluster model does not exclude the existence of states in a forbidden band of<br />
chalcogenide glasess. But it does not attribute them the responsibility for the exponential tails of<br />
optical absorption. The states in the forbidden band are not a priority cause of exponential tails.<br />
To support this idea, we can mention the fact that exponential tails of optical absorption also<br />
arise in those non‐crystalline substances, in which the existence of states within the forbidden<br />
band could not be proved even by the most sophisticated experimental techniques.<br />
14
4.1. Optical absorption<br />
In most crystalline solids, optical absorption is characterized by a sharp edge at the margin of<br />
the absorption band. Its position corresponds to the optical width of the forbidden band.<br />
However, the situation is different in the case of non‐crystalline semiconductors. The absorption<br />
band near its border is smeared out and it creates a tail that extends deep into the forbidden<br />
band. Its profile is exponential as a rule. The exponential tails at higher temperatures tend to fit<br />
the Urbach´s formula. The slope of the tails changes with further temperature decrease. At<br />
lower temperatures, the slope of the tails does not change with further temperature decrease.<br />
However, a certain parallel shift towards lower absorption is observed. Optical phenomena in<br />
non‐crystalline semiconductors represent a number of complex physical phenomena. One of the<br />
great puzzles to be explained is the origin of the exponential tails.<br />
The starting point of the considerations in [9, 10] on the basis of barrier model is an assumption<br />
that at proper conditions for a distinct absorption of light, the potential barriers in non‐<br />
crystalline semiconductors occur, with phonons participating in the energy exchange. An<br />
electron in an optical transition accepts not only the energy hf of a photon but also the phonon<br />
energy Wphon . Thus, the whole energy accepted is hf + Wphon where Wphon is the energy<br />
acquired from a phonon ʺfield”. The quantity hf is positively determined by the radiation<br />
wavelength, while Wphon has a statistical character. In principle, a photon can be absorbed<br />
only when the whole energy of the electron, hf + Wphon 2W, is sufficient to cause a transition<br />
of the electron into the conduction band. It should be taken into account, however, that optical<br />
transitions on the energy levels lying just below the tops of barriers will dominate at higher<br />
temperatures. In this case, the probability of transition within a single localized region is small.<br />
The levels in adjacent microregions offer more possibilities for combination. However, they are<br />
connected with tunneling through barriers. Under these assumptions, the transitions to levels<br />
just below the barrier peaks will be more probable for two reasons. The transitions to lower<br />
levels will be restricted considerably by a small tunneling probability. The second reason rests<br />
in strong electron‐phonon interaction caused by the barriers.<br />
The number of electrons that can acquire such deficit of energy (2W ‐ hf ) from a phonon field,<br />
depends on temperature. The number of electron transitions when irradiating material by ʺlow<br />
energyʺ photons (and thus, also the coefficient of optical absorption α) and the number of such<br />
phonons with sufficient energy at temperature T is directly proportional. For the absorption<br />
coefficient it can be derived [9, 10, 23, 24]:<br />
ln α hf + const, (1)<br />
which is a mathematical expression of an exponential tail of optical absorption. However, the<br />
slope of tails is also temperature dependent as will be shown further.<br />
4.2 The Urbach’s rule<br />
The Urbach rule is empirical, describing the absorption of light in exponential tails of optical<br />
absorption spectra. It expresses the dependence of the coefficient of the optical absorption α on<br />
the photon energy hf and the temperature T. Mathematicaly it can be expressed by the relation<br />
hf H<br />
hf H<br />
C exp( ) C exp( )<br />
kT<br />
EU<br />
or equivalently as<br />
(2a,b)<br />
15
16<br />
hf H <br />
ln<br />
<br />
const<br />
kT <br />
hf H <br />
ln<br />
<br />
<br />
<br />
const<br />
E <br />
<br />
U <br />
(3a,b)<br />
Thus, lnα (hf) is a straight line. Here γ, E are parameters and k is the Boltzmann constant, EU ‐<br />
Urbach energy. This relation holds for relatively high temperatures. At low temperatures, the<br />
absorption is given by a relation similar to (2, 3) but the real temperature T has to be replaced by<br />
a constant parameter TU. This point was not explained satisfactorily up to now [1, 9].<br />
5. Explanation of the Urbach’s rule<br />
The Urbach rule has been explained by the barrier‐cluster model assuming that an electron<br />
during the optical transition from the conduction into valence band can absorb both the energy<br />
of a photon and of a phonon [4‐6]. Then the energy increase of the electron is equal to<br />
hf + Wphon<br />
where Wphon is the energy gained by the electron from lattice vibrations. The photon energy is<br />
given by the frequency of light. The phonon energy has a statistical character. If the photon<br />
energy hf < 2W is less than the width of the forbidden gap of a non‐crystalline semiconductor<br />
then the absorption of light cannot happen. But, the absorption can come into being if the<br />
missing energy 2W – hf needed for the transition is supplied by a phonon. This is the energy,<br />
which an electron needs in order to equalize its energy with the width of the forbidden gap. The<br />
probability of occurrence of phonons with an energy higher than or equal to 2W – hf is<br />
proportional, at temperature T, to the expression<br />
2W<br />
hf hf 2W<br />
p C exp( ) C exp<br />
2kT<br />
2kT<br />
<br />
<br />
<br />
The probability of optical absorption (with the participation of phonons) is proportional to the<br />
same expression. The absorption coefficient α in an energy region of photons less than the<br />
width of the forbidden gap can be determined as<br />
hf 2W<br />
0<br />
exp( )<br />
2kT<br />
where α0 is a constant. Thus<br />
hf 2W<br />
<br />
ln ln<br />
0<br />
2kT<br />
<br />
This relation represents a straight line (exponential tail of optical absorption), with a slope<br />
decreasing with increasing of temperature T. This behaviour corresponds to the one known<br />
with chalcogenide glasses (if E = 2W). However, it has become known from experiments that<br />
the situation changes with the temperature decrease. The slope of the straight lines given by (6)<br />
continues being unchanged with temperature at low temperatures. Only a parallel shift to the<br />
lower absorption of “exponential tails” is observed. The relation (6) is no longer valid. At<br />
lowering the temperature of a non‐crystalline semiconductor, the parameter T in relation (6) no<br />
longer represents temperature. It seems as if the temperature was freezed at a certain value of<br />
TU. The essence of this phenomenon is not reliably explained till now [1], but we will try to<br />
clarify it partially. Let us note that the parameter γ is about 0,4 – 0,55 [9, 10] in the chalcogenide<br />
(4)<br />
(5)<br />
(6)
glasses. When comparing (3) and (6), we see that the barrier‐cluster model yields the constant γ<br />
= 0,5. This may be considered as a good agreement in the research of non‐crystalline<br />
semiconductors.<br />
6. The Meyer‐Neldel rule<br />
The MNR has been observed for the first time with examining the electric conductivity of non‐<br />
crystalline semiconductors [11]. Semiconductors are characterized by their exponential<br />
temperature dependence of the electrical conductivity [1‐3]<br />
<br />
0<br />
W<br />
exp( <br />
kT<br />
)<br />
where σo is a constant and W is an activation energy. For many classes of materials, especially<br />
organic semi‐insulators, chalcogenide glasses, amorphous silicon, experimental evidence<br />
suggests that a correlation exists between the activation energy and the pre‐exponential factor<br />
of the following form [1‐3]<br />
ln bW ln<br />
0<br />
00<br />
where b and σoo are constant. This relation can be written as<br />
<br />
0<br />
00<br />
exp(<br />
W<br />
kT<br />
MN<br />
)<br />
<br />
0<br />
00<br />
exp(<br />
W<br />
E<br />
MN<br />
)<br />
(7)<br />
(8)<br />
(9a,b)<br />
here b = 1/kTMN. The relation (8, 9) gives the dependence of the pre‐factor σo on the activation<br />
energy W and represents the Meyer‐Neldel empirical rule. Equation (9) is often referred to as<br />
the MN rule or the compensation rule. Constant σoo is often called the Meyer‐Nedel pre‐<br />
exponential factor and kTMN the MN characteristic energy. This rule holds in disordered<br />
materials when W is varied by doping, by surface absorption, light soaking or by preparing<br />
films under different conditions. This rule has also been observed in liquid semiconductors and<br />
fullerens. The validity of the MN rule has also been reported in the case of chalcogenide glasses.<br />
In the case of these glasses this rule is observed by variation of W when the composition of the<br />
glassy alloys is changed in a specific glassy system. Electrical conductivity in dark is measured<br />
as a function of temperature for this purpose.<br />
6.1 Explanation of MNR based on the barrier‐cluster model<br />
The MNR has been explained in frame of barrier‐cluster model in paper [22]. The cornerstone of<br />
this explanation is the idea that the energy released at non‐radiative recombination of e‐h pairs<br />
consists of a series of monoenergetical phonons with energy much smaller than the width of the<br />
forbidden gap. At given energy of monoenergetical phonons, the number of the released<br />
phonons depends upon the width of the forbidden gap. The probability of the simultaneous<br />
emission of N phonons exponentially decreases with the increasing N. The recombination<br />
probability decreases together with the width of the forbidden gap. By decreasing of<br />
recombination the equilibrium concentration of free electrons in conduction band becomes<br />
higher. Calculation of electric conductivity leads to the formula representing the MNR.<br />
17
7. On the relation of the Meyer‐Neldel rule and the Urbach’s rule<br />
Up to now there is no generally accepted model explaining the physical essence of the Meyer‐<br />
Neldel rule [1, 6, 22]. One meets a similar situation in interpretations of the Urbach’s rule [1].<br />
The intent to explain a connection between two unexplained phenomena may seem to be<br />
strange for the readers. Our standpoint is based on our preceding works, where the barrier‐<br />
cluster model has been proposed and where also the upper mentioned phenomena were<br />
explained in the frame of this model. First, the explanation of the Urbach rule has been<br />
published in [23, 24] and subsequently also an explanation of the Meyer‐Neldel rule [22]. From<br />
that point of view, the search for a relation between both rules seems to be clear.<br />
7.1 Relation of the MNR to the Urbach’s rule<br />
The basic idea is subsequent. As it has been mentioned above, the energy released at non‐<br />
radiative recombination of e‐h pairs is transformed into the energy of mono‐energetic phonons.<br />
These phonons create a phonon field in a semiconductor (some kind of a quasi‐thermal<br />
background). At higher temperatures this additional phonon field is relatively “weak”and thatʹs<br />
why its effect doesn’t appear significant – thermal phonons dominate. At higher temperatures,<br />
the relation (6) holds, where T denotes the temperature. The slope of a straight line lnα (hf)<br />
decreases with the increase of the temperature.<br />
At lower values of kT, it will be necessary to accept the substitution<br />
kT + kTo<br />
instead of kT. The second term, kTo, represents phonons of optical origin (a supplementary<br />
phonon field due to mono‐energetic phonons of recombination origin). In the middle area it will<br />
be valid that<br />
18<br />
hf 2W<br />
0 exp(<br />
2k<br />
)<br />
T T<br />
0<br />
hf 2W<br />
0 exp( )<br />
2<br />
EU<br />
(10a,b)<br />
where the EU = kT + kTo = kT + EU0 is the Urbach’s energy. By lowering the temperature, the first<br />
term kT becomes small and the second term kTo (= EU0 ) begins to dominate. By a subsequent<br />
cooling, the relation achieves the limiting form<br />
hf 2W<br />
hf 2W<br />
0 exp( ) 0 exp( )<br />
2kT<br />
2<br />
0<br />
EU<br />
0<br />
(11a,b)<br />
Result is that the slope of the exponential tails (in the straight line representation) by lowering<br />
temperatures will gradually become smaller. It looks as if at very low temperatures the tail of<br />
optical absorption is shifted almost parallel to the lower absorption. The limiting straight line<br />
will be the one which corresponds to the exponential function (11). It seems, that this idea can<br />
be utilized in an explanation of observed phenomena. But many questions remain open. For<br />
instance: In which way the value of kTo depends on the intensity of incident light (or on the<br />
light flux). One can assume that at a higher light flux, the corresponding value of kTo will also<br />
be higher. Experimental data concerning such a dependence are not known at present. The<br />
things are not simple, because the value of kTo depends on interaction of photons with phonons<br />
of optical origin. In this problem there are many open questions. We are not sure if our<br />
explanation about the relation of the MNR to the Urbach’s rule is not liable to criticism. Perhaps<br />
our consideration has only suggested a way that can be followed.
8. Optical bandwidth of the forbidden band<br />
The concept of optical bandwidth E of the forbidden band in a non‐crystalline semi‐conductor is<br />
used relatively often in publications dealing with this subject [1‐3]. It is defined as the energy of<br />
photons of monochromatic light to which the conventional value of the absorption coefficient<br />
corresponds [ = 102 cm ‐1 ]. Experiments showed that the optical bandwidth E is strongly<br />
influenced by temperature T. The functional dependence E(T) (for example in the case of non‐<br />
crystalline chalcogenide semiconductors) has most often a linear character, E = Eo + CT. The<br />
value dE/dT = C < 0 represents the temperature coefficient of the optical bandwidth of the<br />
forbidden band of a semiconductor. With chalcogenide materials, these values are most often in<br />
the range 5‐7x10 ‐4 eVK ‐1 [2]. In literature [2], for example, the data are given: for As2Se3: 7x10 ‐4 eVK ‐<br />
1 , for Se: 7x10 ‐4 eVK ‐1 , for As2Se3‐Sb2S3 semiconductors type : 6‐7x10 ‐4 eVK ‐1 , for As2S5 : 6x10 ‐4 eVK ‐1 ,<br />
for CdGeAs2 : 5x10 ‐4 eVK ‐1 . These values are rather close to each other, which does not happen<br />
by chance.<br />
8.1. Optical bandwidth and barrier‐cluster model<br />
The properties of optical width of the forbidden band can be explained well using the barrier‐<br />
cluster model [9, 10, 23, 24] for which the value E obtains a clear physical interpretation. It can be<br />
made clear at the same time, why the above values are so close to each other. However, the fact<br />
will be made clear as well that assuming the value E as optical width of the forbidden band is in<br />
fact illegitimate, because its value is influenced significantly by the concentration of phonons.<br />
From the condition that the absorption coefficient should have a constant conventional value<br />
of = 10 2 cm ‐1 , a requirement results under these circumstances that<br />
hence<br />
hf 2 W <br />
K ln<br />
<br />
<br />
<br />
<br />
2 kT 0 <br />
hf = 2W + CT (13)<br />
where K < 0 is a constant, C = kK < 0 and hf ‐ 2W < 0. Under these circumstances, the value hf<br />
represents the optical bandwidth E = hf, so that<br />
E = 2W + CT (14)<br />
It is obvious that at these conditions, the value C = d(hf)/dT < 0 represents the temperature<br />
coefficient of the optical width of a forbidden band. The linear dependence obtained fits well<br />
with the data and dependences found experimentally. Supposing that diverse values of<br />
absorption for different chalcogenide materials are primarily due to different values of the<br />
exponential term, the constant K will have almost the same value for given materials. (This<br />
supposition is, however, the same as the assumption that coefficients A are almost identical for<br />
different chalcogenides.) The very close values of the temperature coefficient C = d(hf)/dT of<br />
these materials are a consequence of this as well and in a good agreement with the values<br />
introduced. Thus, the temperature dependence of optical width E of the forbidden band is not<br />
due to a real change of the bandwidth but due to energy of phonons taking part in an<br />
absorption event. With increasing temperature, the contribution of phonons increases as well.<br />
This is what enables absorption of light by lower energy photons.<br />
(12)<br />
19
At lower temperatures the optical bandwidth can be determined from the relation (10). By<br />
similar procedure we obtain expression E = 2W + CT + CT0 and for limit case (T→ 0): E = 2W<br />
+ CT0 (E < 2W).<br />
9. Interpretation of another connection<br />
In frame of the BCM it is possible to explain other effects observed in experiment, such as the<br />
temperature dependence of photoconductivity of chalcogenide glasses (As2S3) in the low<br />
temperature region. As an example, we can note a plot of the photoconductivity dependence on<br />
the temperature T showed in the Figure published in Ref. [12]. One can see that the<br />
photoconductivity decreases with decreasing the temperature, but at a certain low enough<br />
temperature, this decrease of the photoconductivity is stopped. By further lowering the<br />
temperature, the photoconductivity becomes actually constant. This behaviour of the<br />
chalcogenide glasses can be explained by the use of barrier‐cluster model. In the same fig. 1 in<br />
[12] another graph can be seen, presenting dependence of the photoluminescence on the<br />
temperature. Photoluminescence increases with the temperature decrease. At a certain<br />
temperature this increase stops and a further lowering of the temperature actually doesn’t<br />
change the photoluminescence. This behaviour of the photoluminescence can also be explained<br />
by the barrier‐cluster model. The “temperature fault“ appears at the temperature T0 at which<br />
the behaviour of both the phenomena (photoconductivity and photoluminescence) exhibits<br />
changes. The temperature T0 is actually the same for both phenomena. We do not believe that<br />
this happens accidently.<br />
9.1 Further remarks<br />
Optical absorption in the exponential tail region decreases up to a level given by relation (10).<br />
After a further decrease of the temperature, the absorption becomes constant. This implies that<br />
the optical contribution to the concentration of free electrons becomes saturated and thus also<br />
the photoconductivity eases to vary. However, the free electrons do influence upon the<br />
photoluminescence. According to the barrier‐cluster model [5‐6], the free electrons catalyze a<br />
non‐radiant recombination of bound e‐h pairs. The more non‐radiant recombinations, the less<br />
radiant ones are present, and vice versa. Any decrease of free electrons (charge carriers) causes<br />
an increase of the photoluminescence. On the other hand, when the concentration of free<br />
electronss enhances, the photoluminescence becomes oppressed. Whenever the minimum of the<br />
conductivity is achieved, the luminescence will attain its maximum value. This relationship<br />
bettween the photoconductivity and photoluminescence is well observable in the fig. 1<br />
presented by Tanaka [1, 11]. The primary reason of way the optical quantities become saturated<br />
at sufficiently low temperatures is the production of monoenergetic phonons arisen with the<br />
optical absorption associated with non‐radiant recombinations of e‐h pairs. Thus, the existence<br />
of monoenergetic phonons enables to clarify not only the essence of the MNR, but also the<br />
Urbach‘s rule, and even other connections between optical phenomena.<br />
20
Figure 1: Temperature dependence of the PE (solid circles), PC (open circles), and PL (open triangles),<br />
which are excited with 2,0 eV light [12].<br />
ʺInverseʺ correlation between photoconductivity and photoluminescence is evident. Growing<br />
photoconductivity and thus increasing concentration of free electrons causes decreasing<br />
concentration of bound e‐h pairs and thus decreasing of photoluminesce. It is caused by the fact<br />
that according to barrier‐cluster model free electrons work as catalysts of non radiative<br />
recombinations of e‐h pairs. This results in a decrease in radiative recombination and thus<br />
decrease of photoluminesce. In Fig. 1 is also clearly seen the correlation between the photo‐<br />
expansion of PE and photoluminescence PL. In terms of barrier‐cluster model is the level of<br />
photoluminesce proportional to the concentration of bound e‐h pairs. It can be concluded that<br />
bound e‐h pairs (as kind of quasi‐excitons) are responsible for the photo‐expansion. The actual<br />
impact of such a mechanism is yet unknown.<br />
10. Conclusions<br />
The present state of physics of non‐crystalline solids still appears complex. The range of<br />
experimental research in this area is very extensive and calls for theoretical analysis. The most<br />
important phenomena observed in chalcogenide glasses are not sufficiently explained yet. The<br />
explanation can be done on the basis of the barrier‐cluster model. The barrier‐cluster model<br />
provides a new explanation for the density of states within the forbidden band of a<br />
semiconductor and explains why the attempts at identification of gap‐states by various optical<br />
and other methods fail [25]. The closed‐cluster structure can explain the absence of an ESR<br />
signal in the case of chalcogenide glasses [26]. The barrier‐cluster model can be (as we believe)<br />
expected stimulative for the a development of new interpretations of physical phenomena in<br />
chalcogenide glasses<br />
References<br />
[1] TANAKA, K., SHIMAKAWA, K.: Amorphous Chalcogenide Semiconductors and Related<br />
Materials, (Springer, 2011), p.300, (2011).<br />
[2] MOTT, N.F., DAVIS, E.A.: Electron processes in non‐crystalline materials, Clarendon<br />
Press, Oxford (1979) (Elektronnyje processy v nekristaličeskich veščestvach, Mir, Moskva<br />
(1982)).<br />
21
[3] BRODSKY, M,H.: Amorphous semiconductors, Springer Verlag Berlin, Heidelberg, New<br />
York (1979) (Amorfnyje poluprovodniky, Mir, Moskva (1982)).<br />
[4] POPESCU, M.: Photoinduced Phenomenon and elements for integrated Optics based on<br />
Non‐crystalline chalcogenide semiconductors, Ed.: Chisinau 2003.<br />
[5] TANAKA, K.: Journal of Non‐Crystalline Solids 266‐269, 889‐893, (2000).<br />
[6] MEHTA, N.: Curr. Opin. Solid State, Mater. Sci. 14, (5), 95, (2010).<br />
[7] SARKAR, B.K., VERMA, A.S., DEVIPRASAD, P.S.: Temperature induced band gap<br />
shrinkage in Cu2GeSe3: Role of Electron‐phonon interaction, Physica B 406, 2847‐2850,<br />
(2011).<br />
[8] POPESCU, M.: Disordered chalcogenide optoelectronic materials: phenomena and<br />
applications Journal of Optoelectronics and Advanced Materials Vol. 7, No. 4, p. 2189 –<br />
2210, (2005).<br />
[9] BANIK, I.: Photoconductivity in chalcogenide glasses on the base of the barrier‐cluster<br />
model, Journ. of Optoelectr. and Adv. Mater. Vol.11, No.12, p.1931‐1945, (2009).<br />
[10] BANIK, I.: Barrier‐cluster model – the base for understanding of the optical phenomena in<br />
non‐crystalline semiconductors, J. Optoelectr. and Adv. Mater. Vol.11, No.12, p.1915‐1930,<br />
(2009).<br />
[11] MEYER, W., NELDEL, H.: Z. Tech. Phys. (Leipzig), 18, p.588, (1937).<br />
[12] TOYOSAWA, N., TANAKA, K.: Phys. Rev. B 56 7416, (1997).<br />
[13] SHIMAKAWA, K., IKEDA, Y., KUGLER. S.: Fundamental optoelectronic processes in<br />
amorphous chalcogenides, (Book chapter, Non‐Crystalline Materials for Optoelectronics,<br />
Ed. G.Lucovsky and M.A.Popescu, INOE Publishing House p. 103‐130, (2004).<br />
[14] TANAKA, K., NAKAYAMA, S.: Where is the mobility edge in amorphous<br />
semiconductors, Journ. of Optoelectr. and Adv. Mater., Vol.2, No.1, p.5‐11, (2000).<br />
[15] FORTNER, J., KARPOV, V.G., SABOUNDGI, M.L.: MNR for liquid semiconductors,<br />
Appl. Phys. Lett. 66 (8), (1995).<br />
[16] YELON A., MOVAGHAR, B.: The MN conductivity prefactor for CHG, Appl. Phys. Lett.<br />
71, (24), (1997).<br />
[17] ANDERSON, P.W.: Phys. Rev. Lett. 34, p.953, (1975).<br />
[18] STREET, R.A., MOTT, N.F.: Phys. Rev. Lett. 35, p.1293, (1975).<br />
[19] OVERHOF, H.: Fundamental concept in the physics of amorphous semiconductors, J.<br />
Non‐Cryst. Solids, 227‐230, p. 15‐22, (1998).<br />
[20] OVERHOF, H., THOMAS, P.: Electronic transport in hydrogenated amorphous<br />
semiconductors, (Springer, New York, (1989).<br />
[21] BANIK, I.: One way to explain the MNR, Chalcogenide Letters, Vol.6, No.12, p.629‐633,<br />
(2009).<br />
[22] BANIK, I.: Recombination processes, MNR and non‐exponential decay in disordered<br />
semiconduc‐tors, Journ. of Optoelectr. and Adv. Materials, Vol.13, No.11‐12, 2011, p. 1364‐<br />
1376, (2011).<br />
[23] BANÍK, I.: An explanation of optical phenomena in non‐crystalline semiconductors,<br />
Central European Journal of Physics 3(2), p. 270‐302, (2005).<br />
[24] BANIK, I.: The barrier‐cluster model applied to chalcogenide glasses, Journal of Non‐<br />
Crystalline Solids 353, p.1920‐1924, (2007).<br />
[25] TANAKA, K.: The charged deffect exists? J. Optoelectr. Adv. Mater. 3 (2), p.189‐198, (2001).<br />
[26] POPESCU, M., SAVA, F., LORINCZI, A.: Modelling of large molecular clusters As2S3,<br />
Chalcogenide Letters 1 (9), p.111, (2004).<br />
22
The measurement of thermophysical properties of sandstone by<br />
pulse transient method using model for cuboid form samples<br />
and influence of heat loss effect<br />
Vlastimil Boháč 1 , Peter Dieška 2 , V.Vretenár 1<br />
1 Institute of Physics, Slovak Academy of Sciences, Bratislava, Slovakia<br />
2 Department of Physics, FEI ‐ STU, Ilkovičova 3, Bratislava, Slovakia<br />
Email: bohac@savba.sk<br />
Abstract: The sandstone specimens having different thickness were investigated by pulse transient<br />
method. The problem of effect of heat losses from the sample surface is solved by a model for cuboid shape<br />
of samples. The heat transfer coefficient between the sample surface and free surrounding is accounted<br />
and discussed with regards to the measurement uncertainty. The three dimensional model for cuboid<br />
samples accounts also the final size of specimens. The uncertainty analysis was done to explain relations<br />
with the total time of the transient recording and specimen geometry with respect to final uncertainty of<br />
results.<br />
Keywords: pulse transient method, stone materials, porous rocks, test of model, uncertainty analysis<br />
1. Introduction<br />
The testing of building stones properties is connected with their durability and thus wettability<br />
and deterioration processes invoked by different climate conditions that destroy material in<br />
time. To understand these processes, we have to know and investigate the thermal properties<br />
under different environmental conditions. Testing apparatuses uses typical geometry of the<br />
specimen in cylindrical or cuboid form. The pulse transient method measures all three basic<br />
thermophysical parameters e.g. thermal conductivity, thermal diffusivity and specific heat.<br />
The new model was developed that take into account disturbance of heat loss effect. Model<br />
improvement is realized through heat transfer coefficient in between the sample surface and the<br />
surrounding atmosphere. Next parameter that was introduced is the final geometry of the<br />
cuboid specimen as well as the heat sinks that are stabilized by thermostat at the both ends of<br />
specimen set. If these effects are not accounted they cause inaccuracy of measurement. The<br />
previous ideal models were derived for infinitive large specimen geometry in contrary. New<br />
model was tested on porous stone materials. Uncertainty analysis of the new model pointed out<br />
behavior for different experimental set‐up and thus helps with optimization of the specimen<br />
geometry and revision of methodology for standard measurements. Analysis of the sensitivity<br />
coefficients as well as uncertainty analysis helps to solve and predict most of important<br />
experimental parameters and requirements without conducting measurements.<br />
Recently, methods for investigation of the thermophysical properties, namely the thermal<br />
conductivity, thermal diffusivity and specific heat are going to be promoted as next useful<br />
methods for quality test as these properties are strongly connected with the change of<br />
thermodynamical state of the material structure or atomic structure arrangement, arrangement<br />
of crystalline components and consideration on material defects created in time that are<br />
responsible for further development of structure degradation. Thus, the thermophysical<br />
23
properties can serve as next criteria for distinguishing in between different stone quality or level<br />
of their deterioration and thus quantification of material quality.<br />
The physical models are usually based on infinitively large specimen size. The problems<br />
connected with deficiency in a large amount of testing material cause some problems in data<br />
evaluation according an ideal model. The finite geometry of the specimen cause additional<br />
effects that influence the accuracy of the measured data.<br />
In our case of the pulse transient method it was used a model for square cross section of cuboid<br />
specimens with finite length for the data evaluation. Model was tested for evaluation of<br />
thermophysical parameters of porous stone material.<br />
2. Principle of Pulse transient method<br />
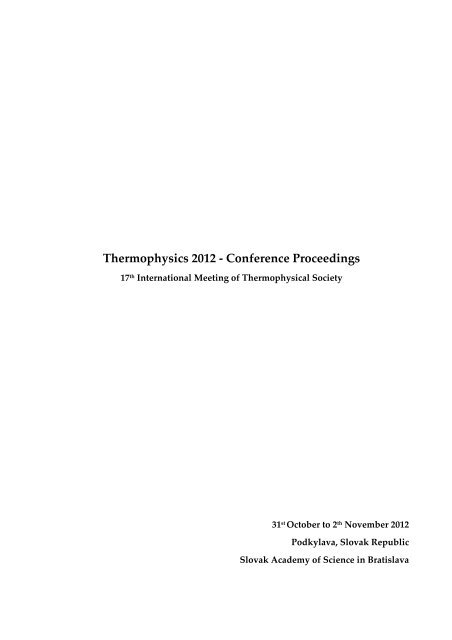
The principle of the Pulse transient method is to record the temperature transient response to<br />
the heat pulse generated by a plane heat source and to calculate the thermophysical parameters<br />
from the characteristic features of the measured curve of the temperature response (Fig. 1.<br />
right).<br />
Figure 1. The principle of the pulse transient method is drawn. Sample parts II+III were drawn in<br />
sections to illustrate the planar isotherms in the middle plain of cutting. Specimen set is drawn with heat<br />
flow paths when drawn deformed isotherms are influence by heat loss effect (left). An example of the<br />
temperature response is on the right.<br />
Transient temperature response measured at the distance h from the heat source is calculated<br />
according temperature function T(x, t‐t0) providing that the model (Eq. 1.) is valid [1]. The ideal<br />
model assumes that the planar heat flow in infinitively large samples is not deformed as it<br />
penetrates into the depth of the specimen bulk (white‐dotted area in the Fig. 1). The problem is<br />
that the temperature isotherms are not planar over the all radial cross section of the specimen<br />
but they are deformed at the surface edges. This effect is caused by the heat losses from the<br />
sample surface in a case of large distances from the heat source, e.g. the thicknesses of material<br />
bigger than the optimal value [2, 3]. In previous experiments just a correction to the ideal model<br />
considering the real pulse width was applied to ideal model [2]. The model is characterized by<br />
temperature function (Eq. 1)<br />
24<br />
current<br />
I<br />
heat source<br />
t 0<br />
I<br />
thermocouple<br />
(heat loss – flow q)<br />
<br />
II+III<br />
region of<br />
planar<br />
isotherms<br />
T<br />
temperature [°C]<br />
1.0<br />
0.5<br />
t m<br />
Tm Tm<br />
0.0<br />
0 50 100<br />
time [sec]<br />
150
2 Q<br />
<br />
T ( h,<br />
t)<br />
<br />
c<br />
<br />
x<br />
2<br />
<br />
h <br />
t i<br />
<br />
2 t<br />
<br />
<br />
<br />
h<br />
t t0<br />
i<br />
<br />
2 <br />
<br />
<br />
<br />
<br />
t t <br />
e<br />
where i<br />
x erfcx.<br />
Here the meanings of used symbols are the following: Q ‐ heat flow<br />
<br />
density at source, c ‐ specific heat, ‐ thermal diffusivity, ‐ density, t ‐ time, t0 ‐ heat pulse<br />
duration, erfc ‐ error function, h ‐ the specimen thickness. Equation 1 should be used for data<br />
evaluation by fitting procedure also.<br />
2.1 One‐point evaluation procedure<br />
We use simple relations for the evaluation of thermal diffusivity, specific heat and thermal<br />
conductivity that were derived for the maximum of temperature response on Fig.1. (One‐point<br />
evaluation procedure). Then, the thermal diffusivity is calculated according to the equation<br />
t f<br />
2<br />
h 2<br />
(2)<br />
and the specific heat<br />
c<br />
<br />
m<br />
c Q f 2ehT<br />
(3)<br />
m<br />
where f and fc are correction factors [1]. Maximum temperature of the transient response found<br />
at time tm is Tm (Fig. 1.) Thermal conductivity is given by data consistency relation<br />
c h Q<br />
f<br />
f 2 2e<br />
t T<br />
(4)<br />
2.1 Model for cuboid shape samples<br />
c<br />
m<br />
m<br />
In a new model developed for cuboid samples that describe the heat loss effect there was added<br />
heat transfer coefficient in between the specimen surface and the surrounding. According Fig.2<br />
there were defined initial and boundary conditions for the basic heat transport equation.<br />
R=0 (contact Resistance)<br />
Specimen<br />
cuboids<br />
, c, λ, ρ<br />
contatct<br />
Heat source –<br />
specimen<br />
T0 T0 T0 T0 x 0 z<br />
-L 1<br />
<br />
<br />
y<br />
q<br />
Figure 2. Model of the measurement – Sample parts I is of L1 thickness and II+III of L2 thickness. The<br />
grooves could be made at different distances between the heat source and thermocouple to investigate<br />
influence of heat loss effect from the sample surface.<br />
The new model assumes heat source placed in between symmetric arrangement of the<br />
specimens in the shape of semi‐infinitive cuboid blocks having squared cross section. Heat<br />
source is of zero heat capacity and is in ideal heat contact with the specimen (thermal contact<br />
resistance is zero). The solution of the heat equation is a temperature function in the form<br />
0<br />
thermocouple<br />
a<br />
L 2<br />
(1)<br />
25
26<br />
F( u , v ) F(<br />
u , v ) <br />
<br />
w b<br />
<br />
nbm<br />
x y<br />
T ( t,<br />
x,<br />
y,<br />
z)<br />
T0<br />
n ( ) m ( )<br />
1 j nm<br />
2 j nm<br />
(5)<br />
2 n1<br />
m1vaaj nm<br />
2<br />
2uv<br />
*<br />
2uv<br />
*<br />
where n ( s) cos( s)<br />
, F ( , ) ( ) ( )<br />
2 n n u v e u v e u v<br />
sin <br />
<br />
n<br />
qa a<br />
T0 , , nm<br />
<br />
n<br />
n m w v <br />
2<br />
, w <br />
t<br />
sin( n<br />
)<br />
, bn<br />
n ( 0)<br />
a<br />
n<br />
z 4Lj<br />
u1 j , u1<br />
j <br />
2 kt<br />
z 4L j 2L1<br />
, L (L1<br />
L2<br />
)/2<br />
2 kt<br />
The meaning of variables:<br />
T temperature field in specimen body, t time, z axial space coordinate, L1 length of the sample<br />
on the left, L2 length of the sample on the right, x,y transversal space coordinates, 2a transversal<br />
size of the sample, q heat flow density at source, thermal conductivity, thermal diffusivity,<br />
heat transfer coefficient for sample ‐ ambient interface, *(u) is the complementary error<br />
function, n are the roots of equation cos sin 0<br />
The relation (5) characterizes the step‐wise measuring regime. After the duration of the heat<br />
pulse t0, the temperature is expressed by the relation<br />
<br />
T t, x,<br />
y,<br />
zTt,<br />
x,<br />
y,<br />
z<br />
Tt<br />
t<br />
o , x,<br />
y,<br />
z<br />
where T t, x,<br />
y,<br />
z<br />
and T tt, x,<br />
y,<br />
z<br />
<br />
the pulse transient regime.<br />
0 are given by the relation (5). The relation (6) characterizes<br />
3. Uncertainty analysis and parameter estimation<br />
The effects of nonrandom, systematic error on result before the experiment is conducted by the<br />
mean of sensitivity analysis are studied. The quantities we measured have biases, and they<br />
certainly have random variation. We need to know how the particular biases are ʺpropagatedʺ<br />
into the uncertainty of the derived quantity (measured parameter). So as the uncertainty<br />
analysis we understand as the propagation of error. The purpose of analysis was to test model<br />
behavior and he’s accuracy before (or after) the experiment. The condition is that involved<br />
measurement of a data has a negligible effect on fitted parameters in model. We are testing<br />
what size of inaccuracy in measurement would cause an acceptable change in the estimates of<br />
measured parameters. If not, we have to take measures and revise method of evaluation for this<br />
experimental measurement as well as set of instruments. If yes, then used measurement<br />
instrument and parameter estimation procedure of data by given model are acceptable. Under<br />
the meaning of uncertainty analysis we understand a derived quantity (free parameters in<br />
model), based on the uncertainties of usually experimentally measured quantities that are used<br />
in form of mathematical relationship (model) to calculate model parameters. Under sensitivity<br />
analysis we estimate the difference, or fractional change, in the derived quantity. The<br />
uncertainty has two components: bias that is related to accuracy and unavoidable random<br />
variation ‐ statistics related to precision.<br />
Generally, uncertainty arises from different sources and includes errors in the data<br />
measurements, parameter estimation procedure and model structures. Uncertainty analysis<br />
calculates how these errors are propagated through the model and evaluate their relative<br />
(6)
importance which is quantified via sensitivity analysis. This type of uncertainty should be<br />
supposed as systematic error. Analysis uses sensitivity data generated by the model, along with<br />
the underlying data covariance to assess the degree of similarity (linear dependence) between<br />
sensitivity coefficients in the model. If the sensitivity coefficients (Figure 3) are linearly<br />
dependent to each other, the parameters should not be estimated unambiguously and thus their<br />
uncertainty is high.<br />
Figure 3. Normalized sensitivity coefficients a f<br />
a<br />
i<br />
i (6) derived from temperature function (5)<br />
where ai denotes free parameter in model, e.g. thermal diffusivity, thermal conductivity and heat transfer<br />
coefficient. Red line missing in figure caption is an example of temperature response calculated for a<br />
specimen thickness 20 mm and pulse duration 24sec.<br />
The analysis was developed in respect with experimental data set N n n T , , where N is the<br />
n t 1<br />
number of independent measurements. Model temperature function (5) T el f t, a,<br />
b<br />
mod <br />
b<br />
represents temperature response in time that depends on constants N<br />
b b j in model that are<br />
j1<br />
determined by different independent measurements and dependent random variables<br />
a<br />
represented by a set of free parameters N<br />
a ai<br />
i1<br />
that are evaluated by fitting procedure. We<br />
N<br />
2<br />
used least square optimization to search for min <br />
<br />
T<br />
n<br />
n f n a,<br />
b<br />
1<br />
, where f n a, b<br />
f t n , a,<br />
b,<br />
<br />
<br />
N<br />
tn are deterministic parameters, b, T nn<br />
1 are independent random variables. The least square<br />
optimization gives a system of non‐linear equations that are based on sensitivity coefficients [4]<br />
(Fig. 3.).<br />
N<br />
<br />
n1<br />
Assuming<br />
Sensitivity Coefficients<br />
=T/x<br />
x<br />
f<br />
n<br />
Tnfn 0,<br />
i 1,<br />
2,<br />
N<br />
a<br />
a<br />
i<br />
2 b j b j bk<br />
bk<br />
~<br />
jku<br />
b j<br />
(7)<br />
a , b <br />
1.0<br />
0.8<br />
0.6<br />
0.4<br />
0.2<br />
0.0<br />
-0.2<br />
-0.4<br />
-0.6<br />
-0.8<br />
-1.0<br />
Tn ~ f n<br />
(8)<br />
2 T T T ~<br />
u T<br />
Tn n m m nm<br />
Thermal diffusivity<br />
Thermal conductivity<br />
Heat transfer coefficient<br />
0 1 2<br />
F=t/(2*h<br />
3 4<br />
2 )<br />
(9)<br />
(6)<br />
27
28<br />
T bb ~<br />
0<br />
T n n k k<br />
(10)<br />
The expressions in brackets represent the statistical mean values. In next, we estimate the<br />
uncertainty<br />
2 2<br />
2<br />
2<br />
a a a a ~ da<br />
u i ~ i i i<br />
i<br />
(11)<br />
Differentiating equation (6) we obtain system of equations<br />
where<br />
N<br />
a<br />
<br />
i1<br />
A<br />
B<br />
ki<br />
kj<br />
A<br />
<br />
ki<br />
da<br />
N<br />
<br />
i<br />
n1<br />
N<br />
<br />
<br />
<br />
N<br />
Nb<br />
f<br />
n<br />
dTn<br />
<br />
n1<br />
ak<br />
j1<br />
<br />
<br />
2<br />
B<br />
kj<br />
f<br />
a<br />
db<br />
n n n<br />
fnTn <br />
<br />
a<br />
a<br />
k<br />
f<br />
i<br />
f<br />
a<br />
b<br />
k<br />
f<br />
a<br />
j<br />
,<br />
f<br />
<br />
ai<br />
<br />
f<br />
<br />
b<br />
<br />
k 1,<br />
2,<br />
N<br />
N<br />
n1<br />
f<br />
a<br />
n n n<br />
fnTn<br />
<br />
<br />
2<br />
n1<br />
k j k j n1<br />
N<br />
n<br />
k<br />
f<br />
a<br />
Now we can estimate uncertainty contribution of any particular measurement of involved<br />
parameters like T or b. Solution of equations (12) has the form<br />
da<br />
u<br />
u<br />
2<br />
2<br />
k<br />
Na<br />
i1<br />
f<br />
n<br />
a<br />
n<br />
k<br />
i<br />
a<br />
f<br />
n<br />
b<br />
j<br />
N<br />
Nb<br />
f<br />
<br />
1<br />
n<br />
A <br />
ki dTn<br />
Bij<br />
db <br />
j , k 1,<br />
2,<br />
N a<br />
(15)<br />
<br />
n 1 a<br />
<br />
i j1<br />
<br />
<br />
<br />
Na<br />
Na<br />
N<br />
b<br />
1<br />
1 2<br />
2<br />
akAki Aki<br />
Ai<br />
iu<br />
TBij Bij<br />
u bj <br />
i1<br />
i1<br />
<br />
Nb<br />
<br />
j1<br />
2 2<br />
2 2<br />
aCu TC u b k<br />
kT<br />
kj<br />
j<br />
where the contributions of components from variables and constants are<br />
and<br />
j1<br />
<br />
<br />
1<br />
C kT Akk<br />
(18)<br />
C<br />
kj<br />
a N<br />
<br />
i1<br />
A<br />
1<br />
ki<br />
B<br />
ij<br />
the elements of matrix A and B are defined with equations (13) and (14). It is seen that A~N, and<br />
B~N, therefore CkT define indices<br />
~<br />
1<br />
and Ckj is N‐independent. For power‐like dependence it is useful to<br />
N<br />
a log b j<br />
kj (20)<br />
log<br />
k<br />
j<br />
Ckj<br />
b a<br />
k<br />
Then for relative uncertainties we can write the equation<br />
(12)<br />
(13)<br />
(14)<br />
(16)<br />
(17)<br />
(19)
u<br />
r<br />
a k<br />
2<br />
C<br />
2<br />
kT<br />
u<br />
2 Nb<br />
T 2<br />
u b a<br />
2<br />
k<br />
<br />
j1<br />
kj<br />
r<br />
j<br />
2<br />
(21)<br />
The normalized sensitivity coefficients were calculated for the same values of thermophysical<br />
parameters like those measured in experimental part and are given in Fig. 3.<br />
The result of this test shows the optimized time of measurement for correct evaluation of the<br />
heat transfer coefficient. The total time of temperature response recording is derived from the<br />
pulse duration what means that at real experiment the total time of recording F=*t/2*h2 )=1.015<br />
that correspond to 180 seconds for 6 second heat pulse and F=0.514 e.g. 90 seconds for 3 second<br />
heat pulse at the specimen thickness of 10 mm. Maximum was found at circa 0.26 F (46 sec.) in<br />
average. The situation in Figure 4, right part show that analyzed uncertainty in % for this<br />
coefficient decreasing with increasing time of measurement as well as with increasing thickness<br />
of the specimen. Still the uncertainty in both cases stay at the uncertainty on 25% level. This<br />
level of uncertainty predicts the optimized thickness as well as total recording time of<br />
temperature response.<br />
Thermal diffusivity Thermal conductivity Heat transfer coeff.<br />
Uncertainty [%]<br />
3.0<br />
2.5<br />
2.0<br />
1.5<br />
1.0<br />
0.5<br />
0.0<br />
0.0 0.5 1.0 1.5 2.0 2.5<br />
Figure 4. Analysis of uncertainty for sandstone using the same parameters for calculation. For the<br />
calculation the fixed number of points, variable time step, fixed time window with beginning at t=0 was<br />
used. Variable time interval for a specimen thickness 10 and 20 mm and different pulse duration 2, 3, 6<br />
and 6, 12, 24 sec were used respectively.<br />
4. Experiment<br />
20mm<br />
3.0<br />
2.5<br />
2.0<br />
1.5<br />
1.0<br />
0.5<br />
0.0<br />
20mm<br />
0.0 0.5 1.0 1.5 2.0 2.5<br />
F=*t/(2*h 2 )<br />
0.0 0.5 1.0 1.5 2.0 2.5<br />
The experimental details were described in [1]. Thermophysical parameters were evaluated by<br />
one‐point evaluation procedure (Eq. 2 and 3.) derived from ideal model. In the past the use of<br />
300<br />
250<br />
200<br />
150<br />
100<br />
50<br />
0<br />
20mm<br />
Pulse width for<br />
Thickness 10mm<br />
Pulse width<br />
2sec<br />
3sec<br />
6sec<br />
Thickness 20mm<br />
6sec<br />
12sec<br />
24sec<br />
T(t)<br />
29
the ideal model and the one‐point evaluation procedure led to a problem with the heat loss<br />
disturbance effects shown in Fig. 1 for an illustration. This effect was described and finally<br />
avoided by optimization of specimen geometry [2, 3].<br />
The sandstone specimen set was in a form of cuboids having finite length. The dimensions of<br />
parts I in Fig.1 were 50x50x25 and two parts 50x50x10.125mm. The volume density of used<br />
sample was 1738.7 kg m ‐3 and porosity measured by weighting dry and water saturated<br />
specimen was 27.5%. Heat source meander was etched of Ni foil and insulated by kapton foil.<br />
Its dimensions were 50x50mm. Measurements were performed in RTB 1.02 measurement<br />
chamber [5]. The heat pulse parameters e.g. the current and pulse duration were optimized to<br />
get temperature response of about 1°C. The heat source resistance was about 2 ohms. Before the<br />
measurements the specimens of sandstone were dried in oven at 70°C till no changes in weight.<br />
3. Results<br />
The temperature dependency of measured data measured under the air and vacuum conditions<br />
is drawn at Figure 5. The model for cuboid samples (Eq.5. and 6) fits next free parameters:<br />
thermal diffusivity, thermal conductivity and heat transfer coefficient.<br />
Parameters calculated by one‐point evaluation procedure that do not account heat losses from<br />
the sample surface are shifted from data evaluated by new model. The heat transfer coefficient<br />
that is dependent on temperature is plotted on Figure 6. The result of the uncertainty analysis<br />
given in Figure 4 explains the large scattering of data plotted on Figure 6. The data scattering is<br />
explained by results of uncertainty analysis that show the unambiguity to evaluate this<br />
parameter correctly for measurements performed on lower thicknesses of material as well as for<br />
shorter time of transient recording. This means that the heat losses effect start to influence<br />
measurement after reasonably long time of measurement. Just results calculated from<br />
measurements when 6 second pulses were used have a physible meaning values. The next<br />
parameter introduced to the model should confirm that more sensitive measurement and thus<br />
better accuracy for heat transfer coefficient evaluation is more reliable for bigger thicknesses<br />
than those one used in our experiment (10.125 mm).<br />
The data from one‐point evaluation procedure are drawn in temperature dependency in figure<br />
5. In this graph there were added values of data evaluated by fitting procedure by new model<br />
for cuboid samples shown as squares. These data were obtained at different temperatures as<br />
well at different atmospheres. All measurements were performed in isothermal regime. In<br />
figure 5 there is evident influence of vacuum when heat loss effect is suppressed and thus the<br />
data are of lower values. Mathematically the maximum of the temperature responses is<br />
increased as the heat loss is decreasing it.<br />
The heat transfer coefficient calculated for the data for lower times were not able to estimate<br />
unambiguously and has physible values in between 2 to 10 W m ‐2 K ‐1 just thickness 10 mm. At<br />
figure 6 just the data in scale are given. Besides them there were data out of this scale as the<br />
unambiguity of evaluation according analysis given in Figure 4 for this thickness and time of<br />
recording is more that 200%. It means that just data within 25% of accuracy are given in this<br />
plot.<br />
30
Thermal diffusivity<br />
*10 -6 [m 2 /sec]<br />
Specific heat<br />
[J kg -1 K -1 ]<br />
Thermal conductivity<br />
[W mK -1 ]<br />
1.4<br />
1.2<br />
1.0<br />
0.8<br />
0.6<br />
960<br />
920<br />
880<br />
840<br />
800<br />
2.25<br />
2.00<br />
1.75<br />
1.50<br />
1.25<br />
1.00<br />
Cuboid Model - 2.5, 3.0, 4.5, 6 sec HeatPulse<br />
Air<br />
Vac.<br />
Heating in vacuum<br />
OnePoint Air<br />
OnePoint Vac<br />
Cuboid Model Air<br />
Cuboid Model Vac<br />
Figure 5. Thermal dependency of thermal diffusivity, specific heat and thermal conductivity plotted for<br />
different atmosphere. Data evaluated by one‐point procedure show small shift from data evaluated by new<br />
model and the difference is within 1‐5% depending on parameter.<br />
Figure 6. Temperature dependency of thermal diffusivity, specific heat and thermal conductivity with<br />
marked temperature and vacuum history evaluated by one‐point procedure and by fitting with cuboid<br />
model. Numbers at for one point evaluated data denotes sample thicknesses.<br />
Vac.<br />
Heating<br />
Aerated<br />
Cooling<br />
after evacuation<br />
and aeration<br />
-20 0 20<br />
Temperature [°C]<br />
40 60<br />
Heat transfer coefficient [W m -2 K -1 ]<br />
6<br />
5<br />
4<br />
3<br />
2<br />
1<br />
0<br />
Pulse width 2.5, 3, 3.5, 4.5 sec.<br />
Air<br />
Vacuum<br />
Pulse width 6 sec.<br />
Air<br />
Vacuum<br />
-20 0 20 40 60 80<br />
Temperature [°C]<br />
Air<br />
Vac.<br />
Sandstone - Locality Pavčická brána, Density 1738.71997 [Kg m -3 ]<br />
31
Conclusions<br />
The thermophysical properties of sandstone were investigated by pulse transient method for<br />
dry state of sandstone. The data were evaluated by two methods – the one point evaluation<br />
procedure and by fitting procedure using a new model for cuboid samples that accounts heat<br />
losses from the sample surface.<br />
The measurements were done in the temperature range from ‐15 up to 60°C. The slope of<br />
temperature dependence of transport parameters is positive, while the slope for specific heat is<br />
negative. The heat transfer coefficient from the sample surface to the surrounding is<br />
temperature dependent and its value is greater for higher temperatures.<br />
Results from new model show that it is able to fix the problem with heat loss effect from the<br />
sample surface. The problem only is that the sensitivity coefficient for this parameter is<br />
increasing in time of measurement, so for samples with bigger thicknesses we use longer pulse<br />
duration and thus longer time for recording of temperature response. The longer measurements<br />
result in better accuracy for this parameter evaluation.<br />
Acknowledgments<br />
This work was supported by the Slovak Research and Development Agency under the contract No.<br />
APVV‐0641‐10, Study of rocks properties and investigation of structural and textural characteristic in<br />
correlation with thermophysical and physico‐mechanical properties and and by the Scientific Grant<br />
Agency of Ministry of Slovak Republic and Slovak Academy of Sciences, projects VEGA 2/0182/12,<br />
Development and testing of physical models for the pulse transient method.<br />
References<br />
[1] Kubičár Ľ., 1990, Pulse Method of Measuring Basic Thermophysical Parameters in<br />
Comprehensive Analytical Chemistry Vol. XII Thermal Analysis Part E Ed Svehla G,<br />
Amsterdam, Oxford, New York, Tokyo: Elsevier, pp 350.<br />
[2] BOHÁČ V. et all. Methodology of parameter estimation of pulse transient method. Proc.<br />
TEMPMEKO 2004, 22 ‐ 25 June 2004 Dubrovník, Croatia<br />
[3] BOHÁČ V., Dieška P., Kubičár Ľ. MEASUREMENT SCIENCE REVIEW, Volume 7, Section<br />
3, No. 2, 2007<br />
[4] Beck, J.V.;Arnold, Kenneth J., Parameter Estimation in Engineering and Science, ISBN:<br />
9780471061182, Better World Books (Mishawaka, IN, U.S.A.) John Wiley & Sons, 1977<br />
[5] Institute of Physics, SAS, Dúbravská cesta 9, Slovakia, http://thermophys.savba.sk<br />
32
Influences of temperature change and moisture content on the<br />
thermal conductivity of rocks<br />
Patrícia Ekkertová 1 , Ivana Šimková 1 , Martin Brček 1 ,<br />
Tatiana Durmeková 1 , Vlastimil Boháč 2<br />
1 Department of Engineering Geology, Faculty of Natural Sciences, Comenius<br />
University in Bratislava, Mlynská dolina, 842 15, Slovakia e mail:<br />
ekkertova@fns.uniba.sk, simkova@fns.uniba.sk, brcek@fns.uniba,sk,<br />
durmekova@fns.uniba.sk<br />
2 Institute of Physics SAS, Dúbravska cesta 9, 845 11 Bratislava, Slovakia, e‐mail:<br />
vlastimil.bohac@savba.sk<br />
Abstract: Study of temperature change in connect with thermal properties change of dry and saturated<br />
rocks in laboratory conditions is closely related to the understanding of physical weathering processes.<br />
Estimation of water role in pores of rocks in the weathering process especially under the freezing –<br />
thawing conditions is important for general knowledge of their durability in a case of use as construction<br />
material. There were selected highly porous rocks for the study of the influence of different moisture<br />
regimes, namely the sandstone from Králiky quarry, travertine from Spiš Castle rock mass and tuff from<br />
Brhlovce rock dwellings. The influences of moisture regime on rocks properties for two extreme borderline<br />
conditions, i.e., dry and fully water saturated state were observed in the temperature range from ‐20 °C to<br />
+22 °C. The measurements of the thermal conductivity were made by means of hot‐ball method when the<br />
sensors were placed in the middle of rock samples. Measurements were performed in a climatic chamber.<br />
The thermal conductivity values were correlated to the water content in the studied rocks.<br />
Keywords: moisture regime, freeze and thaw cycle, thermal conductivity, porous rocks.<br />
1. Introduction<br />
Humidity measurement is often used to investigate moisture conditions of building tiles. Most<br />
measurements are carried out in different spots in order to determine the change of moisture<br />
profile, respectively in order to determine the extent and source of moisture. Humidity sensors<br />
are used in such cases, especially for early detection of excessive moisture conditions in the<br />
building envelope, especially in hidden or hard to reach areas, which have resulted in the<br />
reduction of the lifetime of the envelope.<br />
One of the most popular and the most common tiling material is natural stone. Natural stone or<br />
rock belongs to a porous material whose pores can be filled with liquid or gas. This paper<br />
describes a method for the continuous measurement of moisture in three lithologically different<br />
types of natural stone ‐ travertine, sandstone and tuff. Measurements were made using ʺHot‐<br />
ballʺ thermal conductivity sensors, which were fixed to the inside of the rock samples. The<br />
principle of Hot‐ball sensor is based on Hot‐ball method of measuring the thermal conductivity<br />
(λ, Wm ‐1 .K ‐1 ). The moisture content of porous samples is investigated using Hot‐ball method,<br />
where the measured values of thermal conductivity increase with increasing of water content in<br />
pores [1].<br />
33
The focus of the paper is to determine the parameter of thermal conductivity of dry and fully<br />
water‐saturated rocks in the temperature range ‐20 up to +22 °C in order to optimize the<br />
methodology for determining the moisture range, which is essential for the correct<br />
interpretation of the relative humidity in the rock [2].<br />
2. Principle of the experimental method<br />
To investigate the heat transport in various materials there were developed several<br />
experimental methods for investigation of thermophysical properties of materials. Generally<br />
these methods can be divided into two groups: stationary methods [3] and transient ones [4, 5 ,<br />
6]. The first group requires longer measurement times and thus the redistribution of fluids in<br />
porous structure is possible. This is the reason why the information obtained is far from the<br />
equilibrium state in the mean of thermodynamic as well as moisture distribution. Transient<br />
methods require considerably shorter measurement time at initially zero temperature gradient,<br />
so the corresponding information is much more close to the equilibrium thermodynamic state<br />
and close to real conditions.<br />
The principle of transient methods for measuring thermophysical properties of materials is<br />
based on the generation of a small amount of heat disturbance inside the studied sample and<br />
measuring the temperature response on this disturbance. The sample surface effect during the<br />
measurement period is suppressed, because the heat generated inside the samples during the<br />
period of measurement will not penetrate to the surface. This could be another advantage of the<br />
method.<br />
In this paper it was used method based on the transient hot‐ball method (see Figure 1). Briefly,<br />
the measurement can be described as follows: first, the sample temperature is stabilized, and<br />
then thermal balance is disturbed by applying a heat pulse in a form of step‐wise function that<br />
generates heat flow.<br />
34<br />
Specimen<br />
rr bb<br />
Heat source<br />
Figure 1: RTM instrument (data logger) in connection with the hot ball arranged as moisture probe (left),<br />
model of the hot ball (middle) and real size picture (right) [Chyba! Záložka není definována.].<br />
Model of the hot ball method assumes a constant heat flux q from the empty sphere of radius rb<br />
into the infinitive medium that starts to be delivered for times t > 0 (Figure 1) [7]. Then the<br />
temperature distribution within the medium is characterized by [8]:<br />
q<br />
T ( rb<br />
, t)<br />
<br />
4r<br />
2<br />
b<br />
<br />
<br />
<br />
<br />
at<br />
<br />
<br />
1<br />
e<br />
<br />
<br />
r<br />
2<br />
b<br />
at<br />
<br />
<br />
rb<br />
<br />
rb<br />
erfc<br />
<br />
<br />
<br />
<br />
<br />
<br />
at <br />
(1)
x<br />
2<br />
2<br />
where erfc(x) is the error function defined by erfc x)<br />
exp<br />
<br />
( d<br />
and λ is thermal<br />
0<br />
conductivity and a is thermal diffusivity of the surrounding medium, respectively. The<br />
long time approximation solution of function (1) was derived as the working relation of<br />
the measuring method:<br />
q<br />
<br />
(2)<br />
4 r T ( t )<br />
b<br />
m<br />
where Tm is stabilized value of the temperature response reached in the long time limit at<br />
the surface of the empty sphere of hot ball having the radius rb. During stabilization<br />
time the heat produced by the ball penetrates in a material volume. The temperature<br />
response to the heat is recorded. Penetration depth is a sphere of diameter around 20<br />
mm for stabilized temperature considering diameter of the sensor. Typical<br />
measurement signal is shown in Figure 2 along with the characteristic points used to<br />
calculate the value of thermal conductivity. The measuring procedure consists of the<br />
measurement of initially stabilized temperature (base line), switching on the heating<br />
pulse and simultaneously scanning the temperature response. When the ball<br />
temperature is stabilized, the heating is interrupted and a period of the temperature<br />
equilibration follows. When the temperature in the sample is equilibrated the next<br />
measurement may be realized [9].<br />
Temperature °C<br />
24<br />
23,8<br />
23,6<br />
23,4<br />
23,2<br />
23<br />
22,8<br />
22,6<br />
Sandstone<br />
22,4<br />
0 50 100 150 200 250<br />
Number of point<br />
Temperature<br />
-7<br />
-7,5<br />
-8<br />
-8,5<br />
-9<br />
-9,5<br />
Tuff<br />
-10<br />
0 50 100 150 200 250<br />
Number of point<br />
Travertine<br />
9,2<br />
9<br />
8,8<br />
8,6<br />
8,4<br />
8,2<br />
8<br />
7,8<br />
7,6<br />
7,4<br />
0 20 40 60 80 100 120<br />
Number of point<br />
Figure 2: Measuring cycle of sandstone (left), tuff (middle) and travertine (right).<br />
Porous materials – rocks situated in natural conditions are exposed to the sun radiation,<br />
precipitation, evaporation, freezing and thawing phenomena. The mentioned processes<br />
are caused by the water phases found in pores (gas, liquid, solid). Then the resulting<br />
thermal conductivity of a porous material is a function of the content of pores.<br />
3 Test samples, properties of studied rocks<br />
For the studied materials there were selected sandstone from Králiky quarry, travertine<br />
from Spiš Castle rock mass and tuff from Brhlovce rock dwellings. The reason for the<br />
choice of the lithological rock types was the existence or the preparation of monitoring<br />
procedure on the temperature ‐ moisture regime, and related laboratory research as<br />
well.<br />
Temperature °C<br />
35
Travertines from Spiš Castle rock mass consist of complete calcite grains that are of<br />
highly differentiated form. Travertine is fine‐grained, mainly off‐white colour,<br />
sometimes with pleasant yellow shadows. The presence of macropores and voids is<br />
significant for this lithological type. Cavities and pores are usually irregular in shape,<br />
varying in size and tend to be located in the strips. Physical properties of rocks are the<br />
following: specific gravity – 2.667 g.cm ‐3 , bulk density – 2.527 g.cm ‐3 , porosity – 5.27%,<br />
water absorption – 0.8% and uniaxial compression strength – 82.5 MPa.<br />
Sandstones from the site Králiky are composed of fine‐grained clastic material.<br />
Fragments or clasts are mainly of carbonate rocks and quartz. Sandstone cement is<br />
mostly calcite, calcite‐quartz, incidentally or accessories of clay. Sandstone is normally<br />
used as a decorative stone, the rest as aggregates for construction purposes. Their bases<br />
physical properties are: specific gravity – 2.755 g.cm ‐3 , bulk density – 2.343 g.cm ‐3 ,<br />
porosity – 14.95%, water absorption – 3.82%, uniaxial compression strength – 28.5 MPa.<br />
Volcanoclastic tuffs from Brhlovce belong to complex of andesite neovolcanism. In<br />
terms of descriptive characteristics of the material the colour is light grey, grain size is<br />
ranging from 0.063 to 2.0 mm, and has the porous structure with cryptopcrystallic<br />
matrix. Physical properties of tuff from Brhlovce are as follows: specific gravity – 2.569<br />
g.cm ‐3 , bulk density – 1.500 g.cm ‐3 , porosity – 31.8%, water absorption – 16.42% and<br />
uniaxial compression strength – 17.13 MPa.<br />
5. Experimental results and discussion<br />
The research was focused on the study of moisture regime of three lithologically types<br />
with hot ball sensor. Humidity probes (rock bodies with hot ball probe sensor) were<br />
exposed to temperatures from ‐20 °C up to +22 °C to in the climate chamber KD‐20‐T4.1.<br />
Measurements of temperature changes were performed every hour inside rock bodies.<br />
Temperature in the climate chamber was changed in steps already for 5 °C and always<br />
lasts for 8 hours. An experiment was conducted on cylindrical test samples of length 32<br />
mm and diameter 20 mm with built‐in hot‐ball sensor. Overall, the samples were<br />
exposed to two freezing cycles. The first cycle was carried out on moisture probes dried<br />
at 105 °C till the constant weight. Constant weight was below maintenance of using<br />
silica gel in reclosable bags. The second cycle was on water‐saturated condition with<br />
using Parafilm. Drying process and the saturation of the samples by water was carried<br />
out according to the applicable technical standard EN 13755 [10]. Subsequently, the<br />
experimental results were statistically processed. Results of the experiment are shown<br />
in Figures 3 – 5 and Table 1. The figures present the thermal conductivity changes of<br />
studied materials in dry and wet conditions during freezing cycle. Measured mean<br />
values of thermal conductivity of rocks of all tested samples in the given temperature<br />
range were of linear dependency on temperature. For statistical evaluation, it was<br />
found that the smallest variation coefficient of thermal conductivity were around 20 °C<br />
for all studied rocks. A slight fluctuation in values of thermal conductivity was<br />
probably caused by using a climatic chamber KD‐20‐T4.1, which was able to maintain a<br />
homogeneous temperature of the air in the test area with an accuracy of only 1 °C.<br />
36
Table 1 Thermal conductivity in the temperature range +22 °C to ‐20 °C in dry and water saturated<br />
conditions. Values in blue and orange rectangles mean measured values; values in white rectangles are<br />
calculated values from trend line and values in green rectangles mean average values.<br />
+/‐ Temperature (°C) 22 20 19 17 15 11 10 9 8 7 6 5 4 3 1<br />
Sandstone<br />
Tuff<br />
Travertine<br />
dry cooling<br />
9.1 9.0 8.8 8.8 8.6 8.4 8.5 8.3 8.2 8.1 8.1 8.0 7.9 7.9 7.8<br />
heating<br />
water<br />
saturated 10.4 10.2 10.1 10.0 9.8 9.5 9.4 9.3 9.3 9.2 9.0 9.0 8.9 8.9 8.8<br />
diference λ 1.10<br />
dry<br />
water<br />
saturated<br />
diference λ<br />
6.0<br />
6.9<br />
6.4<br />
7.1<br />
6.5<br />
7.1<br />
6.7<br />
7.3<br />
6.7<br />
7.5<br />
7.0<br />
7.8<br />
7.1 7.1<br />
7.8 7.9<br />
0.80<br />
7.2<br />
8.0<br />
7.4<br />
8.1<br />
7.3<br />
8.2<br />
7.4 7.4 7.5<br />
8.2 8.3 8.4<br />
7.6<br />
8.6<br />
cooling heating cooling<br />
dry<br />
water<br />
saturated<br />
6.0<br />
7.1<br />
5.9<br />
7.0<br />
5.8<br />
7.0<br />
5.7<br />
6.9<br />
5.6<br />
6.8<br />
5.4<br />
6.6<br />
5.3<br />
6.5<br />
5.2<br />
6.4<br />
5.2<br />
6.4<br />
5.1<br />
6.3<br />
5.1<br />
6.3<br />
5.0 4.9 4.9<br />
6.2 6.2 6.1<br />
4.9<br />
6.1<br />
diference λ 1.2<br />
dry<br />
water<br />
saturated<br />
diference λ<br />
3.4<br />
4.8<br />
3.5<br />
4.9<br />
3.6<br />
5.0<br />
3.5<br />
5.1<br />
3.8<br />
5.2<br />
4.0<br />
5.4<br />
4.2 4.2<br />
5.4 5.6<br />
1.34<br />
4.2<br />
5.5<br />
4.2<br />
5.6<br />
4.3<br />
5.6<br />
4.4 4.5 4.5<br />
5.7 5.6 5.8<br />
4.6<br />
5.9<br />
dry<br />
water<br />
saturated<br />
diference λ<br />
5.7<br />
6.7<br />
5.7<br />
6.9<br />
5.5<br />
6.6<br />
5.6<br />
6.5<br />
5.5<br />
6.4<br />
5.4<br />
6.0<br />
5.3<br />
6.2<br />
5.3<br />
6.1<br />
0.9<br />
5.2<br />
6.1<br />
5.2<br />
6.0<br />
5.2<br />
5.9<br />
5.2 5.1 5.1<br />
5.9 5.9 5.9<br />
5.0<br />
5.8<br />
dry heating<br />
4.1 4.3 4.3 4.4 4.5 4.6 4.6 4.7 4.7 4.8 4.8 4.8 4.8 4.9 4.9<br />
water<br />
saturated 4.7 4.9 4.8 4.9 5.0 5.2 5.2 5.3 5.2 5.4 5.4 5.5 5.5 5.6 5.7<br />
diference λ 0.61<br />
The test showed that the values of thermal conductivity λ in the case of water saturated<br />
probes are much higher than dried moisture probes (see Figures 3 ‐ 5). The biggest<br />
difference in the value of the thermal conductivity between dry and reached watersaturated<br />
state of tuff (see Table 1), also proves its high water absorption.<br />
37
38<br />
Figure 3: Course of the change of thermal conductivity with temperature change in the sample of<br />
sandstone in dry and water saturated conditions.<br />
Based on the linear trend line equations (see Figures 3 ‐ 5) there were expressed mean<br />
values of thermal conductivity for different temperatures in the range studied.<br />
According to the difference of thermal conductivity in dry and water saturated<br />
conditions at different temperatures it was confirmed the relationship between water<br />
absorption and increase of thermal conductivity (Table 1).<br />
Figure 4: Course of the change of thermal conductivity with temperature change in the sample of tuff in<br />
dry and water saturated conditions.
Figure 5: Course of the change of thermal conductivity with temperature change in the sample of<br />
travertine in dry and saturated conditions.<br />
5. Conclusion<br />
Paper presents data on temperature, q/Tm parameter corresponding to change of<br />
moisture in humidity probes in climatic chamber. For all of specimens depending on<br />
surrounding humidity variation in q/Tm parameter, it was found the corresponding<br />
dependency on temperature variations. Based on observed physical properties such as<br />
porosity, water absorption and thermal conductivity of studied materials; it can be<br />
assumed relationship between water absorption and increasing of thermal conductivity.<br />
The experiment was carried out for the needs of correlations between laboratory and<br />
field research. This experiment will be helpful in monitoring the moisture in field<br />
research, because values of thermal conductivity are defined in extreme dry and wet<br />
conditions. The temperature dependence of thermal conductivity is negative and linear.<br />
Thus we can easily determine the actual moisture in rock massive.<br />
Acknowledgements<br />
This work was supported by the Slovak Research and Development Agency under the contract<br />
No. APVV‐0641‐10 Study of rocks properties and investigation of structural and textural characteristic<br />
in correlation with thermophysical and physico‐mechanical properties.<br />
39
References<br />
[1] KUBIČÁR, Ľ. VRETENÁR, V. ŠTOFANIK, V. BOHÁČ, V.: Hot‐Ball Method for<br />
Measuring Thermal Conductivity, International Journal of <strong>Thermophysics</strong>, 31, 10 2010, p.<br />
1904‐1918<br />
[2] BRČEK, M. VLČKO, J. KUBIČÁR, Ľ. BOHÁČ, V. ADAMCOVÁ, R.: Vlhkosť –<br />
negatívny faktor deteriorácie horninového masívu. Acta Geologica Slovaca, 1, 1, 2009, p.1‐8<br />
[3] MAGLIĆ, K.D. CEZAIRLIYAN, A. PELETSKY, V.E. (EDS.): Compendium of<br />
thermophysical property measurement methods. Volume 2: Recommended measurement techniques<br />
and practices, Plenum Presss, New York, 1992, p. 643<br />
[4] KUBIČÁR, Ľ. BOHÁČ, V.: Review of several dynamic methods of measuring<br />
thermophysical parameters. In: Gaal, P.S. ‐ Apostolescu, D.E. (eds.): Proc. 24th Int. Thermal<br />
Cond./12 Int. Thermal Expansion Symp., Technomic Pub. Co., Pittsburgh, Pennsylvania,<br />
1999, p. 135‐149<br />
[5] HAMMERSCHMIDT, U. MEIER, V. Model, R.: New transient hot bridge sensor to<br />
measure the thermal conductivity. Therm. Conduct. 28, 2006, 278‐287.<br />
[6] KREMPASKÝ J.: The measurements of the thermophysical Properties, SAV, Bratislava,<br />
1969<br />
[7] KUBIČÁR, L. VRETENÁR, V. BOHÁČ, V. TIANO, P.: Thermophysical analysis of<br />
sandstone by pulse transient method. Int. J. <strong>Thermophysics</strong> 27 (1), 2006, p. 220‐234<br />
[8] CARSLAW, H.S. JAEGER, J.C.: Conduction of heat in solids, Oxford, Clarendon Press, p.<br />
348.<br />
[9] KUBIČÁR, Ľ. ŠTOFANIK, V. BOHÁČ, V. BRČEK, M. VLČKO, J.: Monitoring<br />
System of the Temperature‐Moisture Regime Placed at Spis Castle. In: Milan Tyšler Ján<br />
Maňka Viktor Witkovský (eds.): Measurement 2009, 7th International <strong>Conference</strong> on<br />
Measurement, May 20 ‐ 23, 2009, Smolenice Castle, Slovakia<br />
[10] EN 13755: 2008. Natural stone test methods. Determination of water absorption at<br />
atmospheric pressure<br />
40
Determination of moisture diffusivity in sandstones using<br />
diffusion model<br />
Danica Fidríková 1 , Ľudovít Kubičár 1 , Peter Dieška 2<br />
1 Institute of Physics, Slovak Academy of Sciences, Slovak republic<br />
2 Slovak university of technology, Faculty of electrical engineering and information technology,<br />
Slovak republic<br />
Abstract: Cultural and historical monuments are mostly constructed of porous materials. In porous<br />
structures plays moisture a dominant role in their deterioration. This contribution is focused on moisture<br />
determination by moisture diffusivity in these materials. Measurements were carried out by thermal<br />
conductivity sensors (Hot‐ball sensor) located in different positions along path of water movement.<br />
Principle of Hot‐ball sensor (thermal conductivity sensor) is based on Hot‐ball method for measuring<br />
thermal conductivity. We use fitting procedure for further details of the moisture curves in the sample.<br />
Fitting model is considered planar moisture source on one side the sample, while this source is ideal and it<br />
have „Newtonianʺ contact between moisture sink and sample. This model is based on a simple diffusion<br />
equation. Results from experimental data for moisture diffusivities in various samples are presented.<br />
Keywords: water transport, moisture diffusivity, diffusion equation, physical diffusion model<br />
Introduction<br />
The transport of moisture in porous building materials is basic for the estimation of long term<br />
performance of buildings [1]. Moisture accumulation within the material of a building envelop<br />
can lead to poor thermal performance of the envelope, degradation of organic materials, metal<br />
corrosion and structure deterioration [2]. To calculate thermal and moisture conditions in<br />
porous materials, it is necessary to know transport characteristics of moisture, which govern<br />
moisture transfer processes in such materials. That is why experimental studies of moisture<br />
transfer in porous materials aimed at determination of moisture characteristics of such materials<br />
attract much attention [3].<br />
Experimental studies are focused on determining the moisture content in the certain area of<br />
material around Hot‐ball probes and to determine the parameter characterizing increase of<br />
moisture in material ‐ moisture diffusivity. At the present are disposable mathematical models,<br />
which include initial condition and boundary conditions that describe the conditions of the<br />
experiment. To determine the characteristics of moisture transfer is necessary to know moisture<br />
density depending up time. Measurement of thermophysical properties consists in the<br />
evaluation of thermal conductivity by Hot‐ball method. In the present study, moisture transfer<br />
processes were examined using the Hot‐ball method, which allows measurement of moisture<br />
concentration in a certain area by Hot‐ball sensors.<br />
Experimental method<br />
The optimal functionality of the moisture sensor depends on an appropriate method for<br />
measuring the thermal conductivity of a body constructed of porous materials. We use the Hot‐<br />
41
Ball Method for measuring thermophysical properties. The method makes use of a small ball<br />
that generates a transient temperature field in its vicinity and simultaneously measures the<br />
temperature. The ball’s temperature is a measure of the thermal conductivity of the<br />
surrounding material.<br />
A typical measurement is shown in Figure 1 along with the characteristic points used for the<br />
calculation of the thermal conductivity. The measuring procedure consists of measuring the<br />
temperature of the specimen which represents the base line, switching on the heating and<br />
simultaneously scanning the ball’s temperature. When the ball’s temperature stabilizes, the<br />
heating is interrupted, and a period of temperature equilibration follows. When the<br />
temperature of the specimen is stabilized to the value prior to the heat generation, the next<br />
measurement may be realized. The repeatability rate of the measurements depends on the<br />
thermal conductivity, and it takes from 5 up to several hundred minutes. The measurement<br />
alone takes from 50 up to 400 seconds, depending on the thermal conductivity of the material<br />
investigated. For rocks it ranges from 80 up to 150 seconds.<br />
42<br />
. Temperature [˚C]<br />
Temperature [ o C]<br />
22.0<br />
21.8<br />
21.6<br />
21.4<br />
21.2<br />
21.0<br />
temperature response<br />
output power<br />
base line<br />
T m<br />
20.8<br />
-20 0 20 40 60 80 100 120 140<br />
Time [s]<br />
Fig. 1 The temperature response for the constant production of heat<br />
The sensor is made of two components: a thermometer and a resistance (patented) (Fig. 2, left).<br />
These components are glued together with epoxy. After the epoxy is cured, the sensor is ready<br />
to be calibrated. The diameter of the finished sensor is in a range of 2 to 2.3 mm (Fig. 2, right).<br />
Fig. 2 A sketch of the glued together components (left); the completed sensor compared with a match<br />
(right)<br />
The working equation of the hot‐ball sensor is based on an ideal model, which assumes a<br />
constant heat flux q per surface unit from the empty sphere of radius rb into the infinite<br />
medium for times t > 0. Then the temperature distribution within the medium is characterized<br />
by the function [4]:<br />
2 *<br />
1exp( u ) ( u)<br />
<br />
T ( t,<br />
rb<br />
) T <br />
0<br />
16<br />
14<br />
12<br />
10<br />
8<br />
6<br />
4<br />
2<br />
0<br />
Output power [mW]<br />
(1)
q<br />
where T0<br />
4rb<br />
<br />
,<br />
u <br />
at<br />
rb<br />
λ is thermal conductivity [Wm ‐1K ‐1 ], and a is thermal diffusivity [m2s‐1]. Θ*(u) is the standard<br />
complementary error function. Function (2) can be derived from the partial differential equation<br />
governing heat conduction, considering the initial condition T ( 0,<br />
r)<br />
0 and the boundary<br />
T<br />
condition ql(<br />
t)<br />
. For time tending to infinity, t , equation (2) is reduced to its<br />
r<br />
rr<br />
0<br />
steady‐state form:<br />
q<br />
Tm <br />
4π r <br />
0<br />
By rearranging the latter equation one obtains the working equation of the hot‐ball sensor [3]:<br />
q<br />
<br />
4π<br />
r T<br />
0<br />
m<br />
Two evaluation strategies can be applied for the signal shown in Figure 2, namely, the fitting of<br />
function (2) over the temperature response measured in the experiment or the use of working<br />
equation (4) for long measuring times. The fitting procedure requires the determination of the<br />
time window over the temperature response where on the one hand, enough high sensitivity<br />
coefficients should exist, considering the thermophysical parameters calculated. On the other<br />
hand, the construction parameters of the sensor should not influence the temperature response.<br />
The construction parameters mainly influence the temperature response in the initial time<br />
period. Working equation (4) requires a good stabilized temperature response, which<br />
sometimes cannot be reached in real time for low thermal conductivity materials.<br />
Both strategies require knowledge of the radius of the sensor rb, which has a high degree of<br />
uncertainty due to its construction. Therefore, calibration has to be used to obtain parameter rb<br />
with the help of a fitting (equation (2)) or the use of a working equation (4). The calibration has<br />
to be performed with the help of standard fluids such as distilled water and glycerol to avoid<br />
any thermal contact resistance between the sensor and the medium.<br />
Experiment and results<br />
Sandstones were used for the experiment of saturation of water. Hot‐ball sensors (thermal<br />
conductivity sensors) in certain positions on the sample were fixed along the saturation path.<br />
The Sandstein sandstone was with total porosity of 21% and Sander sandstone with 17.8%. The<br />
samples were dried under a vacuum and moisturized to a water saturated state in order to<br />
calculate their moisture content. The same initial states for all the samples were established. The<br />
specimen was fixed in a specimen holder in a vertical position and inserted into a climatic<br />
device. A temperature of 25 °C and an ambient humidity of 30% were maintained during the<br />
experiment.<br />
A one‐dimensional transport process under isothermal climatic conditions was realized from<br />
the bottom to the top of the sample. A special mechanism was used to keep a constant water<br />
level of about 2 mm on the bottom of the sample. While the bottom specimen’s surface is in<br />
(2)<br />
(3)<br />
43
contact with the water, the upper specimen’s surface is influenced by the ambient humidity.<br />
Three Hot‐ball sensors were used to determine the quantitative amount of vapor and liquid<br />
water (moisture content) in the immediate vicinity of the sandstone. Three RTM devices<br />
(Transient MS) were connected to these sensors to collect data. The results of the data from the<br />
RTM devices are local values of the moisture acquired by measuring the amount of thermal<br />
conductivity provided by the Hot‐ball sensors. The total increase in moisture of each sample is<br />
measured by weighting (the integral moisture of the whole sample). The integral moisture<br />
shows any change in weight, depending on the increase in the water content of the sample<br />
during the period of saturation.<br />
The sandstone samples were saturated. First, the vapor was diffused, and then the capillary<br />
saturation was observed in the samples. The behaviour of the saturation mechanisms and the<br />
redistribution of the moisture content in the samples strongly depend on the structure. The<br />
structure of the sample and the conditions of the experiment must be considered when<br />
measuring thermophysical parameters in heterogeneous materials. The heat spreads<br />
throughout the system, and it is very difficult to isolate the sample from its surroundings.<br />
Therefore, we maintain the specimens at a constant temperature and also at a constant<br />
humidity.<br />
The gradual saturation of the specimen, depending on the position of the Hot‐ball sensors, can<br />
be determined. Saturation strongly depends on porosity. The complete picture about the<br />
processes of water saturation in a material with certain porosity can be obtained after<br />
saturation. Then the values q/Tm (Eq. 4) are converted to the percentage increase of the moisture<br />
in the specimen. Figure 3 shows the local values for the middle sensors, which isn’t affected by<br />
external conditions, like ambient humidity. These values are plotted depending on the time.<br />
The experiment shows mainly the local value in certain parts of the sample by using the Hot‐<br />
Ball Method. The Hot‐ball sensors were in the same positions in specimens of sandstones.<br />
The experimental data obtained from the Hot‐ball sensors we evaluated by physical model.<br />
Fitting model is considered planar moisture source on one side the sample, while this source is<br />
ideal and it have „Newtonianʺ contact between moisture sink and sample. This model is based<br />
on a simple diffusion equation (5):<br />
44<br />
<br />
D<br />
t<br />
x<br />
x<br />
by initial condition:<br />
( 0,<br />
x)<br />
0<br />
and boundary conditions:<br />
01(<br />
t)<br />
x<br />
0<br />
(7)<br />
<br />
<br />
D x<br />
L<br />
x<br />
x<br />
L<br />
The solution is equation (9):<br />
(5)<br />
(6)<br />
(8)
2<br />
1 e <br />
2 2<br />
<br />
(<br />
, ) 0<br />
2<br />
sin( )<br />
2<br />
<br />
<br />
t x<br />
<br />
( 1<br />
) <br />
where is moisture density, t is time, x is Cartesian coordinate, D is moisture diffusivity, α is<br />
moisture transfer coefficient of the sample‐moisture sink interface, L is length of sample and <br />
L<br />
x Dt<br />
is the root of equation cos sin<br />
0 , where , , . 2<br />
D L L<br />
For each sensor was evaluated the moisture diffusivity D, which increased the moisture content.<br />
For low moisture content for some sandstone is moisture diffusivity 1.8.10‐10 and 1.4.10‐7 for<br />
higher value of moisture content in the sample. The moisture diffusivities vary considerably<br />
according to the type of sample, its structure and sorption. Values obtained by Hot‐ball sensors<br />
and by diffusion model are shown in figure 3 only for sensor in the middle of sample.<br />
Moisture (-)<br />
1.0<br />
0.9<br />
0.8<br />
0.7<br />
0.6<br />
0.5<br />
0.4<br />
0.3<br />
0.2<br />
0.1<br />
0.0<br />
Sample<br />
Sander<br />
sandstone<br />
Sandstein<br />
sandstone<br />
Sander sandstone - middle sensor<br />
sensor<br />
fit<br />
100000 200000<br />
Time (sec)<br />
300000 400000<br />
Moisture (-)<br />
1.0<br />
0.9<br />
0.8<br />
0.7<br />
0.6<br />
0.5<br />
0.4<br />
0.3<br />
0.2<br />
0.1<br />
0.0<br />
Sandstein sandstone - middle sensor<br />
sensor<br />
fit<br />
100000 200000<br />
Time (sec)<br />
300000 400000<br />
Fig. 3 The measured and fitted values of moisture in samples of sandstone<br />
Position of<br />
sensor<br />
Table 1: Moisture diffusivity of sandstones<br />
Moisture diffusivity<br />
D [m 2 /s]<br />
1. part (0‐30%<br />
of moisture)<br />
2. part (30‐60% of<br />
moisture)<br />
(9)<br />
3. part (60%‐ of<br />
moisture)<br />
bottom 1.45908E‐08 1.05151E‐08 1.24870E‐08<br />
middle 5.45173E‐09 1.26570E‐08 1.72929E‐08<br />
top 1.55728E‐08 1.91775E‐08 2.74501E‐08<br />
bottom 4.55602E‐09 4.20460E‐09 7.69838E‐09<br />
middle 7.86332E‐09 1.22879E‐08 1.48244E‐08<br />
top 5.77438E‐08 2.70182E‐08 1.81260E‐08<br />
45
The experimental curves and fitted curves may be caused individual variation of process of the<br />
saturation. This process is complex transport phenomenon where moisture diffusivity D<br />
strongly depending on moisture content. The model for this mechanism is simplified, because<br />
the fitting region is only for capillary part of saturation curve and it’s divided only into 3 parts.<br />
From each of some part we get value of the moisture diffusivity. In the case when an area is<br />
divided into more parts the result could be distorted because it’s not much point for fitting<br />
procedure. This distribution of capillary part of curve is the best solution in the fitting process.<br />
Table 1 shows the moisture diffusivity of sandstones, while the coefficient α was chosen<br />
constant 1E‐08 m 2 /s.<br />
Conclusions<br />
The theory of the Hot‐ball sensor and its application has been presented. The sensor is based on<br />
a ball that generates a constant heat and simultaneously measures the temperature response for<br />
t > 0. The ideal model of an empty ball in an infinite specimen gives the working relation of the<br />
Hot‐Ball Method. The experiment describes the water saturation of sandstone. The sandstones<br />
were cut from different geographical locations and therefore have various structures and<br />
porosities. The Hot‐ball sensors were applied to monitor the increase in saturated water in the<br />
sandstone samples. The experimental data were validated by Hg‐porosimetry and compared<br />
with possible mechanisms for water saturation. The experiments have shown that the porosity<br />
and structure of materials strongly affects the water saturation process and the behavior of the<br />
materials.<br />
For evaluation of the values obtained from Hot‐ball sensors was used the physical model to<br />
determine adequate parameter. This parameter is moisture diffusivity D. The model used for<br />
the capillary part of saturation for each thermal conductivity sensor. The model was considered<br />
planar moisture source on one side the sample, while this source is ideal and it have<br />
„Newtonianʺ contact between moisture sink and sample. This model is based on a simple<br />
diffusion equation (Eg. 5). It is well known that the moisture diffusivity is dependent on the<br />
moisture content of the sample and therefore we are divided capillary part of the saturation<br />
curve into 3 regions (parts). This distribution of capillary part of saturation curve is the best<br />
solution within this physical model and results are comparable to table’s data for the sandstone<br />
with a similar porosity.<br />
Hot‐ball method and consecutive evaluation by physical diffusion model is very advantageous<br />
for the continuous monitoring of moisture changes in rock massifs historical monuments, and<br />
other applications (monitoring the setting of concrete, polymerization, structural transformation<br />
in pores, the ageing of materials).<br />
Acknowledgement<br />
The paper was supported by the APVV LPP–0442–09 project and by the Scientific Grant Agency<br />
of Ministry of Slovak Republic and Slovak Academy of Sciences, project VEGA 2/0190/12.<br />
Thanks to Viliam Vretenar, Marian Markovič and Vlastimil Bohač for their help, technical<br />
assistance and experimental advice.<br />
46
References<br />
[1] Terheiden, K.: Simultaneous measurement of vapor and liquid moisture transport in<br />
porous building materials, Building and Environment 43, 2008<br />
[2] Qin, M., Belarbi, R., Ait‐Mokhtar, A., Seigneurin, A.: An analytical method to calculate the<br />
coupled heat and moisture transfer in building materials, International Communications<br />
in Heat and Mass Transfer 33, 2006, pp. 39– 48<br />
[3] Nizovtsev, M.I., Stankus, S.V., Sterlyagov, A.N., Terekhov, V.I., Khairulin, R.A.:<br />
Determination of moisture diffusivity in porous materials using gamma‐method,<br />
International Journal of Heat and Mass Transfer 51, 2008, pp. 4161–4167<br />
[4] Kubičár, Ľ., Vretenár, V., Štofaník, V., Boháč, V.: Thermophysical sensors: Theory and<br />
application of the hot ball, International Journal of <strong>Thermophysics</strong>, 2008<br />
47
48<br />
Simulations of Hot‐Ball sensors using COMSOL<br />
Andrés Gómez Ruiz, Ľudovít Kubičár, Viliam Vretenár<br />
Abstract: Different approaches have been used to build Hot‐Ball sensors. Analysis of each Hot‐Ball<br />
sensor shows how near or far we are to the theoretical model. In order to make a prediction about the best<br />
approach of construction of hot ball sensors, the simulation with the COMSOL Multiphysics software is<br />
a good help. The simulation allows us to know what happen when we change something in the way of<br />
build a Hot‐Ball sensor. The simulation never replaces the analytical results, but is a good tool that saves<br />
time, because we obtain results almost automatically, and saves money, because it allows to predict which<br />
configuration will provide analytical result more closer to the ideal model and which one definitely<br />
farther.<br />
Keywords: Hot‐Ball sensor, simulations, theoretical model<br />
1. Introduction<br />
The Hot‐Ball method have provided a progress in the knowledge of the thermophysical<br />
properties of materials. An ideal or theoretical model of the hollow sphere in an infinite<br />
medium furnishes a working equation of the hot‐ball method. A constant heat flux through the<br />
surface of the ball generates the temperature field. The thermal conductivity of the surrounding<br />
medium is determined by the stabilized value of the temperature response, i.e., when the<br />
steady‐state regime is attained. The thermometer can provide a information on the temperature<br />
response in the medium. The analysis of the temperature response allows us to determine the<br />
thermophysical parameters of the surrounding medium. The theory related with the Hot‐Ball<br />
method can be found in [1].<br />
In order to build a real Hot‐Ball sensor, the approach consist in use a resistor as a heat source<br />
and a thermistor as a thermometer. If we think that this fact can distort the theoretical Hot‐Ball<br />
model we are right. The resistor and thermistor need cooper wires in order to be fed with some<br />
electrical current. The geometry of this two elements and the cooper wires is far away from a<br />
sphere, so we need some other material to cover them and to create a sphere, we have to think<br />
about some insulation problems between the two components too. All this issues make our real<br />
Hot‐Ball sensors be not so similar to the theoretical model and therefore this results in a wrong<br />
measurement of the temperature response. In this article we will show some simulated results<br />
in order to understand how the presence of the different parts in a Hot‐Ball sensor (thermistor,<br />
resistor, cooper wires, plastic tube) affects its behaviour.<br />
2. About COMSOL Multiphysics software<br />
The simulations have been made with the software COMSOL Multiphysics 4.2. This software<br />
allows us to define a geometry and then, add some physical conditions to the structure. The<br />
structure is composed from several materials, each one with different properties. The choosen<br />
properties are the parameters of the the physical conditions. The object of study is the heat<br />
transfer in solids, where the heat can be transferred through the contacts between materials. The<br />
Figure 1a represents an ilustrative picture of the model used in the simulations, with an initial<br />
conditions for the temperature T 0 and a value for the heat source Q. There is an axial symetry<br />
along the y axis, in that way we have a Hot‐Ball inside a cylinder made of the sorrounding
medium. Figure 1b represents a model close to the reality, take in account that Figure 2b<br />
corresponds to a zoom of the hole model, the mean body is a cylinder of 60 mm height and a<br />
radius of 30 mm made of water or glycerol. In the center of this cilynder is located a ball of<br />
epoxy of 1mm radius with a resistor inside, all elements have axyal simmetry along the y axis.<br />
Each material in the Figure 1b is characterized with a density , a heat capacity C p and a<br />
thermal conductivity .<br />
a) b)<br />
Figure 1: a) ilustrative picture of the model, b) zoom of the structure in the Hot‐Ball part.<br />
Table 1: Characteristics of the used materials.<br />
3<br />
Material C [J/(kg<br />
K)] [ kg/m ] [ W/(m K) ]<br />
p<br />
Cooper 385 8700 400<br />
Plastic 1800 880 0.188<br />
Epoxy 1200 2220 5<br />
Glycerol 2381 1257.7 0.285<br />
Water 4180 997.1 0.6067<br />
A 880 3950 30<br />
2O 3<br />
3. Temperature distribution<br />
COMSOL Multiphysics allows us to see the temperature distribution in the steady state (when<br />
the temperature is stabilized). We will show some results according to different configurations<br />
in order to see how adding of the components affects the temperature distribution. Figures<br />
2a,b,c,d shows the temperature distribution for four different models. Each configuration has its<br />
own temperature scale, situated at the right of the figure.<br />
<br />
6 3<br />
The initial conditions in the four figures are the same, T0<br />
25 C and Q 1. 5 10<br />
W/m , in the<br />
four figures the surrounding medium is glycerol. The Figure 2a corresponds to the theoretical<br />
model, in this case the heat source is the hole ball. In the Figure 2b the heat source is the resistor,<br />
which is located into the ball of epoxy, the volume of the resistor is lower than the volume of<br />
the ball, this explainds the difference of the maximum temperature between the Figure 2a and<br />
Figure 2b. In the Figure 2c a cooper wire is adding, more heat is transfered out through the<br />
cooper wire than in other direction, this makes a maximum temperature even lower than in<br />
49
Figure 2b. The maximum temperature is higher in Figure 2d than in Figure 2c. It seems that the<br />
plastic tube helps to get bigger insulation between the cooper wire and the sorrounding<br />
medium. In this case less heat is going out from the Hot‐Ball, making a situation more similar to<br />
Figure 2b.<br />
50<br />
a b c d<br />
Figure 2: a) The theoretical model, b) adding the resistor as a heat source, c) adding a cooper wire, d)<br />
adding the plastic tube.<br />
4. The coefficient m T q /<br />
Another approach is in use of the analytical model of holow sphere [1], The model gives a<br />
working equation:<br />
q<br />
q<br />
Tm 4r<br />
,<br />
4r<br />
Tm<br />
where Tm is maximum temperature, q is heat flux, l is thermal conductivity and r is radius.<br />
Then, comparing the coefficient m T q / for water and glycerol we obtain:<br />
q <br />
q <br />
Wat<br />
<br />
<br />
<br />
<br />
Wat<br />
<br />
<br />
<br />
<br />
4rgly<br />
Tm<br />
wat<br />
0.<br />
59<br />
<br />
Tm<br />
<br />
2<br />
<br />
4wat<br />
q gly<br />
0.<br />
28 q <br />
Gly<br />
<br />
<br />
<br />
<br />
Gly<br />
<br />
<br />
<br />
<br />
Tm<br />
<br />
Tm<br />
<br />
The term m<br />
T (maximum temperature), must be understood as the difference between the initial<br />
temperature and the stabilized temperature after apply the constant heat output Q from the<br />
heat source.<br />
We will evaluate this coefficent for the four models presented in figure 2 at different points<br />
located along the y axis inside the Hot‐Ball structure. The location of the points is expecified in
the figure 3, (understand that for the other models of Figure 2 the points are located in the same<br />
way).<br />
Figure 3: Location of the points in the model of figure 2d, in the rest of the models the location is<br />
analogous.<br />
q q <br />
Table 2: Ratio Wat<br />
<br />
<br />
<br />
Gly<br />
<br />
<br />
<br />
of the four models in three different points.<br />
Tm<br />
Tm<br />
<br />
Model Point 1 Point 2 Point 3<br />
2a 2.068 2.085 2.115<br />
2b 2.031 2.094 2.144<br />
2c 1.934 1.994 2.041<br />
2d 1.906 1.967 2.0156<br />
q q <br />
In the point number 3, the ratio Wat<br />
<br />
<br />
<br />
Gly<br />
<br />
<br />
<br />
gets the highest value. Most of the Hot‐Ball<br />
Tm<br />
Tm<br />
<br />
sensors built in the laboratory up to now has a ratio lower than 2 The approach gives a new<br />
way of the Hot‐Ball construction in order to get a structure closer to the theoretical model. In<br />
the model shown in Figure 2d, which is the closest to the reality, the value for the ratio in point<br />
3 is the closest to 2. Therefore, according to the simulations, we should build Hot‐Ball sensors<br />
where thermistor is not fixed close to the resistor.<br />
5. Conclusions<br />
Two conclusions are clear in this study. First, good insulation between the cooper wire and the<br />
sorrounding medium with a plastic tube, reduces heat transfer into surrounding medium<br />
through wires. Second, we have proved that a bigger distance between components (thermistor<br />
q q <br />
and resistor), within a Hot‐Ball, gives a larger ratio Wat<br />
<br />
<br />
<br />
Gly<br />
<br />
<br />
<br />
, that improves the<br />
Tm<br />
Tm<br />
<br />
measurement sensitivity. This two facts can be take in account later in the building of new<br />
sensors. With this conclusions we have prove that COMSOL Multiphysics is a good tool in order<br />
to study the behaviour of the Hot‐Ball sensors.<br />
51
Acknowledgments<br />
This work was supported by the Slovak Research and Development Agency under the contract<br />
No. APVV‐0641‐10 and by the Scientific Grant Agency of Ministry of Slovak Republic and<br />
Slovak Academy of Sciences, project VEGA 2/0190/12.<br />
References<br />
[1] Kubičár, Ľ., Vretenár, V., Štofanik, V., Boháč, V., Hot‐Ball Method for Measuring Thermal<br />
Conductivity, Int. J. Thermophys., 2010, 31, 1904‐1918<br />
[2] COMSOL documentation<br />
52
Mechanical and durability properties of cement‐based<br />
composites containing solid waste incineration residues<br />
Martin Keppert, Zbyšek Pavlík, Pavel Reiterman, Robert Černý<br />
Faculty of Civil Engineering, Czech Technical University in Prague, Thákurova 7, CZ‐166 29<br />
Prague , Czech Republic<br />
email: martin.keppert@fsv.cvut.cz<br />
Abstract: Mechanical and durability properties of cement‐based composites containing solid waste<br />
incineration residues are studied. The untreated bottom ash is used as partial sand replacement in the<br />
composites. This ash, by its chemical composition, does not fulfill the standard requirements on<br />
aggregates but the prepared composite is found to have acceptable properties.<br />
Keywords: cement‐based composites, solid waste incineration residues, mechanical properties, durability<br />
properties<br />
Introduction<br />
Incineration of municipal solid wastes is an effective way (when compared with landfilling) of<br />
reduction of the non‐recyclable waste amount; the waste weight reduction by incineration is<br />
down to 30 % of initial mass, the volume reduction is even more effective (about 10 %). Another<br />
positive aspect of the incineration can be energy production (electricity, heat); the caloric<br />
content of municipal waste is comparable with lignite. The unwanted – but unavoidable –<br />
outcomes from incineration are represented by bottom ash (BA; about 27 wt. % of incinerated<br />
waste) and air pollution control (APC) residues (fly ashes; ca 3 wt. %). The generated amount<br />
and properties of particular ashes differ from plant to plant in dependence on the applied<br />
incineration and air pollution control technology, composition of processed wastes and even on<br />
year season. Especially the APC residues bring significant environmental risks due to heavy<br />
metals and Persistent Organic Pollutants (POPs) content. The APC management strategies and<br />
treatment methods were summarized in [1]. Bottom ash usually does not have to be treated<br />
because of its lower heavy metals and POPs content. BA can be dumped or utilized as a<br />
material; common is employment of bottom ash as embankment material but even this<br />
application is often matter of “green” objections due to possible leach out of heavy metals into<br />
surroundings during the long time environmental exposure. Hence it would be attractive to use<br />
BA as a raw material for a product where heavy metals would be immobilized and thus such<br />
product would be environmental safe. Such requirements are fulfilled well by cementitious<br />
composites [2]. The BA can be used either as concrete admixture or as raw material for cement<br />
clinker production [3].<br />
Pera et al. [4] used MSWI bottom ash as partial coarse aggregates replacement in concrete; they<br />
proposed to treat the BA by NaOH in order to prevent aluminium induced hydrogen evolution<br />
which causes loss of strength. Such application of treated BA increased durability of concrete<br />
but still reduced its strength. Bertolini et al. [5] compared water washing and dry and wet<br />
grinding as MSWI BA treatment; only the latter process to prevent the concrete strength loss.<br />
Ferraris et al. [6] proposed melting MSWI BA at 1450 °C and grinding the resulting slag to<br />
particles smaller than 90 μm which can be used and filler or supplementary cementitious<br />
material. Similar approach studied Lee and Rao [7]; they added to MSWI ashes also scrap glass<br />
53
and the resulting slag was ground to particles finer than 38 μm. This material was used for<br />
production of blended cement [8]. Rémond et al. [9] studied effect of untreated MSWI fly ash on<br />
technological properties of cement mortars. The fly ash caused significant increase of setting<br />
time and decrease of workability and strength.<br />
The goal of the present work is to evaluate influence of untreated MSWI bottom ash on<br />
technologically important properties – compressive strength, bulk density, durability, and fresh<br />
concrete consistency.<br />
Experimental methodes<br />
The granulometry of MSWI bottom ash (BA) was determined by standard sieving analysis [10].<br />
The compressive strength of 7, 28 and 90 days old concrete (cubes 150 mm) was measured using<br />
the common test described in [11]. Resistance of concrete to freezing and thawing action was<br />
determined according [12] by means of temperature cycling; one cycle consisted in 4 hours at ‐<br />
20° C and 2 hours at 20° C; the compressive strength was measured after given number of<br />
cycles. Consistency of fresh concrete mixture was measured by slump test [13].<br />
Materials<br />
The subject of study was bottom ash (BA) collected in the winter period of 2009 in a modern<br />
incineration facility in Czech Republic. The BA has been quenched in water after leaving the<br />
grate, and steel pieces were removed by magnetic separation. The generated BA from<br />
incinerator involves wide range of particles size; only the fraction 0‐4 mm was used in the<br />
present work. The ash was dried before experiments. The content of major components (in form<br />
of oxides) is presented in Tab. 1. It was determined by XRF spectroscopy by apparatus Thermo<br />
ARL 9400 XP.<br />
Nowadays the BA is (in this particular incinerator) mixed with treated fly ashes and used as<br />
backfill and embankment material. An alternative use – as fine aggregates in concrete – was<br />
tested in this paper. Series of concrete samples was prepared according Tab. 2. Ordinary<br />
Portland cement CEM I 42.5 R was used as binder; natural aggregates were siliceous sand and<br />
gravel. The fresh concrete mixture was casted into standard cubes of edge 150 mm and stored in<br />
water to age 7, 28 or 90 days. The reference specimens (C0) were stored separately in order to<br />
prevent possible negative effects of chlorides and sulfates leached out form the C5‐C15<br />
specimens.<br />
The 2 nd series of experiments was devoted to determination of water/cement ratio effect on<br />
technological properties of fresh and settled concrete (after 28 days). The composition is given<br />
in Tab. 3. Mixture C10 was selected as the starting material.<br />
54<br />
Table 1: Content of major oxides in bottom ash (weight %)<br />
SiO2 33.5 ZnO 0.8<br />
Al2O3 15.8 Na2O 3.6<br />
Fe2O3 8.4 K2O 1.9<br />
CaO 19.4 TiO2 1.5<br />
MgO 2.0 Cl 1.1<br />
SO3 9.3
Table 2: Composition of concrete mixtures with different level of fine aggregates replacement by BA<br />
Natural aggregates<br />
Material Cement BA 0‐4 4‐8 8‐16 w/c<br />
kg/m3 kg/m3 kg/m3 kg/m3 kg/m3 C0 400 0 607 260 867 0.52<br />
C5 400 30 577 260 867 0.52<br />
C10 400 61 546 260 867 0.52<br />
C15 400 91 516 260 867 0.52<br />
Table 3: Composition of concrete mixtures C10 with different water/cement ratio<br />
Results and discussion<br />
Natural aggregates<br />
Mixture Cement BA 0‐4 4‐8 8‐16 w/c<br />
kg/m3 kg/m3 kg/m3 kg/m3 kg/m3 C10‐0.45 400 61 546 260 867 0.45<br />
C10‐0.49 400 61 546 260 867 0.49<br />
C10‐0.52 400 61 546 260 867 0.52<br />
C10‐0.55 400 61 546 260 867 0.55<br />
C10‐0.60 400 61 546 260 867 0.60<br />
The chemical composition of BA (Tab. 1.) is highly unfavorable in order to be used in<br />
cementitious products. The sulfate content is very high when compared with published values;<br />
the chloride content is within common range of bottom ashes [2, 4]; the BA does not fulfill the<br />
standard requirements on sulfate and chloride content in aggregates for concrete [14]. On the<br />
other hand, the grading curve (Fig. 1) of studied 0‐4 mm BA fraction is relatively close to<br />
granulometry of natural siliceous 0‐4 mm sand.<br />
Cumulative passing [%]<br />
100<br />
80<br />
60<br />
40<br />
20<br />
BA<br />
Sand<br />
0<br />
0.01 0.1<br />
Grain size [mm]<br />
1 10<br />
Figure 1: Grading analysis of bottom ash and sand 0‐4 mm.<br />
55
The dependence of concrete compressive strength upon level of sand replacement in plotted in<br />
Fig. 2. The replacement up to 10 % does not influence the strength negatively. Bulk density (Fig.<br />
2) is slightly decreasing with the BA content but any visible expansion or spalling caused by<br />
hydrogen evolution [4, 15] has not been observed.<br />
56<br />
Compressive strength [MPa]<br />
60<br />
50<br />
40<br />
30<br />
20<br />
10<br />
0<br />
0 5 10 15<br />
BA sand replacement [%]<br />
Figure 2: Compressive strength (28 days) and bulk density of mixtures C0 to C15.<br />
Compressive strength [MPa]<br />
70<br />
60<br />
50<br />
40<br />
30<br />
20<br />
10<br />
0<br />
Compressive<br />
strength<br />
Bulk density<br />
Figure 3: Evolution of compressive strength upon time of water curing of reference mixture C0 and BA<br />
containing C10.<br />
Since the strength of C10 has been about the same as in case of reference C0, this material has<br />
been chosen for more detailed characterization. The evolution of compressive strength upon<br />
time (Fig. 3) reveals that up to 28 days the rate of strength increase of the reference mixture and<br />
C10 has been comparable but later the hydration of reference concrete has continued while the<br />
strength of BA containing material has increased only moderately. The frost resistance tests<br />
results (Fig. 4) showed a very good durability of BA containing concrete which has sustained<br />
125 freezing cycles without decrease of strength and integrity. Beyond this, the frost resistance<br />
C0<br />
C10<br />
0 30 60 90<br />
Time of curing [days]<br />
2000<br />
1900<br />
1800<br />
Bulk density [kg/m 3 ]
experiment has demonstrated again the difference of hardening course which was already<br />
observed – C10 specimen reached its maximum strength earlier than reference C0 which<br />
hydrated significantly also during the freezing/thawing cycles.<br />
Compressive strength [MPa]<br />
Figure 4: Compressive strength after 75 and 125 freezing – thawing cycles.<br />
Slump [mm]<br />
70<br />
60<br />
50<br />
40<br />
30<br />
20<br />
10<br />
0<br />
250<br />
200<br />
150<br />
100<br />
50<br />
C0 C10<br />
28 days 75 cycles 125 cycles<br />
C0<br />
C10<br />
0<br />
0.45 0.5 0.55 0.6<br />
w/c<br />
Figure 5: Slump of C10 mixture as function of water/cement ratio.<br />
It can be explained by different hydration mechanism of cement clinker minerals in presence of<br />
chlorides and sulfates from bottom ash [16]; they cause hydration retardation on the beginning<br />
of hydration (ettringite and its chloride analogues – hydrated chloroaluminates). Later the<br />
hydration proceeds faster but the final composition of hydrated cement binder is different from<br />
the standard cement with only low content of sulfates and almost none chlorides. Material C10<br />
hydrated and reached its final strength faster but this “final” strength is lower than in case of<br />
reference C0. Such behavior was observed also by authors [9] who used untreated MSWI fly ash<br />
with high content of chlorides and sulfates while in other papers dealing with treated ashes the<br />
57
strengthening rate was similar for reference and ash‐containing mixtures [5, 6]. Obviously<br />
concrete made from untreated ashes is excluded from reinforced structures.<br />
58<br />
Figure 6: Compressive strength (28 days) and bulk density of mixture C0 as function of water/cement<br />
ratio.<br />
The adding of bottom ash to concrete mixture has reduced its slump (Fig. 5). Similar<br />
measurement [9] confirmed this behavior of ashes. The fresh concrete mixture consistency of<br />
C10 has been obviously highly dependent on water cement ratio; the consistency ranges from<br />
stiff S1 to fluid S4 [13]. The dependence of compressive strength and bulk density on w/c has<br />
been found to be linear (Fig. 6). These results represent the mixture variability without any<br />
plasticizers; obviously by range of concrete additives the mixture properties can by widely<br />
varied.<br />
Conclusions<br />
The untreated MSWI bottom ash (fraction 0‐4 mm) was used as partial sand replacement in<br />
concrete. This ash, by its chemical composition, does not fulfill the standard requirements on<br />
concrete admixtures but the prepared concrete had acceptable properties. The 28‐days<br />
compressive strength of material with 10 % sand replacement was comparable with the<br />
reference concrete; the 90‐days strength was lower which can be explained by different<br />
hydration process. The frost resistance of bottom ash containing concrete was very good. The<br />
prepared concrete contained relatively low content of MSWI ash; this approach represents a<br />
compromise between the ecological request on a practical utilization of MSWI ashes and<br />
properties of the acquired product. Higher ash dosage – without any accompanied loss of<br />
concrete properties – would be possible only when the ash would be treated in some way (e.g.<br />
by vitrification) but in such case there would arise additional costs suppressing the MSWI ashes<br />
utilization attractiveness for building industry.<br />
Acknowledgment<br />
Compressive strength [MPa]<br />
60<br />
50<br />
40<br />
30<br />
20<br />
10<br />
Compressive strength<br />
Bulk density<br />
0<br />
1800<br />
0.45 0.5 0.55 0.6<br />
w/c<br />
This research has been supported by the Ministry of Education, Youth and Sports of the Czech<br />
Republic, under project No MSM: 6840770031.<br />
2000<br />
1900<br />
Bulk density [kg/m 3 ]
References<br />
[1] ISWA, Management of APC residues from W‐t‐E plants; An overview of management<br />
options and treatment methods. International Solid Waste Association, Copenhagen, 2008.<br />
[2] POHOŘELÝ, M. ‐ ŠYC, M. ‐ TOŠNAROVÁ, M. ‐ ZYCHOVÁ, M. ‐ KEPPERT, M. ‐<br />
PUNČOCHÁŘ, M. Immobilization of heavy metals in municipal waste incineration<br />
ashes,In: Paliva, vol. 2, pp. 113‐118 (in Czech).<br />
[3] LAM, C. H. K. ‐IP, A. W. M. – BARFORD, J. P. ‐ MCKAY, G. Use of Incineration MSW ash:<br />
A review, In: Sustainability, vol. 2, 2010, pp. 1943‐1968.<br />
[4] PERA, J. ‐ COUTAZ, L. – AMBROISE, J. ‐ CHABABBET, M. Use of Incinerator Bottom<br />
Ash in Concrete, In: Cement and Concrete Research, vol. 27, 1997, pp. 1–5.<br />
[5] BERTOLINI, L. ‐ CARSANA, M. ‐ CASSAGO, D. ‐ CURZIO, A. Q. ‐ COLLEPARDI, M.<br />
MSWI ashes as mineral additions in concrete, In: Cement and Concrete Research, vol. 34,<br />
2004, pp. 1899–1906.<br />
[6] FERRARIS, M. ‐ SALVO, M. ‐ VENTRELLA, A. ‐ BUZZI, L. ‐ VEGLIA, M. Use of Vitrified<br />
MSWI Bottom Ashes for Concrete Production, In: Waste Management, vol. 29, 2009, pp.<br />
1041–1047.<br />
[7] LEE, T. C. ‐ RAO, M. K. Recycling Municipal Incinerator Fly and Scrubber Ash into Fused<br />
Slag for the Substantial Replacement of Cement in Cement Mortars, In: Waste Management,<br />
vol. 29, 2009, pp. 1952‐1959.<br />
[8] LEE, T.C. ‐ CHANG, C. J. – RAO, M.‐K. ‐ SU, X. W. Modified MSWI ash‐mix slag for use<br />
in cement concrete, In: Construction and Building Materials, vol. 25, 2011, pp. 1513‐1520.<br />
[9] RÉMOND, S. – PIMIENTA, P. ‐ BENTZ, D. P. Effects of incorporation of Municipal Solid<br />
Waste Incineration fly ash in cement pastes and mortars I. Experimental study, In: Cement<br />
and Concrete Research, vol. 32, 2002, pp. 303‐311.<br />
[10] ČSN EN 933‐2, Tests for geometrical properties of aggregates. Determination of particle<br />
size distribution. Test sieves, nominal size of apertures, 1996.<br />
[11] ČSN EN 12390‐3, Testing hardened concrete Part 3: Compressive strength of test<br />
specimens, 2002.<br />
[12] ČSN 73 1322, Determination of concrete frost resistance, 1968, change Z1 (2003).<br />
[13] ČSN EN 12350‐2, Testing fresh concrete. Slump test, 2000.<br />
[14] ČSN EN 12620, Aggregates for concrete, 2006.<br />
[15] MÜLLER, U. ‐ RÜBNER, K. The microstructure of concrete made with municipal waste<br />
incinerator bottom ash as an aggregate component, In: Cement and Concrete Research, vol.<br />
36, 2006, pp. 1434‐1443.<br />
[16] UBBRIACO, P. – CALABRESE, D. Hydration behaviour of mixtures of cement and fly ash<br />
with high sulfate and chloride content, In: Journal of Thermal Analysis and Calorimetry, vol.<br />
61, 2000, pp. 615‐623.<br />
59
60<br />
Evolution algorithms as tool for optimization of water vapour<br />
transport properties of cellular concrete<br />
Jan Kočí, Jiří Maděra, Jaromír Žumár, Zbyšek Pavlík, Robert Černý<br />
Faculty of Civil Engineering, Czech Technical University in Prague, Thákurova 7, CZ‐<br />
166 29 Prague, Czech Republic<br />
email: jan.koci@fsv.cvut.cz<br />
Abstract: The new method for determination of water vapour transport properties of building materials<br />
is presented in this paper. This method consist in combining experimental and computational approach,<br />
where in the experimental part, the relative humidity profiles are determined using transient method and<br />
in the computational part, genetic algorithm and genetic programming is used. In this paper also the<br />
practical example of determination water vapour diffusion resistance factor of cellular concrete is<br />
presented.<br />
Keywords: Water vapour permeability, cellular concrete, transient experimental method, genetic<br />
algorithms, genetic programming<br />
1. Introduction<br />
The modern mathematical models for description of transport processes in porous materials<br />
require precise input data in order to produce serious output data. Among these input data, the<br />
material parameters plays crucial role. When describing water vapour transport, water vapour<br />
permeability, water vapour diffusion coefficient or water vapour diffusion resistance factor is<br />
usually needed. In many mathematical models, these material parameters are required as a<br />
function of relative humidity or moisture content in the material. Such requirement put the<br />
burden on the laboratory workers who perform the measurements.<br />
Water vapour transport parameters are usually determined by steady state cup method [1].This<br />
method is very popular for its simplicity and is generally considered as reliable and relatively<br />
accurate. However, back in 2004, in the framework of EU‐initiated HAMSTAD project, the<br />
involved researches have referred to the necessity of improvement of the vapour diffusion<br />
experiment based on cup method [2]. Another way for determination of water vapour transport<br />
properties of materials is an inverse analysis. The inverse analysis presents general approach<br />
that is aimed at identification of unknown input data based on known output data. This<br />
approach includes many methods from simple equations to complex models and optimization<br />
tools and methods [3]. Among these optimization tools, the evolutionary algorithms take place.<br />
These algorithms are inspired by processes that occur in living nature. Genetic algorithms and<br />
genetic programming are typical representatives from this group of optimization methods. As it<br />
has been published in the recent past, the genetic algorithm (GA) may be used within the<br />
inverse analysis of material characteristics of building materials [4]. Although the applications<br />
of GA were more or less successful, there are still some limitations that don’t allow getting<br />
better performance of the algorithm. Due to representation of candidate solutions by variables,<br />
the GA is unable to optimize mathematical functions. In order to get smooth functions, the GA<br />
must work with more than 50 variables, but with such high number of variables, the GA loses<br />
its ability to find the solution. This problem may be solved by involving genetic programming
(GP). GP works on very similar principles like GA, but instead of evolving candidate solutions<br />
in form of variables, GP evolves programs. In standard GP, these programs are very often<br />
represented by mathematical functions, which are very suitable for optimization on the field of<br />
materials engineering.<br />
In this paper we present new method of inverse analysis that combines genetic algorithm and<br />
genetic programming. The GA is used for determination of the shape of investigated curve of<br />
water vapour diffusion resistance factor. The GP is then used for symbolic regression of that<br />
curve and determination its mathematical description.<br />
2. Combined experimental/computational technique for determination of water<br />
vapour diffusion resistance factor as a function of relative humidity<br />
2.1 Experimental<br />
For the application of computational inverse analysis, knowledge of relative humidity<br />
distribution along the sample length which is oriented in parallel to water vapour transport<br />
must be known. Therefore, an experimental apparatus for relative humidity profiles<br />
measurement within 1‐D water vapour transport was devised. It consists of two airtight<br />
chambers that are separated by measured sample that has usually rod shape. The sample is<br />
provided by water vapour proof insulation on all the lateral sides what ensures 1‐D water<br />
vapour flux through the studied material. In the first chamber, a state close of high relative<br />
humidity is kept while in the second one, there is a state close to 0% relative humidity. In this<br />
way, simulation of gradient of partial water vapour pressure is performed. For relative<br />
humidity fields monitoring, the capacity hygrometric sensors are used. There are placed into<br />
the before bored holes in specific distances along the sample length in such manner that no<br />
disturbance of water vapour flux through the sample occurs. The basic schema of the apparatus<br />
is given in Fig 1.<br />
3. Computational<br />
Figure 1: Experimental set‐up of relative humidity profiles measurement<br />
The measured relative humidity profiles were analysed within the coupled inverse and forward<br />
analysis that was performed using computer code HEMOT [5], GRADE genetic algorithm [6]<br />
and genetic programming tool GPdotNET [7]. Within this process, the optimised water vapour<br />
61
diffusion resistance factor vs. relative humidity function was found by the use of GRADE code<br />
and verified by agreement between data calculated by HEMOT code and measured within the<br />
transient experiment. Within the performed calculations, also the effect of water vapour transfer<br />
coefficient on the simulated relative humidity profiles was studied. After that, the best solution<br />
found by GRADE was optimized by GPdotNET to get smooth curve and to find its<br />
mathematical description.<br />
3.1 Evolutionary algorithms<br />
In artificial intelligence, an evolutionary algorithm (EA) is a subset of evolutionary<br />
computation, a generic population‐based metaheuristic optimization algorithm. An EA uses<br />
some mechanisms inspired by biological evolution: reproduction, mutation, recombination, and<br />
selection. Candidate solutions to the optimization problem play the role of individuals in a<br />
population, and the fitness function determines the environment within which the solutions<br />
ʺliveʺ. Evolution of the population then takes place after the repeated application of the above<br />
operators.<br />
Both genetic algorithms and genetic programming belong to the group of evolutionary<br />
algorithms. GA and GP are a relatively new form of artificial intelligence developed with<br />
ambitious goal of using computer to create a computational artifact. Both GA and GP are<br />
inspired by Darwinian biological evolution and genetics. Contrary to GA that uses string of<br />
variables to represent the solution, candidate solutions of standard GP deals with tree‐<br />
structured programs (tree) as individuals [8, 9].<br />
Standard scheme of GA and GP is very similar. In Fig. 2 there is a scheme of optimization<br />
process of GP and GA.<br />
62<br />
Perform computer<br />
si mul ati on<br />
Generate output file<br />
for each program in<br />
population<br />
Create initial random<br />
population of programs<br />
Generate input file for<br />
each program in<br />
population<br />
Evaluate fitness of each<br />
program in population<br />
Reproduction<br />
Mutation<br />
Cross-over<br />
End<br />
Desi gnate resul ts<br />
Sati sfactory fi tness l evel ?<br />
Select genetic operation<br />
Figure 2: Optimization process of genetic programming and genetic algorithms
4. Results and discussion<br />
The combined experimental/computational technique described above was used for the<br />
assessment of water vapour diffusion resistance factor of cellular concrete as a function of<br />
relative humidity. The cellular concrete material P2‐350 Lambda produced by Ytong was<br />
chosen for the experiment.<br />
In Fig. 3, there are presented typical relative humidity fields measured within the transient<br />
experiment together with the relative humidity calculated by HEMOT code using the optimised<br />
water vapour diffusion resistance function. Within the computational optimisation, also the<br />
value of water vapour transfer coefficient was fitted, whereas the data presented in Fig. 3 were<br />
calculated for water vapour transfer coefficient equal to 6.76E‐09 s/m (with regard to partial<br />
vapour pressure).<br />
Figure 3: Relative humidity profiles measured within the transient experiment and calculated using<br />
HEMOT code<br />
The water vapour diffusion resistance factor optimised by GRADE algorithm is presented in Fig<br />
4. We can see its high dependence on relative humidity what is crucial for application of<br />
studied cellular concrete in building practice. In case of high relative humidity, the studied<br />
material will allow fast water vapour transport what will consequently lead to its high<br />
moistening related to volume changes, decrement of thermal insulation function etc. Especially<br />
the changes of relative humidity could lead to serious material inner mechanical loading<br />
accompanied by cracking and spalling. On the other hand, the studied material will enable<br />
management of the interior conditions of buildings from the point of view of water vapour<br />
evaporation through the building envelopes based on cellular concrete. In this way, the optimal<br />
life conditions of buildings’ residents will be ensured.<br />
63
64<br />
Figure 4: Water vapour diffusion resistance factor of cellular concrete<br />
The found solution of water vapour diffusion resistance factor was subsequently optimized to<br />
find its mathematical description. This is very important step before applying the genetic<br />
programming directly, i.e. without using GA. The application of GP on the solution will give<br />
brief information about the shape of the curve, its elementary mathematical functions that<br />
create the global function. With that knowledge, the genetic programming can be set up very<br />
efficiently to find solution in quite fast way. In Fig. 5 there is shown a result of symbolic<br />
regression by GP.<br />
Fig. 5: Symbolic regression by genetic programming<br />
The found curve is described using following equation<br />
(1)
For the next research we can state, that the solution of water vapour diffusion resistance factor<br />
as function of relative humidity can be found as polynomial function with high degree. Of<br />
course, such mathematical description is not general for all building materials. It is very likely,<br />
that different materials will have different shape of water vapour diffusion resistance factor<br />
function and therefore new experiments with different materials should be conducted.<br />
To get better result of the optimization, the genetic programing tool should be implemented<br />
directly to the simulation tools, so that we can get results without using genetic algorithm. Such<br />
kind of optimization will decrease the possible error, which is caused be double optimization<br />
process.<br />
5. Conclusions<br />
In this paper, a combined experimental/computational technique for the determination of water<br />
vapour diffusion resistance factor of cellular concrete has been presented and practically tested.<br />
The developed technique allows assessment of water vapour transport properties in<br />
dependence on relative humidity, what is crucial factor for application of building material in<br />
real conditions of buildings. To find the dependence two evolutionary techniques have been<br />
used – genetic algorithms and genetic programming. Whereas the genetic algorithm was able to<br />
find gross solution of the curve defined by 6 isolated points, the genetic programming were able<br />
to find smooth curve with its mathematical description. This is valuable information for the<br />
next research, because having smooth curves of material characteristics will bring better results<br />
to computer simulation of heat and moister transport.<br />
Acknowledgements<br />
This work has been financially supported by the Ministry of Education, Youth and Sports of Czech<br />
Republic, under project SGS12/104/OHK1/2T/11.<br />
References<br />
[1] JIŘIČKOVÁ, M. Application of TDR Microprobes, Minitensiometry and Minihygrometry<br />
to the Determination of Moisture Transport and Moisture Storage Parameters of Building<br />
Materials, CTU Report, vol. 8, no. 2, 2004.<br />
[2] ROELS, S. ‐ CARMELIET, J. ‐ HENS, H. ‐ ADAN, O. ‐ BROCKEN, H. – ČERNÝ, R. –<br />
PAVLÍK, Z. – HALL, CH. – KUMARAN, K. – PEL, L. & PLAGGE, R. Interlaboratory<br />
Comparison of Hygric Properties of Porous Building Materials. In: Journal of Thermal<br />
Envelope & Building Science, Vol. 27, No. 4, 2004, pp. 307‐325.<br />
[3] DRCHALOVÁ, J. ‐ PAVLÍK, Z. ‐ ČERNÝ, R. A Comparison of Various Techniques for<br />
Determination of Moisture Diffusivity from Moisture Profiles. In: Inženýrská mechanika,<br />
2002. vol. 9, no. 1/2, p. 31‐41.<br />
[4] KOČÍ, J. ‐ MADĚRA, J. ‐ ČERNÝ, R. Determination of moisture diffusivity of building materials<br />
by using genetic algorithm In: <strong>Thermophysics</strong> 2010. Brno: University of Technology, 2010, p.<br />
126‐132. ISBN 978‐80‐214‐4166‐8.<br />
65
[5] ČERNÝ, R. Complex System of Methods for Directed Design and Assessment of<br />
Functional Properties of Building Materials: Assessment and Synthesis of Analytical Data<br />
and Construction of the System. Czech Technical University in Prague, CTU Press,<br />
Prague, 2010, 215 p.<br />
[6] KUČEROVÁ, A. Identification of nonlinear mechanical model parameters based on soft<br />
computing methods. PhD thesis, Ecole Normale Supérieure de Cachan, 2007.<br />
[7] Hrnjica, B. (WWW) Homepage of GPdotNET. http://bhrnjica.net/gpdotnet/<br />
[8] CRAMER, N. L. A Representation for the Adaptive Generation of Simple Sequential<br />
Programs”, In: Proc. of the 1st International <strong>Conference</strong> on Genetic Algorithms, L. Erlbaum<br />
Associates Inc., Hillsdale, NJ, USA, 1985, p. 183‐187.<br />
[9] KOZA, J. R. Genetic Programming: On the Programming of Computers by Means of<br />
Natural Selection, MIT Press, 1992.<br />
66
Basic, Mechanical, Thermal, and Hygric Properties of<br />
Autoclaved Aerated Concrete<br />
Dana Koňáková, Monika Čáchová, Martin Keppert, Pavel Reiterman, Eva<br />
Vejmelková, Václav Kočí, Robert Černý<br />
Faculty of Civil Engineering, Czech Technical University in Prague, Thákurova 7, CZ‐166 29,<br />
Prague, Czech Republic<br />
Abstract: This paper focuses on autoclaved aerated concrete (AAC), and the basic, physical, mechanical,<br />
thermal, and hygric properties of selected types of AAC. Major emphasis is put on thermal and hygric<br />
parameters. There is a description of selected attributes, procedures for their measurement and particular<br />
values of selected types of AAC. These parameters are important to know for correct design, composition<br />
of materials in constructions, and also for mathematical analysis of transport models.<br />
Keywords: Autoclaved aerated concrete, physical properties, mechanical properties, thermal properties,<br />
hygric properties<br />
Introduction<br />
Nowadays it is necessary to consider not only materials’ basic and mechanical characteristics,<br />
but also their energy efficiency. Energy efficiency should be one of the main criteria in choosing<br />
building materials. This is the reason for the preference of kinds of materials that have not only<br />
load‐bearing function, but also insulating properties. It usually means porous materials,<br />
because they have better insulating properties than solid ones. The disadvantage of these<br />
porous materials is the decrease of their insulating capabilities in the presence of water. Some<br />
amount of water is present in almost every construction. This is the reason for the measurement<br />
of thermal and hygric properties. Based on this we should be able to predict the behaviour of<br />
materials in a real construction.<br />
In this paper, the studied material is autoclaved aerated concrete. It is one of the most widely<br />
used load‐bearing materials in low‐rise buildings. AAC belongs to the group of lightweight<br />
concrete. It has good insulating properties, and also sufficient strength. The measured<br />
properties of AAC will serve to compare different materials, and also as input data for<br />
mathematical transport models.<br />
Materials<br />
As mentioned above, the studied material is autoclaved aerated concrete. We measured two<br />
kinds, both of them are products of Xella CZ. Their proper names are P1,8 300 and P4 500.<br />
In the Czech Republic, two different kinds of AAC are produced. The difference between them<br />
is the filler—silica sand or silica fume. Both of the materials we studied belong to the first<br />
category, as the filler used was silica sand. A study of the second kind (silica fume AAC) will be<br />
performed next year.<br />
Experimental Methods<br />
Among the basic properties, the bulk density, matrix density and open porosity were measured<br />
by the water vacuum saturation method [1]. Each sample was dried in a drier to remove the<br />
majority of physically bound water. After that, the samples were placed in a desiccator with de‐<br />
67
aired water. Over a period of three hours, the air was evacuated from the desiccator with a<br />
vacuum pump (Figure 1). The specimen was then kept submerged in water not less than 24<br />
hours. From the mass of the water saturated sample and the mass of the immersed water<br />
saturated sample, the volume of the sample is determined, and then the basic physical<br />
parameters are calculated.<br />
68<br />
Figure 1: Vacuum pump with desiccator<br />
One other characteristic important for accurate discussion of transport parameters is<br />
pore structure. It was measured using mercury porosimetry (Figure 2). This special<br />
method is based on capillary depression phenomenon. If a porous material is immersed<br />
in a non‐wetting liquid, only external pressure can force the liquid into the porous<br />
structure. It is then possible to measure the pore diameter from the amount of mercury<br />
and the value of pressure. Then pore size and distribution can also be determined.<br />
Figure 2: Mercury porosimeter<br />
Among mechanical parameters, we focused only on compressive strength. It was<br />
determined by the special loading device MTS 100 kN. The experiment was performed<br />
on dried cube samples, with a loading speed of 1 kN.s ‐1 . The maximum force was<br />
detected, and the dimensions of the samples were also measured. From these values we<br />
determined the compressive strength. We also performed a measurement of<br />
compressive strength on samples that were fully saturated by water for 40 days then<br />
dried before the experiment was performed. These results are in the table designated<br />
ʺwet sampleʺ.<br />
Thermal conductivity as the main parameter of heat transport was measured using the<br />
commercial device ISOMET 2104 (Applied Precision, Ltd.) [3]. The measurement by<br />
ISOMET 2104 (Figure 3) is based on the analysis of the temperature response of the
material to heat flow impulses. The heat flow was induced with an electrical resistor<br />
heater, which had direct thermal contact with the surface of the sample. The<br />
measurements in this paper were done with dependence on moisture content.<br />
Figure 3: ISOMET 2104<br />
Hygric properties are divided into two groups: transport and absorption parameters. In<br />
this thesis only transport parameters were measured.<br />
The transport of liquid water is described by a water absorption coefficient [2]. A<br />
special device was used for its measurement (Figure 4), which included a water tank,<br />
scale, and computer program SETRA COMMUNICATOR. The water absorption<br />
coefficient was determined using a scale to graph the increase in weight depending on<br />
the square root of time—it is the direction of this curve.<br />
Figure 4: Measurement of the water absorption coefficient<br />
The cups method (Figure 5) was used for the measurement water vapour transport<br />
parameters [1]. Changes in the weight of cups are monitored and then the water vapour<br />
diffusion permeability, the water vapour diffusion coefficient, and the water vapour<br />
resistance factor are determined. The cups method includes two different arrangements.<br />
One arrangement is called dry‐cup. On the bottom of the cup is silica gel which creates<br />
zero relative humidity. Second one is wet‐cup, where the water is used instead of silica<br />
gel. So there is almost 99% relative humidity. Above the cups uniform conditions are<br />
constantly maintained (relative humidity 50% and temperature 25°C).<br />
69
70<br />
Figure 5: The cups method<br />
Experimental results and discussion<br />
The experimental results of the basic properties are summarized in Table 1. The<br />
experiment showed that the measured values of bulk density are slightly different than<br />
the values declared by the company. However, the difference is lower than allowed<br />
deviation (50 kg.m ‐3 ). Also, the results of open porosity corroborate the hypothesis that<br />
with decreasing bulk density, porosity grows.<br />
Table 1: Basic properties<br />
Bulk density [kg.m ‐3 ] Matrix density [kg.m ‐3 ] Open porosity [‐]<br />
P1.8 300 305.02 2312.34 0.868<br />
P4 500 501.19 1896.59 0.735<br />
Figure 6: Pore distribution curve<br />
In the following graph the pore distribution curve (Figure 6) is shown. The important thing on<br />
this graph is that material P1.8 300 has a lesser amount of capillary pores than material P4 500.<br />
This information is important for understanding the measured value of water transport<br />
properties.<br />
Experiment results of mechanical properties are higher than declared in the dry case. But the<br />
value of compressive strength decreases after saturating. We hypothesise that it is caused by<br />
drying from a saturated state.
Table 2: Compressive strength<br />
Dry sample Wet sample<br />
[MPa] [MPa]<br />
P1.8 300 2.05 1.69<br />
P4 500 4.60 3.86<br />
As for thermal properties. thermal conductivity dependent on moisture content is presented<br />
here (Figure 7). We see an increasing trend of thermal conductivity with an increased amount of<br />
water. Also. the difference between both kinds of AAC is visible. Material P1.8 300 achieves<br />
lower bulk density and so its insulating properties are better than the other material (P4 500).<br />
Figure 7: Thermal conductivity depending on moisture content<br />
From the final values of water absorption coefficient we can derive that material P4 500 absorbs<br />
water faster than material P1.8 300. The first estimation predicted an inverse result, due to the<br />
higher amount of pores in material P1.8 300. The deciding factor is not the total amount of pores<br />
but mainly their size.<br />
Table 3: Water absorption coefficient<br />
A [kgm ‐2 s ‐1/2 ]<br />
P1.8 300 0.0292<br />
P4 500 0.0491<br />
Water vapour transport properties are summarized in Table 4. It shows that both materials<br />
achieve nearly the same value for these properties. The great difference between dry‐cup and<br />
wet‐cup tests is a normal effect which can also be observed with other kinds of buildings<br />
materials. It is caused by a partial transport of liquid water in the wet‐cup arrangement.<br />
Table 4: Water vapour transport properties<br />
Dry cup Wet cup<br />
δ [s] D [m 2 s ‐1 ] μ [‐] δ [s] D [m 2 s ‐1 ] μ [‐]<br />
P1.8 300 1.68 E ‐11 2.30 E ‐6 10.02 1.03 E ‐11 1.41 E ‐6 1.78<br />
P4 500 1.54 E ‐11 2.11 E ‐6 10.96 9.38 E ‐11 1.29 E ‐6 1.79<br />
71
δ is the water vapour diffusion permeability, D is the water vapour diffusion coefficient and μ<br />
means the water vapour resistance factor.<br />
Conclusion<br />
Autoclaved aerated concrete is a lightweight material. It has porous structure. with a total<br />
porosity of about 80%, but its mechanical properties are sufficient even for a load‐bearing<br />
material. Measurement proved that AAC has excellent insulating properties, but attention must<br />
be paid to the conditions of placement, especially water content and approach.<br />
The main difference between two studied materials is bulk density. P1.8 300 has a lower value,<br />
so it has also less compressive strength and better insulating properties. Its transport of liquid<br />
water is also lower than with P4 500, though both materials have almost the same water vapour<br />
transport characteristics.<br />
Acknowledgement<br />
This research has been supported by the Czech Science Foundation, under grant<br />
SGS12/105/OHK1/2T/11 and SGS10/232/OHK1/3T/11..<br />
References<br />
[1] Roels, S., Carmeliet, J., Hens, H., Adan, O., Brocken, H., Černý, R., Pavlík, Z., Hall, C., [<br />
[2] Kumaran, K., Pel, L. & Plagge, R., Interlaboratory Comparison of Hygric Properties of<br />
[3] Porous Building Materials. Journal of Thermal Envelope and Building Science, 27, pp. 307‐325,<br />
2004.<br />
[4] Kumaran, M.K., Moisture diffusivity of building materials from water absorption<br />
measurements. Journal of Thermal Envelope and Building Science, 22, pp. 349‐355, 1999.<br />
[5] Applied Precision ISOMET (user manual), Bratislava, 1999<br />
72
Simplified modelling of hygric performance of a hysteretic<br />
building material exposed to cyclic changes of relative<br />
humidity<br />
Olga Koronthalyova 1 , Peter Mihalka 1<br />
1 Institute of Construction and Architecture, SAS, Dubravska c 9, SK‐84503 Bratislava, Slovakia,<br />
email:usarkoro@savba.sk<br />
Abstract: Moisture content of a hysteretic porous building material exposed to changing relative<br />
humidity of surrounding air corresponds to the scanning curves between the main adsorption and<br />
desorption curve. Therefore for detailed simulation of the material hygric behaviour the knowledge of<br />
main adsorption/desorption isotherms as well as the scanning curves is necessary. In this work a<br />
simplified approach is used for simulation of hygric performance of hysteretic building material under<br />
cyclic changes of relative humidity. The simplified model is based on concept of ‘mean scanning curve’.<br />
Its advantage is that it simulates the moisture storage of the material from the main hysteretic loop only,<br />
without requirement of experimental scanning curves data. The results obtained by the simplified model<br />
are compared with measurement as well as with the numerical calculation involving the more complex<br />
simulation of hysteretic behaviour, based on Pedersen model. The comparison is done for burnt clay brick.<br />
Based on analysis of the results, the capability of the simplified model is discussed.<br />
Keywords: Hygric performance, sorption hysteresis, simplified model, ceramic brick<br />
1. Introduction<br />
In simulations of hygrothermal performance of a building structure actual moisture content of<br />
building materials is most frequently calculated using the main adsorption isotherm or the<br />
mean between the adsorption and desorption curve. However, in real circumstances, materials<br />
in building structures are exposed to changing boundary conditions and due to hysteretic<br />
effects their actual moisture content corresponds to the scanning curves between the adsorption<br />
and desorption isotherm. The reasons, why the sorption hysteretic effects are not commonly<br />
involved in hygrothermal simulation tools are as follows:<br />
There is lack of available scanning curves data of building materials,<br />
Integration of a model of hysteretic behaviour into simulation tools would make the existing,<br />
rather complex models, even more complex and time consuming.<br />
In this work a simplified approach is used for the simulation of hygric performance of<br />
hysteretic building material under cyclic changes of relative humidity (RH). The simplified<br />
model is based on concept of ‘mean scanning curve’. Its advantage is that it simulates the<br />
moisture storage of the material from the knowledge of the main hysteretic loop only, without<br />
requirement of experimental scanning curves data. In the previous work [1], a possibility of the<br />
prediction of the scanning isotherms in the hygroscopic range by two algorithms – Slope [2] and<br />
Mualem [3] was analysed and it was concluded that both these algorithms gave acceptable<br />
coincidence between the experimentally determined and predicted steady‐state scanning curves<br />
in case of ceramic brick and autoclaved aerated concrete. In the paper [4], Slope algorithm was<br />
used for the prediction of the ‘mean scanning curve’ in simplified modelling of hygric<br />
performance of building material under cyclic changes of RH. In this paper the capability of<br />
simplified model using the Mualem algorithm for the prediction of the ‘mean scanning curve’ is<br />
73
analysed. The results obtained by the simplified model are compared with measurement as well<br />
as with the numerical calculation involving the more complex simulation of hysteretic<br />
behaviour, based on Pedersen model [5]. The comparison is done for burnt clay brick exposed<br />
to cyclic changes of RH between 30 and 85 %.<br />
2. Experimental part<br />
The measurements were done for a ceramic brick. The tested brick is commonly used burnt clay<br />
brick produced by Slovak manufacturer. Its basic material parameters ‐ bulk density, total open<br />
porosity and capillary moisture content as well as water vapour sorption isotherms were<br />
determined in the previous work [1]. The water vapour main adsorption and desorption<br />
isotherms as well as the scanning curves were determined by the standard gravimetric<br />
desiccator method, which consists in conditioning the samples in desiccators under constant<br />
relative humidity (RH) and temperature (23°C) until the static equilibrium is achieved [6]. The<br />
water vapour resistance factor was measured by the standard dry‐cup (0 – 53% RH – silica‐gel<br />
and climatic chamber) and wet‐cup (100 – 53% RH ‐ water and climatic chamber) methods [7].<br />
Dynamic test consisted in monitoring mass changes of the brick samples exposed to changing<br />
RH in climatic chamber. The test was performed with 7/17 hours changes between 84.5 and 26.5<br />
% RH. The temperature during the tests was kept at a constant value of 23.0 ± 0.5 °C. The<br />
relative humidity and temperature in the climatic chamber were registered in one minute<br />
intervals. Simultaneously three brick specimens with the dimensions of 100.8 x 101.9 x 26.38<br />
mm, 101.8 x 101.6 x 24.23 mm and 101.2 x 101.6 x 26.04 mm were tested. The specimens were<br />
sealed on all but two surfaces by the epoxy resin in order to guarantee 1D water vapour flow.<br />
The mass of the samples was weighed in the chosen time intervals by the electronic balance<br />
with the accuracy 0.01g. The air flow velocity near the samples varied between 0.20 and 0.30<br />
m/s. Based on the similarity relations and the Lewis relation the value of the surface film<br />
coefficient for diffusion β = 5.6.10 ‐8 s/m was determined, which was used in simulations.<br />
After finishing the dynamic test the samples were oven dried at temperature of 105°C in order<br />
to determine their dry mass and moisture content during the test.<br />
3. Simulation of hysteretic behaviour<br />
A conceptual model of hysteresis has been suggested by Mualem [3]. It is based on Neel’s<br />
similarity hypothesis and Everett’s independent domain model. Based on the previous results<br />
[1], the partial hysteretic loop formed by the main adsorption curve and the desorption<br />
isotherm from 98% RH is used for a prediction of the scanning curves inside this loop. From the<br />
point of view of the Mualem model it means that the independent domain theory is not applied<br />
to the whole porous body but only to the part of the body where the assumption of the domains<br />
independency can be better fulfilled. In the suggested simplified approach the ‘mean scanning<br />
curve’ for the considered RH interval is determined as a mean of the 1st scanning desorption<br />
and the 1st scanning adsorption curve. According to the Mualem model the moisture content<br />
during desorption, after the RH path φmin → φ1 (i. e. after 1 processes of adsorption) is expressed<br />
by the relation (1) and during adsorption, after the RH path φmin → φ1 → φ2 (i. e. after 1<br />
processes of adsorption and 1 processes of desorption) is expressed by the relation (2):<br />
udes(<br />
)<br />
uads(<br />
)<br />
u(<br />
)<br />
uads(<br />
)<br />
( uads(<br />
1<br />
) uads(<br />
))<br />
<br />
(1)<br />
u u ( )<br />
74<br />
max<br />
ads
udes(<br />
2<br />
) uads(<br />
2<br />
)<br />
u(<br />
)<br />
uads(<br />
)<br />
( uads(<br />
1<br />
) uads(<br />
))<br />
<br />
(2)<br />
u u ( )<br />
max<br />
Where u is the moisture content (m 3 /m 3 ), φ is the relative humidity (‐), φmin is the starting RH (‐);<br />
(φmin ≈ 0), uads is the moisture content corresponding to main adsorption curve, udes is the<br />
moisture content corresponding to main desorption curve, umax is the maximum moisture<br />
content; (in the used procedure with partial hysteretic loop umax corresponds to moisture content<br />
at RH = 0.98).<br />
The first scanning desorption and adsorption curves are estimated according to the relations (1)<br />
and (2) respectively, where φ1 and φ2 correspond to the maximum and minimum of RH during<br />
the cyclic changes of RH. The main adsorption and the desorption isotherm from 98% RH are<br />
approximated by the relation of van Genuchten type:<br />
n<br />
2<br />
ads<br />
n1<br />
ln <br />
u(<br />
) A <br />
<br />
1 <br />
<br />
<br />
B <br />
(3)<br />
<br />
or by its modified version [1]:<br />
n<br />
2<br />
n1<br />
ln( 0.<br />
02)<br />
<br />
u(<br />
) A <br />
<br />
1<br />
<br />
<br />
<br />
<br />
B <br />
(4)<br />
<br />
<br />
Where A, B, n1, n2 are parameters (Tab. 1)<br />
The ‘mean scanning curve’ related to the considered RH interval is described by van Genuchten<br />
equation (3) and its parameters are obtained by fitting the mean curve between scanning<br />
desorption and adsorption curve. The process of the ‘mean scanning curve’ estimation is<br />
illustrated in Fig.1 for the ceramic brick and φ1 = 85%; φ2 = 30%. The used parameters of the van<br />
Genuchten equations are presented in Tab. 1.<br />
Table 1: Parameters of van Genuchten equations for tested ceramic brick<br />
A [m3 /m3 ] B n1 n2 Equation<br />
Main adsorption 0.07056 0.037 2.0 0.35088 (4)<br />
Desorption from 98% RH 0.07056 0.06 1.22 0.33898 (4)<br />
Mean scanning curve (RH<br />
between 30 and 85%)<br />
0.37 0.00058 1.0 0.471 (3)<br />
The numerical simulation of the hygrothermal performance of the tested brick was done by<br />
simulation tool NEV3M. It is a modification of the former 1‐D simulation tool NEV3 [8], based<br />
on the solution of two coupled equations for heat and moisture transfer.<br />
With the aim to evaluate the suggested simplified approach, the additional simulation, based on<br />
more complex description of hysteretic behaviour was done. For this purpose Mihalka 1D<br />
simulation tool for calculation of heat and water vapour transfer [9] was applied. Mihalka tool<br />
is able to take into account the hysteretic effects due to the integration of Pedersen empirical<br />
2<br />
75
76<br />
Figure 1: Illustration of generation of ‘mean scanning curve’ (ceramic brick, RH interval 30‐85%)<br />
model [5] into the numerical calculation. In Pedersen model the moisture content in time (N+1)<br />
is calculated according to equation (5):<br />
u N<br />
( N<br />
1 ) u(<br />
N ) C (<br />
N1<br />
)<br />
(5)<br />
The term C is given by equation (6) during the process of adsorption:<br />
j<br />
C <br />
ads<br />
(<br />
u u<br />
ads<br />
2 dudes<br />
<br />
) <br />
( u u<br />
d<br />
<br />
<br />
( u u<br />
2<br />
)<br />
des<br />
ads<br />
des<br />
2 duads<br />
<br />
) <br />
d<br />
<br />
<br />
and during the process of desorption is given by equation (7):<br />
C<br />
( u<br />
<br />
u<br />
ads<br />
)<br />
2<br />
dudes<br />
<br />
jdes<br />
( u u<br />
d<br />
<br />
<br />
( u u<br />
2<br />
)<br />
des<br />
ads<br />
des<br />
)<br />
2<br />
duads<br />
<br />
<br />
d<br />
<br />
<br />
Where jads, jdes are parameters, fitted according to the measured first adsorption and desorption<br />
scanning curves. In the considered case, calculations were done with jads = jdes = 0.7 and jads = jdes =<br />
0.95.<br />
4. Results and discussion<br />
The basic material properties of the ceramic brick as well as its water vapour resistance factor<br />
values (μ) are in Table 2.<br />
In the numerical simulations the water vapour resistance factor moisture dependence was<br />
approximated by the relation (8):<br />
(6)<br />
(7)
1<br />
(<br />
)<br />
(8)<br />
a b<br />
exp( c <br />
)<br />
Where a, b, c are parameters: a = 0.072, b = 0.0028 and c = 4.66.<br />
Table 2: Basic material properties and water vapour resistance factor values of tested ceramic brick<br />
Bulk density<br />
[kg/m3 Open Capillary moisture<br />
] porosity [‐] content [m3 /m3 μ (dry cup) μ (wet cup)<br />
]<br />
[‐]<br />
[‐]<br />
1370 0.42 0.37 12.0 5.9<br />
A comparison between the calculated and measured time course of the specimen mass during<br />
the dynamic test is shown in Fig. 2 (specimen 2), Fig. 3 (specimen 3) and Fig. 4 (specimen 1).<br />
Besides the calculation using the simplified model with “mean scanning curve” evaluated<br />
according to the Mualem algorithm, results of calculation using as the moisture storage function<br />
the main adsorption curve, desorption curve from 98% RH, “mean scanning curve” evaluated<br />
according to the Slope algorithm [4] as well as calculation done by Mihalka simulation tool are<br />
presented. The obtained maximum and minimum values of moisture content during the quasi<br />
steady‐state period of dynamic test are presented in Tab. 3.<br />
Table 3: Obtained maximum and minimum values of average moisture content of tested bricks<br />
umax [m 3 /m 3 ] of specimen umin [m 3 /m 3 ] of specimen<br />
1 2 3 1 2 3<br />
Main adsorption 0.0153 0.0153 0.0158 0.0073 0.0073 0.0071<br />
Desorption from 98% 0.0305 0.0304 0.0309 0.0209 0.0209 0.0207<br />
Measured 0.0188 0.0177 0.0197 0.0116 0.0117 0.0124<br />
Simplified Mualem 0.0178 0.0177 0.0182 0.0102 0.0103 0.0101<br />
Simplified Slope 0.0198 0.0198 0.0202 0.0129 0.0129 0.0128<br />
Mihalka Pedersen j = 0.7 0.0185 0.0184 0.0191 0.0111 0.0111 0.0114<br />
Mihalka Pedersen j = 0.95 0.0176 0.0176 0.0181 0.0097 0.0097 0.0096<br />
It is obvious that the use of the main adsorption curve underestimates and the use of desorption<br />
curve from 98% RH overestimates the calculated moisture content of the bricks. The coincidence<br />
between the measured results and the results obtained by both of the simplified models are<br />
acceptable. However, the obtained agreement is different for the particular specimens (Tab. 3,<br />
Fig. 2‐4). It can be partly explained by the tested material non homogeneity and by the fact that<br />
the calculated specimen moisture content/mass is very sensitive to the moisture storage<br />
function used. Generally the results obtained by using the Mualem algorithm give slightly<br />
underestimated values of moisture content while the results obtained by using the Slope<br />
algorithm are slightly overestimated ones. The results of dynamic test simulation also confirm<br />
that in a simplified model the processes of adsorption and desorption can be described by the<br />
same moisture storage function. The results obtained by Mihalka simulation tool are dependent<br />
on the value of the used empirical parameters jads, jdes (Tab. 3, Fig. 4). In the case of using jads = jdes<br />
= 0.7, the coincidence between the measured and calculated moisture content is very good.<br />
77
78<br />
Figure 2: Comparison between the measured and simulated time course of the specimen mass during<br />
dynamic test (specimen 2)<br />
Figure 3: Comparison between the measured and simulated time course of the specimen mass during<br />
dynamic test (specimen 3)
Figure 4: Comparison between the measured and simulated time course of the specimen mass during<br />
dynamic test (specimen 1)<br />
In case of using jads = jdes = 0.95 the obtained coincidence is similar or slightly worse than for the<br />
simplified calculation with Mualem algorithm (Tab. 3, Fig. 4).<br />
Conclusions<br />
The capability of simplified model using the Mualem algorithm for the prediction of hygric<br />
performance of a ceramic brick under cyclic changes of relative humidity is evaluated. The<br />
evaluation consists in the comparison with the experimental results as well as with the results<br />
of the more complex simulation based on Pedersen model of hysteretic behaviour and the<br />
previous results of simplified modelling, based on Slope algorithm.<br />
Taking into account the sensitivity of the calculated moisture content to the used moisture<br />
storage function, the agreement between the results of simplified model using the Mualem<br />
algorithm and experiment is satisfactory and comparable with the one of simplified model<br />
using the Slope algorithm. The advantage of the used approach is that it doesn’t need the<br />
knowledge of scanning adsorption and desorption curves. However, for the more general<br />
conclusions regarding its applicability, further tests, covering other ranges of relative humidity<br />
and different types of building materials should be performed.<br />
Acknowledgments<br />
This research was supported by the Slovak Grant Agency VEGA (Grant No. 2/0159/10).<br />
References<br />
[1] Koronthalyova O. Water vapour sorption of building materials – modelling of scanning<br />
curves. In <strong>Proceedings</strong> of the 9th Nordic Symposium on Building Physics, NSB 2011, Editors: J.<br />
Vinha, J. Piironen, K. Salminen, Department of Civil Engineering, Tampere University of<br />
Technology, Tampere, Finland 2011, p. 655‐662, ISBN 978‐952‐15‐2573‐5.<br />
79
[2] Jaynes D. B. Comparison of soil‐water hysteresis models, In Journal of Hydrology, Vol. 75<br />
(1984/1985): 287‐299.<br />
[3] Mualem Y. A Conceptual Model of Hysteresis, In Water Resources Research, 1974, Vol. 10<br />
(No 3) 1974: 514‐520.<br />
[4] Koronthalyova O. and Mihalka P. Hygric performance of ceramic brick exposed to<br />
dynamic boundary conditions, In Technical transactions – Czasopisno techniczne, <strong>2012</strong>, in<br />
press.<br />
[5] Pedersen C. R. Combined Heat and Moisture Transfer in Building Constructions. PhD Thesis,<br />
Thermal Insulation Laboratory, Technical University of Denmark 1990.<br />
[6] EN ISO 12571:2000 Hygrothermal performance of building materials and products ‐<br />
Determination of hygroscopic sorption properties.<br />
[7] EN ISO 12572:2001 Hygrothermal performance of building materials and products ‐<br />
Determination of water vapour transmission properties.<br />
[8] Koronthalyova O. and Matiasovsky P. Factors Influencing Correctness of the Simulation<br />
Model of the Building Structures Hygrothermal Behaviour. In New Requirements for<br />
Materials and Structures, Editors: V. Broza, R. Cerny, B. Kubat and J. Witzany, Czech<br />
Technical University, Prague 1998, p.160‐165, ISBN 80‐01‐01838‐5.<br />
[9] Mihalka P. et al. Simulation of hysteretic behavior at dynamic moisture response. In<br />
<strong>Thermophysics</strong> 2008, Editors: J. Leja and S. Prváková, Bratislava, Vydavatelstvo STU 2008,<br />
p. 110‐118, ISBN 978‐80‐227‐2968‐0.<br />
80
Calcite influence on the thermal diffusivity of ceramic samples<br />
in the temperature range 25 – 600°C<br />
Jozef Kováč 1 , Anton Trník 1,2 , Igor Medveď 1,2<br />
1Department of Physics, Constantine the Philosopher University, 94974 Nitra, Slovakia email:<br />
jozef.kovac@ukf.sk<br />
2Department of Materials Engineering and Chemistry, Czech Technical University, 16629<br />
Prague, Czech Republic<br />
Abstract: This paper deals with the influence of calcite on the thermal diffusivity of a ceramic material.<br />
Calcite is usually a part of ceramic bodies and, therefore, it is important to understand its effect on the<br />
properties of ceramic materials. The measurements were carried out by the flash method. The analyzed<br />
ceramics samples were prepared with a calcite admixture of 0, 10, and 20 mass %. The temperature<br />
dependencies of the coefficient of thermal diffusivity up to 600 °C were obtained and their discussion is<br />
provided.<br />
Keywords: thermal diffusivity, calcite, flash method.<br />
1. Introduction<br />
The ceramic materials have currently a broad range of applications. The ceramic on a kaolin<br />
base is used mainly in electrotechnical, building, and chemical industries. Ceramic materials<br />
contain various amounts of composites one of which can be calcite. Calcite is one of the most<br />
important carbonate minerals. It occurs in a seemingly unlimited variety of shapes and colors.<br />
An addition of calcite into ceramic materials may change some properties of materials so that it<br />
is of great importance to study these effects. In this paper, we focus on its effect on the thermal<br />
diffusivity.<br />
2. The flash method<br />
We used the flash method to measure the thermal diffusivity of the studied materials. The flash<br />
method is based on the measurement of thermal response of a material whose part is heated by<br />
a short thermal impulse. The impulse energy is absorbed in the material only within a thin layer<br />
of width g, while the rest of it remains thermally unaffected. The theoretical description is based<br />
on an approximation given by the one‐dimensional heat equation. It is assumed that there is no<br />
thermal flux through the material ends.<br />
In the limit of a very small g, the time evolution of the temperature at the end of the sample that<br />
was not subject to the impulse is given as [1]<br />
<br />
<br />
<br />
Q<br />
at<br />
T , (1)<br />
n<br />
2 2<br />
t 1<br />
2 1 exp<br />
n 2 <br />
ce<br />
<br />
n1<br />
e <br />
where Q is the impulse energy flux, ρ is the material density, c is the heat capacity, and e is the<br />
sample thickness. After a sufficient time period (in the limit t → ∞) and under the assumption<br />
that no heat losses occur, the temperature becomes stationary at a value Tlim. The ratio of the<br />
temperature rise and the final temperature limit is [2, 3]<br />
81
82<br />
T<br />
T<br />
e, t<br />
lim<br />
<br />
1<br />
2<br />
<br />
<br />
n1<br />
n<br />
2 2<br />
1 expn<br />
<br />
, (2)<br />
where ω is the dimensionless time defined as<br />
at<br />
. (3)<br />
2<br />
e<br />
The time dependence of the relative temperature increase as given by Eq. (2) is shown in Fig. 1.<br />
It was used by Parker et al [2] to introduce a simple way to calculate the thermal diffusivity a.<br />
Namely, one determines the time, t0.5, at which T(t) is the half of Tlim. Then ω = 0.1388, yielding<br />
2<br />
e<br />
a 0.<br />
1388 . (4)<br />
t<br />
0.<br />
5<br />
Figure 1: The relative temperature increase from Eq. (2) in dependence on the dimensionless time ω.<br />
3. Measurement apparatus<br />
The basic part of the measurement apparatus is a source of radiation with an adjustable flash<br />
period. We used a xenon flash lamp as the source. An iris is located between the lamp and a<br />
sample; it shields away the scattered radiation from the lamp and ensures a more uniform<br />
distribution of the thermal impulse on the sample surface. The impulse period is regulated<br />
software‐wise via an impulse unit. A thermocouple is attached to the other end of the sample. It<br />
measures the time dependence of the temperature response to the impulse. A reference sample<br />
(not subject to an impulse) is used in the apparatus in order to increase the sensitivity of the<br />
measurements. The reference sample temperature is also recorded by a thermocouple. Both<br />
thermocouples are connected differentially so that the temperature difference between the<br />
measured and reference sample is actually recorded. Besides the sensitivity enhancement this<br />
configuration of the apparatus eliminates possible undesirable effects on the measurement that<br />
affect both samples in an equal manner. The voltage difference on the thermocouples of both<br />
samples is recorded by a digital device from which the data is directly transferred to a<br />
computer.<br />
In order to measure the dependence of the thermal diffusivity on the temperature, the<br />
measurement apparatus was placed in a furnace. The furnace temperature was regulated by an<br />
adjustable voltage source, and it was set to a value ranging from the room temperature to 600<br />
°C, using 13 different values within this interval. At each of these temperatures every sample
was measured several times (after the conditions settled down after an impulse) so that a<br />
statistical evaluation and measurement errors could be obtained.<br />
4. Samples<br />
We analyzed three samples (denoted as A, B, and C) whit the composition given in Tab. 1. The<br />
filler was made of clay fired to 1000 °C at the heating rate 10 °C.min –1 and lasting 90 min at the<br />
maximal temperature. Calcite contains above 99.5 % of CaCO3. The samples for the<br />
measurement of the thermal diffusivity were made from these materials. The samples had a<br />
cylindrical shape with the diameter 12 mm and thickness 1.3 mm.<br />
5. Experimental results<br />
Table 1: Composition of the samples<br />
Sample Clay Filler Calcit<br />
A 60 % 40 % –<br />
B 60 % 30 % 10 %<br />
C 60 % 20 % 20 %<br />
The temperature dependence of the thermal diffusivity a for the studied materials was obtained<br />
from our measurements that are given in Fig. 2. They show that the thermal diffusivity<br />
decreases with an increasing temperature.<br />
In the case of sample A the first rapid decrease (from 2.54 10 –7 to 2.07 10 –7 m2 .s –1 ) is evident at<br />
the temperatures below 100 °C. It corresponds to the evaporation of physically bound water in<br />
the samples. An initial quite rapid decrease is slowly reduced, and from about 350 °C our<br />
measurements show that the decrease stopped and a value of the thermal diffusivity is<br />
approximately constant (1.73 10 –7 m2 .s –1 ).<br />
For sample B the effect of evaporation of physically bound water is not visible. The rapid<br />
decrease of the thermal diffusivity is visible at the temperatures about 550 °C. In this case<br />
dehydroxylation occurs in the sample, i.e., kaolinite undergoes the structural transformation<br />
into metakaolin.<br />
In the case of sample C the first decrease (from 2.73 10 –7 to 2.30 10 –7 m2 .s –1 ) is evident at the<br />
temperature below 100 °C, like for sample A. It is caused by the evaporation of physically<br />
bound water in the sample again. The second rapid decrease is evident at temperature range<br />
from 300°C (2.17 10 –7 m2 .s –1 ) to 400 °C (1.86 10 –7 m2 .s –1 ).<br />
The effect of dehydroxylation is evident for sample B at the temperature 500 °C. The basic<br />
structure of kaolinite consists of tetrahedral layers 2<br />
2 5 O Si<br />
2<br />
and octahedral layers<br />
2 4 OH Al [4]. The chemical reaction of dehydroxylation can be formally described by the<br />
equation Al2O 3.2SiO2.2H2O<br />
Al2O<br />
3.2SiO2<br />
2H 2O<br />
[4]. During this reaction water (which<br />
was previously bound) is released. It is generally accepted [5] that dehydroxylation occurs at<br />
about 420 °C. This means that the decrease of the thermal diffusivity of samples A and C at the<br />
temperature about 350 °C is not caused by this effect.<br />
83
6. Conclusion<br />
84<br />
Figure 2: The thermal diffusivity of samples A, B, C.<br />
The comparison of samples A, B, and C shows that the addition of calcit in the material<br />
causes an increase in the value of the thermal diffusivity. The increase of thermal<br />
diffusivity is about 12 % at the temperature range from 100 to 500 °C. The difference of<br />
the thermal diffusivity at temperature range from 500 to 600 °C is not significant.<br />
Acknowledgement<br />
This research was supported by grants UGA VI/15/<strong>2012</strong> and VEGA 1/0646/12. Authors A.T. and<br />
I.M. gratefully acknowledges the financial support of the Czech Science Foundation, Project No.<br />
P105/12/G059.<br />
References<br />
[1] VOZÁR, L. Flash method for thermal diffusivity measurement. Theory and praxis. CPU, Nitra,<br />
2001, ISBN 80‐8050‐362‐1<br />
[2] PARKER, W. J. – JENKINS, R. J. – BUTLER, C.P. – ABBOTT, G.L. Thermal Diffusivity<br />
Measurement Using the Flash Technique. In J. Appl. Phys. 32. p. 1679‐1684. 1961.<br />
[3] TROITSKY, O. Y. – RYAZANOV, V. I. In‐situ measurement of thermophysical properties<br />
by means of the flash technique. In High Temperatures – High Pressures 32. p. 389‐392. 1991.<br />
[4] ŠTUBŇA, I. – TRNÍK, A. – VARGA, G. Dehydroxylácia kaolinitu – krátky prehľad. In<br />
Silikátnik 2006, Slovenská silikátová vedecko‐technická spoločnosť 2006.<br />
[5] ŠTUBŇA, I. – VARGA, G. – TRNÍK, A.: Investigation of kaolinite dehydroxylation is still<br />
interesting. In: Építőanyag 58. p. 6‐9. 2006.
Monitoring of the temperature‐moisture regime of the wall of<br />
St. Martin Cathedral tower in Bratislava<br />
Ľudovít Kubičár, Danica Fidríková, Vladimír Štofanik<br />
Institute of Physics SAS, Dúbravska cesta 9, 845 11 Bratislava, Slovakia,<br />
kubicar@savba.sk<br />
Abstract: Historic monuments are subject to degradation due to exposition to surrounding<br />
meteorological conditions and groundwater. Degradation is most often manifested by deterioration of<br />
plaster, walls structure or building elements. Processes like moisture diffusion, saturation and drying;<br />
freezing and thawing belong to control mechanisms of the degradation. Long term monitoring of the<br />
tower of St. Martin Cathedral in Bratislava have been performed under window sill of the belfry in<br />
exterior in three orientation, in north, south and west. Monitoring has been carried out in plaster and in<br />
the masonry in a distance about 10 cm from the wall surface. The hot‐ball method is used for measuring<br />
thermal conductivity. The thermal conductivity of the porous system depends on the pore content.<br />
Monitored data are correlated to the meteorological data. Details of various effects will be discussed.<br />
Keywords: Monitoring, Temperature – moisture regime, Moisture sensor, St. Michal’s Cathedral in<br />
Bratislava<br />
1. Introduction<br />
Buildings consist of components that have a porous structure. Such objects, in real<br />
environments, are attacked by atmospheric moisture, precipitation, wind, solar radiation and<br />
groundwater [1]. The absorption and transport of water in porous materials combined with the<br />
effects of air/vapour movement through structures are complex processes. Understanding the<br />
moisture content of a building structure, its distribution and temporal variation is crucial for the<br />
prediction of porous material decay [2 ‐ 5]. Therefore, the issue of moisture monitoring started<br />
to have high priority in various branches of civil engineering, especially in the field of<br />
preservation and restoration of historic structures.<br />
Several authors deal with the issue of historic monuments deterioration. Saas and Viles studied<br />
spatial distribution of moisture and its time variations in ruined walls [3]. Kramer et al analyzed<br />
the effect of interior operating conditions on historic building enclosure components [4].<br />
Bruggerhoff et al. studied water circulation in stones of the wall of the Saint‐Gatien Cathedral in<br />
Tours [5]. The results have shown that water transport through porous structure is a complex<br />
process where a set of environmental factors have to be considered to obtain picture on the<br />
deterioration processes.<br />
The measurement of moisture in walls to be monitored uses sensors based on different<br />
principles. Most sensors are based on electrical or electromagnetic principles [6 ‐ 8]. This paper<br />
discusses the design of moisture sensor based on the principle of measuring the thermal<br />
conductivity of porous structures.<br />
St. Martin Cathedral is the largest and the oldest church in Bratislava (Figure 1a). The frame of<br />
the tower is built of dimension stones. The space in frame is filled with bricks. Masonry wall<br />
thickness of the tower is 1.5 m. Wall surface was originally plastered. The most deteriorated<br />
parts were just below the window sill, where plaster together with the surface bricks is heavily<br />
85
damaged (see Figure 1c). During reconstruction works moisture sensors were placed in a depth<br />
of up to 60 mm in the surface bricks and in plaster. Fig. 1b shows positions of the sensors just<br />
below the window sill. Connecting cables are led into the tower to the monitoring instruments<br />
RTM (Transient MS).<br />
c<br />
a<br />
b<br />
Figure 1: View of the St Martin’s Cathedral in Bratislava from the west (a), localization of the sensors (b),<br />
photo of the deteriorated area in the north part and fixing of the sensing element to the wall surface before<br />
plastering (c)<br />
2. The principle of the moisture sensor<br />
Principle of the moisture sensor is based on the measurement of thermal conductivity of porous<br />
structure. The thermal conductivity of porous structure is a function of the matrix and the<br />
content of pores, its volume and percolation paths. In real environment, the pores can be filled<br />
with air / vapour, water or ice, depending on the thermodynamic state and the surrounding<br />
conditions. Estimation of the expected changes in the effective thermal conductivity due to<br />
water or dry air in pores can be made by using Maxwell model that for two components<br />
composite has a form [8]<br />
86<br />
22w 2<br />
2 1 1 2 1<br />
eff<br />
<br />
(1)<br />
2<br />
w<br />
2<br />
1<br />
1<br />
2<br />
1<br />
where λeff is the effective thermal conductivity of porous system, λ1 is thermal conductivity of<br />
the pore content, λ2 is the thermal conductivity of the matrix and w1 is the porosity. Equation (1)<br />
helps in sensor design. It gives an estimate of how far we are from the theoretically achievable<br />
change in the measured signal when the effective thermal conductivity of dry and water<br />
saturated state of porous material is, alternatively, measured.<br />
3. Experiment<br />
We use a hot‐ball method for measuring thermophysical properties [9]. The method uses a<br />
small ball that generates a transient temperature field in the porous material and<br />
simultaneously it measures its own temperature. Then the ball temperature is a measure of the<br />
thermal conductivity. One obtains the following working equation of the measuring method [9]:<br />
r<br />
q0<br />
(2)<br />
4<br />
b m T
where qo is the heat output of the hot‐ball havin radius rb and Tm is the stabilized value of the<br />
temperature response.<br />
A hot‐ball sensing element is shown in Figure 2a. The element has been constructed of two<br />
components, a heater and a thermistor. Both components are fixed in the ball using epoxy resin.<br />
The diameter of the ball ranges from 1.8 mm to 2.3 mm.<br />
a<br />
b<br />
Figure 2: Photo of hot‐ball sensing element (a) and moisture sensor (b)<br />
Moisture sensor made of a borehole core has a cylindrical shape with a diameter of 20 mm and<br />
same length. A small hole is drilled in the axis of the cylinder with a diameter of about 2 mm in<br />
order to fix the hot‐ball. The hot‐ball alone is fixed by epoxy resin. The final form of the<br />
moisture sensor is shown in Figure 2a. A RTM device (Transient MS) is used for monitoring. In<br />
practice the moisture sensor is calibrated.<br />
Figure 1b shows areas of the wall of cathedral tower where sensors are placed. Two areas in<br />
every orientation were chosen at points where window sills ended. The chosen areas belong to<br />
the most attacked ones by atmospheric actions (precipitation, wind, sun radiation). Water<br />
diffuses into the masonry just at the edge of window sills. Therefore, the most intensive<br />
destruction of plaster and bricks was found just in these areas.<br />
Only 3 RTM devices, one at each orientation, were used. So, full‐time monitoring was<br />
performed only for three sensors. When memory of device becomes full, data is transferred via<br />
the USB channel to Laptop. During period of data transfer the sensor functionality is checked. A<br />
measurement for sensors that were not connected with RTM device is performed to find<br />
changes of local temperature and moisture. Then RTM device was reconnected to another<br />
sensor depending on the importance of the observed phenomena. Thus, information about the<br />
temperature‐moisture regime of the tower wall was collected, consisting of individual<br />
measurements and monitoring data files.<br />
4. Results and discussion<br />
Monitoring covered the period from August 19, 2011 to March 30, <strong>2012</strong>. A large data set was<br />
obtained during this period. The data files selected for presentation belong to the sections that<br />
characterize “life history” of the tower under environmental impact (Figure 3a). Data include<br />
plaster setting period that takes nearly up to 14.10.2011 and a period where plaster structure<br />
and fixation of moisture sensor in the wall was stabilized. Moisture has started to increase after<br />
10.3.<strong>2012</strong> due to growth of environmental temperature. Such strong moisture changes indicate<br />
an intense moisture redistribution in the wall structure.<br />
87
Moisture [a.u.]<br />
88<br />
210<br />
200<br />
190<br />
180<br />
170<br />
160<br />
150<br />
140<br />
130<br />
120<br />
110<br />
Nord - wall<br />
19.8.2011<br />
16.9.2011<br />
14.10.2011<br />
11.11.2011<br />
9.12.2011<br />
6.1.<strong>2012</strong><br />
3.2.<strong>2012</strong><br />
2.3.<strong>2012</strong><br />
30.3.<strong>2012</strong><br />
30<br />
25<br />
20<br />
15<br />
10<br />
5<br />
0<br />
-5<br />
-10<br />
Temperature [ o C]<br />
a<br />
b<br />
Figure 3: Data collected by monitoring of the temperature – moisture regime of the tower of St. Martin<br />
Cathedral in Bratislava (a) and a detail of the transport in plaster (b). Violet bands indicate precipitation<br />
periods.<br />
Rainy periods are indicated by violet bands in the graphs. The rise in the moisture can be found<br />
in both in plaster and the walls just after rain. Intensity of this rise depends on orientation and<br />
on locality of the sensor. Delay of the moisture rise is evident depending on position of sensor<br />
in plaster or in wall.<br />
Detail in the transport dynamics of moisture in plaster after precipitation is shown in Figure 3b.<br />
On September 19, <strong>2012</strong> after 13:00 a heavy storm occurred that was accompanied by south ‐<br />
westerly wind. The temperature plummeted from 26 o C to 13 o C. After a storm, the weather<br />
gradually improved, as it is illustrated by the rise of the temperature cycle of day / night.<br />
Moisture was gradually transported from the surface into the interior of the plaster. After<br />
reaching a sufficient level, moisture cycles began to emerge that are correlated to the<br />
temperature cycles. Moisture maximum in the vicinity of the sensor occurred within 7 days<br />
from the storm.<br />
5. Conclusions<br />
Sensors for monitoring of temperature ‐ moisture regime were placed in the tower of the St.<br />
Martin’s Cathedral in Bratislava during restoration works. Sensors are placed in plaster and<br />
masonry walls in areas subjected to intense deterioration. Total 11 sensors were placed in the<br />
northern, southern and western masonry walls and plaster.<br />
A new principle of a sensor for monitoring of moisture in the masonry walls of buildings is<br />
presented. The moisture sensor utilizes changes of thermal conductivity of porous structure<br />
when pores are filled by air/vapour, water or ice depending on thermodynamic conditions. A<br />
hot ‐ ball method is used for measuring thermal conductivity. The moisture sensor is calibrated<br />
for dry and water saturated stage. Then moisture sensor can be placed back into the wall<br />
structure to ensure that porous structure of both the sensor and the wall are identical. In the<br />
case of plaster the ball is fixed during plasterwork.<br />
Acknowledgments<br />
Moisture [arb. unit]<br />
9.4<br />
9.2<br />
9.0<br />
8.8<br />
8.6<br />
8.4<br />
8.2<br />
8.0<br />
17.9.2011<br />
Authors would like to thank for technical assistance performed by M. Markovič and I.Peller.<br />
Authors would like express thanks to Archdiocese Bratislava, especially to Mons. Thurzo for<br />
19.9.2011<br />
21.9.2011<br />
West - plaster<br />
23.9.2011<br />
25.9.2011<br />
27.9.2011<br />
29.9.2011<br />
1.10.2011<br />
30<br />
25<br />
20<br />
15<br />
10<br />
Temperature [ o C]
helpfulness in this demonstration experiment. Research was supported by APVV grand agency<br />
under contracts LPP 0442‐09 and APVV 0641‐10.<br />
References<br />
[1] Gummerson, R.J., Hall, C., Hoff, W.D., Hawkes, R., Holland, G.N., Moore, W.D.,<br />
Unsaturated water flow within porous materials observed by NMR imaging, Nature 1979,<br />
281, 56–57.<br />
[2] Kubičár, Ľ., Vretenár, V., Štofanik, V., Boháč, V. and P. Tiano, Monitoring of thermal<br />
moisture regime of cultural objects, Proc. of conference: In situ Monitoring of<br />
Monumental Surfaces ‐ SMW08, Florence, 2008, p. 53 – 62.<br />
[3] O. Sass, O., Viles, H. A., How wet are these walls? Testing a novel technique for<br />
measuring moisture in ruined walls, Journal of Cultural Heritage 2006, 7, 257–263.<br />
[4] Michael Aoki, Kramer Graham Finch, Brian Hubbs, Jason Teetaert, Monitoring of Historic<br />
Structures for Whole‐Building Improvements, <strong>Proceedings</strong> from the Third International<br />
Building Physics <strong>Conference</strong>, Montreal, Quebec. August 27 to 31, 2006<br />
www.ornl.gov/sci/buildings/<strong>2012</strong>/B11%20papers/142_Kramer.pdf.<br />
[5] Brüggerhoff, S., Wange G., Morat P., Le Mouël, J. L. and Perrier, F, Firstresults of using<br />
combined mass and temperature measurements to study the water flow at the rock–<br />
atmosphere interface, Journal of Cultural Heritage, 2001, 2, 117‐132.<br />
[6] Said, M. N., Moisture Measurement Guide for Building Envelope Applications, National<br />
Research Council, Canada, Research Report #190, August 20, 2004, http://www.nrc‐<br />
cnrc.gc.ca/obj/irc/doc/pubs/rr/rr190/rr190.pdf .<br />
[7] Roels, S., Carmeliet, J., Hens, H., Adan, O., Brocken, H., Cerny, R., Pavlik, Y., Ellis, A. T.,<br />
Hall, C., Kumaran, K., Pel, L., Plagge, R., A comparison of different techniques to quantify<br />
moisture content profiles in porous building materials, Journal of Thermal Env & Bldg Sci;<br />
2004, 27, 261–276.<br />
[8] Maxwell, J.C., A Treatise of Electricity and Magnetism, Vol 1, 3rd edition (Oxford:<br />
Clarendon), 1904, pp 440.<br />
[9] Kubičár, Ľ., Vretenár, V., Štofanik, V., Boháč, V., Hot‐Ball Method for Measuring Thermal<br />
Conductivity, Int. J. Thermophys., 2010, 31, 1904‐1918<br />
[10] Fidrikova, D., Role of Water in Porous Structure, PhD Thesis, Institute of Physics SAS,<br />
Bratislava, <strong>2012</strong>, (in Slovak)<br />
89
90<br />
Mechanical and durability properties of concrete with<br />
pozzolanic admixture<br />
Tereza Kulovaná 1 , Eva Vejmelková 1 , Martin Keppert 1 , Petr Konvalinka 1 , Michal<br />
Ondráček 2 , Martin Sedlmajer 2 , Robert Černý 1<br />
1Faculty of Civil Engineering, Czech Technical University in Prague, Thákurova 7, CZ‐166 29<br />
Prague, Czech Republic<br />
2Faculty of Chemistry, Brno University of Technology, Purkyňova 118, CZ‐612 00 Brno, Czech<br />
Republic<br />
email: tereza.kulovana@fsv.cvut.cz<br />
Abstract: Mechanical and durability properties of concrete produced using ceramic powder as pozzolanic<br />
admixture are investigated. The experimental results show that partial replacement of cement by pozzolan<br />
may have significant environmental and economical consequences. Waste ceramic as recycled material<br />
used in concrete production presents no further CO2 burden to the environment, and its price is much<br />
lower as compared to Portland cement.<br />
Keywords: concrete, pozzolan, mechanical properties, durability properties<br />
Introduction<br />
Supplementary cementing material such as fine‐ground ceramics has found the application in<br />
concrete production couple of decades ago because of their potential to replace a part of<br />
Portland cement in concrete. Fine‐ground ceramics belongs to waste materials. Therefore, these<br />
materials or their combinations can be considered as environmental friendly cement substitutes.<br />
Waste ceramic materials may become a cheaper but almost equivalent alternative to metakaolin<br />
or ground granulated blast furnace slag, fly ash and other materials as supplementary binder in<br />
concrete. The ceramic industry often produces calcined clays that result from burning illite‐<br />
group clays which are commonly used in the production of red‐clay ceramic products. A<br />
portion of these products (which amounts up to 2% depending on producer and country) is<br />
discarded as scrap, thus constitutes industrial waste. The residues of ceramic bricks and floor<br />
and roof tiles ground to a suitable fineness can though become active pozzolans [1‐3]. So, they<br />
have a potential to be used in mortar and concrete.<br />
The measurements of properties of materials containing supplementary cementing materials<br />
are similarly as with many other cement based composites mostly concentrated on mechanical<br />
properties. This may not always be sufficient because superior mechanical properties are often<br />
not accompanied by comparably good resistance against water or salt penetration.<br />
This paper presents an extensive set of parameters of concrete containing different amounts of<br />
waste ceramics as active pozzolana replacing a part of Portland cement, including basic<br />
material characteristics, mechanical and durability characteristics, hygric and thermal<br />
properties. The results are also compared with those obtained for reference concrete containing<br />
only Portland cement as binder.<br />
Materials<br />
The composition of the studied concrete mixes is shown in Table 1. They were prepared with<br />
Portland cement CEM I 42.5 R as the main binder. The chemical composition of cement is
shown in Table 2. The specific surface area of cement was 341 m 2 /kg. A part of cement (10 ‐ 60%<br />
by mass) was replaced by fine‐ground ceramics with the chemical composition shown in Table<br />
3, the specific surface area was 336 m 2 /kg. The design of the concrete mixes was done according<br />
to ČSN EN 206‐1. For the sake of comparison, also a reference mix with only Portland cement as<br />
the binder was studied. The total mass of binder and the amount of water were the same in all<br />
mixtures.<br />
Table 1: Composition of studied concretes<br />
Amount in kg/m<br />
Component<br />
3<br />
BC2 BC2‐ BC2‐ BC2‐ BC2‐<br />
ref 10 20 40 60<br />
CEM I 42.5R, Mokrá 360 324 288 216 144<br />
Fine‐ground ceramics ‐ 36 72 144 216<br />
Aggregates 0‐4 mm 910 910 910 910 910<br />
Aggregates 4‐8 mm 225 225 225 225 225<br />
Aggregates<br />
8‐16 mm<br />
755 755 755 755 755<br />
plasticizer Mapei<br />
Dynamon SX<br />
3.96 3.96 4.29 5.18 6.16<br />
Water 146 146 146 146 146<br />
The measurement of material parameters was done after 28 days of standard curing in a<br />
conditioned laboratory at the temperature of 22±1°C and 25‐30% relative humidity. The<br />
following specimens’ sizes were used in the experiments: basic physical properties ‐ 50 x 50 x 50<br />
mm, compressive strength – 150 x 150 x 150 mm, bending strength and freeze/thaw resistance ‐<br />
100 x 100 x 400 mm, water vapor transport properties and water transport properties ‐ 100 x 100<br />
x 20 mm, thermal properties ‐ 70 x 70 x 70 mm.<br />
Table 2: Chemical composition of cement<br />
Component Amount in %<br />
SiO2 18.89<br />
Al2O3 4.24<br />
Fe2O3 3.83<br />
CaO 62.37<br />
MgO 0.99<br />
SO3 2.31<br />
Not identified 3.81<br />
Loss on ignition 1.52<br />
Table 3: Chemical composition of fine‐ground<br />
ceramics<br />
Component Amount in %<br />
SiO2 63.45<br />
Al2O3 13.98<br />
Fe2O3 5.39<br />
CaO 8.18<br />
TiO2 0.77<br />
K2O 2.43<br />
Na2O 0.90<br />
SO3 0.10<br />
Loss on ignition 1.13<br />
91
Experimental methods<br />
3.1 Basic Physical Properties<br />
Among the basic properties, the bulk density, matrix density and open porosity were measured<br />
using the water vacuum saturation method [4]. Each sample was dried in a drier to remove<br />
majority of the physically bound water. After that the samples were placed into the desiccator<br />
with deaired water. During three hours air was evacuated with vacuum pump from the<br />
desiccator. The specimen was then kept under water not less than 24 hours.<br />
3.2 Pore Structure<br />
Characterization of pore structure was performed by mercury intrusion porosimetry. The<br />
experiments were carried out using the instruments PASCAL 140 and 440 (Thermo Scientific).<br />
The range of applied pressure corresponds to pore radius from 2 nm to 2000 μm. Since the size<br />
of the specimens is restricted to the volume of approximately 1 cm 3 and the studied materials<br />
contained some aggregates about the same size, the porosimetry measurements were<br />
performed on samples without coarse aggregates.<br />
3.3 Mechanical properties<br />
The measurement of compressive strength was done by the hydraulic testing device VEB WPM<br />
Leipzig having a stiff loading frame with the capacity of 3000 kN. The tests were performed<br />
according to ČSN EN 12390‐3 [5] after 28 days of standard curing. The bending strength was<br />
determined using the procedure described in ČSN EN 12390‐5 [6], after 28 days of standard<br />
curing as well.<br />
3.4 Frost Resistance<br />
Frost resistance tests were carried out according to ČSN 73 1322/Z1 [7]. The samples were tested<br />
after 28 days of concrete maturing and standard curing. The total test required 100 freezing and<br />
thawing cycles. One cycle consisted of 4 hours freezing at ‐20°C and 2 hours thawing in 20°C<br />
warm water. Frost resistance coefficient K was determined as the ratio of bending or<br />
compressive strength of specimens subjected to 100 freezing and thawing cycles to the strength<br />
of reference specimens which did not undergo the frost resistance test.<br />
3.5 Water Vapor Transport Properties<br />
The dry cup method and wet cup methods were employed in the measurements of water vapor<br />
transport parameters [4]. The water vapor diffusion coefficient D [m 2 /s] and water vapor<br />
diffusion resistance factor μ [‐] were determined.<br />
3.6 Water Transport Properties<br />
The water absorption coefficient A [kg/m 2 s 1/2 ] and apparent moisture diffusivity [m 2 s ‐1 ] were<br />
measured using a water sorptivity experiment [8].<br />
92
3.7 Thermal Properties<br />
Thermal conductivity λ [W/mK] and specific heat capacity c [J/kgK] were measured using the<br />
commercial device ISOMET 2104 (Applied Precision, Ltd.). The measurement is based on<br />
analysis of the temperature response of the analyzed material to heat flow impulses. The heat<br />
flow is induced by electrical heating using a resistor heater having a direct thermal contact with<br />
the surface of the sample.<br />
Experimental Results and discussion<br />
4.1 Basic Physical Properties<br />
In Table 4 the basic physical properties of studied composites measured by the water vacuum<br />
saturation method are shown. The bulk densities of materials with lower amount of fine‐<br />
ground ceramics (BC2‐10, BC2‐20) and reference material (BC2‐ref) differed only up to about<br />
1%. Materials with higher amount of ground ceramics achieved about 2% lower bulk density<br />
than reference material BC2‐ref. The values of matrix density were within about 3% for all<br />
materials. The highest matrix density achieved BC2‐60 with 60% of fine‐ground ceramics, the<br />
lowest BC2‐ref without pozzolana admixtures. The highest porosity had material BC2‐60 with<br />
the highest amount of supplementary cementing materials, the lowest porosity achieved the<br />
reference material BC2‐ref.<br />
Table 4: Basic physical properties of studied concretes<br />
Material<br />
Bulk Density<br />
[kg/m3]<br />
Matrix Density<br />
[kg/m3]<br />
Open Porosity<br />
[%]<br />
BC2‐ref 2234 2571 13.1<br />
BC2‐10 2263 2614 13.4<br />
BC2‐20 2258 2613 13.6<br />
BC2‐40 2182 2581 15.5<br />
BC2‐60 2194 2630 16.6<br />
Pore volume [cm3/g]<br />
0.10<br />
0.08<br />
0.06<br />
0.04<br />
0.02<br />
BC2-<br />
REF<br />
BC2-10<br />
BC2-20<br />
0.00<br />
0.001 0.01 0.1 1 10 100<br />
Pore diameter [mm]<br />
Figure 1: Pore size distribution of studied concretes.<br />
93
4.2 Pore Structure<br />
The pore size distribution of all materials is presented in Figure 1 in form of cumulative curve.<br />
The total pore volume was increasing with increasing fine‐ground ceramics content; the mean<br />
pore radius increased slightly as well.<br />
4.3 Mechanical Properties<br />
The mechanical properties of five studied concretes are shown in Table 5. The replacement of<br />
Portland cement by find‐ground ceramics of up to 20% led to only about 10% decrease in<br />
compressive strength and 3% decrease in bending strength, which was still acceptable. For the<br />
replacement level higher than 20% of mass of cement the compressive strength was affected in<br />
much higher extent than bending strength. For BC2‐60 the compressive strength was more than<br />
two times lower as compared with the reference concrete mixture BC2‐ref but the bending<br />
strength was only about 20% lower.<br />
4.4 Frost Resistance<br />
94<br />
Table 5: Mechanical properties of studied concretes<br />
Material<br />
Compressive Strength<br />
[MPa]<br />
Bending Strength<br />
[MPa]<br />
BC2‐ref 56.87 6.4<br />
BC2‐10 55.89 6.4<br />
BC2‐20 49.58 6.2<br />
BC2‐40 37.45 5.9<br />
BC2‐60 22.23 5.3<br />
Table 6 shows that all studied concretes could be classified as frost resistant. The frost resistance<br />
of all mixes met the standard criterion of K > 0.75 which guaranteed sufficient performance. The<br />
best results were achieved for compressive strength with BC2‐20 and BC2‐40, for bending<br />
strength with BC2‐ref and BC2‐10. So, in the case of frost resistance the negative indications<br />
following from the measurements of pore volume and mechanical properties after 28 days of<br />
curing were not confirmed.<br />
Table 6: Frost resistance of studied concretes<br />
Material<br />
Frost Resistance Coefficient K<br />
As a ratio of<br />
compressive<br />
strengths<br />
As a ratio of<br />
bending<br />
strengths<br />
BC2‐ref 0.86 1.17<br />
BC2‐10 0.88 1.08<br />
BC2‐20 0.98 0.98<br />
BC2‐40 1.03 0.96<br />
BC2‐60 0.96 0.96
4.5 Water Vapor Transport Properties<br />
The results of measurements of water vapor transport properties of the analyzed materials are<br />
presented in Table 7.<br />
Table 7: Water vapor transport properties of studied concretes<br />
Material<br />
5/50% 97/50%<br />
D μ D μ<br />
[m 2 /s] [‐] [m 2 /s] [‐]<br />
BC2‐ref 2.67.10 ‐7 86.44 5.54.10 ‐7 41.53<br />
BC2‐10 2.77.10 ‐7 84.31 5.83.10 ‐7 39.45<br />
BC2‐20 2.92.10 ‐7 78.89 6.09.10 ‐7 37.75<br />
BC2‐40 3.18.10 ‐7 72.41 7.44.10 ‐7 31.23<br />
BC2‐60 3.59.10 ‐7 64.06 1.02.10 ‐6 22.53<br />
Comparing the data measured for all studied materials in both cases (dry cup, wet cup), we can<br />
see that the lowest μ value achieved material BC2‐60 with 60% of fine‐ground ceramics which<br />
was in a good qualitative agreement with the porosity data in Table IV. The highest water vapor<br />
diffusion resistance factor in both cases had BC2‐ref without pozzolana admixtures which<br />
exhibited the lowest porosity.<br />
4.6 Water Transport Properties<br />
The results of water sorptivity measurements are presented in Table 8. They were in a good<br />
qualitative agreement with the open porosity data (Table IV). The liquid water transport<br />
parameters increased with the increasing amount of fine‐ground ceramics in the mix. The<br />
lowest water absorption coefficient had the reference material BC2‐ref, about two times lower<br />
than BC2‐60 with the highest amount of fine‐ground ceramics. The comparison of apparent<br />
moisture diffusivities was similar to water absorption coefficients, as the differences in porosity<br />
were lower than those in water absorption coefficient.<br />
4.7 Thermal Properties<br />
Table 8: Water transport properties of studied concretes<br />
A <br />
[kg /m 2 s 1/2 ] [m 2 /s]<br />
BC2‐ref 0.0066 2.66E‐09<br />
Materials<br />
BC2‐10 0.0068 2.56E‐09<br />
BC2‐20 0.0079 3.85E‐09<br />
BC2‐40 0.0107 5.50E‐09<br />
BC2‐60 0.0135 8.16E‐09<br />
Thermal properties of studied concretes are shown in Table 9, Figures 2 and 3. We can see that<br />
the values of thermal conductivity of studied concretes in dry state were in a qualitative<br />
agreement with open porosity results (Table IV). The thermal conductivity decreased with the<br />
increasing amount of Portland‐cement replacement by fine‐ground ceramics.<br />
95
96<br />
Table 9: Thermal properties of studied concretes<br />
Material [W/mK] c [J/kg.K]<br />
BC2‐ref 1.893 721<br />
BC2‐10 1.773 730<br />
BC2‐20 1.700 726<br />
BC2‐40 1.643 765<br />
BC2‐60 1.710 781<br />
The values of specific heat capacity slightly increased with the increasing amount of fine‐<br />
ground ceramics; the maximum difference was about 8%, as compared with the reference HPC.<br />
Figures 2 and 3 show the remarkable increase of thermal conductivity and specific heat capacity<br />
with the increasing moisture content. This may have very significant consequences in the<br />
calculations of hygrothermal performance of building envelopes constructed using the studied<br />
concretes.<br />
Thermal conductivity [Wm -1 K -1 ]<br />
2.9<br />
2.7<br />
2.5<br />
2.3<br />
2.1<br />
1.9<br />
1.7<br />
1.5<br />
BC2-ref<br />
BC2-10<br />
BC2-20<br />
BC2-40<br />
BC2-60<br />
0 1 2 3 4 5 6 7<br />
Moisture [%kgkg -1 ]<br />
Figure 2: Thermal conductivity of studied concretes as a function of moisture content.<br />
Specicic heat capacity [Jkg -1 K -1 ]<br />
1000<br />
950<br />
900<br />
850<br />
800<br />
750<br />
700<br />
BC2-ref<br />
BC2-10<br />
BC2-20<br />
BC2-40<br />
BC2-60<br />
0 1 2 3<br />
Moisture [%kgkg<br />
4 5 6<br />
-1 ]<br />
Figure 3: Specific heat capacity of studied concretes as a function of moisture content.
Conclusions<br />
The experimental results presented in this paper showed that waste ceramic ground to an<br />
appropriate fineness can be considered a prospective pozzolana material suitable for the<br />
replacement of a part of Portland cement in concrete industry. This solution may have<br />
significant environmental and economical consequences. Waste ceramic as recycled material<br />
used in concrete production presents no further CO2 burden to the environment, and its price is<br />
much lower as compared to Portland cement.<br />
Acknowledgment<br />
This research has been supported by the Ministry of Education, Youth and Sports of the Czech<br />
Republic, under project No MSM: 6840770031.<br />
References<br />
[1] GONÇALVES, J. P. Use of ceramic industry residuals in concrete, In: REM‐Revista Escola<br />
de Minas, vol. 60, 2007, pp. 639‐644.<br />
[2] LAVAT, A. E. ‐ TREZZA, M. A. ‐ POGGI, M. Characterization of ceramic roof tile wastes<br />
as pozzolanic admixture, In: Waste Management, vol. 29, 2009, pp. 1666–1674.<br />
[3] TOLEDO FILHO, R.D. ‐ GONÇALVES, L. P. ‐ AMERICANO, B. B. ‐ FAIRBAIRN, E. M. R.<br />
Potential for use of crushed waste calcined‐clay brick as a supplementary cementitious<br />
material in Brazil, In: Cement and Concrete Research, vol. 37, 2007, pp. 1357–1365.<br />
[4] ROELS, S. ‐ CARMELIET, J. ‐ HENS, H. ‐ ADAN, O. ‐ BROCKEN, H. ‐ ČERNÝ, R. ‐<br />
PAVLÍK, Z. ‐ HALL, C. ‐ KUMARAN, K. – PEL, L. – PLAGGE, R. Interlaboratory<br />
Comparison of Hygric Properties of Porous Building Materials, In: Journal of Thermal<br />
Envelope and Building, vol. 27, 2004, pp. 307‐325.<br />
[5] ČSN EN 12390‐3, ʹʹTesting of hardened concrete – Part 3: Compressive strengthʹʹ. Prague:<br />
Czech Standardization Institute, 2002.<br />
[6] ČSN EN 12390‐5, ʹʹTesting of hardened concrete – Part 5: Bending strengthʹʹ. Prague:<br />
Czech Standardization Institute, 2007.<br />
[7] ČSN 73 1322/Z1:1968, ʹʹConcrete testing – Hardened concrete – Frost resistanceʹʹ. Prague:<br />
Czech Standardization Institute, 2003.<br />
[8] KUMARAN, M. K. Moisture Diffusivity of Building Materials from Water Absorption<br />
Measurements, In: Journal of Thermal Envelope and Building Science, vol. 22, 1999, pp. 349‐<br />
355.<br />
97
98<br />
Modification of the dynamic plane source method<br />
Svetozár Malinarič, Peter Krupa<br />
Department of Physics, Constantine the Philosopher University,<br />
Trieda Andreja Hlinku 1, 94974 Nitra, Slovak Republic, email: smalinaric@ukf.sk<br />
Abstract: The extended dynamic plane source (EDPS) method is one of the transient methods used for<br />
measurement of the thermal conductivity and diffusivity of solids. The heat losses from the lateral sides of<br />
the specimen are the main drawback of this method. The paper describes the modification of EDPS method<br />
which eliminates the heat loss effect. It is based on extending the specimen in the plane of the sensor so in<br />
the time window used for calculation the heat flow does not reach the free surface and thus no heat losses<br />
occurs. The theoretical model and the experimental arrangement of the method, referred to as Modified<br />
Dynamic Plane Source method (MDPS), are presented and applied to measurement of thermophysical<br />
properties of polymethylmethacrylate (PMMA).<br />
Keywords: Thermal conductivity, thermal diffusivity, polymethylmethacrylate, transient plane source<br />
method, modified dynamic plane source method<br />
1. Introduction<br />
Transient methods [1] represent a large group of techniques in which the heat source and<br />
thermometer are placed inside the specimen. The theoretical model is characterized by a<br />
temperature function, which is a solution of the heat equation. The evaluation consists in fitting<br />
the temperature function to the measured temperature response. One of the main advantages of<br />
the transient methods is the possibility to determine both the thermal conductivity and<br />
diffusivity from one single transient measurement.<br />
This paper deals with the transient methods of one sensor system, where the heat source<br />
simultaneously serves as the thermometer. The sensor, in the form of a thin disc, is placed<br />
between two sample pieces. Heat is produced by the passage of an electrical current in the form<br />
of a stepwise function through the sensor, the temperature of which is determined by<br />
measuring its electrical resistance.<br />
The basic method is known as the transient plane source (TPS) technique [2]. The theoretical<br />
model considers the sensor to be completely surrounded by an infinite specimen (Figure 1a). In<br />
practice the time of a transient recording must be chosen so that the outer boundaries of the<br />
specimen do not influence the experiment. The maximum time used in evaluation can be<br />
determined by using the probing depth, temperature residuals plot [3] or difference analysis [4].<br />
This results in the demand for the specimen size, which shall be such that the distance from any<br />
part of the sensor to any part of the outside boundary of the specimen is larger than the sensor<br />
radius. This means that the method has problems with thin samples, because the short transient<br />
recording as well as small radius of the sensor will cause the drop in measurement accuracy.<br />
The modification of the TPS technique, so‐called slab method [3], here referred to as STPS, is<br />
designed for sheet‐formed specimens extending in two dimensions, but with a limited and well‐<br />
defined thickness (Figure 1b). The theoretical model considers no heat losses from the surface of<br />
the specimen. In practice this method is suitable for materials with thermal conductivity higher<br />
than 10 W/(m.K). It can also be used for materials with thermal conductivity as low as 1
W/(m.K), provided good thermal insulation of the slabs can be arranged, for instance by<br />
performing the measurement in a vacuum.<br />
a)<br />
c)<br />
Figure 1: Experimental set‐up for a) TPS b) STPS c) EDPS and d) MDPS method.<br />
Another solution is to use one‐dimensional heat flow as in the extended dynamic plane source<br />
(EDPS) [6,7] method which has been designed for materials with thermal conductivity less than<br />
2 W/(m.K) (Figure 1c). The sample slabs have the same cross section as the disc and their rear<br />
sides are in contact with a very good heat conducting material (heat sink) so that the process<br />
after a short time approaches the steady state. The method can be used for thermophysical<br />
parameters measurement of polymeric materials, but heat losses [5] from lateral sides of the<br />
sample are still problematic. Although the influence of heat losses was estimated in [6] much<br />
below 1%, the measurements on polymethylmethacrylate (PMMA) in vacuum showed that it is<br />
about 4% [8]. It could be expected taking into account that the thermal conductivity of the air is<br />
about 0.025 W/(m.K) comparing to that of PMMA which is 0.2 W/(m.K) [9]. So it is very difficult<br />
to analyze and expel the heat losses because the surface‐to‐air heat transfer coefficient reaches<br />
values from 2 to 23 W/(m.K).<br />
The goal of this work is to develop the method suitable for measurement of sheet‐formed<br />
specimens with thermal conductivity less than 2 W/(m.K), which will not be influenced by heat<br />
losses from the specimen surface, hence no need for surrounding vacuum.<br />
2. Theoretical model<br />
heat sink<br />
sensor<br />
specimen<br />
Modified DPS method, here referred to as MDPS, is developed for low thermally conducting<br />
slab specimens. As in EDPS method the slab specimens are clamped between two large pieces<br />
of good heat conducting materials (heat sink) as seen in Figure 1d. But as in STPS method the<br />
sheet‐formed specimens are considered to be infinite in the plane of the sensor [3]. So that in the<br />
time window used for calculation the heat flow does not reach the free surface of the sample<br />
and thus no heat losses occurs. The theoretical model is created by the following conditions:<br />
(i) The sensor is a homogenous circle with negligible thickness and heat capacity.<br />
(ii) There is no thermal resistance between the sensor and specimen.<br />
L<br />
b)<br />
d)<br />
z<br />
R<br />
99
(iii) The specimens are infinite identical parallel slabs.<br />
(iv) The heat sink is semi‐infinite and its temperature is constant.<br />
(v) There is an ideal thermal contact between the specimen and heat sink.<br />
(vi) The input power of the sensor is stepwise.<br />
The theoretical temperature function is a solution of the heat equation with boundary and initial<br />
conditions corresponding to the experiment and represents the mean temperature increase of<br />
the specimen at z = 0 [10]<br />
P<br />
TM F,<br />
b<br />
(1)<br />
3 / 2<br />
R<br />
The shape function has the form<br />
where<br />
is the nondimensional time, a is the thermal diffusivity of the specimen, = R 2 / a is the<br />
characteristic time of the transient, b = 2 L / R is a geometric factor and I0() is the modified Bessel<br />
function. For bulk specimens b the MDPS method corresponds to the TPS one and function<br />
(2) goes to (25) in [2]. Dependencies in Figure 2 can be interpreted as the higher the specimen<br />
thickness the smaller the influence of the heat sink, provided the radius of the sensor is kept<br />
constant.<br />
100<br />
F<br />
1<br />
<br />
1 ds x y xy<br />
2 <br />
2 0<br />
2 <br />
4 s<br />
4s<br />
2s<br />
n<br />
2<br />
b n<br />
<br />
2<br />
4s<br />
<br />
n<br />
, b dx dy exp<br />
I<br />
1<br />
exp<br />
t<br />
<br />
<br />
<br />
0<br />
at<br />
R<br />
0<br />
0.4<br />
0.2<br />
0<br />
1<br />
0<br />
Figure 2: Dimensionless shape function computed by means of (2) for various values of the<br />
geometric factor b versus nondimensional time given by (3).<br />
Similarly, we can find the relation to the EDPS method, in which the temperature increase of the<br />
specimen at z = 0 is given [6]<br />
<br />
b <br />
b = 3<br />
b = 1<br />
0 0.5 1 1.5 <br />
2<br />
b = 0.3<br />
<br />
<br />
(2)<br />
(3)
where the shape function is<br />
and<br />
TE<br />
<br />
g<br />
t<br />
<br />
<br />
qL<br />
g<br />
<br />
<br />
1<br />
2 <br />
<br />
<br />
<br />
E<br />
<br />
at<br />
L<br />
n1<br />
<br />
n n <br />
ierfc<br />
<br />
<br />
<br />
is the nondimensional time, E =L 2 / a is the characteristic time of the transient, = ‐1 for a<br />
perfect heat sink [6], ierfc is the error function integral and q = P / R 2 is the power per unit area<br />
dissipated by the sensor. Then the temperature function of MDPS method (1) can be rewritten<br />
to the form<br />
<br />
T M<br />
qL 2<br />
F<br />
b<br />
0.5<br />
0<br />
qL 2<br />
b<br />
b<br />
<br />
2<br />
, b<br />
F , b f , b<br />
<br />
<br />
<br />
<br />
Figure 3: Dimensionless shape function computed by means of (7) for various values of the<br />
geometric factor b versus nondimensional time given by (6).<br />
For thin specimens b 0 the MDPS method corresponds to the EDPS one and the shape<br />
function f (, b) from (7) goes to g() from (4). Dependencies in Figure 3 can be interpreted as<br />
the higher the sensor radius the smaller the influence of the lateral heat flux, provided the<br />
thickness of the specimen is kept constant.<br />
qL<br />
<br />
b 0<br />
b = 0.3<br />
b = 1<br />
b = 3<br />
0 0.5 1 1.5 <br />
(4)<br />
(5)<br />
(6)<br />
(7)<br />
101
3. Experiment<br />
The electronic of the apparatus is based on the multichannel PC plug‐in card (Advantech PCL‐<br />
816). Using the constant power resistor the electrical current and thus the sensor resistance can<br />
be determined [10].<br />
Figure 1 illustrates the arrangement of the apparatus for four above mentioned methods. The<br />
sensor, usually termed as transient plane source/sensor element, in the form of a bifilar spiral is<br />
made of 10 m thick nickel foil covered on both sides by 25 m thick kapton insulating film [3].<br />
The heat sink, made of aluminium, provides isothermal boundary condition of the experiment.<br />
In TPS method the thickness of the specimen must be at least as large as the radius of the<br />
sensor. In EDPS method the cross section of the specimen is exactly the same as that of the<br />
sensor. But in TPS and MDPS methods the radius of the specimen must be at least twice as large<br />
as that of the sensor so that the condition related to the probing depth is fulfilled in the plane of<br />
the sensor.<br />
In order to verify the MDPS method a cast PMMA specimens were measured by means of TPS,<br />
EDPS and MDPS methods. In TPS and MDPS methods the sensor 5501 with a radius of 6.5 mm<br />
was used. The EDPS measurements were carried out by means of the sensor with a radius of 15<br />
mm described in [11]. The samples had cylindrical shape with the radius of 15 mm and<br />
thickness about 3 mm. In TPS measurements 3 cylinders were glued by silicon oil to fulfill the<br />
condition for probing depth.<br />
In practice, the conditions (i) and (ii) are not exactly fulfilled so that the temperatures of the<br />
sensor and adjacent specimen surfaces are not identical. The initial temperature of the<br />
specimen, sensor and heat sink is stabilized and equals to T0. A short time S after the start of<br />
the experiment, a steady state at the boundary between the sensor and specimen is reached and<br />
Newtonʹs cooling law can be written as<br />
where h is the heat transfer coefficient and TS is the temperature increase of the sensor due to<br />
its self‐heating. The temperature difference is caused not only by the thermal contact between<br />
the sensor and specimen but also by its bifilar spiral shape. Then the temperature of the sensor<br />
can be expressed as<br />
q<br />
TS t T0<br />
TM<br />
t<br />
(8)<br />
h<br />
where TM is the mean temperature increase of the specimen given by (1). The predicted values<br />
of the sensor resistance can be determined by the formula<br />
where r0 and 0 are the sensor resistance and its temperature coefficient (TCR) both at<br />
temperature T0, respectively. Both thermophysical parameters can be determined by fitting eq.<br />
(9) to measured points t i , ri<br />
.<br />
The thermal diffusivity a is iterated and thermal conductivity is<br />
obtained from the slope of the linear dependence, as described in [3] and [6].<br />
102<br />
TT q h <br />
S<br />
<br />
<br />
<br />
0 r0<br />
P<br />
<br />
at<br />
r t r0<br />
F , b<br />
3/<br />
2<br />
R <br />
<br />
R <br />
M<br />
(7)<br />
(9)
4. Results and discussion<br />
Figure 4 shows the time dependence of residuals [3] in MDPS measurement. It illustrates how<br />
well the theoretical model fits the experimental data and reveals the deviating points which<br />
should be omitted. The random component of the resistance measurement uncertainty (noise)<br />
can be evaluated from the variance of the residuals u(r) = 60 corresponding to the sensor<br />
temperature of 1 mK. In addition, the characteristic time of the sensor can be estimated as S<br />
1.8 s.<br />
Figure 4. Time dependence of residuals in MDPS measurement.<br />
The probing depth defined by the formula [3]<br />
p 2 a t<br />
max<br />
acquired the value 5.3 mm in this experiment. So the heat flow did not reach the surface in the<br />
plane of the sensor and there are no deviating points at the end of the transient in Figure 4.<br />
Table 1. Results of the thermal conductivity and diffusivity measurements of PMMA at the laboratory<br />
temperature.<br />
<br />
1 1<br />
W m K <br />
2 1<br />
mm s<br />
<br />
a<br />
r, m<br />
0<br />
-1<br />
-2<br />
0 20 40 t, s<br />
TPS EDPS MDPS mean<br />
standard<br />
deviation<br />
0.200 0.199 0.203 0.201 0.002<br />
0.118 0.118 0.114 0.117 0.002<br />
Table 1 presents the results of thermophysical parameters measurements of PMMA material.<br />
The measurements were performed by TPS, EDPS, MDPS methods and repeated with various<br />
values of input power. All three methods gave the results with coefficients of variation about 1<br />
and 2% for thermal conductivity and diffusivity, respectively.<br />
(10)<br />
103
5. Summary<br />
A new method of thermal conductivity and diffusivity measurement of low thermally<br />
conducting materials was proposed and experimentally verified. The theoretical model assumes<br />
zero thermal contact resistance between the sensor and specimen (ii), which does not<br />
correspond with the experiment, but the part of the temperature rise relating to the contact<br />
resistance can be ignored, as described in part 3. From this point of view, the contact paste is not<br />
recommended between the sensor and specimen [3]. However, in this work all thermal contact<br />
resistances, namely, sensor‐specimen, specimen‐heat sink and between parts of the specimen,<br />
were eliminated by making the surfaces sufficiently flat and smooth and using very thin layer<br />
of a silicone oil. Because of low viscosity, no addition gap was introduced.<br />
References<br />
[1] KUBIČÁR, Ľ. ‐ BOHÁČ V. Review of several dynamic methods of measuring<br />
thermophysical parameters. In Proc. of 24th Int. Conf. on Thermal Conductivity/12th Int.<br />
Thermal Expansion Symp., Technomic Pub., Lancaster, 1999, p. 135<br />
[2] GUSTAFSSON, S. E. Transient plane source techniques for thermal conductivity and<br />
thermal diffusivity measurements of solid material. In Rev. Sci. Instrum. 1991. 62. p. 797<br />
[3] Plastics ‐ Determination of thermal conductivity and thermal diffusivity ‐ Part 2, (22007‐<br />
2). ISO, Geneva, 2008<br />
[4] BOHÁČ, V. ‐ GUSTAVSSON, M. K. ‐ KUBIČÁR, Ľ. ‐ GUSTAFSSON, S. E. Parameter<br />
estimation for measurements of thermal transport properties with the hot disk thermal<br />
constants analyser. In Rev. Sci. Instrum. 2000. 71. p. 2452<br />
[5] BOHÁČ, V. ‐ DIEŠKA, P. ‐ VRETENÁR, V. ‐ GREIF, V. Model for Cuboid Shape Samples<br />
and its Analysis Used for Measurements of Thermophysiscal Properies of Sandstone. In<br />
Meas. Sci. Rev. 2011. (10.2478/v10048‐011‐0032‐z)<br />
[6] KARAWACKI, E. ‐ SULEIMAN, B.M. ‐ UL‐HAQ, I. ‐ NHI, B. An extension to the<br />
dynamic plane source technique for measuring thermal conductivity, thermal<br />
diffusivity, and specific heat of dielectric solids. In Rev. Sci. Instrum. 1992. 63. p. 4390<br />
[7] MALINARIČ, S. Parameter estimation in dynamic plane source method. In Meas. Sci.<br />
Technol. 2004. 15. p. 807<br />
[8] MALINARIČ, S. ‐ DIEŠKA, P. Improvements in the dynamic plane source method. In<br />
Int. J. Thermophys. 2009. 30. p. 608<br />
[9] Handbook of Chemistry and Physics. CRC Press, Boca Raton, 2004<br />
[10] MALINARIČ, S. ‐ DIEŠKA, P. ‐ KRUPA, P. Modified dynamic plane source method for<br />
measuring thermophysical parameters of solids. In Int. J. Thermophys. <strong>2012</strong>. 33. p. 528<br />
[11] MALINARIČ, S. ‐ DIEŠKA, P. Dynamic measurements of the temperature coefficient of<br />
resistance in the transient plane source sensor. In Int. J. Thermophys. 2009. 30. p. 1557<br />
104
Determination of poromechanical coupling parameters for<br />
calcium silicate boards<br />
Peter Matiasovsky, Peter Mihalka<br />
Institute of Construction and Architecture, Slovak Academy of Sciences, Dúbravská<br />
cesta 9, 845 03 Bratislava, Slovakia, email: usarmat@savba.sk<br />
Abstract: Building capillary porous composite materials are very hydrophilic ones, pores of which have<br />
a large specific surface area, which results in strong fluid‐skeleton interactions. On the basis of micro‐<br />
macro relations of poroelasticity the poroelastic coupling coefficients of calcium silicate boards were<br />
identified. For determination of the fluid‐skeleton coupling coefficients of porous material the<br />
experimental procedure based on measurement of moisture deformations under isothermal sorption, and<br />
simultaneously the measurement of the water sorption isotherms is necessary. The equipment for<br />
measurements of temperature and moisture expansion, together with water vapour sorption enabled the<br />
application of complex methodology of poromechanical properties determination for calcium silicate<br />
boards.<br />
Keywords: moisture induced deformation, poromechanical coupling, calcium silicate<br />
1. Introduction<br />
Calcium silicate is a highly porous material characterised by the high moisture expansion.<br />
Koronthalyova and Matiasovsky (2003) gave an interpretation of the moisture expansion<br />
influence of this material to a bilinear character of the moisture dependence of its thermal<br />
conductivity.<br />
The fluid‐skeleton interactions in nonsaturated porous materials can be expressed by<br />
constitutive equations of linear poroelasticity in the form (Coussy, 1995):<br />
d K d<br />
b dp<br />
(1)<br />
dml c<br />
<br />
l<br />
c<br />
dp<br />
b d<br />
(2)<br />
M<br />
where: and are respectively the stress and strain, pc is the capillary pressure, ml and l are<br />
respectively the fluid mass content and fluid density. The isotropic linear poroelastic behaviour<br />
is characterised by four independent poroelastic coefficients, which can be chosen in the<br />
following way: two undrained or drained coefficients from among the Lamé coefficients and<br />
, the Young modulus E, the Poisson ratio , the bulk modulus K, altogether with the Biot<br />
coefficient b and Biot modulus M (Coussy, 1995). Carmeliet (2000) presented the approach<br />
enabling to determine the coefficients of coupling between moisture content and moisture<br />
induced strain in porous materials. For determination of the coupling coefficients of the porous<br />
material, the experimental procedure based on measurement of moisture deformations under<br />
isothermal sorption, and simultaneously on the measurement of the water sorption isotherms is<br />
necessary. The equipment for measurements of moisture expansion, together with<br />
determination water sorption enables the application of the complex methodology of<br />
poromechanical properties determination for calcium silicate boards. In this paper an<br />
105
application of this approach was used to analyse the mechanism of calcium silicate moisture<br />
expansion.<br />
2. Measurements<br />
The analysis of poromechanical coupling issued from the measurements of moisture expansion<br />
of four types of calcium silicate boards, different in density, within the water saturation interval<br />
of 0 – 90 %. The experiments consisted of two subsequent processes: wetting and drying guided<br />
by changing the gravimetrically controlled moisture content. The length changes of the<br />
specimens dimensions of which were 0.04 x 0.04 x 0.5 m were measured by dilatometer in a<br />
climatic chamber at varied water saturation degrees.<br />
106<br />
Table 1: Basic parameters of calcium silicate A<br />
Parameter Value<br />
Bulk density 240 kg/m 3<br />
Porosity 0.91<br />
Critical moisture content 0.16 m 3 /m 3<br />
Young modulus 416 MPa<br />
Poisson ratio 0.2<br />
Besides the moisture expansion measurements, the water vapour sorption isotherms in a<br />
climatic chamber and the pore size distribution by mercury intrusion porosimetry method were<br />
determined for the chosen materials. The Young modulus of dry materials was determined by a<br />
standard mechanical bending test. The results of the measurements are presented for the<br />
calcium silicate marked “A”, basic material parameters of which are presented in Table 1.<br />
Results of the moisture expansion measurements for the analysed material are in Figure 1.<br />
Relative deformation (m/m)<br />
Degree of saturation (‐)<br />
Measurement<br />
Model<br />
Figure 1: Moisture induced deformation of calcium silicate
3. Analysis<br />
In Figure 1 it can be seen that the zero deformation of the calcium silicate is at relative humidity<br />
of 95 %, that means that all moisture induced deformations are represented by the shrinkage.<br />
The presented deformation course shows a significant hysteresis. The upper ‐ wetting and<br />
lower ‐ drying lines are different significantly. From the figure it is evident that for the calcium<br />
silicate two shrinkage minima are typical. Besides the first (95 % relative humidity) minimum,<br />
close to the critical moisture content, the second minimum occurs, close to the absolute water<br />
saturation state. During the moisture deformations two specific phases can be distinguished.<br />
The first phase is represented by the steep, almost linear change in the hygroscopic region<br />
corresponding to the relative humidity interval of 1 – 95 %. The second phase is characterised<br />
by weak changes in the overhygroscopic region.<br />
Carmeliet (2000) expressed the free drying shrinkage from Equation (1), introducing d= 0 and<br />
the bulk modulus reduction factor (1‐D), in the form:<br />
b<br />
d<br />
dpc<br />
(3)<br />
K(<br />
1<br />
D)<br />
where: D is the damage variable. The Biot coefficient has the form:<br />
K <br />
b <br />
<br />
1<br />
S<br />
K <br />
<br />
(4)<br />
m <br />
where: S is the degree of saturation and Km is the bulk modulus of material solid matrix. Using<br />
the parameter:<br />
K<br />
1<br />
(5)<br />
K<br />
m<br />
Degreee of saturation (‐)<br />
Adsorption<br />
Desorption<br />
Capillary pressure (Pa)<br />
Figure 2: Retention curve of calcium silicate<br />
107
108<br />
Relative moisture content (m 3 /m 3 )<br />
Figure 3: Adsorption curve of calcium silicate<br />
the moisture induced linear strain of calcium silicate can be expressed by the following relation<br />
(Coussy et al., 1999):<br />
pmax<br />
c c dp p S<br />
<br />
<br />
K(<br />
1<br />
D)<br />
<br />
(6)<br />
pc<br />
min<br />
Water vapour<br />
sorption<br />
Mercury intrusion<br />
porosimetry<br />
The Equation (6) was applied at the analysis of the carried out moisture induced strain<br />
measurements described in Figure 1. The capillary pressures pc, were determined from the<br />
retention curve (Fig. 2) using Equation (2), with neglected second term. The Biot modulus M is<br />
identified as an inverse value of the first derivation of the retention curve. The retention curve<br />
was determined from adsorption curve by transformation of the relative humidities to the<br />
capillary pressures, supposing the validity of capillary condensation sorption model (Gregg and<br />
Sing, 1982), using Kelvin equation in the form:<br />
6<br />
pc ln<br />
k 13510<br />
(7)<br />
where k = 1 at adsorption and 2 at desorption.<br />
Relative humidity (‐)<br />
The adsorption curve (Fig. 3) was constructed by joining the measured water vapour adsorption<br />
and pore size distribution curves, where the pore radius r (nm) was transformed to relative<br />
humidity for k = 1 by Kelvin equation in the form:<br />
k 0.<br />
535<br />
ln<br />
<br />
(8)<br />
r<br />
As the moisture induced deformation of calcium silicate has a hysteretic character the<br />
calculation of water saturation integral in Equation (6) distinguishes a difference between<br />
wetting and drying processes (Eq. 7). The results for the analysed material presented as the<br />
model solution in Figure 1 were calculated with the following considerations: The first water<br />
saturation phase represents the adsorption in hygroscopic region, guided by capillary pressure<br />
corresponding to cylindrical menisci (k = 1). The second water saturation phase is the<br />
adsorption with capillary condensation guided by the mixed effect of cylindrical menisci
Figure 4: Moisture induced deformation of calcium silicate in hygroscopic region<br />
proportional to the non saturated pore volume (with pcads) and spherical menisci (with pcdes)<br />
proportional to the saturated pore volume:<br />
pmax<br />
<br />
S<br />
pc<br />
min<br />
p<br />
max<br />
max<br />
pcdpc Spcads<br />
Spcads<br />
dpcads Spcdes<br />
Spcdes dpcdes <br />
1 (9)<br />
pc<br />
min<br />
The drying is a desorption process guided by the capillary pressure corresponding to spherical<br />
menisci (k = 2).<br />
Applying Equation (6) from the known data on moisture induced strain and bulk modulus<br />
and for the adequate water saturation integrals, considering D = 0, the Biot coefficient b = 0.28 S<br />
for the first wetting and also drying was determined. The repeated second wetting (swelling) of<br />
the calcium silicate was different (Fig. 4) the Biot coefficient has increased to the apparent value<br />
equal to S. This change can be interpreted as the effect of a degradation of bulk modulus, with<br />
the corresponding damage variable D = 0.71.<br />
3. Conclusions<br />
On the basis of micro‐macro relations of poroelasticity the coefficients of coupling between<br />
moisture content and moisture deformation were identified for calcium silicate boards. The<br />
coupling coefficients were determined for the water saturation interval 0 ‐ 90 %. The moisture<br />
induced deformation of calcium silicate has a hysteretic character and it is given by different<br />
capillary pressures during the material wetting and drying.<br />
Acknowledgment<br />
Relative deformation (m/m)<br />
This research was supported by the project APVV‐0032‐10.<br />
First wetting ‐ measurement<br />
First wetting ‐ model<br />
Second wetting ‐ measurement<br />
Second wetting ‐ model<br />
Degree of saturation (‐)<br />
p<br />
<br />
pc<br />
min<br />
109
References<br />
[1] GREGG, S. J. ‐ SING, K. S. W. Adsorption, Surface Area and Porosity, Academic Press,<br />
London. 1982<br />
[2] COUSSY, O, Mechanics of Porous Continua, John Wiley, Chichester 1995, pp. 455, ISBN<br />
0 471 95267 2<br />
[3] COUSSY, O. ‐ Ulm, F. J. ‐ Mainguy, M. A Short Course on Environmental Mechanics of<br />
Concrete. Lecture Notes, Udine. 1999<br />
[4] CARMELIET, J. Influence of fluid‐solid coupling on the damage behavior of quasi‐brittle<br />
nonsaturated porous media. In: Emerging Technologies in NDT, Van Hemerlijck,<br />
Anastassopoulos & Philippidis (eds) Balkema, Rotterdam. 2000. pp. 245 – 252. ISBN 90<br />
5809 127 9<br />
[5] KORONTHÁLYOVÁ, O. – MATIAŠOVSKÝ, P. Thermal Conductivity of Fibre Reinforced<br />
Porous Calcium Silicate hydrate‐based Composites. In: Journal of Thermal Envelope and<br />
Building Science. 2003. 26(4), pp. 71‐ 89 ISSN 1097 ‐ 1963<br />
110
Application of generalised Wiener mixing formula at modelling<br />
transport properties of porous materials<br />
Peter Matiasovsky, Peter Mihalka, Lubomir Bagel<br />
Institute of Construction and Architecture, Slovak Academy of Sciences, Dúbravská<br />
cesta 9, 845 03 Bratislava, Slovakia, email: usarmat@savba.sk<br />
Abstract: Basic relationships among composition, pore structure parameters and transport properties of<br />
homogenous building materials were investigated. Thermal conductivity and relative permittivity of<br />
moist material are the functions of air and water saturated pore volume fractions. The relative<br />
permittivity of calcium silicates and lightweight mortars at various moisture contents were modelled as<br />
the parallel configurations of solid matrix, air and moisture content volume fractions, expressed as the<br />
power functions. Values of the power functions exponents were given by the mean fractal dimensions of<br />
particular volume fractions determined on the basis of mercury intrusion porosimetry tests. The proposed<br />
pore structure based models of transport properties are reliable tools for the analyses and development of<br />
porous construction materials.<br />
Keywords: porous composites, effective permittivity, moisture content<br />
1. Introduction<br />
At present there are a lot of models of relative permittivity of moist porous materials ‐ from<br />
empirical functions to mixing formulae of various complexity. As the universal solution for<br />
many building materials it seems to be Lichtenecker (1926) model of effective relative<br />
permittivity in the form:<br />
ef<br />
k<br />
k k k 1/<br />
1 <br />
u<br />
<br />
k<br />
u <br />
u<br />
<br />
w<br />
(1)<br />
s<br />
w<br />
a<br />
w<br />
w<br />
which represents a generalisation of Wiener formula, where the subscripts s, a, w represent the<br />
phases solid, air and water respectively. Symbol is porosity, uw is volumetric moisture<br />
content. Parameter k can have values from ‐ 1 to 1, which are limit values of k corresponding to<br />
Wiener bounds.<br />
In Holubek et al. (2009) an application of the effective relative permittivity model representing<br />
another generalisation of Wiener formula was presented:<br />
1FDms<br />
1FD<br />
1FD<br />
ma<br />
mw<br />
u1 <br />
u<br />
<br />
u<br />
u<br />
<br />
ef w s<br />
a w<br />
w w crit<br />
(2)<br />
where: FDm is the mean fractal dimension of the phase volume, ucrit is the critical moisture<br />
content. The fractal dimension has values from 0 to 1 and the zero value corresponds to the<br />
upper Wiener bound.<br />
The approximation of effective permittivity by Equation (2) was verified only for one type of<br />
calcium silicate in (Holubek et al., 2009). In this paper the applicability of this model was tested<br />
for two types of lightweight plaster and four types of calcium silicate boards.<br />
111
2. Measurements<br />
For the application of Equation (2) the measurements of relative permittivity of materials with<br />
various degrees of water saturation were carried out. For the TDR measurements, LOM/4/mpts<br />
produced by Easy Test was used in combination with second‐level multiplexers for sensors<br />
connection. A two‐rod miniprobe LP/ms was used for the determination of moisture content.<br />
The pore structure parameters of the analysed materials necessary for modelling the volumetric<br />
distribution of particular phases and their fractal dimension during the water saturation were<br />
determined with use of the mercury intrusion porosimetry tests. The capillary moisture content<br />
was determined from drying experiments. The basic material parameters of the analysed<br />
materials are in Table 1.<br />
112<br />
Table 1: Basic material parameters of analysed materials<br />
Material Bulk density<br />
(kg/m 3 )<br />
Porosity<br />
Lightweight carbonate 610 0.67 0.23<br />
Lightweight lime‐cement plaster 670 0.63 0.18<br />
Calcium silicate A 240 0.91 0.27<br />
Calcium silicate B 240 0.91 0.22<br />
Calcium silicate C 200 0.93 0.22<br />
Calcium silicate D 280 0.90 0.15<br />
3. Analysis<br />
(‐)<br />
Capillary<br />
moisture content<br />
(m 3 /m 3 )<br />
The effective permittivity model expressed by Equation (2) supposes the parallel configuration<br />
of the permittivities of solid matrix s, air a and water w equal to 2.3, 1.2 and 80 respectively, at<br />
a given degree of saturation uw.<br />
The increase of effective permittivity has two phases corresponding to the porous material<br />
water saturation character. The first phase is characterised by the adsorption of water film on<br />
the specific surface of the pores. This process is realised within the moisture content interval 0 –<br />
ucrit. The water adsorbs on the surface of all capillary pores and the mean fractal dimension of<br />
adsorbate equals to mean fractal dimension corresponding to the volume of pores relevant for<br />
the water vapour adsorption. In (Matiasovsky, 2009) the mean fractal dimension of pore volume<br />
for the analysed materials determined by the box counting method equals 1.0 and the fractal<br />
dimension of solid is 0.7. Considering a negligible contribution of solid and air to the effective<br />
relative permittivity Equation (2) for the degrees of saturation lower than critical moisture<br />
content will have the form:<br />
2<br />
u. 311.<br />
2u80u<br />
ef w 2 w w<br />
(3)
In a case of the degree of saturation higher than critical moisture content Equation (2) will have<br />
the form where the mean fractal dimension is calculated only for water filled fractions bigger<br />
than critical moisture content:<br />
1FDm<br />
u.( u ) 80uu<br />
<br />
ef w ef crit<br />
w crit<br />
(4)<br />
In the equation the mean fractal dimension is changing with increasing relevant moisture<br />
content uw – ucrit.<br />
The Equations (3) and (4) were applied for in analyses of chosen materials. The comparisons of<br />
measured and modelled relative permittivity data (Fig. 1 – 6) show a good similarity, and<br />
confirm the significant correlation between pore size distribution and fractal properties of the<br />
analysed material. It is necessary to emphasize, that the results of the modelling are sensitive to<br />
determination of critical moisture content.<br />
Figure 1: Comparison of measured and modelled relative permittivity of lightweight carbonate<br />
Figure 2: Comparison of measured and modelled relative permittivity of lightweight lime‐cement plaster<br />
113
114<br />
Figure 3: Comparison of measured and modelled relative permittivity of calcium silicate A<br />
Figure 4: Comparison of measured and modelled relative permittivity of calcium silicate B<br />
Figure 5: Comparison of measured and modelled relative permittivity of calcium silicate C
Figure 6: Comparison of measured and modelled relative permittivity of calcium silicate D<br />
3. Conclusions<br />
The generalised Wiener formula for modelling the effective permittivity of three phase media<br />
was proposed. The model is a modification of parallel Wiener model where the irregularity of<br />
particular phases is the function of their fractal dimension. The model considers two specific<br />
water saturation stages: adsorption and condensation, determined by critical moisture content.<br />
Acknowledgment<br />
This article has been produced with the financial assistance of the European Regional<br />
Development Fund (ERDF) under the Operational Programme Research and<br />
Development/Measure 4.1 Support of networks of excellence in research and development as<br />
the pillars of regional development and support to international cooperation in the Bratislava<br />
region/Project No. 26240120020 Building the centre of excellence for research and development<br />
of structural composite materials – 2nd stage.<br />
References<br />
[1] LICHTENECKER, L. Die Dielektrizitaetkonstante natuerlicher und kuenstlicher<br />
Mischkoerper. In: Physicalische Zeitschrift 1926. 27. p. 115-158.<br />
[2] HOLUBEK, M. - MIHÁLKA, P. - MATIAŠOVSKÝ, P. Relationship between relative<br />
permittivity and thermal conductivity moisture dependence of calcium silicate boards. In<br />
<strong>Thermophysics</strong> 2009: proceedings. - Brno: University of Technology, Faculty of<br />
Chemistry, 2009. p. 43-48. ISBN 978-80-214-3986-3<br />
[3] MATIAŠOVSKÝ, P. – KORONTHÁLYOVÁ, O. Analysis and modelling of effective thermal<br />
conductivity of dry porous building materials. In <strong>Proceedings</strong> of the 8 th Symposium on Building<br />
Physics in Nordic Countries / editor Carsten Rode Danish Society of Engineers, IDA. Copenhagen<br />
2008. p. 285-291. ISBN 978-87-7877-265-7<br />
115
116<br />
Capillary condensation sorption model and its validity for<br />
highly porous building materials<br />
Peter Matiasovsky, Bozena Vasilkovova, Peter Mihalka<br />
Institute of Construction and Architecture, Slovak Academy of Sciences, Dúbravská<br />
cesta 9, 845 03 Bratislava, Slovakia, email: usarmat@savba.sk<br />
Abstract: Up to now various sorption hysteresis models were developed. With use of the BJH capillary<br />
condensation model the sorption isotherms for water determined for various types of building materials<br />
with high porosity could be approximated on the basis of BET nitrogen sorption and mercury porosimetry<br />
data. The model enabled also the approximation of scanning curves. This approach is applicable for IV<br />
type isotherms and for the H1 type hysteresis (according to IUPAC classification), which are typical for<br />
the materials with well defined cylindrical pores. The validity of the model was tested for various types of<br />
highly porous building materials.<br />
Keywords: sorption, capillary condensation, building materials<br />
1. Introduction<br />
In Mihalka et al. (2011) the analysis of results of the water vapour and nitrogen sorption in<br />
combination with the results of MIP for the lightweight carbonate plaster proved the<br />
compatibility of the used methods in water vapour sorption modelling and the possibility to<br />
identify the pore structure and to model the sorption hysteresis with the use of BJH model of<br />
capillary condensation. The approach is applicable for the type IV isotherms and type H1<br />
hysteresis, typical for porous materials containing well defined cylindrical‐like pores.<br />
In this paper the validity of capillary condensation sorption model and the equivalence of its<br />
application for nitrogen and water vapour sorption for various highly porous building and<br />
materials are proved. The validity criteria used were: the similarity of the specific surface areas<br />
and the similarity of the adsorbate volumes at 95 % relative pressure for the analysed sorbates.<br />
2. Measurements<br />
For two lightweight plasters and four calcium silicate plates the measurements of the nitrogen<br />
and water vapour sorption were carried out. From the results of the measurements the sorption<br />
isotherms and the specific surface areas were determined.<br />
Nitrogen adsorption‐desorption isotherms of nitrogen gas at liquid nitrogen temperature were<br />
obtained with Quantachrome Autosorb iQ Station 1 instrument. The isotherms were obtained<br />
for the 0.01 – 0.99 relative pressure range.<br />
Water sorption isotherms were determined with Aquadyne DVS Water Sorption Analyser, an<br />
integrated microbalance system for the automatic study of dynamic water sorption at ambient<br />
pressure. The isotherms were determined in 0.1 – 0.98 relative pressure range.
Material Bulk density<br />
Table 1: Basic parameters of analysed materials<br />
(kg/m 3 )<br />
Porosity<br />
(‐)<br />
Nitrogen<br />
specific surface<br />
area (m 2 /g)<br />
Lightweight carbonate 610 0.67 18.45 16.25<br />
Lightweight lime‐cement plaster 670 0.63 30.08 9.75<br />
Calcium silicate A 240 0.91 18.93 25.27<br />
Calcium silicate B 240 0.91 19.93 32.49<br />
Calcium silicate C 200 0.93 48.54 50.54<br />
Calcium silicate D 280 0.90 21.31 43.32<br />
Water vapour<br />
specific surface<br />
area (m 2 /g)<br />
The basic parameters of the analysed materials are presented in Table 1. The values of specific<br />
surface area for water vapour are lower than for nitrogen in a case of lightweight plasters and<br />
higher in a case of calcium silicates.<br />
3. Analysis<br />
The analysis of the results of measurements was focused on two parameters: the specific surface<br />
area and the adsorbate volume at 95 % relative pressure. These parameters for each material<br />
were compared from the aspect of their similarity for analysed sorbates. The similarity was<br />
evaluated by the specific surface areas ratio determined for water and nitrogen Awater/AN, as well<br />
as by the ratio of the adsorbates volumes at 95 % relative pressure Vwater/VN. The obtained ratios<br />
were then compared. From (Fig. 1) it is evident that for all analysed materials the ratios of<br />
specific surface areas and adsorbed volumes are close. For the analysed materials the values of<br />
Vwater/VN ratios represent ca 0.78 portion of the Awater/AN ratios.<br />
This result can be explained if we suppose that the thickness of the adsorbate layer t(p/po) on the<br />
adsorbate relative pressure p/po is expressed in (nm) by Halsey equation:<br />
1/<br />
n<br />
5 <br />
t <br />
(1)<br />
ln(<br />
p0<br />
/ p)<br />
<br />
where is the effective diameter of sorbate molecule equal to 0.277 nm for water and 0.354 nm<br />
for nitrogen, n equals approximately 3.<br />
The value 0.78 is identical with the ratio of effective diameters of water and nitrogen molecules<br />
and the following relationship between the measured water and nitrogen sorption parameters<br />
is valid:<br />
V<br />
V<br />
water<br />
N<br />
. 78<br />
A<br />
A<br />
water 0 <br />
(2)<br />
N<br />
117
Figure 1: Similarity between ratio of specific surface areas (Awater/AN) and ratio of sorbate volumes at<br />
95% rel. pressure (Vwater/VN), ‐‐‐‐ equality reduced by ratio of effective diameters of water and nitrogen<br />
molecules equal to 0.78<br />
The fact that the ratios of specific surface areas and volumes at 95 % relative pressure for both<br />
sorbates are proportional suggests that the multilayer adsorption on the pore surfaces is the<br />
dominant process and the nitrogen and water sorption can be modelled with use of Halsey<br />
equation as the product of adsorbate layer thickness and specific surface area:<br />
118<br />
pp tp/<br />
p A<br />
V / <br />
(3)<br />
0<br />
0<br />
In case of the sorption hysteresis the desorption is realised at lower relative pressures than the<br />
sorption, considering the cylindrical capillary model at the capillary condensation (Gregg and<br />
Sing, 1982). This results from a theoretical assumption that at the sorption the relative humidity<br />
corresponds to the creation of the cylindrical multilayer water film of the limited stability,<br />
spontaneously filling the capillary and converting into the spherical capillary meniscus and so<br />
the desorption relative humidity corresponds to this water meniscus existence. Under this<br />
assumption there are the corresponding sorption and desorption relative humidities at a given<br />
equilibrium moisture content.<br />
A modelling of the sorption hysteresis by capillary condensation model then is based on the use<br />
the classical Kelvin equation for water in the cylindrical pore:<br />
k <br />
V<br />
ln p/ p0<br />
<br />
(4)<br />
r R T<br />
p<br />
where is the surface tension, V is the molar volume, R is the universal gas constant, T is the<br />
temperature, rp is the pore radius in (nm) and k = 1 at adsorption and 2 at desorption and the<br />
following relationship results (Gregg and Sing, 1982):<br />
<br />
(5)<br />
desorption<br />
2<br />
sorption<br />
V w / V N (‐)<br />
A w / A N (‐)<br />
The desorption isotherm then can modelled from the adsorption one replacing the relative<br />
pressures by their squares.
Amount adsorbed (m 3 /m3)<br />
Amount adsorbed (m 3 /m3<br />
Lightweight carbonate<br />
Nitrogen ‐ measurement<br />
Nitrogen ‐ model<br />
Water vapour ‐<br />
measurement<br />
Relative pressure (‐)<br />
Lightweight carbonate<br />
Measuremen<br />
t<br />
Relative pressure (‐)<br />
Figure 2: Sorption isotherms of lightweight carbonate and lightweight lime‐cement plaster for nitrogen<br />
and water vapour – up and nitrogen sorption – desorption isotherms ‐ below<br />
In Figure 2 there are results for lightweight plaster materials. The lightweight carbonate gives<br />
an evident identity of nitrogen and water sorption. The modelling of nitrogen sorption by<br />
Equation (3) is almost identical with measurement, considering the use of coefficient 3 instead<br />
of coefficient 5 in Equation (1). The application of capillary condensation desorption model<br />
gives results comparable with measurement.<br />
The results for lightweight lime‐cement plaster give differences between nitrogen and water<br />
sorption. The multiplication of water vapour sorption values by water/nitrogen specific surface<br />
area ratio gives a similarity with nitrogen sorption curve. The use of coefficient 3 in Equation (1)<br />
is optimum in modelling the nitrogen adsorption. The capillary condensation model of<br />
hysteresis is applicable for this material.<br />
For both plasters the modelling by Equation (1) does not satisfy in relative pressures region<br />
corresponding to the validity of BET equation.<br />
Amount adsorbed (m 3 /m3<br />
Amount adsorbed (m 3 /m3<br />
Lightweight lime‐ cement plaster<br />
Nitrogen ‐ measurement<br />
Nitrogen ‐ model<br />
Water vapour ‐<br />
measurement<br />
Wate vapour ‐ correction<br />
Relative pressure (‐)<br />
Lightweight lime ‐ cement plaster<br />
Measuremen<br />
t<br />
Relative pressure (‐)<br />
119
120<br />
Amount adsorbed (m 3 /m3<br />
Amount adsorbed (m 3 /m3<br />
Calcium silicate A<br />
Measurement<br />
Model<br />
Relative pressure (‐)<br />
Calcium silicate A<br />
Measurement<br />
Model<br />
Relative pressure (‐)<br />
Figure 3: Sorption isotherms of calcium silicates A and B for nitrogen and water vapour – up and<br />
nitrogen sorption – desorption isotherms – below<br />
In Figure 3 there are results for calcium silicates A and B. The calcium silicate A gives almost the<br />
identity of nitrogen and water sorption. The modelling of nitrogen sorption by Equation (3) is<br />
almost identical with measurement, considering the use of coefficient 3 instead of coefficient 5<br />
and n = 2.5 in Equation (1). The application of capillary condensation desorption model gives<br />
results comparable with measurement.<br />
The results for calcium silicate B give identity of nitrogen and water sorption. The use of<br />
coefficient 3 and n = 2.5 in Equation (1) is optimum in modelling the nitrogen adsorption. The<br />
capillary condensation model of hysteresis is applicable for this material.<br />
Amount adsorbed (m 3 /m3<br />
Amount adsorbed (m 3 /m3<br />
Calcium silicate B<br />
Measurement<br />
Model<br />
Relative pressure (‐)<br />
Calcium silicate B<br />
Measurement<br />
Model<br />
Relative pressure (‐)
Amount adsorbed (m 3 /m3<br />
Amount adsorbed (m 3 /m3<br />
Calcium silicate C<br />
Measurement<br />
Model<br />
Water vapour ‐<br />
measurement<br />
Relative pressure (‐)<br />
calcium silicate C<br />
Measuremen<br />
t<br />
Relative pressure (‐)<br />
Figure 4: Sorption isotherms of calcium silicates C and D for nitrogen and water vapour – up and<br />
nitrogen sorption – desorption isotherms – below<br />
In Figure 4 there are results for calcium silicates C and D. The calcium silicate C gives almost the<br />
identity of nitrogen and water sorption. The modelling of nitrogen sorption by Equation (3) is<br />
almost identical with measurement, considering the use of coefficient 3 instead of coefficient 5<br />
and n = 2.9 in Equation (1). The application of capillary condensation model for desorption<br />
gives results comparable with measurement.<br />
The results for calcium silicate D give identity of nitrogen and water sorption. The<br />
multiplication of water vapour sorption values by water/nitrogen specific surface area ratio<br />
gives a similarity with nitrogen sorption curve. The use of coefficient 3 and n = 2.5 in Equation<br />
(1) is optimum in modelling the nitrogen adsorption. The capillary condensation model of<br />
hysteresis is applicable for this material.<br />
Amount adsorbed (m 3 /m3<br />
Amount adsorbed (m 3 /m3<br />
Calcium silicate D<br />
Measurement<br />
Model<br />
Relative pressure (‐)<br />
Calcium silicate D<br />
Measurement<br />
Model<br />
Relative pressure (‐)<br />
121
3. Conclusions<br />
For two lightweight plasters and four calcium silicate boards the capillary condensation model<br />
of sorption based on the application of Halsey equation was verified. The model data were<br />
determined from the results of nitrogen and water vapour sorption experiments. The results<br />
were compared with the measured sorption isotherms and confirmed an appropriate<br />
agreement.<br />
Acknowledgment<br />
This article has been produced with the financial assistance of the European Regional<br />
Development Fund (ERDF) under the Operational Programme Research and<br />
Development/Measure 4.1 Support of networks of excellence in research and development as<br />
the pillars of regional development and support to international cooperation in the Bratislava<br />
region/Project No. 26240120020 Building the centre of excellence for research and development<br />
of structural composite materials – 2nd stage.<br />
References<br />
[1] MIHÁLKA, P. - MATIAŠOVSKÝ, P. - VASILKOVOVÁ, B. Sorption hysteresis of<br />
lightweight carbonate plasters. In <strong>Thermophysics</strong> 2011 - <strong>Conference</strong> <strong>Proceedings</strong>. 16<br />
international meeting of thermophysical society. Editor Oldřich Zmeškal. - Brno : Brno<br />
University of Technology, Faculty of Chemistry. 2011. p. 157-165. ISBN 978-80214-4345-<br />
7<br />
[2] GREGG, S. J. ‐ SING, K. S. W. Adsorption, Surface Area and Porosity, Academic Press,<br />
London. 1982<br />
122
Analysis of Luikov´s model in the process of heat and moisture<br />
transfer inside of a slab of ceramic<br />
E. Martines‐Lopez 1 , L. Lira‐Cortés 1<br />
1 División de Termometría, Centro Nacional de Metrología. Km 4.5 Carretera a Los Cués, el<br />
Marques Querétaro, México<br />
email:emartine@cenam.mx<br />
Abstract: The heat and moisture transfer is a complex process, because of the many factors that affect its<br />
behavior, such as the involved thermophysical properties, the experimental setup and those due to done<br />
assumptions to develop the model that describes the process.<br />
The Luikov’s model has been widely used to describe the heat and moisture transfer inside of capillary‐<br />
porous materials, which can be solved analytically for some specific cases, and obtain an exact solution.<br />
This solution is useful to obtain the prediction curves (for temperature and moisture) however, in order to<br />
improve it closeness to a real process, it is necessary to take into account involved uncertainties of the<br />
thermophysical coefficients (thermal and moisture conductivity coefficients, phase change coefficient, etc.)<br />
and the experimental conditions under which the process is realized.<br />
In this work, an analytical solution is presented, which it is based on Cheng and Liu method; and an<br />
analysis of the main factors that influence the heat and moisture distribution is realized, which was<br />
applied for a slab of ceramic material.<br />
Keywords: Luikov, moisture transfer, heat transfer, drying, temperature, uncertainty.<br />
1. Introduction<br />
The heat and moisture transfer in capillary‐porous bodies is relevant in many processes where<br />
these kinds of materials are present; some of these materials are: foods, wood and related<br />
materials, building materials and some others. The importance of the study of the heat and<br />
moisture transfer processes is related with food preservation, energy saving, building<br />
protection, trading, materials transportation savings, food processing, development of new<br />
materials, etc.<br />
There are several models that describe the moisture transfer capillary porous materials, some of<br />
the most used due to: Philip and deVries, Kowalsky, Whitaker, Luikov and others [1, 2, 3].<br />
The Luikov´s model perhaps is one the most extensively used to describe the heat and moisture<br />
transfer in capillary porous materials which was derived using the principles of irreversible<br />
thermodynamical processes and the conservation laws of energy and mass. It has been solved<br />
by several methods including analytical and numerical methods [3, 4, 5, 6, 7].<br />
Although an analytical solution gives exact results, under the assumption that involved<br />
thermophysical coefficients are exact, in practice the coefficients are obtained experimentally<br />
and have associated uncertainties, which affect to the temperature and moisture prediction<br />
curves, as consequence they are deviated from the experimental curves.<br />
In order to have a better closeness to a real drying curve respect to the solution of Luikov´s<br />
model, it is necessary identify the most important influence factors. In [5, 7, 8, 9 and 10] are<br />
analyzed some influence factors, however some others are lacking in the analysis.<br />
123
In this work, it is described the solution of the Luikov model for a ceramic slab using the<br />
potential function described by Cheng and Liu in [4], and a evaluation of the major influence<br />
factors in the moisture and temperature distribution during drying of a slab of ceramic is<br />
realized.<br />
124<br />
2. Luikov’s model<br />
The Luikov model is a system of coupled partial differential equations of second order, which<br />
describes the heat and moisture transfer in capillary‐porous materials. This model was derived<br />
using irreversible thermodynamic principles and conservation laws for matter and energy [1].It<br />
has been solved for simple geometries such as slabs, cylinders and spheres and for 1D, 2D and<br />
3D.<br />
For this work, consider a flat plate of a capillary‐porous body with a thickness of 2L (see Figure<br />
1), whose initial moisture and temperature conditions are U0 and T0 respectively, which is<br />
exposed to a drying environment with moisture and temperature Ua and Ta respectively (Figure<br />
1).<br />
Figure 1. A slab of a capillary‐porous material<br />
If it is assumed that the cross section of the material is sufficiently large with respect of its<br />
thickness, this problem could be outlined as a problem in one dimension (1D).<br />
According to the above described, the Luikov´s model is given by,<br />
<br />
<br />
2<br />
T ( x,<br />
t)<br />
T ( x,<br />
t)<br />
U<br />
( x,<br />
t)<br />
K q C<br />
2<br />
t<br />
x<br />
t<br />
Cq m<br />
U<br />
( x,<br />
t)<br />
t<br />
T ( x,<br />
t)<br />
x<br />
2<br />
Cm K m<br />
2 K m<br />
2<br />
U ( x,<br />
t)<br />
2<br />
x<br />
Where T , temperature potential; U, moisture potential; t , time; Kq , the thermal conductivity<br />
coefficient; Km , moisture conductivity coefficient; Cq , specific heat coefficient; Cm , specific<br />
moisture coefficient; , ratio of vapor diffusion coefficient to the total moisture diffusion<br />
coefficient ; , heat phase change coefficient; , thermogradient coefficient; , density<br />
(1)<br />
(2)
Equation (1) describes the heat transfer within a body by conduction and includes a term for the<br />
heat transfering due to the phase changes in the body; equation (2) describes the moisture<br />
transfer by diffusion, and includes a term that expresses the moisture transfer by temperature<br />
gradients.<br />
To complete the problem statement (direct problem) is necessary to specify the boundary and<br />
initial conditions. Assuming that ceramic plate is symmetric, the problem analysis can be done<br />
for the half of a plate, i.e. for 0≤x≤L.<br />
The boundary conditions for this problem are derived from the mass and energy balance at the<br />
surface (x=L) and at the center of the material (x=0). These conditions are given as follows:<br />
At x=±L<br />
T<br />
( x,<br />
t)<br />
K q q T( x,<br />
t)<br />
Ta<br />
( 1<br />
) mU(<br />
x,<br />
t)<br />
U<br />
a 0 (3)<br />
x<br />
U<br />
( x,<br />
t)<br />
T<br />
( x,<br />
t)<br />
K m K m<br />
m U( x,<br />
t)<br />
U<br />
a 0 (4)<br />
x<br />
x<br />
Equation (3) describes the heat balance considering heat conduction into the body and<br />
convection at the surface; a term due to the heat of phase changes of water into the pores of the<br />
body also is included, while equation (4) describes the moisture balance regarding the presence<br />
of moisture flow and a moisture term due to temperature gradients.<br />
At x=0 (center of slab) there is no heat and moisture flow, so,<br />
T<br />
( 0,<br />
t)<br />
0<br />
x<br />
U<br />
( 0,<br />
t)<br />
0<br />
x<br />
Initial conditions are for temperature and moisture at t=0 are T0 and U0 respectively, i.e.,<br />
T( x,<br />
0)<br />
T<br />
(7)<br />
0<br />
U( x,<br />
0)<br />
U<br />
(8)<br />
2.1 Solution method<br />
0<br />
In order to obtain the solution of the equations system (eq. 1 and 2), the following conditions are<br />
assumed:<br />
The thermophysical coefficients are constants<br />
The capillary‐porous bodies have open capillaries<br />
The solid matrix (skeleton) does not experiment deformations during the drying<br />
The gravitational effects are neglected<br />
The method used for the solution of Luikov´s model is outlined by Liu and Cheng in [4],<br />
where the first step is the transformation of the non homogeneous equations system to a<br />
homogeneous one, by mean of the transformation,<br />
T( x,<br />
t)<br />
T ( x,<br />
t)<br />
T<br />
(9)<br />
l<br />
l<br />
a<br />
U( x,<br />
t)<br />
U ( x,<br />
t)<br />
U<br />
(10)<br />
a<br />
(5)<br />
(6)<br />
125
Next step is using a potential function (x,t), which allows transform the coupled system of two<br />
partial differential equations second order to a fourth order partial differential equation . The<br />
Liu and Cheng potential is given as<br />
126<br />
<br />
2<br />
<br />
( x,<br />
t)<br />
K C<br />
(11)<br />
m 2<br />
x<br />
t<br />
<br />
T1 m<br />
2<br />
<br />
U1 ( x,<br />
t)<br />
K<br />
m (12)<br />
2<br />
x<br />
With the use of , the resulting equation is solved by the separation of variables method,<br />
therefore the final solution is given by the equations (13) and (14),<br />
2<br />
2<br />
KmD<br />
1 Cm<br />
Acos<br />
D1x<br />
( K<br />
mD2<br />
C<br />
) Bcos<br />
D2x<br />
2<br />
2 <br />
t 2<br />
2<br />
e DAcos D x<br />
D Bcos<br />
D x<br />
2<br />
2 <br />
t<br />
T1 ( x,<br />
t)<br />
e<br />
m<br />
U ( x,<br />
t)<br />
K <br />
1<br />
m<br />
1<br />
1<br />
2<br />
where A, B, C, D1 and D2 are constant coefficients and are the eigenvalues of a transcendental<br />
equation. Values are obtained from the boundary conditions in equations (13) and (14), where<br />
it is obtained the following:<br />
2<br />
<br />
q m<br />
DD D l<br />
tan D l<br />
<br />
D<br />
tan D l<br />
<br />
D<br />
tan D l<br />
0<br />
1<br />
2 tan 1<br />
2 1 2<br />
2 2 1<br />
1<br />
Equation (15) is nonlinear and could take an infinite number of values, even complex values.<br />
According to the ‐values (eigenvalues), the general solution of Luikov’s model for a slab is<br />
written by<br />
2<br />
<br />
2<br />
2<br />
KDCcos D x ( K<br />
D c<br />
) g(<br />
) cos D x<br />
<br />
T1 ( x,<br />
t)<br />
2<br />
2 <br />
n t<br />
An<br />
n e<br />
n1<br />
m 1 m 1 n<br />
m 2 m n<br />
2<br />
n<br />
2<br />
2<br />
Dcos D x g(<br />
) D g(<br />
) cos D x<br />
<br />
U1( x,<br />
t)<br />
2<br />
2 <br />
n t<br />
K mn<br />
e An<br />
n1<br />
1 1 n<br />
n 2 n<br />
2n<br />
In the solution of the Luikov´s model, the calculation of eigenvalues is very important since<br />
these could take real and complex values and affect the moisture and temperature distribution<br />
[4, 5, 6]. In this analysis, were not considered the existence of complex eigenvalues.<br />
The methods used to calculate the eigenvalues were a combination of the Newton‐Raphson and<br />
bisection methods.<br />
2.2 Temperature and moisture distribution for a slab of ceramic<br />
The obtained solution for the Luikov´s model was evaluate in the drying of a slab of ceramic<br />
assuming the thermophysical properties and drying conditions given in table 1 (Data from<br />
Alvarez G. et al. given in [5]).<br />
The solution of the Luikov model was obtained using 56 real eigenvalues of the transcendental<br />
equation (15). However, it was found that using 5 real eigenvalues, is good enough to satisfy<br />
the temperature and moisture distribution satisfies the initial conditions.<br />
K<br />
q<br />
K<br />
m<br />
(13)<br />
(14)<br />
(15)<br />
(16)<br />
(17)
Table 1.Thermophysical coefficients and drying conditions for a slab of ceramic<br />
Property Value Units<br />
Kq 1.143 W∙m ‐1 ∙K ‐1<br />
Km 1.1e‐7 Kg∙m ‐1 ∙s ‐1 ∙% ‐1<br />
Cq 835 J∙kg ‐1 ∙K ‐1<br />
Cm 0.0018 kg(moisture)∙kg ‐1 (dry body)∙% ‐1<br />
1260 kg∙m ‐3<br />
0.30 dimensionless<br />
2.5e6 J∙kg ‐1<br />
0.56 %∙K ‐1<br />
q 35 W∙m ‐2 ∙K ‐1<br />
m 8.64e‐6 Kg∙m ‐2 ∙s ‐1 ∙% ‐1<br />
Drying conditions<br />
L 0.005 m<br />
T0 10 °C<br />
Ta 60 °C<br />
U0 90 %<br />
Ua 5 %<br />
The model predicts that the required time to dry the sample from 90 % to 5 % of moisture<br />
content at 60 °C, is 160 minutes (x=L), while 170 minutes are required to dry it at the center(x=0).<br />
The same times are required to reach the drying temperatures (Figure 2).<br />
U(x,t)<br />
100.0<br />
90.0<br />
80.0<br />
70.0<br />
60.0<br />
50.0<br />
40.0<br />
30.0<br />
20.0<br />
10.0<br />
0.0<br />
0.0<br />
0 50 100 150 200<br />
time/min<br />
Figure 2. Temperature and moisture profiles at x=0.005 m for a slab of ceramic.<br />
During the first 40 minutes about 82 % of water is evaporated, which is about one fourth of the<br />
total drying time. Then, the evaporation is reduced (falling rate period), and are required more<br />
than 100 minutes to drying the sample down to 5 % of moisture content.<br />
U(x,t)<br />
Tl(x,t)<br />
70.0<br />
60.0<br />
50.0<br />
40.0<br />
30.0<br />
20.0<br />
10.0<br />
T(x,t)<br />
127
128<br />
3. Evaluation of the influence factors in the prediction of the heat and moisture<br />
distribution<br />
The given solution for the Luikov´s model is exact; however in real experimental conditions its<br />
evaluation is affected by many influence factors, which as consequence affect the moisture and<br />
temperature profiles.<br />
The influence factors could be classified as: a) those due to thermophysical coefficients involved<br />
directly in the drying model and, b) those due to quantities and thermophysical coefficients as<br />
result of the establishment of the initial and boundary conditions.<br />
In the first case are found the coefficients of equations (1) and (2), while in the second one the<br />
coefficients of equations (3) and (4), in the latter the thickness of the slab is included. These<br />
coefficients are identified in table 2.<br />
In addition to the influence factors abovementioned, the number of eigenvalues, also have a<br />
contribution in the moisture and temperature profiles. This effect was evaluated by using a<br />
different number of eigenvalues and then the estimation of temperature and moisture profiles<br />
was performed. As was already mentioned, the use of 5 eigenvalues satisfied the initial<br />
conditions with an error less than 0.1 %.<br />
As was described, the existence of complex eigenvalues in the transcendental equation,<br />
improves the temperature and moisture profiles and there exist a better closeness to the initial<br />
conditions, however, as can see in Figure 2, for this case the use of only real eigenvalues was<br />
good enough because it is satisfied the problem conditions.<br />
a) Thermophysical coefficients of Luikov´s model<br />
In the Luikov´s model are found eight thermophysical coefficients (Kq , Km , Cq , Cm , , , , ),<br />
which values are obtained by experiments with their respective uncertainties. Some of these<br />
coefficients, such as Km, , are difficult to measure, even are difficult to be found in the<br />
literature [9, 10].<br />
b) Quantities and thermophysical coefficients due to initial and boundary conditions.<br />
In this case are included the coefficients and variables involved in initial and boundary<br />
conditions, such as convective coefficient of heat(q), convective coefficient of moisture (m), and<br />
moisture (U0) and temperature (T0). Also, in this classification is included the thickness of the<br />
slab (L). The contributions of U0 and T0 essentially are due to preparation of the sample before<br />
to start the drying process.<br />
In this work was assumed an uncertainty of 10 % of the coefficient values; which is reasonable if<br />
is considered that the coefficients are not constants under wide ranges of humidity and<br />
moisture (as was considered in this work). In table 2, the thermophysical coefficients and<br />
involved variables are shown.<br />
The estimation of the error propagation is obtained according to the ISO GUM [11], which is<br />
given as follows:<br />
2<br />
n<br />
n<br />
f<br />
2 f<br />
f<br />
u <br />
u xi<br />
2 cov( xi<br />
, x j )<br />
i 1 x <br />
<br />
i <br />
i j xi<br />
x j<br />
(18)
where f is the moisture content U(x,t) or T(x,t), xi are the influence factors and f/ xi are the<br />
sensitivity coefficients.<br />
If it is assumed no correlation among the influence factors, i.e. cov(xi,xj)=0, then the error<br />
propagation equation given as follows<br />
2<br />
n f<br />
2<br />
u <br />
u xi<br />
i1 x <br />
<br />
(19)<br />
i <br />
Table 2. Uncertainty of thermophysical coefficients<br />
Property u Units<br />
(a,b) Kq 11.43e‐1 W∙m ‐1 ∙K ‐1<br />
(a, b) Km 1.1e‐8 Kg∙m ‐1 ∙s ‐1 ∙% ‐1<br />
(a) Cq 83.5 J∙kg ‐1 ∙K ‐1<br />
(a) Cm 1.8e‐4 kg(moisture)∙kg ‐1 (dry body)∙% ‐1<br />
(a) 126 kg∙m ‐3<br />
(a,b) 0.03 non dimensional<br />
(a,b) 2.5e5 J∙kg ‐1<br />
(a,b) 0.056 %∙K ‐1<br />
(b) q 3.5 W∙m ‐2 ∙K ‐1<br />
(b) m 8.64e‐7 Kg∙m ‐2 ∙s ‐1 ∙% ‐1<br />
(b) L 1e‐3 m<br />
(b) T0 0.06 °C<br />
(b) Ta ‐‐‐ °C<br />
(b) U0 0.5 %<br />
(b) Ua ‐‐‐ %<br />
Due to the difficulties to obtain the sensitivity coefficients from equation (18), these were<br />
estimated changing each coefficient value for an amount (keeping constant the others) and<br />
evaluating its effect in U(x,t) and T(x,t). The ‐value used in the analysis was the uncertainty of<br />
the coefficient. According to this, the error propagation equation for the temperature and<br />
moisture distribution could be written by<br />
<br />
<br />
f<br />
<br />
K<br />
q<br />
<br />
<br />
<br />
<br />
2<br />
u<br />
2<br />
K<br />
q<br />
f<br />
<br />
<br />
<br />
K<br />
2<br />
2<br />
2<br />
2<br />
2<br />
f<br />
2 f<br />
2 f<br />
2 f 2 f<br />
2<br />
u u u u <br />
<br />
u q <br />
<br />
<br />
u <br />
<br />
m<br />
<br />
<br />
<br />
<br />
q <br />
m<br />
where f = U(x, t) o T(x,t).<br />
2<br />
f<br />
2 f<br />
2 f<br />
2<br />
u L u U 0 u T0<br />
L <br />
<br />
<br />
U <br />
<br />
<br />
<br />
0<br />
T <br />
<br />
0 <br />
m<br />
2<br />
<br />
<br />
<br />
<br />
2<br />
u<br />
2<br />
K<br />
m<br />
<br />
<br />
f<br />
<br />
<br />
C<br />
2<br />
q<br />
2<br />
<br />
<br />
<br />
2<br />
2<br />
2 f 2 f 2<br />
<br />
<br />
u Cq<br />
<br />
<br />
u Cm<br />
u <br />
C <br />
<br />
<br />
m <br />
<br />
<br />
<br />
(20)<br />
129
3.1 Influence factors in the moisture distribution<br />
The uncertainty of the influence factors in the moisture profiles during drying is shown in<br />
Figure 3.<br />
130<br />
u(x i)/%<br />
4.00<br />
3.50<br />
3.00<br />
2.50<br />
2.00<br />
1.50<br />
1.00<br />
0.50<br />
0.00<br />
‐0.50<br />
0 50 100<br />
time/h<br />
150 200<br />
Figure 3. Uncertainty values in the moisture distribution during drying.<br />
One the most important influence factor is the thickness of the sample which contributes up to<br />
about 3.7 % in the uncertainty of moisture content (in 25 minutes), after that time its uncertainty<br />
is reduced by less than 0. 5%. Also it affects the drying time, i.e. while higher is the thickness,<br />
drying time is longer. For the specific case when the thickness increasing in 1 mm, the drying<br />
time increases from 160 minutes up to 200 minutes.<br />
The convective coefficient of moisture (m) is included in the boundary conditions and its<br />
contribution to the uncertainty is important because its value affects the moisture distribution.<br />
As is expected, when the m increases, the drying is speed up, i.e. the reduction of its value<br />
diminish the moisture value and as consequence drying time is reduced in about 12 minutes.<br />
The specific moisture content (Cm) is a coupling factor in the Luikov´s model and it has a<br />
significant influence in the moisture profile. Its contribution to the total uncertainty reaches a<br />
maximum value of 1.6 % of moisture content. Also, drying time is affected because of changes<br />
of Cm, in fact at higher values the drying time increases.<br />
The density () affects the moisture distribution in the same way as Cm, even its contribution<br />
value is about the same.<br />
According to Figure 3, the initial moisture value (U0) of the material also affects the moisture<br />
distribution during drying, which is related with the moisture conditioning to a specific<br />
measured value of moisture content and (with an uncertainty of uU0). Its maximum<br />
contribution is 1.0 % and it is reduced as drying progresses.<br />
The remaining coefficients such as , , Km, etcetera, have negligible contributions.<br />
3.2 Influence factors in temperature distribution<br />
In Figure 4 are shown the uncertainty contributions to the temperature profiles during drying.<br />
As can see, the most important contributions are due to L, q, m(am), and Cm.<br />
K<br />
q<br />
K<br />
m<br />
C<br />
q<br />
C<br />
m
u(xi)/°C<br />
3.00<br />
2.50<br />
2.00<br />
1.50<br />
1.00<br />
0.50<br />
0.00<br />
0 50 100 150 200<br />
time/h<br />
Figure 4. Uncertainties in the temperature distributions during drying.<br />
In the same way as moisture distribution analysis, the thickness (L) has an important<br />
contribution in the temperature profile; in this case its maximum value of uncertainty is about<br />
2.5 °C.<br />
The convective heat coefficient q (aq) has a contribution similar to that of L. As it is expected,<br />
when q is increased, improves the heat transfer, as consequence the temperature distribution<br />
increases and drying temperature reaches the established temperature in shorter time.<br />
The coefficient is related with the heat phase change of water inside of material; when <br />
increases the temperature distribution is reduced and as consequence the drying time increases.<br />
Its maximum contribution is reached in about 10 minutes with a value of about 2.0 °C.<br />
The convective moisture coefficient m (am)is a coupling coefficient in the boundary conditions,<br />
for such reason it also affects the temperature profile; it s maximum is given during the first 10<br />
minutes and it reaches a maximum value of 1.5 °C of temperature.<br />
Finally the coefficients and Cm also have a contribution in the uncertainty of temperature<br />
distribution, which reach values of about 1.0 °C during the first 40 minutes, after that their<br />
contribution is reduced.<br />
The remaining coefficients have a negligible contribution.<br />
The temperature distribution is affected by the influence factors mainly during the first 30 or 40<br />
minutes and after this time their contribution is reduced.<br />
In Figures 5 and 6 are shown the moisture and temperature profiles and they include the error<br />
prediction curve for each case.<br />
In [5] the autors conclude that has not contribution while Km does it. In present work both <br />
and Km do not contribute significantly because in our case Km was very small compared with<br />
Km values used in [5]. In addition, here the analysis was extended to the other coefficients; some<br />
of them resulted with major influence in temperature and moisture profiles.<br />
The prediction error is reduced as the moisture and temperature reach the final condition. This<br />
is important for applications were falling rate period is of interest, for example in processes<br />
where is required to extract the total amount of water, or in metrological applications for<br />
moisture measurements where the dry oven method is used.<br />
Kq<br />
Km<br />
Cq<br />
Cm<br />
<br />
<br />
<br />
<br />
aq<br />
am<br />
U0<br />
T0<br />
(L)<br />
131
132<br />
T(x,t)/°C<br />
U(x,t)/%<br />
100<br />
90<br />
80<br />
70<br />
60<br />
50<br />
40<br />
30<br />
20<br />
10<br />
0<br />
Figure 5. Profile of the moisture content including the uncertainty of influence factors<br />
70<br />
60<br />
50<br />
40<br />
30<br />
20<br />
10<br />
0<br />
Figure 6. Profile of temperature in a slab of ceramic with its uncertainty due to influence factors.<br />
Among the coefficients which strictly are part of the model of Luikov and have major influence<br />
are those due to Cm, and . In [8] Ďurana et al describe the effect of and at high<br />
temperatures (in a fiber o reinforced cement) and concluded that does not have contribution,<br />
while could contribute up to about 1.4 % of moisture content when there are big changes of its<br />
value.<br />
The other influence factors will depend of the specific problem to be studied.<br />
4. Conclusions<br />
0 50 100 150 200<br />
Time/min<br />
The implementation of the solution of Luikov´s model for a slab of a capillary porous material<br />
(one dimensional analysis) was realized. The solution was obtained assuming constant values<br />
for the thermophysical properties and it is based on the Cheng and Liu method.<br />
The solution was applied to analyze the moisture and temperature transfer of a slab of ceramic<br />
during drying.<br />
U(x,t)<br />
0 50 100<br />
Time/min<br />
150 200<br />
U‐u<br />
U+u<br />
Tl(x,t)/C<br />
T‐u<br />
T+u
In addition, an analysis was performed to evaluate the influence factors in the prediction of the<br />
temperature and moisture distributions. This analysis allowed obtaining an error curve for the<br />
prediction of the moisture and temperature profiles in the slab of ceramic material, which is<br />
very useful in the heat and moisture transfer process.<br />
The most important influence factors in the moisture distribution were L, m, Cm, and U0,<br />
while in temperature distribution were L, q, m, Cm and . L, , Cm are properties of the material<br />
and U0, q, m are coefficients due to the experimental conditions during drying and therefore<br />
their uncertainty could be reduced improving the experimental conditions.<br />
Finally, according to the obtained results, the error in the prediction curve decreases in the<br />
falling rate period, which could be useful in drying processes where it is necessary to evaporate<br />
the whole amount of water of the body. One of such applications could be the moisture<br />
measurement by the gravimetric method in a drying oven.<br />
References<br />
[1] LUIKOV, A.W.: Heat and mass transfer in capillary‐porous bodies, Pergamon Press,<br />
Oxford (1966) Geophys. Union 38(2), 222–232, 1957.<br />
[2] PHILIP, J.R., DE VRIES, D.A.: Moisture movement in porous materials under temperature<br />
gradients. Trans. Am.Geopphysical Unionm Vol.38, No.2, pp 222‐232,1957.<br />
[3] HERNÁNDEZ RODRIGUEZ J. AND QUINTO DIEZ P., secado de medios porosos: una<br />
revisión a las teorías actualmente en uso, Científica, Vol.9, Num. 2, pp‐63‐71, 2005.<br />
[4] LIU, J. AND S.CHENG, Solutions of Luikov Equations of Heat and Mass Transfer in<br />
Caplillary‐Porous bodies,Int. Heat Mass Transfer, Vol.34, No.7, pp 1747‐1754 , 1991.<br />
[5] ALVAREZ G., MEDINA J., LIRA L., Aplicación de las soluciones reales y complejas de las<br />
ecuaciones de Luikov de transferencia d masa y energía, Información Tecnológica, Vol.<br />
12(6), 61‐68, 2001.<br />
[6] MIKHAILOV, M.D., OZISIK, M.N.: Unified analysis and solutions of heat and mass<br />
diffusion, Wiley, New York, 1984.<br />
[7] MURUGESAN ., SEETHRAMU K.N., ASWATHA NARAYANA P.A., A one dimensional<br />
analysis of convective drying of porous materials, Heat and Mass Transfer 32 (1996), pp.<br />
81‐88, Springer‐Verlag 1996.<br />
[8] ĎURANA K., MADĚRA J. ČERNỳ, Numerical analysis of coupled heat and moisture<br />
transfer in porous materials at high temperatures, <strong>Proceedings</strong> of <strong>Thermophysics</strong> 2010,<br />
November 2010, Brno University of Technology, ISBN 978‐80‐214‐4166‐8.<br />
[9] KANEVCE G.H. , KANEVCE L.P, DULIKRAVICH G.S., Influence of boundary conditions<br />
on moisture diffusivity estimation by temperature response of a drying body,<strong>Proceedings</strong><br />
of NHTC´00 34 th National Heat Transfer <strong>Conference</strong>, Pittsburg, Penn Sylvania, August 20‐<br />
22, 2000.<br />
[10] LOKOVICOVA J., ZAMECNIK J., Determination of cross‐coefficients for coupled heat<br />
and mass transport in porous media, proceedings of <strong>Thermophysics</strong> 2002, Constantine the<br />
Philosopher University, Nitra 2002.<br />
[11] Guide to the Expression of the Uncertainty in Measurement (ISO, Geneva, 1993).<br />
133
134<br />
Moisture risk evaluation and determination of required<br />
measures to avoid mould damage using the Folos 2D visual<br />
mould chart<br />
S. Olof Mundt‐Petersen 1 , Petter Wallentén 1 , Tomi Toratti 2 , Jorma Heikkinen 2<br />
1 Department of Building Physics, Faculty of Engineering, Lund University, P.O. Box 118, 221 00<br />
Lund, Sweden, email: Solof.Mundt_Petersen@byggtek.lth.se<br />
2 VTT, Helsinki, PL 1000, FIN‐02044 VTT, Finland<br />
Abstract: There is an increased interest in and awareness of mould growth damage in buildings. Today’s<br />
mould growth models are limited to only presenting the risk of mould growth. They do not take into<br />
account underlying factors and other parameters that make it possible to establish necessary measures to<br />
limit or avoid the risk of mould growth. This paper presents a chart that can be used to determine these<br />
measures, both to reduce the risk of mould growth in buildings and, at the same time, indicate the risk of<br />
mould growth. The chart can be based on all known risk models for mould growth. No new mould growth<br />
model is presented; only an illustration of how it is possible to use known models in practical moisture<br />
safety design processes. The chart can also be used to compare different structural designs, measured and<br />
calculated values, and to show how mould growth risk prediction depends on which mould model is used.<br />
Keywords: Mould model, risk of mould growth<br />
1. Introduction<br />
1.1 Background<br />
Newly introduced laws and requirements, in combination with observed mould growth<br />
damage in buildings, has meant increased interest in the factors affecting mould growth in<br />
buildings [1, 2, 3]. Furthermore, recent studies also show that today’s highly insulated buildings<br />
are more sensitive to mould growth damage [4]. Several models showing conditions for, and<br />
risk of, mould growth on building materials have also been developed. Most of the models are<br />
relatively similar, as shown in Figure 1. [5] However, many models are limited to only showing<br />
whether or not there is a risk of mould growth, below or above the critical lines in Figure 1,<br />
without presenting the underlying factors affecting the risk of mould growth or when the risk<br />
of mould growth would occur. The lack of knowledge about the underlying factors hides<br />
required measures to avoid mould growth and makes it difficult to compare different design<br />
solutions. Furthermore, there are different views on how the influence of duration should be<br />
regarded and how possible risk levels regarding mould growth should be dealt with [5, 6, 7, 8].<br />
1.2 Aim<br />
The purpose of this article is to present a chart that illustrates the underlying factors affecting<br />
the risk of mould growth in a specific location in a construction. Knowledge of these underlying<br />
factors makes it possible to evaluate the measures that can be taken to limit or avoid the risk of<br />
mould growth. Furthermore, the chart aims to make it possible to compare the conditions in<br />
different locations within a structure as well as different designs and different mould models.<br />
The risk of mould growth can be presented according to any chosen mould growth model.
1.3 Limitations<br />
This article is limited to presenting a chart that includes the factors used to evaluate the risk of<br />
mould growth and the measures that might be required in order to avoid mould growth. No<br />
new mould growth models are presented. However, the chart has been constructed in such a<br />
way that it can be used for any mould growth model.<br />
2. Fundamentals<br />
2.1 Factors affecting mould growth<br />
The risk of mould growth depends on several different factors. Besides different materials<br />
having different resistance to mould growth, there is wide agreement that the dominating<br />
factors affecting mould growth are temperature, relative humidity (RH) and duration above<br />
critical conditions, i.e. the length of time when temperature and RH allow mould growth to<br />
occur. [9, 10] As mentioned above, the different mould growth models show similar behaviour<br />
where the influence of temperature and RH is concerned, as shown in Figure 1 [5]. Critical<br />
conditions (RHcrit) are defined as the conditions when mould growth is possible. RHcrit varies<br />
depending on temperature, as shown in Figure 1 [5, 8]. RHcrit occurs when the RH, at a specific<br />
temperature and time, is above the specific RHcrit curve for each mould growth model. RHcrit<br />
does not necessary lead to mould growth. Different materials have different RHcrit lines [9].<br />
Figure 1: Different mould models show similar behaviour with respect to temperature and RH [5]<br />
Differences between existing mould growth models mainly concern the way in which the<br />
influence of duration is treated, if at all. The influence of duration includes both the conditions<br />
above RHcrit and the possible decline of mould growth during non‐critical conditions.<br />
Besides each material having specific limits for RHcrit and the influence of the main factors<br />
temperature, RH and duration above RHcrit, there are other factors that affect the risk of mould<br />
growth. Examples of such factors are the amount of dirt or dust on the surface of the material,<br />
surrounding microbial conditions, shortwave radiation and moisture content in the material [9].<br />
135
2.2 Examples of existing mould models<br />
Several mould models investigate the risk of mould growth using charts, as shown in Figure 1,<br />
to present their findings [5, 8]. During the evaluation of mould risk, isopleth dots, indicating an<br />
RH level and temperature at one specific time, are normally plotted on a chart similar to that in<br />
Figure 1. Hourly based evaluation over one year will give 8760 dots. Dots above the line<br />
indicate RHcrit conditions and dots below indicate non‐critical conditions [7, 8]. However, the<br />
point in time when critical conditions occur or the influence of duration is not shown.<br />
Mould models including the influence of duration mainly refer to a mould index (MI) or<br />
relative dose that must not be exceeded if mould growth is to be avoided. Some models take<br />
into account the effect of duration both during RHcrit conditions, with regard to germinating<br />
mould growth, and during non‐critical conditions with regard to the decline in mould growth,<br />
as shown in Figure 2. [5, 6] Other models only deal with the influence of duration during RHcrit<br />
conditions and do not take into account any decline of mould growth [5, 7]. However, factors<br />
that affect the mould index or relative dose, such as RH or temperature or the vapour content,<br />
are not shown. There are also models that calculate the probability of mould growth in relation<br />
to duration time [12]. Some models only present a number as mould growth risk [13].<br />
Figure 2: Mould model that takes into account the influence of duration on mould growth and decline of<br />
mould growth without showing the factors affecting the risk of mould growth [6]<br />
3. Description of the Folos 2D visual mould chart<br />
3.1 Parameters in the Folos 2D visual mould chart<br />
The Folos 2D visual mould chart, shown in Figure 3, visualizes the factors temperature (yellow)<br />
on the right y‐axis and RH (turquoise), RHcrit (red), the RH > RHcrit difference (light brown) and<br />
MI divided by 10 (green dotted line) on the left y‐axis. The time presented on the x‐axis<br />
indicates the conditions at each specific time and particularly the periods when RH > RHcrit.<br />
When a moisture risk evaluation is carried out in the design phase, temperatures and RHs are<br />
calculated. Normally, the calculated RHs for one year are shown as 8760 isopleth dots in a chart<br />
136
similar to that in Figure 1. The same RH isopleth dots create a line when presented over time in<br />
the Folos 2D visual mould chart. The temperature is also given for each specific point in time.<br />
RHcrit conditions occur, and mould growth is possible, when the RH is above the RHcrit line. The<br />
RHcrit line is defined by the temperature that, at any specific time, exceeds the RHcrit limit as<br />
shown in Figure 1. I.e. the chosen RHcrit line from Figure 1 is converted over time by using the<br />
actual temperature at each point in time. This means that RHcrit conditions depend on the<br />
prevailing RH and temperature, where a high temperature gives a low RHcrit line and vice<br />
versa. Depending on the legislation in different countries, the RHcrit line could be used to define<br />
a limit [2, 14]. The RHcrit line in Figure 3 is based on the Viitanen curve shown in Figure 1.<br />
However, it is easy to use another mould growth model by choosing another appropriate curve.<br />
Figure 3: The Folos 2D visual mould chart with calculated values for the basic construction (BC) shown<br />
in Figure 4 including the parameters temperature (yellow), RH (turquoise), RHcrit (red), RH > RHcrit<br />
(brown) and MI (green dotted line).<br />
The parameter RH > RHcrit shows how much, when and for how long RH exceeds RHcrit.<br />
The parameter MI shows the mould index as described in [11, 15]. In order to read the correct<br />
MI value, the scale number on the left‐hand y‐axis must be divided by 10, i.e. 10 = 1, 20 = 2 etc.<br />
Furthermore, the vapour content could also be of interest. This can be easily calculated from the<br />
temperature and RH using Equation 1 and added to the chart.<br />
v<br />
RH (1)<br />
v<br />
s<br />
Where RH is the relative humidity, v the vapour content and vs the vapour content at<br />
saturation, depending on the temperature. [16] RH and temperature are known from the initial<br />
calculated conditions.<br />
Other factors that affect the risk of mould growth, such as climate conditions or moisture<br />
content, could also be added to the Folos 2D visual mould chart.<br />
137
3.2 Evaluating the risk of mould growth and required measures to limit the risk of damage<br />
RHcrit periods, when mould growth is possible, are shown as periods when RH > RHcrit in the<br />
Folos 2D visual mould chart. The greater the RH > RHcrit differences and the longer the periods<br />
when RH > RHcrit, the higher the risk of mould growth.<br />
The level of RH and, furthermore, the risk of mould growth on a specific material can mainly be<br />
affected by changing the vapour content or the temperature, which affects the vapour content at<br />
saturation. A lower level of vapour content or a higher temperature gives a lower RH as shown<br />
in Equation (1). [16] By using this relationship it is easy to define what measures are needed.<br />
Periods with RH > RHcrit and high temperatures, June to September in Figure 3, have to be dealt<br />
with using measures that reduce the vapour content, such as higher rates of ventilation in the<br />
façade air gap, as shown in Figure 4.<br />
Periods with RH > RHcrit and low temperatures and low vapour content, October to November<br />
in Figure 3. This period could be dealt by applying measures that result in higher temperatures,<br />
such as fitting a mould‐resistant insulation board onto the outer frame, as shown in Figure 4.<br />
Shorter periods with RH > RHcrit, December to March in Figure 3, would probably not need to<br />
be dealt with as the duration of RH > RHcrit is not long enough to create mould growth.<br />
However, in some cases, measures are required that can create both lower vapour contents and<br />
higher temperatures.<br />
If it not is possible to create non‐critical conditions, or the risk of mould growth is not predicted<br />
to be eliminated by a model that includes the influence of duration, the design might have to be<br />
changed. Materials could be replaced by materials with higher resistance to mould growth, i.e. a<br />
material that has a higher RHcrit limit. The design could also be changed in such a way that more<br />
or less vapour transport, dependent on the design, through different material layers is possible.<br />
Figure 4: Example of possible measures that could be used in Swedish climate conditions to eliminate or<br />
reduce the risk of mould growth [4]. Calculations made using WUFI 5.0 [17]<br />
4. Other possible comparisons using the Folos 2D visual mould chart<br />
The Folos 2D visual mould chart could also be used to compare different locations within<br />
structures or different structural designs, different mould models with different risk levels of<br />
mould growth, and differences between measured and calculated temperature and RH in actual<br />
138
structures. Figure 5 shows a comparison carried out using WUFI 5.0 calculations for the Basic<br />
Construction (BC) and the Modified Construction (MC) shown in Figure 4. Figure 6 shows an<br />
example of how the Folos 2D visual mould chart could be used to compare measured and blind<br />
calculated values.<br />
Figure 5: Folos 2D visual mould chart with comparison of critical location in the basic (BC) and modified<br />
(MC) structure. BC temperature (yellow), MC temperature (dark blue), BC RH (turquoise), MC RH<br />
(black), RHcrit depending on BC temperature (red), MC RH > RHcrit (brown), MC RH > RHcrit<br />
(purple).<br />
Figure 6: Folos 2D visual mould chart with comparisons of measured and calculated temperatures and<br />
RH in a construction [18]. Levels of RHcrit from LIM I in Figure 1 [8]. Measured temperature (dark<br />
blue), calculated temperature (yellow), measured RH (black), calculated RH (turquoise), RHcrit<br />
depending on calculated temperature (red), measured RH > measured RHcrit (purple), calculated RH ><br />
RHcrit (brown).<br />
139
In order to limit the number of plots, there is only one RHcrit plot and no mould index (MI) in<br />
Figures 5 and 6. Gaps in the comparison between measured and calculated values indicate a<br />
lack of measured values.<br />
In the comparisons between measured and calculated values, differences can be seen in the<br />
Folos 2D visual mould chart, as shown in Figure 6. By using the relationship in Equation 1, it is<br />
easy to determine whether the differences between the measured and calculated RH depend on<br />
the differences between measured and calculated temperature, or vapour content, or both. A<br />
separate plot for calculated vapour content might need to be added to the chart.<br />
5. Discussion<br />
The article demonstrates how the Folos 2D visual mould chart might be used to evaluate the<br />
risk of mould growth and, at the same time, establish what measures need to be taken to limit<br />
or avoid the risk of mould growth. This is done by investigating the underlying factors, such as<br />
temperature and RH. The Folos 2D visual mould chart could also be used to compare different<br />
structural designs, measurements and calculations, and different mould models. To encourage<br />
the use of the Folos 2D visual mould chart it could be introduced as a tool when implementing<br />
the ByggaF moisture safety design recommendations during the design phase [19].<br />
Acknowledgments<br />
This project was supported by Vinnova and conducted in collaboration with the Swedish<br />
wooden house manufacturing companies Myresjöhus AB, Götenehus, Willa Nordic,<br />
Hyresbostäder i Växjö, Martinsons and Lindbäcks trä when carrying out the projects “Wood<br />
framed buildings of the future”, “Woodbuild” and “ECO2 – Carbon efficient timber<br />
construction”.<br />
References<br />
[1] THE SWEDISH MINISTRY OF HEALTH AND SOCIAL AFFAIRS. Plan och bygglagen<br />
2010:900, The Swedish Planning and Building Act. Chapter 8 4§ 3. SFS 2010:900<br />
[2] SWEDISH NATIONAL BOARD OF HOUSING, BUILDING AND PLANNING. BBR 2008<br />
– Boverkets Byggregler 2008, BBR 2008 – Swedish Building Regulations 2008. Boverket,<br />
Karlskrona 2008. ISBN 978‐91‐86045‐03‐6<br />
[3] SWEDISH NATIONAL BOARD OF HOUSING, BUILDING AND PLANNING. Så Mår<br />
Våra Hus, The Standard of Our Houses. Boverket, Karlskrona 2009. ISBN 978‐91‐86342‐28‐9<br />
[4] HÄGERSTEDT, S. O. Fuktsäkra Träkonstruktioner, Moisture Proof Wooden Constructions.<br />
Report TVBH‐3052. Lund <strong>2012</strong>. ISBN 978‐91‐88722‐43‐0<br />
[5] VIITANEN, H. – VINHA, J. – SALMINEN, K. – LÄHDESMÄKI, K. – PEUHKURI, R. –<br />
OJANEN, T. – PAAJANEN L. Moisture and Biodeterioration Risk of Building Matierials<br />
and Structures. In Journal of Building Physics. 2010. 33(3). p. 201 – 224. ISSN 1744‐2591<br />
[6] ISAKSSON, T. – THELANDERSSON, S. – EKSTRAND‐TOBIN, A. – JOHANSSON, P.<br />
Critical Conditions for Onset of Mould Growth Under Varying Climate Conditions. In<br />
Building and Environment. 2010. 45(7). P. 1712 – 1721. ISSN 0360‐1323<br />
[7] SEDLBAUER, K. – KRUS, M – BREUER, K. Mould Growth Prediction With a New<br />
Biohygrothermal Method and its Application in Practice. Proc in IX Polska Konferencja<br />
140
Naukowo‐Techniczna Fizyka Budowli w Teorii i Praktyce. Lódz, 2003. 2. p. 594 – 601. ISBN 83‐<br />
88499‐09‐2<br />
[8] SEDLBAUER, K. Prediction of Mould Fungus Formation on the Surface of and Inside Building<br />
Components. Doctoral thesis. Fraunhofer Institute for Building Physics. Universität<br />
Stuttgart 2001.<br />
[9] JOHANSSON, P. – SAMUELSSON, I. – EKSTRAND‐TOBIN, A. – MJÖRNELL, K. –<br />
SANDBERG, P.I. Kritiska fukttillstånd för mikrobiell tillväxt på byggnadsmaterial,<br />
Microbiological Growth on Building Materials – Critical Moisture Levels. SP Technical<br />
Research Institute of Sweden. SP Energiteknik. Report 2005:11. Borås 2005. ISBN 91‐85303‐<br />
442‐9<br />
[10] NIELSEN, K.F. – HOLM, G. – UTTRUP, L.P. – NIELSEN, P.A. Mould Growth on Building<br />
Materials Under Low Water Activities. International Biodeterioration and biodegration. 2004.<br />
54(4). p. 325 – 336. ISSN 0964‐8305<br />
[11] VIITANEN, H. – OJANEN, T. – PEUHKURI, R. – VINHA, J. – LÄHDESMÄKI, K. –<br />
SALMINEN, K. Mould Growth Modelling to Evaluate Durability of Materials. Proc 12 th Int<br />
Conf on Curability of Building Materials and Components (DBMC). Porto 2011. Vol 1. p. 409<br />
ISBN 978‐972‐752‐132‐6<br />
[12] PIETRZYK, K. – SAMUELSSON, I. – JOHANSSON, P. Modelling Reliability of Structure<br />
With Respect to Incipient Mould Growth. Proc 9 th Nordic Symposium on Building Physics<br />
(NSB). Tampere 2011. Vol 2. p. 875. ISBN 978‐952‐15‐2573‐5<br />
[13] TOGERÖ, Å. – SVENSSON, C. – BENGTSSON, B. m‐model: a Method to Assess the Risk<br />
for Mould Growth in Wood Structures With Fluctuating Hygrothermal Conditions. Proc<br />
9 th Nordic Symposium on Building Physics (NSB). Tampere 2011. Vol 2. p. 883. ISBN 978‐952‐<br />
15‐2573‐5<br />
[14] FINNISH MINISTRY OF THE ENVIRONMENT. National Building Code of Finland. Section<br />
2C. Regulations and instructions. 1998.<br />
[15] TORATTI, T. – HEIKKINEN, J. – HÄGERSTEDT, S.O. – ARFVIDSSON, J. Calculations<br />
and Measurements of Moisture and Temperature in Highly Insulated House Walls Made<br />
of Wood for a Mositure Safe Design. Proc in World <strong>Conference</strong> on Timber Engineering.<br />
Auckland <strong>2012</strong><br />
[16] NEVANDER, L.E. – ELMARSSON, B. Fukthandboken, Moisture handbook. 3. Ed. AB Svensk<br />
byggtjänst. Mönlycke 2007. pp. 239. ISBN 987‐91‐7333‐156‐2<br />
[17] IBP SOFTWARE. WUFI 5.0. Fraunhofer Institute for Building Physics. www.wufi.de<br />
[18] MUNDT‐PETERSEN S.O. Evaluation of Relative Humidity, Temperature and Moisture Content<br />
Compared with Blind WUFI 5.0 Calculations in a Single Family Wooden House on the Swedish<br />
West Coast. Report TVBH‐5XXX. Lund <strong>2012</strong>. In Press<br />
[19] NORLING MJÖRNELL, K. ByggaF – Metod för Fuktsäkert Byggande, BuildM – Method for<br />
Moisture‐Proof Constructions. FoU‐Väst, 2007, SG Zetterqvist AB, ISSN 1402‐7410<br />
141
142<br />
The comparison of DTA and DSC curves for concrete with<br />
metakaolin addition<br />
Ján Ondruška 1,2 , Anton Trník 1,2 , Dagmar Jandeková 3 , Pavel Reiterman 4 , Igor<br />
Medveď 1,2<br />
1Department of Physics, Constantine the Philosopher University, A. Hlinku 1, 949 74 Nitra,<br />
Slovakia, E‐mail: jondruska@ukf.sk<br />
2Department of Materials Engineering and Chemistry, Czech Technical University, Thákurova<br />
7, 16629 Prague, Czech Republic<br />
3Department of Mechanics, Czech Technical University, Thákurova 7, 16629 Prague, Czech<br />
Republic<br />
4Experimentální centrum, Czech Technical University, Thákurova 7, 166 29 Prague, Czech<br />
Republic<br />
Abstract: Mineral additives are used in concrete primarily for the purpose of a positive effect on<br />
mechanical properties. Using the DTA and DSC methods, it is possible to observe thermophysical<br />
changes in concrete samples containing such additives at the microstructural level. Two different types of<br />
samples were measured. One type was the classical concrete sample with no special additives. The other<br />
type was a concrete sample with a metakaolin addition. The paper compares the results obtained by both<br />
analytical methods.<br />
Keywords: concrete, metakaolin, DSC, DTA<br />
1 Introduction<br />
The building materials are usually composite materials, and therefore the resistance of<br />
particular components is necessary for the resistance of these materials under given ambient<br />
conditions (temperature, humidity, etc.). The cement matrix is usually the weakest part of<br />
concrete or other silicate composites. The Portland cement can be combined with other<br />
materials for production of various cement materials during which hydration reactions of<br />
Portland cement as well as other chemical reactions occur. The enhancement of concrete<br />
properties using pozzolana admixtures is basically due to the combination of several facts. In<br />
the pozzolana reaction calcium hydroxide Ca(OH)2 is depleted (the hydroxide is not suitable for<br />
mechanical properties of common concrete, but it is a carrier of concrete alkalinity and thus<br />
protects reinforcement of concrete). The insertion of a pozzolana admixture into concrete is<br />
accompanied by a creation of C‐S‐H phases which fill up most of the free intergranular space<br />
and thereby contribute to a permeability decrease. The phases are similar to the cement<br />
hydration products. Moreover, the so developed hydrates are less dissoluble than Ca(OH)2 so<br />
that the corrodible capacity of this system decreases significantly. Metakaolin is one of the<br />
pozzolanic materials. Metakaolin is a thermally activated material with pozzolanic properties.<br />
As an additive to concrete it can improve both physical material characteristics and durability<br />
properties. Positive effects of metakaolin on concrete durability have been widely demonstrated<br />
[1].<br />
The differential thermal analysis (DTA) is a frequently used dynamical thermoanalytical<br />
method in which a temperature difference between the tested and reference samples is<br />
measured that are exposed to the same controlled temperature regime. To determine the
eactions in the sample more accurately, it is useful to combine the DTA with another thermal<br />
analysis, for example, the differential scanning calorimetry (DSC) [2]. The DSC is a method<br />
where the energy difference between the tested and reference samples as a function of the<br />
temperature is measured, while their temperature difference is kept negligible. The two<br />
samples are exposed to the same controlled temperature regime as for the DTA analysis [3, 4].<br />
If in the sample a physical‐chemical reaction in which the reaction heat is released or absorbed<br />
does not occur, the resulting graph of the DTA and DSC will be straight blank lines. If, on the<br />
other hand, some reaction occurs in the sample, in the resulting graph a peak appears. The peak<br />
area is directly proportional to the reaction heat and mass of the active part of the material [3, 4,<br />
5].<br />
In the case of concrete the determination of the amount of portlandit is not simple. In the tested<br />
samples there are several fillers that make this determination hard. So in this paper we focused<br />
on the amount of portlandit determination in the concrete samples with metakaolin addition<br />
using the DSC and DTA thermal analysis.<br />
2 Sample and measurement methods<br />
For the comparison analysis we used two kinds of samples which were made from cement CEM<br />
I 42.5 R Mokrá and metakaolin. The samples A were without metakaolin, but the samples were<br />
aerated. The samples M contained 9 mass % of metakaolin (Mefisto K 05 from České lupkové<br />
závody, a. s.). The chemical compositions of metakaolin and cement are given in Tab. 1 and the<br />
compositions of the studied materials are given in Tab. 2.<br />
Tab. 1 – The chemical composition of metakaolin Mefisto K 05 and cement CEM I 42.5 R Mokrá [mass %]<br />
SiO2 Al2O3 K2O Fe2O3 TiO2 MgO CaO SO3 Na2O MnO LOI<br />
Metakaolin 58.70 38.50 0.85 0.72 0.50 0.38 0.20 ‐ ‐ ‐ 1.67<br />
Cement 23.9 5.2 0.8 2.9 ‐ 3.0 58.8 2.5 0.3 0.2 ‐<br />
Tab. 2 – The composition of the studied materials [kg.m‐3]<br />
Composition M A<br />
CEM I 42,5 R Mokrá 400 440<br />
metakaolin Mefisto K 05 40 ‐<br />
siliceous aggregates 0‐4 mm Dobříň 795 795<br />
siliceous aggregates 4‐8 mm Zbraslav 315 315<br />
siliceous aggregates 8‐16 mm Zbraslav 670 670<br />
Superplasticizer 4.4 4.18<br />
aerated admixture ‐ 2.42<br />
Water 177 177<br />
w/c [‐] 0.44 0.40<br />
w/b [‐] 0.40 0.40<br />
air content [%] 1.6 5.8<br />
For the determination of the amount of portlandit we used two thermal analyses, namely, the<br />
DSC and DTA. For the DTA and DSC the powder samples which were grinded from the<br />
143
samples with dimension 50 50 10 mm were used. The DTA analysis was performed by the<br />
device Derivatogaph 1100°, MOM Budapešť, where the DTA and TG run simultaneously [6]. As<br />
a reference material was used Al2O3 powder. The DSC analysis was performed by the device<br />
Labsys Evo from company Setaram. The samples were heated from the room temperature (in<br />
the air for the DTA and argon for the DSC) up to 1000 °C with the heating rate 5 °C.min –1 .<br />
3 Results and discussion<br />
When we tested the samples they were 23 month old. The observed component was portlandit.<br />
The DSC and DTA analyses were aimed to show whether its amount in the samples with<br />
metakaolin is lower (thanks to the pozzolanic reaction) than in the samples without metakaolin.<br />
The DSC and DTA measurements provided the plots of the voltage and temperature difference<br />
(in thermocouples of the studied and reference samples), respectively, vs. the actual<br />
temperature (see Figs. 1, 2). The measured data show peaks that say whether an exothermic or<br />
endothermic reaction occurs in the given sample. The peak in the temperature interval 420 – 550<br />
°C corresponds to the portlandit decomposition. In order to be able to compare the amount of<br />
portlandit in the samples, we represented the measured data in terms of the mass unit, namely,<br />
1 mg.<br />
In Tab. 3 we list the average values of the peak areas for both types of samples and both thermal<br />
analyses that were obtained from three measurements under unchanged conditions. The DSC<br />
and DTA confirmed the assumption that more amount of portlandit occurred in the sample of<br />
type A (without metakaolin) than the samples of type M (with metakaolin).<br />
Figures 1 and 2 also show an important difference between the DSC and DTA measurements.<br />
Since we used different reaction gases for these analyses (argon for the DSC and air for the<br />
DTA), we obtained completely different results. Indeed, there is an endothermic peak in the<br />
DSC case (corresponding to the dehydration of portlandit) [1, 7, 8] and an exothermic peak in<br />
the DTA case (also corresponding to the dehydration portlandit). This creation is possible<br />
because the chamber in which the studied samples were placed is not flushed by the reaction<br />
gas. That is why all liberated water can immediately react.<br />
144<br />
Fig. 1: The DTA curve of concrete A with the linear heating 5 °C.min–1 up to 1000 °C
Fig. 2: The DTA curve of concrete M with the linear heating 5 °C.min–1 up to 1000 °C<br />
Tab. 3 – The comparison of the areas of peaks associated with the portlandit decomposition<br />
4 Conclusions<br />
DSC [V.°C.g ‐1 ] DTA [°C 2 .g ‐1 ]<br />
Sample A 631 434<br />
Sample M 105 62<br />
Both thermal analyses showed that in the samples of type A (without metakaolin) a larger<br />
amount of portlandit was present than in the samples of type M (with metakaolin). From the<br />
given DSC and DTA results it also follows that both the thermal analyses are suitable to<br />
compare the content of portlandit in concrete samples. It is also not important what reaction gas<br />
is used. We may further conclude that the DTA analysis is somewhat more suitable to this end<br />
than the DSC analyses because the DTA analysis uses samples with larger volumes and masses<br />
than the DSC analysis, which is more appropriate for concrete samples that are rather<br />
heterogeneous.<br />
Acknowledgements<br />
This work was supported by the Ministry of Education, Youth and Sports of the Czech<br />
Republic, under the project No. MSM: 6840770031.<br />
References<br />
[1] SHA, W. – PEREIRA, G. B. Differential scanning calorimetry study of ordinary Portland<br />
cement paste containing metakaolin and theoretical approach of metakaolin activity. In:<br />
Cement & Concrete Composites. 2001, 23, p. 455‐461.<br />
145
[2] KLANCNIK, G. – MEDVED, J. – MRVAR, P. Differential thermal analysis (DTA) and<br />
differential scanning calorimetry (DSC) as a method of material investigation. In: RMZ –<br />
Material and Geoenvironment. 2010, 57 (1) p. 127‐142<br />
[3] ŠIMON, P. – SMRČKOVÁ, E. – SVETLÍK, Š. – CHOCHULOVÁ, A. Študijné materiály, 6.<br />
Letná škola termickej analýzy a kalorimetrie, FChPT STU, Bratislava, 2007<br />
[4] ŠAŠEK, L. a kol. Laboratorní metody v oboru silikát. SNTL/ALFA, Bratislava, 1981<br />
[5] HÖHNE, G. W. H. HEMMINGER, W. F. – FLAMMERSHEIM , H. J. Differential Scanning<br />
Calorimetry, 2nd edition. Berlin: Springer–Verlag, 2003.<br />
[6] PODOBA, R. – PODOBNÍK, Ľ. – TRNÍK, A. Upgrading of TGA/DTA analyzer<br />
derivatograph. In: Epitoanyag. <strong>2012</strong>, 64, n. 1‐2, p.28‐29, ISSN 0013‐970X<br />
[7] AZPIAZU, M. N. – MORGUILLAS, J. M. – VASQUEZ, A. Heat recovery from a thermal<br />
energy storage based on the Ca(OH)2/CaO cycle. In: Applied Thermal Engineering. 2003 23<br />
p. 733‐741, ISSN: 1359‐4311<br />
[8] Morsy, M. S. – SHEBL, S. S. Effect of silica fume and metakaoline pozzolana on the<br />
performance of blended cement pastes against fire, In: Ceramics‐Silikaty. 2007, 51 (1) p. 40‐<br />
44, ISSN 0862‐5468<br />
146
Experimental analysis of plasters with increased heat storage<br />
capacity<br />
Milena Pavlíková 1 , Zbyšek Pavlík 1 , Petra Volfová 1 , Viktor Kaulich 1 , Anton Trník 2 , Ján<br />
Ondruška 2 , Robert Černý 1<br />
Faculty of Civil Engineering, Czech Technical University in Prague, Thákurova 7, CZ‐166 29<br />
Prague, Czech Republic<br />
Department of Physics, Constantine the Philosopher University, Tr. A. Hlinku 1, SK‐949 74<br />
Nitra, Slovakia<br />
email: milena.pavlikova@fsv.cvut.cz<br />
Abstract: Experimental analysis of plasters with increased heat storage capacity is presented in the<br />
paper. The obtained results show a positive effect of incorporation of phase change materials (PCM) on<br />
the thermal performance of the plaster. The phase transitions of PCM cause substantial latent heat<br />
storage in dependence on temperature exposure of the material what is very promising for the practical<br />
application of the plaster in lightweight building envelopes, where the heat accumulation is, typically,<br />
very low.<br />
Keywords: plasters, heat storage, phase‐change materials, experimental analysis<br />
1. Introduction<br />
Energy consumption for heating and air conditioning of industrial, commercial and residential<br />
buildings varies significantly during the day and night, especially in extremely hot and cold<br />
climate. Energy storage in the walls, ceiling and floor of buildings may be enhanced by<br />
encapsulating suitable phase change materials (PCMs) within these surfaces to capture solar<br />
energy directly and increase human comfort by decreasing the frequency of internal air<br />
temperature swings and maintaining the temperature closer to the desired temperature for a<br />
longer period of time [1].<br />
Application of PCMs for thermal energy storage and enhanced thermal stability of buildings<br />
has received a great interest in efficient use of thermal energy in recent years [2‐3]. Several<br />
PCMs were tested and applied in materials research especially in order to improve the thermal<br />
standard of lightweight building structures, whereas the latent heat storage (LHS) is based on<br />
the heat absorption or release when a storage material undergoes a phase change from solid to<br />
liquid or liquid to gas and vice versa. Although the thermal performance of building structures<br />
depends on climate, design and orientation of construction, the amount and type of PCMs is of<br />
great importance within the optimized design of lightweight building envelopes. Within the<br />
intensive research, many PCMs have been applied in building materials and their<br />
thermophysical properties have been studied in detail [4‐6]. For application in building<br />
industry, PCMs having a low phase‐change temperature are the most suitable. Among them,<br />
paraffins, fatty acids and hydrates are the most popular materials [7].<br />
Theoretically, the latent heat storage can be accomplished through the solid‐liquid, liquid‐gas,<br />
solid‐gas, and solid‐solid phase transition [8]. However, from the practical point of view, taking<br />
into account the real conditions of building structures, only PCMs working on phase change<br />
from the solid to liquid or solid to solid phase can be used. In practice, usually the solid‐liquid<br />
147
transition is utilized and it has proved to be economically attractive for the effective thermal<br />
energy storage systems. In case of the application of PCMs working on the phase change<br />
between solid and liquid, the encapsulation of the PCM is necessary to avoid leakage of a liquid<br />
PCM [7].<br />
Since the benefit of PCMs for indoor environment quality of buildings was already proved,<br />
there is a need to develop and test new building materials with PCMs and design them for<br />
specific applications in building industry.<br />
In this paper we focused on the analysis of a newly developed lime based plaster that should<br />
enhance the total heat storage capacity of lightweight envelopes. This material is based on<br />
hydrated lime as main binder and its durability is enhanced by pozzolana addition. The<br />
paraffinic wax Micronal DS 5008 X enclosed in polymer microcapsules is added to the dry<br />
mixture as PCM.<br />
2. Studied materials<br />
Lime plaster modified with Micronal DS 5008 X and pozzolana based on calcined kaolin mixed<br />
with milled mudstone was the analyzed material. For the evaluation of PCM contribution to the<br />
heat storage capacity of developed material, the reference plaster without PCM addition was<br />
studied as well.<br />
The applied pozzolana material was prepared using the calcination of raw kaolin in rotation<br />
kiln at temperature close to 750°C and consequent milling in rotation silo. To this “metakaolin”<br />
was then added milled mudstone and the mixture was homogenized. The final material was<br />
very fine, having specific surface area 14.56 m 2 /g and D50 4.09 m [9].<br />
Micronal DS 5008 X is product of company BASF SE, Germany. It is fine powdered material<br />
based on parrafinic wax encapsulated in polymer spherical microcapsules. LHS of this material<br />
is based on solid‐liquid phase change, whereas the capacity of LHS can be given by the<br />
following equation<br />
148<br />
Te<br />
Tm<br />
CTT) L C ( T T ) <br />
Tm<br />
p , l dT mL mC p , s dT m p , l ( e m p<br />
p , s mp i<br />
Ti<br />
Q mC <br />
, (1)<br />
where m (kg) is PCM mass, Cp,s (J/kgK) specific heat capacity of solid PCM, Cp,l (J/kgK) specific<br />
heat capacity of liquid PCM, Tmp (K) melting point temperature, Ti (K) initial temperature, Te (K)<br />
final temperature and L (J/kg) latent heat [7].<br />
Lime hydrate was produced by the lime kiln Čertovy schody, Inc., Czech Republic, whereas the<br />
silica sand was coming from sand pit Hlavačov, Czech Republic. The water/dry substances<br />
(w/d) ratio was slightly modified in order to keep the workability of fresh mixtures on the same<br />
level. Composition of the studied plasters is given in Tables 1, 2.<br />
Table 1: Composition of Studied Materials<br />
Plaster w/d Lime hydrate (kg) Pozzolana (kg) Sand 0 – 4 mm (kg)<br />
reference 0.21 1.5 1.0 7.5<br />
with PCM 0.24 1.5 1.0 7.5<br />
The samples were cast from the fresh mixture of studied plasters into the moulds having<br />
dimensions of 70/70/70 mm, 50/50/50 mm and 20/20/5 mm.
3. Experimental<br />
Table 2: Composition of Studied Materials<br />
Plaster Micronal DS 5008 X (kg)<br />
reference 0.0<br />
with PCM 0.5<br />
3.1 Measurement of Basic Material Properties<br />
At first, powder density and particle size distribution of Micronal were measured. The powder<br />
density was measured gravimetrically, weighing the known mass of material in the measuring<br />
cylinder. The particle size distribution was measured on laser diffraction principle using the<br />
device Analysette 22 Micro Tec plus. The particle size distribution was measured also for the<br />
reference dry mixture, as well as for the mixture with Micronal addition.<br />
For the researched plasters, measurements of bulk density, matrix density, and total open<br />
porosity were performed. The experiments were done on 5 cubic samples of side 50 mm. The<br />
relative expanded uncertainty of applied testing method was 5% and was mainly due to<br />
material nonhomogeneity. Bulk density was determined from the measurement of sample sizes<br />
(using digital length meter) and its dry mass. The matrix density was accessed by helium<br />
pycnometry using apparatus Pycnomatic ATC (Thermo Scientific). The accuracy of the gas<br />
volume measurement using this device is ± 0.01% from the measured value, whereas the<br />
accuracy of used analytical balances is ± 0.0001 g. On the basis of bulk density and matrix<br />
density measurements, the total open porosity ψ (‐) was calculated using equation<br />
100 ( 1 b<br />
/ mat )<br />
, (2)<br />
where mat (kg/m 3 ) is matrix density, and b (kg/m 3 ) bulk density.<br />
3.2 Measurement of Water Vapor Sorption Properties<br />
To investigate the effect of PCM addition on water vapor adsorption capacity, the measurement<br />
of sorption and desorption isotherms was done using the dynamic sorption device DVS‐<br />
Advantage (Surface Measurement Systems). The instrument measures the uptake and loss of<br />
vapor gravimetrically using highly precise balances having resolution of 10 g. The vapor<br />
partial pressure around the sample is generated by mixing the saturated and dry carrier gas<br />
streams using electronic mass flow controllers. The humidity range of the instrument is 0 – 98%<br />
with accuracy ± 0.5% at temperatures 5 – 60°C.<br />
For the vapor sorption/desorption step experiments, the samples were dried for 360 min to<br />
establish the dry mass. Then, the samples were exposed to the following relative humidities<br />
(RH): 0, 10, 20, 30, 40, 50, 60, 70, 80, 90 and 98%. The RH was then decreased in a similar manner<br />
to accomplish a full sorption/desorption cycle. During the experiment, the instrument worked<br />
in dm/dt mode (mass variation over time variation) to decide when equilibrium is reached. A<br />
fixed dm/dt value of 0.00004 %/min was selected for all RH segments. This criterion permits the<br />
DVS software to automatically determine when equilibrium has been reached and complete a<br />
relative humidity step.<br />
149
3.3 Measurement of Heat Transport Parameters<br />
Among the heat transport properties, measurement of thermal conductivity and thermal<br />
diffusivity were done. For that purpose, device ISOMET 2104 [10], [11] working on dynamic<br />
measurement principle was used. The measurement is based on the analysis of the temperature<br />
response of the analyzed material to heat flow impulses. The heat flow is induced by electrical<br />
heating using a resistor heater having a direct thermal contact with the surface of the sample.<br />
The measurement range of thermal conductivity is from 0.015 to 6 W/mK, the accuracy is 5% of<br />
reading + 0.001 W/mK, the measurement reproducibility is 3% of reading + 0.001 W/mK.<br />
Operating temperature is for probes ‐20 to 70 °C, for the electronic instrument 0 to 40 °C.<br />
The measurements were performed in laboratory conditions at constant temperature 23˚C ± 1˚C<br />
and relative humidity 30% ± 5%. The samples had cubic shape of dimensions 70/70/70 mm,<br />
whereas 5 samples of each material were tested.<br />
3.4 Differential Scanning Calorimetry<br />
Differential scanning calorimetry (DSC) analysis was performed using apparatus DSC 822e<br />
(Mettler Toledo) with the cooling device Julabo FT 900. The measurements were performed for<br />
the Micronal DS 5008 X, the reference plaster and plaster modified by PCM addition. For the<br />
measurement, the particular samples were first crushed in laboratory mill. The following<br />
temperature regime was applied: 5 minutes of the isothermal regime; cooling of 10°C/min from<br />
the temperature 40°C to the temperature – 10°C; 5 minutes of the isothermal regime; heating of<br />
10°C/min from the temperature ‐10°C to the temperature 40°C; 5 minutes of isothermal regime.<br />
On the basis of DSC analysis, the temperature of the phase transition was accessed, as well as<br />
the temperature dependent specific heat capacity.<br />
150<br />
4. Results and Discussion<br />
Figures 1 – 3 show the particle size distribution of the studied materials measured by laser<br />
diffraction. Here, the very fine particle size distribution of Micronal PCM was observed. We can<br />
see that the highest amount of its particles was around 10 m. The reference plaster exhibited<br />
maxima of particles at 5 and 90 m. The particle size distribution of plaster mixture modified by<br />
PCM was only slightly affected by the Micronal PCM addition.<br />
Figure 1: Particle size distribution of Micronal DS 5008 X .
Figure 2: Particle size distribution of reference plaster dry mixture.<br />
Figure 3: Particle size distribution of plaster with Micronal addition.<br />
Basic material properties of investigated materials are given in Tables 3, 4. We can see very low<br />
powder density of Micronal PCM that affected the matrix density and bulk density of the<br />
plaster modified by PCM addition. The total open porosity of the modified plaster was in<br />
comparison with the reference plaster about 20% higher, which was in accordance with its<br />
higher w/d ratio.<br />
Sorption and desorption isotherms of researched materials are given in Figs. 4 ‐ 6. We can see<br />
that the Micronal DS 5008 X had only slightly higher hygroscopicity in comparison with the<br />
reference plaster. The accumulation of water vapor molecules in the developed plaster with<br />
PCM addition was slightly enhanced in comparison with the reference material. This<br />
corresponded with both the slightly higher hygroscopicity of Micronal DS 5008 X and the<br />
higher open porosity of the material with PCM.<br />
151
152<br />
Table 3: Basic Physical Properties of Studied Materials<br />
Material<br />
Powder density<br />
(kg/m 3 )<br />
Bulk density<br />
(kg/m 3 )<br />
Micronal DS 5008 X 359 ‐<br />
reference plaster 1 861<br />
plaster with PCM 1.5 1 593<br />
Table 4: Basic Physical Properties of Studied Materials<br />
Material<br />
Matrix density<br />
(kg/m 3 )<br />
Total open porosity<br />
(‐)<br />
Micronal DS 5008 X ‐ ‐<br />
reference plaster 2 605 28.6<br />
plaster with PCM 2 430 34.4<br />
Figure 4: Sorption properties of Micronal DS 5008 X .<br />
Figure 5: Sorption properties of reference plaster.
Figure 6: Sorption properties of plaster with PCM<br />
Results of impulse method measurements are presented in Table 5. We can see much lower<br />
thermal conductivity of the developed plaster in comparison with the reference plaster. This<br />
finding corresponds with the results of total open porosity measurement and may be attributed<br />
on one hand to the higher amount of batch water in composition of the developed plaster and<br />
on the other to the low thermal conductivity of Micronal capsules.<br />
Figures 7 – 10 describe the data obtained within the DSC analysis. The data were graphed using<br />
the STARe SW 9.1 software that controlled also the DSC device.<br />
Table 5: Basic Physical Properties of Studied Materials<br />
Material Thermal conductivity (W/mK) Thermal diffusivity (m 2 /s)<br />
refence plaster 0.86 0.54∙10‐6<br />
plaster with PCM 0.55 0.34∙10‐6<br />
Figure 7: Heat flow during the cooling of Micronal DS 5008 X.<br />
153
154<br />
Figure 8: Heat flow during the heating of Micronal DS 5008 X.<br />
Figure 9: Heat flow during the cooling of the plaster with PCM.<br />
Figure 10: Heat flow during the heating of the plaster with PCM
The temperature of the phase change of the Micronal PCM during the cooling process was<br />
19.45°C and 26.97°C during heating. For the modified plaster exposed to the cooling process we<br />
measured temperature of liquid‐solid transition equal to 22.63°C. The solid‐liquid transition of<br />
modified plaster was detected at 26.31°C. The measured temperatures of phase changes are<br />
beneficial for the LHS in the developed material.<br />
The temperature dependent apparent specific heat capacities of the developed and reference<br />
plaster during heating are presented in Figs. 11 – 12.<br />
Here, high increase of the specific heat capacity at the temperature close to the PCM phase<br />
transition was registered for the PCM modified plaster. In comparison with the reference<br />
plaster, the newly developed plaster exhibited higher apparent specific heat capacity in the<br />
whole studied temperature range.<br />
Figure 11: Specific heat capacity of the reference plaster – heating process.<br />
Figure 12: Specific heat capacity of the plaster with PCM – heating process.<br />
155
5. Conclusions<br />
The tests presented in the paper revealed the positive effect of PCM incorporation on the<br />
thermal performance of the modified lime‐based plaster. The phase transitions of PCM caused<br />
substantial latent heat storage in dependence on temperature exposure of the material what is<br />
very promising for the practical application of the plaster in lightweight building envelopes,<br />
where the heat accumulation is, typically, very low.<br />
Acknowledgment<br />
This research has been supported by the Czech Ministry of Education, Youth and Sports, under<br />
project No. MSM 6840770031.<br />
References<br />
[1] KHUDHAIR, A. M. ‐ FARID, M. M. A review on energy conservation in building<br />
applications with thermal storage by latent heat using phase change materials. In: Energ<br />
Cons Manag, vol. 45, 2004, pp. 263‐275.<br />
[2] ZHONG, Y. ‐ GUO, Q. ‐ LI, S. ‐ SHI, J. ‐ LIU, L. Heat transfer enhancement of paraffin wax<br />
using graphite foam for thermal energy storage. In: Sol Energ Mat Sol C, vol. 94, 2010, pp.<br />
1011‐1014.<br />
[3] SHARMA, A. ‐ TYAGI, V. V. ‐ CHEN, C. R. ‐ BUDDHI, D. Review on thermal energy<br />
storage with phase change materials and applications. In: Renew Sust Energ Rev, vol. 13,<br />
2009, pp. 318‐345.<br />
[4] SHARMA, S. D. ‐ SAGARA K, Latent heat storage materials and systems. In: Int J Green<br />
Energ, vol. 2, 2005, pp. 1‐56.<br />
[5] KOSCHENZ, M. ‐ LEHMANN, B. Development of thermally activated ceiling panel with<br />
pcm for application in lightweight and retrofitted buildings. In: Energ Build, vol. 36, 2004,<br />
pp.567‐578.<br />
[6] LEE, T. ‐ HAWES, D. W. ‐ BANU, D. ‐ FELDMAN, D. Control aspects of latent heat<br />
storage and recovery in concrete, In: Sol Energ Mat Sol C, vol. 62, pp. 217‐237, 2000.<br />
[7] NOMURA, T. ‐ OKINAKA, N. ‐ AKIYAMA, T. Technology of latent heat storage for high<br />
temperature application: a review. In: ISIJ Int, vol. 50(9), 2010, pp. 1229‐1239.<br />
[8] WANG, X. ‐ LU, E. ‐ LIN, W. ‐ LIU, T. ‐ SHI, Z. ‐ TANG, R. ‐ WANG, C. Heat storage<br />
performance of the binary systems neopentyl glycol/pentaerythrotil and neopentyl<br />
glycol/trihydroxy menthylaminomethane as solid phase change materials. In: Energ Cons<br />
Manage, vol. 41, 2000, pp. 129‐134.<br />
[9] PAVLÍK, Z. ‐ FIALA, L. ‐ PAVLÍKOVÁ, M. ‐ ČERNÝ, R. Water and Chloride Transport<br />
Properties of Renovation Plasters Developed for Historical Masonry. In: Proc. of 12th<br />
International <strong>Conference</strong> on Durability of Building Materials and Components, Porto: Faculdade<br />
de Engenharia da Universidade do Porto, 2011, pp. 745‐752.<br />
[10] JIŘIČKOVÁ, M. ‐ PAVLÍK, Z. ‐ FIALA, L. – ČERNÝ, R., Thermal Properties of Mineral<br />
Wool Materials Partially Saturated by Water. In: Int J Thermophys, vol. 27, 2006, pp. 1214‐<br />
1227.<br />
[11] PAVLÍK, Z. ‐ VEJMELKOVÁ, E. ‐ FIALA, L. – ČERNÝ, R. Effect of Moisture on Thermal<br />
Conductivity of Lime‐Based Composites. In: Int J Thermophys, vol. 30, 2009, pp. 1999‐2014.<br />
156
Early age properties of cement paste with pozzolanic admixture<br />
Zbyšek Pavlík, Milena Pavlíková, Petra Volfová, Martin Keppert, Robert Černý<br />
Faculty of Civil Engineering, Czech Technical University in Prague, Thákurova 7, CZ‐166 29<br />
Prague, Czech Republic<br />
Abstract: Early age properties of cement paste containing ceramic powder as pozzolanic admixture are<br />
studied. The tested materials with partial Portland cement replacement are found to have good<br />
mechanical strength that is only partially reduced in comparison with the reference paste without<br />
ceramics addition. Also the measured pore size distribution confirms the reasonable quality of the studied<br />
materials.<br />
Keywords: cement paste; pozzolan, early age; mechanical properties; porosimetry; electrical conductivity<br />
1. Introduction<br />
Recent development in manufacturing of building materials is focused on application of<br />
secondary raw materials having pozzolanic properties. Many industrial byproducts possessing<br />
pozzolanic properties are produced in large amounts worldwide, and despite the current trends<br />
of environmental protection and sustainable construction, their production volume still greatly<br />
exceeds their industrial reuse. Therefore, there are compelling reasons to extend their practical<br />
application in building industry.<br />
These materials can be beneficially applied above all in concrete industry, where they can be<br />
used as partial Portland cement replacement in concrete and mortars. In this way, the concrete<br />
industry will produce environmentally more friendly materials especially from the point of<br />
view of reduction of CO2 production. One possible source for such a pozzolana is calcined clay<br />
that is usually product of ceramic industry [1]. A portion of ceramic products formed within the<br />
burning illite‐group minerals is discarded as scrap, thus constitutes industrial waste. These<br />
waste products having suitable fineness can then become active pozzolana [2], [3]. Therefore,<br />
waste ceramic materials may have a potential to become a cheaper but almost equivalent<br />
alternative to metakaolin as supplementary binder in mortar and concrete [4].<br />
In this paper, fine‐ground ceramics is used as an alternative binder in cement pastes mixtures<br />
replacing Portland cement in the amount of up to 20% of mass.<br />
2. Experimental<br />
2.1 Materials and samples<br />
The researched cement pastes were prepared with Portland cement CEM I 42.5 R as the main<br />
binder. Its specific surface area was 341 m 2 /kg. A part of cement was replaced by fine‐ground<br />
ceramics, which specific surface area was 336 m 2 /kg. The differences in particle size distribution<br />
were observed by laser particle size analyser Analysette 22 MicroTec plus. The particle size<br />
distribution of used binders is shown in Figs. 1, 2.<br />
157
158<br />
Figure 1: Particle size distribution of applied binders<br />
Figure 2: Particle size distribution of applied binders<br />
Looking at these results, one can see that the CEM 42.5 R is slightly finer than used ceramics. On<br />
the other hand, the fineness of grinding of the applied ceramics is sufficient for optimal<br />
pozzolanic reaction.<br />
The composition of pastes mixtures is given in Table 1. Here, the reference mixture without<br />
ceramics addition is denoted RP. P10 and P20 are mixtures where the part of the Portland<br />
cement is replaced by fine‐ground ceramics. As superplasticizer, Mapei Dynamon SX was used.<br />
It is based on modified acrylic polymer and allows greater water reduction, along with high<br />
mechanical strength and prolonged workability.<br />
The measurement of materials properties was done in the early hardening period up to 28 days.<br />
The following specimens were used in the experiments for each of the studied materials:
compressive strength – 3 specimens of dimensions 100 x 100 x 100 mm, monitoring of hydration<br />
process using electrical conductivity sensors – 3 specimens of dimensions 100 x 100 x 100 mm,<br />
pore size distribution – 1 specimen cut from the cubic specimens for the electrical conductivity<br />
measurements.<br />
Mixture<br />
Table 1: Composition of tested pastes<br />
Amount of material (kg/m 3 )<br />
CEM I 42.5 R Fine‐ground ceramics Superplasticizer Water<br />
RP 484 ‐ 5.3 200<br />
P10 435.6 48.4 5.3 200<br />
P20 387.2 96.8 5.3 200<br />
2.2 Monitoring of hydration process<br />
To study the effect of fine‐ground ceramics addition on the process of hydration of cement<br />
pastes, monitoring of electrical conductivity was done. For that purpose, two rods waveguide<br />
electrical conductivity sensors LP/ms by Easy Test were applied. The sensors are made of two<br />
53 mm long parallel stainless steel rods, having 0.8 mm in diameter and separated by 5 mm.<br />
The particular sensors were placed into the cubic moulds containing fresh mixtures of studied<br />
pastes and connected to the cable tester TDR/MUX/mts produced by Easy Test. This apparatus<br />
was developed in the Institute of Agrophysics PAS, Lublin, Poland, and allows measurement of<br />
electrical conductivity, temperature and relative permittivity [5], [6]. The monitoring of<br />
electrical conductivity changes was performed for time interval of 28 days.<br />
2.3 Measurement of compressive strength<br />
The compressive strength tests were performed according to ČSN EN 12390‐3 [7] on samples 1<br />
and 28 days old. Using this measurement we were able to observe the hardening process of<br />
studied materials together with the strength growth.<br />
2.4 Pore size distribution<br />
There are several methods of the experimental assessment of porosity and the relevant<br />
quantities such as pore size distribution [8]. In this paper, pore size distribution of investigated<br />
materials was measured by mercury intrusion porosimetry using apparatus Pascal 140 and 440<br />
(Thermo). The measurement by mercury porosimetry is based on the physical principle that a<br />
non‐reactive and non‐wetting liquid (in our case mercury) will note penetrate pores until<br />
sufficient pressure is applied to force its entrance [8]. As narrow pores must be filled up, high<br />
pressure must be applied. The relationship between the applied pressure and the pore size into<br />
which the mercury will intrude is given by the Washburn equation [9]<br />
2<br />
( t)<br />
P cos<br />
, (1)<br />
r<br />
where P [Pa] is the applied mercury pressure, r [m] the pore radius, (t) the surface tension of<br />
mercury, (at 20°C it is equal to 480 mN/m), t [°C] temperature, and θ [°] contact angle of<br />
159
mercury and pore wall. In our experimental setup we assumed contact angle 130°. The pore size<br />
distribution measurement was performed on dried samples in 7 days intervals.<br />
160<br />
3. Results and Discussion<br />
The results of electrical conductivity measurement are presented in Figs. 3, 4.<br />
Figure 3: Changes of electrical conductivity of studied pastes within first 5 days from casting<br />
Figure 4: Electrical conductivity of studied pastes measured for time interval of 28 days<br />
We can observe an increase of the electrical conductivity after the addition of batch water into<br />
the studied pastes mixtures, which is due to the increase of temperature of the mix induced by<br />
hydration heat generation. Looking at the data from the quantitative point of view, the highest<br />
values of electrical conductivity were measured for pure cement paste without ceramics<br />
additions. On the other hand, the lowest values were reached for paste P20. The results<br />
measured for modified paste P10 were in the middle. The decrease of the amount of free water
in the mix with increasing ceramics amount was apparently due to the wetting of ceramics<br />
particles.<br />
The data of electrical conductivity are in agreement with compressive strength results presented<br />
in Fig. 5. As high is the electrical conductivity at the beginning of the hardening process, as high<br />
is the material mechanical strength. Clearly, the supposed pozzolanic reaction in the mixes<br />
containing ceramics was not yet complete.<br />
Figure 5: Compressive strength of researched materials<br />
The highest values of compressive strength exhibited the pure cement paste. However, the<br />
values of compressive strength measured for pastes containing ceramics are also very<br />
promising, especially taking into account fact that the part of Portland cement was replaced by<br />
waste material.<br />
The results of mercury porosimetry measurements are given Figs. 6‐8. The data demonstrate the<br />
process of materials’ hardening and strength growth.<br />
Figure 6: Pore size distribution in the reference paste RP<br />
161
162<br />
Figure 7: Pore size distribution in the paste P10<br />
Figure 8: Pore size distribution in the paste P20<br />
In Fig. 9, there is presented comparison of pore size distribution of all the tested materials<br />
measured for 28 days. We can see that the measured cumulative pore volumes correspond with<br />
the results of compressive strength and electrical conductivity measurement. The lowest pore<br />
volume exhibited reference paste. Also in this case, the application of fine‐ground ceramics did<br />
not lead to the significant decrease of pastes quality and the tested materials with ceramics can<br />
be generally considered as acceptable.
4. Conclusions<br />
Figure 9: Comparison of pore size distribution<br />
In this paper, experimental testing of new types of cement pastes containing fine‐ground<br />
ceramics was presented. The tested materials with partial Portland cement replacement<br />
revealed good mechanical strength that was only partially reduced in comparison with the<br />
reference paste without ceramics addition. Also the measured pore size distribution confirmed<br />
the reasonable quality of the developed materials.<br />
For the practical application of the developed materials in building industry, it will be necessary<br />
to perform series of durability tests in order to obtain information on materials’ long term<br />
behaviour at harmful climatic conditions.<br />
Acknowledgements<br />
This research has been supported by the Ministry of Education, Youth and Sports of the Czech<br />
Republic, under project No MSM: 6840770031.<br />
References<br />
[1] SABIR, B. B. – WILD, S. – BAI, J. Metakaolin and calcined clays as pozzolans for concrete:<br />
a review, In: Cement and Concrete Composites, 23, 2001, p. 441‐454.<br />
[2] LAVAT A., E. – TREZZA, M. A. – POGGI, M. Characterization of ceramic roof tile wastes<br />
as pozzolanic admixture, In: Waste Management, 29, 2009, p. 1666‐1674.<br />
[3] TOLEDO FILHO, R. D. – GONCALVES, J. P. – AMERICANO, B. B. – FAIBRAIM, E. M. R.<br />
Potential for use of crushed waste calcined‐clay brick as a supplementary cementitious<br />
material in Brazil, In: Cement and Concrete Research, 37, 2007, p. 1357–1365.<br />
[4] VEJMELKOVÁ, E. – ČERNÝ, R. – ONDRÁČEK, M. ‐ SEDLMAJER M., Fine‐Ground<br />
Ceramics as Alternative Binder in High Performance Concrete, In: High Performance<br />
Structures and Materials V. Southampton: WIT Press, 2010, p. 91‐98.<br />
163
[5] PAVLÍK, Z. – JIŘIČKOVÁ, M. – ČERNÝ, R. – SOBCZUK, H. – SUCHORAB, Z.<br />
Determination of Moisture Diffusivity Using the Time Domain Reflectometry (TDR)<br />
Method, In: Journal of Building Physics, 30, 2006, p. 59‐70.<br />
[6] PAVLÍK, Z. – FIALA, L. – ČERNÝ, R. – SOBCZUK, H. – SUCHORAB, Z. Application of<br />
TDR Method for Determination of Moisture Content in Calcium Silicate, In: Roczniki<br />
Inźynierii Budowlanej, 6, 2006, p. 97‐100.<br />
[7] ČSN EN 12390‐3, Testing of hardened concrete – Part 3: Compressive strength, Czech<br />
Standardization Institute, Prague, 2002.<br />
[8] NAGY, V. – VAS, L. M. Pore Characteristics Determination with Mercury Porosimetry in<br />
Polyester Stample Yarns, In: Fibres and Textiles in Eastern Europe, 13, 2005, p. 21‐26.<br />
[9] WASHBURN, E. W. The Dynamics of Capillary Flow, In: Physical Review, 17, 1921, p. 273 –<br />
283.<br />
164
Application of diatomite as partial Portland cement<br />
replacement in mortar mix design<br />
Milena Pavlíková, Martin Keppert, Patra Volfová, Jan Fořt, Jaromír Žumár, Zbyšek<br />
Pavlík<br />
Faculty of Civil Engineering, Czech Technical University in Prague, Thákurova 7, CZ‐166 29<br />
Prague, Czech Republic<br />
email: pavlikz@fsv.cvut.cz<br />
Abstract: The aim of the present study is to investigate the use of diatomite as a partial replacement for<br />
cement in the production of cement mortar. Diatomite was used at 10% and 20% replacement by weight<br />
of cement while sand and water quantities were kept constant. For the materials with diatomite as well as<br />
for reference mortar, basic material properties, compressive and bending strength, freeze–thaw resistance,<br />
dynamic modulus of elasticity, sorption and desorption isotherms are measured. The particle size<br />
distribution of diatomite is researched on laser diffraction principle, whereas the pozzolana activity is<br />
studied as well. The diatomite use led to the increase of mechanical strength.<br />
Keywords: cement mortar, diatomite, partial Portland cement replacement<br />
1. Introduction<br />
During production of Portland cement, carbon dioxide which is one of the greenhouse gases is<br />
emitted to the atmosphere. Approximately 1 tone of CO2 arises during the production process<br />
of 1 tone of Portland cement, about one‐half of it originating from decomposition of limestone,<br />
which is the main raw material for Portland clinker, and the second half from fuel combustion<br />
necessary for cement production. Globally, the amount of annual world production of cement is<br />
typically about 1.4 billion tones. This means that the manufacture of Portland cement<br />
contributed about 1.4 billion tones of CO2 to atmosphere [1]. Therefore, with respect to a<br />
necessity to decrease the amount of carbon dioxide in atmosphere, alternative more<br />
environmental‐friendly materials must be studied in order to replace a part of Portland cement<br />
in concrete composition. These materials must have pozzolana properties and must be available<br />
in large quantities. Supplementary cementitious materials became quite common in today’s<br />
concrete industry [2], [3], whereas typical examples are by‐products of iron, silicon and<br />
ferrosilicon alloys production, and waste products from coal combustion in thermal power<br />
stations. Here, blast furnace slag, fly ash and micro silica are produced. These products are<br />
presently commonly applied in concrete production, and their beneficial effects on concrete<br />
properties and performance are approved by number of years of their usage. However, there is<br />
still number of other pozzolana materials that are applied in concrete production very rarely,<br />
and whose contribution to concrete performance is not fully understood. One of them is<br />
diatomite.<br />
Diatomite is a sedimentary rock primarily composed of the skeletons of microscopic single<br />
celled aquatic plants called diatoms. The skeletons are composed of amorphous silica (silicon<br />
dioxide, SiO2), a very durable substance. Besides its amorphous silica content diatomite rocks<br />
commonly contain carbonate and clay minerals, quartz and feldspars. Diatoms skeletons are<br />
highly porous, light in weight and chemically stable and inert [4], [5]. Aydin and Gül [6] studied<br />
the effect of diatomite as additive on the properties of concrete. They indicated that the increase<br />
of additive ratio results in a sudden decrease in compressive strength. The pozzolanic reaction<br />
165
of diatomite leads to the formation of higher amounts of hydrate products, especially at the age<br />
of 28 days [7]. Stamatakis et al. [8] demonstrated that the use of diatomite rocks as cement<br />
additives has drawbacks such as higher water demand, but compressive strength of the<br />
laboratory produced cements exhibit higher values. Since the effect of diatomite use in concrete<br />
design is still not fully understood, its applicability is studied in the presented paper in order to<br />
contribute to this environmentally friendly research.<br />
2. Studied Materials<br />
Ordinary Portland cement (CEM‐I 42.5 R) was used in the experimental study. Diatomite was<br />
applied at 10% and 20% replacement by weight of cement, while sand and water quantities<br />
were kept constant. Diatomite was produced by LB MINERALS, Ltd., Czech Republic. In order<br />
to maintain similar consistency of fresh mixtures, the superplasticizer Mapei was used for<br />
mixtures with diatomite. The composition of the researched mortar mixtures is given in Table 1.<br />
For the sake of comparison, also a reference mixture with Portland cement as the only binder<br />
was studied as well.<br />
166<br />
Table 1: Composition of studied mortars<br />
RM DM 10 DM 20<br />
Portland cement CEM 42.5 R kg 4.5 4.05 3.6<br />
Diatomite kg ‐ 0.45 0.90<br />
Silica sand 0/4 mm kg 13.5 13.5 13.5<br />
Water kg 2.33 2.33 2.33<br />
Mapei ml ‐ 45 90<br />
The measurement of material parameters was done after 28 days of standard curing in a<br />
conditioned laboratory at the temperature of 22±1°C and 25‐30% relative humidity. The<br />
following specimens’ sizes were used in the experiments: basic physical properties – 50/50/50<br />
mm, compressive strength – 150/150/150 mm, bending strength 40/40/160 mm, freeze/thaw<br />
resistance – 150/150/150 mm, dynamic modulus of elasticity 20/40/300 mm. The sorption and<br />
desorption isotherms were measured on fragments of samples for basic physical properties<br />
measurement.<br />
3. Experimental Methods<br />
3.1 Particle size distribution<br />
The particle size distribution was measured for the Portland cement, diatomite and mixtures of<br />
diatomite with cement. The measurement was done on laser diffraction principle using the<br />
device Analysette 22 Micro Tec plus. This device uses red laser for measurement of bigger<br />
particles and green laser for finer particles, whereas the laser analyser allows measurement of<br />
grain size up to 2 mm.<br />
3.2 Measurement of basic material properties<br />
Among the basic properties, the bulk density, matrix density and total open porosity were<br />
measured on gravimetric principle combined with helium pycknometry.
3.3 Measurement of pozzolana activity<br />
Pozzolana activity was determined on the basis of comparison of the amount of Ca(OH)2<br />
present in liquid phase in the contact with cement with the amount of Ca(OH)2 that saturates<br />
the environment of equal alkalinity.<br />
3.4 Mechanical properties<br />
The bending strength of cured mortars that were stored 28 days in relative humidity of 100%<br />
was determined using the procedure described in ČSN EN 12390‐5 [9]. The compressive<br />
strength was measured according to the ČSN EN 12390‐3 [10].<br />
3.5 Frost Resistance<br />
Frost resistance tests were carried out according to ČSN 73 1322/Z1 [11]. The samples were<br />
tested after 28 days of standard curing. One single freezing/thawing cycle requires 4 hours<br />
freezing at ‐20°C and 2 hours thawing in 20°C warm water. The total number of applied cycles<br />
was 150. After the particular cycles, the compressive strength of research cubic samples was<br />
measured according to [10].<br />
3.6 Mercury porosimetry analysis<br />
The evaluation of obtained results was done regarding to the pore size distribution that was<br />
studied on mercury porosimetry principle. For the measurement, porosimeters Pascal 140 and<br />
Pascal 440 Thermo Scientific were used. Within the evaluation of measured data, the circular<br />
cross section of capillaries was assumed.<br />
3.6 Dynamic modulus of elasticity<br />
For the measurement, the ultrasonic pulse method and resonance method were applied. The<br />
samples were cured prisms, whereas the measurements were performed in longitudinal<br />
direction. The ultrasonic pulse method is based on measurement the travel time of ultrasonic<br />
wave passing through the material. The resonance method is based on determination of<br />
system’s first resonation frequency by help of piezoelectric resonator applied to the sample.<br />
3.7 Sorption and desorption isotherms<br />
Apparatus DVS‐Advantage (Surface Measurement Systems Ltd.) was used for measurement of<br />
sorption and desorption isotherms of studied materials. The instrument measures the uptake<br />
and loss of vapour gravimetrically using highly precise balances having resolution of 10 g. The<br />
vapour partial pressure around the sample is generated by mixing the saturated and dry carrier<br />
gas streams using electronic mass flow controllers. The humidity range of the instrument is 0 –<br />
98% with accuracy ± 0.5% at temperatures 5 – 60°C.<br />
For the vapour sorption/desorption step experiments, the samples were dried to establish the<br />
dry mass. Then, the samples were exposed to the following relative humidities (RH): 0, 20, 40,<br />
60, 80, and 98%. The RH was then decreased in a similar manner to accomplish a full<br />
sorption/desorption cycle. During the experiment, the instrument worked in dm/dt mode (mass<br />
variation over time variation) to decide when equilibrium is reached. A fixed dm/dt value of<br />
0.00004 % /min was selected for all RH segments.<br />
167
4. Results and Discussion<br />
Results of particle size distribution measurement are given in Figures 1, 2.<br />
168<br />
Figure 1: Particle size distribution of studied mixtures – cumulative curve.<br />
Figure 2: Particle size distribution of studied mixtures – distribution curve.
We can see that the diatomite is in comparison with cement finer. On this account, one can<br />
assume higher specific surface of this material, what was observed also within the samples<br />
preparation, where the super plasticizer Mapei was used in order to reach optimal consistency<br />
of fresh mixtures with diatomite. Within the chemical analysis, the pozzolana activity of<br />
researched diatomite was proved.<br />
In Table 2, there are presented the basic physical properties of studied materials. We can see<br />
that the inner structure of mortars with diatomite was slightly changed. Cement replacement by<br />
diatomite in 20% of cement mass led to the high decrease of total open porosity in comparison<br />
with reference material. This finding is in agreement with data of mechanical properties<br />
presented in Table 3. Here, one can see systematical improvement of bending and compressive<br />
strength with increasing amount of diatomite in mortars composition. Young’s modulus<br />
measured by pulse and resonance method was improved for material DM 20. On the other<br />
hand, material DM 10 exhibited lower Young’s modulus than reference mortar. This finding can<br />
be assigned to the higher porosity of mortar DM 10 in comparison with material RM.<br />
Material<br />
Table 2: Basic physical properties of studied mortars<br />
Material<br />
Bulk<br />
density<br />
Matrix<br />
density<br />
Total<br />
open<br />
porosity<br />
[kg/m 3 ] [kg/m 3 ] [‐]<br />
RM 2011 2684.33 0.25<br />
DM 10 1860 2519.31 0.26<br />
DM 20 1963 2492.27 0.21<br />
Table 3: Mechanical properties of studied mortars<br />
Compressive<br />
strength<br />
Bending<br />
strength<br />
Young’s<br />
modulus –<br />
pulse<br />
method<br />
Young’s<br />
modulus –<br />
resonance<br />
method<br />
[MPa] [MPa] [GPa] [GPa]<br />
RM 39.6 6.6 19.3 19.3<br />
DM 10 42.3 6.7 17.7 17.8<br />
DM 20 42.8 7.0 20.9 21.0<br />
Results of freeze/thaw resistance are graphed in Figure 3. We can see that the frost resistance of<br />
diatomite modified mortars was systematically lower compared to reference material. On the<br />
other hand, material DM 20 exhibited acceptable performance within the freeze/thaw tests and<br />
maintained its strength until 75 cycles.<br />
169
170<br />
Figure 3: Compressive resistance after freeze/thaw cycles.<br />
Figure 4: Incremental pore volume.
Mercury porosimetry data are presented in Figure 4. Application of diatomite led in both<br />
studied cases to the decrease of pores in the diameter range 0.01 – 10 m. This clearly explains<br />
the increase of mechanical properties of mortars with diatomite compared to reference cement<br />
mortar.<br />
Sorption and desorption isotherms measured by DVS device are given in Figure 5. The moisture<br />
storage was slightly enhanced with diatomite admixture what we assign to the higher specific<br />
surface of diatomite modified mortars. Additionally, mortars with diatomite exhibited higher<br />
hysteresis. However, the total moisture storage remains very low for all research materials.<br />
5. Conclusions<br />
Figure 5: Sorption and desorption isotherms of researched mortars.<br />
The experimental results presented in this paper pointed out to the possibility of using<br />
diatomite as a partial Portland cement replacement in composition of cement based mortars.<br />
The following conclusions can be drawn from the study: application of diatomite led to the<br />
increase of compressive and bending strength and partially also to the improvement of Young’s<br />
modulus; the total open porosity as well as pore size distribution were properly modified by<br />
diatomite admixture; the frost resistance of mortars with diatomite decrease in comparison with<br />
reference cement mortar, the water vapour storage properties were slightly enhanced by<br />
diatomite admixture, however, the moisture storage capacity remained very low.<br />
In respect to the obtained data, further experiments and detail analyses must be performed<br />
before practical application of diatomite in mortars mix design.<br />
Acknowledgment<br />
This research has been supported by the Ministry of Education, Youth and Sports of the Czech<br />
Republic, under project No 7AMB12GR001.<br />
171
References<br />
[1] MALHOTRA, V.M. Role of supplementary cementing materials reducing greenhouse gas<br />
emissions. Proc. of Int. <strong>Conference</strong> on Infrastructure Regeneration and Rehabilitation.<br />
Improving the Quality of Life Through Better Construction. A Vision for the Next<br />
Millenium, R.N.Swamy (ed.), Sheffield, 1999, pp. 27‐42.<br />
[2] PAPADAKIS, V.G. ‐ TSIMAS, S. Supplementary cementing materials in concrete Part I:<br />
efficiency and design, In: Cement and Concrete Research, vol. 32, 2002, pp. 1525–1532.<br />
[3] PAPADAKIS, V.G. ‐ ANTIOHOS, S. ‐ TSIMAS, S. Supplementary cementing materials in<br />
concrete Part II: A fundamental estimation of the efficiency factor, In: Cement and Concrete<br />
Research, vol. 32, 2002, pp. 1533–1538.<br />
[4] DEGIRMENCI, N. – YILMAZ, A. Use of diatomite as partial replacement for Portland<br />
cement in cement mortars, In: Construction and Building Materials, vol. 23, 2009, pp. 284‐<br />
288.<br />
[5] DOLLEY, T.P. Diatomite, In: Ceramic Bulletin, vol. 70, 1991; pp. 860.<br />
[6] AYDIN, A.C ‐ GÜL, R. Influence of volcanic originated natural materials as additive on<br />
the setting time and some mechanical properties of concrete, In: Construction and Building<br />
Materials, vol. 21, 2007, pp. 1277‐1281.<br />
[7] KASTIS, D. Properties and hydration of blended cements with calcareous diatomite, In:<br />
Cement Concrete Research, vol. 36, 2006, 1821‐1826.<br />
[8] STAMAKIS, M.G. ‐ FRAGOULIS, D. – CSIRIK, G. – BEDELEAN, I. – PEDERSEN, S. The<br />
influence of biogenic micro‐silica‐rich rocks on the properties of blended cements, In:<br />
Cement Concrete Composites, vol. 25, 2003, pp. 177–184.<br />
[9] ČSN EN 12390‐5, ʹʹTesting of hardened concrete – Part 5: Bending strengthʹʹ. Prague:<br />
Czech Standardization Institute, 2007.<br />
[10] ČSN EN 12390‐5, ʹʹTesting of hardened concrete – Part 3: Compressive strengthʹʹ. Prague:<br />
Czech Standardization Institute, 2007.<br />
[11] ČSN 73 1322/Z1:1968, ʹʹConcrete testing – Hardened concrete – Frost resistanceʹʹ. Prague:<br />
Czech Standardization Institute, 2003.<br />
172
The use of municipal solid waste incineration materials in<br />
concrete production<br />
Zbyšek Pavlík, Martin Keppert, Milena Pavlíková, Jaromír Žumár<br />
Faculty of Civil Engineering, Czech Technical University in Prague, Thákurova 7, CZ‐166 29<br />
Prague, Czech Republic<br />
email: pavlikz@fsv.cvut.cz<br />
Abstract: Waste management becomes one of the most actual problems of present society. In the<br />
advanced countries, the recycle approach to the waste treatment is absolutely superior against other<br />
methods that are used until now especially from the economical reasons or because of the absence of the<br />
effective recycling methods. The building materials are manufactured mainly on natural basis, what has<br />
harmful effect on the living environment quality. Hence the ways of the natural sources savings are<br />
searched. One of important ways, widely applied in civil engineering for long years, is to replace natural<br />
sources with secondary materials (i.e. wastes from other processes). The municipal solid wastes<br />
incineration (MSWI) generates worldwide significant amounts of waste materials. However, their<br />
application for production of new materials is unfortunately very limited. This paper reviews the<br />
possibilities of municipal solid waste incineration materials (MSWIMs) for application in concrete<br />
industry.<br />
Keywords: municipal solid waste incineration materials, fly ash, bottom ash, concrete and cement<br />
composites production<br />
Introduction<br />
During Regulations on waste elimination make waste management a significant problem for the<br />
public authorities today. For a long time, the majority of waste was disposed of in tips but this<br />
is now becoming impossible. The present age is characteristic by the tendency of maximal<br />
recycling of all types of wastes and reducing their disposal. Recycle approach to the waste<br />
treatment is absolutely superior against other methods there were used till now especially from<br />
economical reasons. The direction of European Union No. 1999/31/EC sets to the member states<br />
the obligation to reduce the total amount of waste damps. According to this direction, in 2010<br />
the amount of disposed waste should be reduced in 2013 to 50% and in 2020 to 35% as<br />
compared to state in 1995.<br />
The combustion methods are presently considered as significant source of greenhouse gases,<br />
especially of carbon dioxide. However, this opinion is in the case of municipal waste<br />
combustion inappropriate. The municipal waste can be considered as biomass that originates<br />
from photosynthetic reactions with carbon oxides. In balance considerations, the municipal<br />
waste combustion cannot lead to the rising of greenhouse gases amount in the atmosphere. In<br />
addition, the municipal waste incinerators are indispensable source of energy. For example<br />
incinerator Termizo in Liberec, Czech Republic, has heat power of 22.8 MW. The amount of the<br />
developed pressure steam (43 bar/430°C) corresponds to 35 t hod‐1. The back‐pressure turbine<br />
then lowers the pressure of steam, what is subsequently utilized for heat supply of city<br />
buildings. The energetic outcomes of biomass combustion are from the point of view of energy<br />
sources classified as “waste to energy”. Incineration of municipal waste allows also a great<br />
reduction in the quantity of the wastes of 65–80% in mass and 85–90% in volume.<br />
173
On the basis of above given facts there is evident that the amount of MSWIMs will increase in<br />
near future and their industrial use is necessary from the environmental point of view as well as<br />
from the financial benefits. Especially the recycling of industrial wastes in the concrete<br />
manufacturing is of increasing interest worldwide, due to the high environmental impact of the<br />
cement and concrete industries and to the rising demand of infrastructures, both in<br />
industrialised and developing countries [1].<br />
Solid Residues from Incineration Processes and Their Pre‐treatment<br />
The solid wastes that are formed during incineration processes can be generally divided into<br />
three basic groups: under‐furnace grate slag materials, solid wastes from electro‐filters (ash<br />
materials ‐ MSWIAs) and fly ashes from sleeve and catalytic filters. The ash materials represent<br />
about 1‐3% of the total municipal solid waste incinerator (MSWI) residues. These fly ashes<br />
differ in grain size distribution, composition and amount of heavy metals, and many other<br />
parameters. Among them, the toxicity is from the point of view of their utilization at the top of<br />
the interests.<br />
Toxic fly ashes are contaminated with toxic organic compounds, especially with<br />
polychlorinated dibenzo‐p‐dioxines, benzofurans and biphenyls phenols (POP compounds –<br />
persistent organic pollutants). These highly toxic fly ashes should be detoxified by safe<br />
technologies because the current practice of landfilling these materials is quite provisional from<br />
an environmental point of view. Presently, no effectual legislative limits on the content of toxic<br />
POP compounds in the solid wastes from municipal waste incinerators are valid. The legislative<br />
process that assessed the limits of the toxicity of fly ash materials was in EU finished in 2007<br />
(EU regulation No. 850/2004, No. 1195/2006, No. 172/2007).<br />
On the other hand most of ashes from electro‐filters are according to current legislative<br />
harmless because of low content of polychlorinated dibenzo‐p‐dioxines and benzofurans.<br />
Electro‐filters enable fractional separation of fly ashes with respect to particles size. It can be<br />
used for the optimization of composition in the study of fly ashes recycling from the point of<br />
view of optimal properties of solidified products for building purposes. Under‐furnace grate<br />
slag materials represent majority part of solid waste produced in incinerators. However the<br />
amount of solid waste is highly dependent on the type of burnt material, it is possible to say<br />
that approximately one weighted third of the total amount of burnt waste will come out of<br />
incinerators in form of solid waste. In case of meeting European Union requirements on land<br />
filling reduction to 35% in 2020, the amount of recycled solid waste will be 500 kt per year. It is<br />
absolutely evident that successful economical solution of recycling of these waste materials is<br />
highly actual topic. The toxic MSWIA materials will be not studied in this work since their<br />
detoxification and consequent recycling belong to the chemical destruction problems [2].<br />
Both MSWIA and under‐furnace grate slag materials from MSWI contain certain amount of<br />
chlorides, causing chloride penetration problems in concrete mixes, and increasing the<br />
leachability of the heavy metals they contain [3], [4]. To reduce the chloride contents, the<br />
washing treatment using distilled water can be performed [1]. The high levels of toxic metals<br />
also make MSWIA materials classifiable as hazardous waste [5], [6], [7]. Currently there exist<br />
several treatments solving the problem of waste ashes from incinerators from the point of view<br />
of stabilization of heavy metals to prevent their risk landfilling. Nevertheless, these methods do<br />
not take into account presence of highly toxic persistent pollutants (polychlorinated dibenzo‐p‐<br />
dioxines, benzofurans and biphenyls) that are often contained is some ashes. In light of<br />
application of toxic MSWIAs in industry there is not possible to solidify materials containing<br />
174
higher amount of POP chemicals than limit values. Stabilization of heavy metals can be done in<br />
the following ways.<br />
Heavy metals in ashes can be stabilized against their leaching by solidification, i.e. by the<br />
addition of some solids, such as cement. However, the heavy metals are not fixed safely enough<br />
in this way, and, furthermore, the additives increase the total amount of the material which<br />
must be landfilled or recycled [8].<br />
Another perspective method is vitrification of heavy metals into glassy structures using high<br />
temperature heating. During the melting process, heavy metals are evaporated or immobilized<br />
in Si‐O matrix [9], [10]. Heavy metals are fixed reliably in this way and the formed material<br />
exhibits excellent leaching characteristics. With a suitable fly ash composition, the process can<br />
work even without any additives or with certain amount of admixtures. Besides the classical<br />
glass furnaces, also microwave heating can be applied as the fly ash contains residual carbon<br />
strongly interacting with microwaves and the heat produced is able to melt the ash. Vitrification<br />
methods can be counted among the complex methods because in addition to the permanent<br />
immobilization of heavy metals, also PCDD/F is usually decomposed [11]. Along with the<br />
above mentioned vitrification, the so called 3R process also belongs to the complex methods<br />
group. The process makes use of acid solutions from scrubbers which extract heavy metals from<br />
the ash, and their subsequent separation. In the extraction step, 90% Cd, 70% Zn, and 20 to 40%<br />
of other heavy metals are removed from the ash which is then returned to the incineration unit<br />
and subjected to PCDD/F destruction. The 3R process decreases amount of heavy metals and<br />
improves their immobilization in the product formed. The final solidification products can<br />
already be used e. g. as a building material [12].<br />
In general, the published or patented potential solutions of municipal toxic waste disposal are<br />
limited to selected parts of the detoxification and recycling of toxic fly ashes. Comprehensive<br />
technological pilot plant solutions are very sparse, and commercial solutions are completely<br />
absent. The solutions of the particular technological points (detoxification, heavy metal<br />
separation, sintration methods, ashes solidifications, recycling of waste materials for the<br />
application in building industry) are not linked together and the particular technical solutions<br />
do not offer any complex treatment of the problem.<br />
Application of MSWIMs in Building Materials<br />
The Solid residuals from municipal solid waste incineration process are subjected in the last two<br />
decades to an intensive research focused on their possible application as new concrete mineral<br />
admixtures. Here, the MSWIMs can play role as active as well as non‐active mineral admixture.<br />
Although the recycling of ashes from coal power stations is technologically well established,<br />
and commonly applied in the building practice, fly and bottom ashes from municipal waste<br />
incinerators remain technologically an open field from this point of view, until now.<br />
MSWIA and under‐furnace slag materials possess a chemical composition that is not dissimilar<br />
from that of fly ashes from coal combustion. In fact, they are mainly composed of amorphous<br />
silica, alumina, iron oxide and calcium oxide. This suggests that these materials could have<br />
pozzolana or hydraulic behaviour and its addition to the concrete mix could have a beneficial<br />
role in the development of the microstructure of the hydrated cement paste. Hence, a great<br />
advantage in the sustainability of the concrete industry would be achieved if MSWIMs, which<br />
are available in great quantities throughout the world, could be used to produce quality<br />
concretes [1]. Several researches have already proved the pozzolana activity of MSWIA<br />
175
materials showing their reactivity with calcium hydroxide (see e.g. [13]). The pozzolana<br />
reaction of active aluminous and silicate ions with calcium hydroxide formed within the<br />
hydration of Portland cement results in the formation of calcium silicates and aluminous silicate<br />
hydrates, which fill the pore volume, and increase the compressive strength and the durability<br />
of the blended cement concrete.<br />
Because the waste treatment represents highly actual topic, several researches have studied the<br />
possibility of recycling of MSWIMs in concrete and cement manufacturing, both as aggregates<br />
or mineral additions. MSWI bottom ash and fly ash have been also used as secondary raw<br />
materials for manufacturing cement, ceramics, bricks, or tiles [14] – [20]. Recently we published<br />
also several papers on application of MSWIMs as partial Portland cement replacement or fine<br />
aggregates in concrete mix design [21] ‐ [23]. In paper [24] we used bottom ash from MSWI as<br />
partial silica sand replacement in cement mortar. The chemical composition of applied bottom<br />
ash determined by X‐ray fluorescence (XRF) analysis is presented in Table 1. XRF is just a semi‐<br />
quantitative technique; hence the results have to be taken into account just as indicative (an<br />
error as high as 20 % may be estimated). We can see that the amount of chlorides is very low,<br />
what is beneficial from the point of view of possible reinforcement corrosion in case of<br />
application of studied materials in construction concrete [24].<br />
176<br />
Table 1: Chemical composition of applied bottom ash (in %)<br />
Substance Amount [mass %]<br />
SiO2 33.5<br />
Al2O3 15.8<br />
Fe2O3 8.4<br />
CaO 19.4<br />
MgO 2.0<br />
SO3 9.3<br />
ZnO 0.8<br />
Na2O 3.6<br />
K2O 1.9<br />
TiO2 1.5<br />
Cl 1.1<br />
Σ 97.1<br />
In paper [24] we studied the effect of MSWI bottom ash application on the properties of the<br />
hardened cement based mortars. The bottom ash was used as partial sand replacement in the<br />
amount of 10 and 40%. See Table 2 for the comparison of properties of mortars with bottom ash<br />
(CM10, CM40) and reference cement mortar CMR. Here, the addition of MSWI bottom ash<br />
contributes significantly to the mechanical performance of developed materials.<br />
Table 2: Mortars properties<br />
Matrix Density<br />
[kg/m3 Bulk Density<br />
] [kg/m3 Total Open Compressive Bending<br />
] Porosity [%] Strength [MPa] Strength [MPa]<br />
CMR 2662 2105 20.9 41.0 6.5<br />
CM10 2671 2013 24.6 42.0 7.0<br />
CM40 2650 1911 27.9 45.0 7.5
Another practical example of utilization of MSWIA was presented for instance in [1]. Here, the<br />
authors deal with 30% replacement (by mass) of Portland cement by MSWIMs in concrete<br />
structure. They have cast control concrete with 440 kg/m3 of Portland cement type CEM I 52.5R,<br />
according to European Standard EN 197‐1, water/cement ratio of 0.50 and 1700 kg/m3 of<br />
crushed limestone aggregate (maximum size 14 mm). For the evaluation of effect of MSWIM<br />
addition, concrete mixture with the same composition as the previous was cast with the partial<br />
Portland cement replacement by dry or washed MSWI fly ash or MSWI bottom ash (slag<br />
material). The authors refers that the concrete mixtures with the addition of different types of<br />
MSWI materials did not show any workability problems and their fresh density was<br />
comparable with that of the control concrete. Nevertheless, the concrete with addition of dry<br />
MSWI bottom ash experienced a remarkable expansion during setting. Because of such<br />
expansion, the density of the hardened concrete decreased, what led to the decreasing in<br />
strength characteristics. This feature was observed also by other authors (see e.g. [24]) and the<br />
causes of this phenomenon have been discussed in several papers [30]. This harmful effect of<br />
MSWI material addition into concrete mixture can be explained by chemical reactions on non‐<br />
ferrous metals, particularly on aluminum and zinc that cause an increase in volume. Under<br />
alkaline conditions, which occur during cement hydration, metallic aluminum can form<br />
hydroxides or lead to the emission of hydrogen. Two basic approaches were developed to avoid<br />
this phenomenon. In paper [1], the wet MSWI materials were used. In this case, no expansion<br />
was observed. The results given in [1] clearly demonstrated good pozzolana behaviour of<br />
MSWIMs and proved the possibility of these materials to give a significant contribution to the<br />
development of the strength and impermeability of concrete.<br />
Second possibility how to solve the problem of volume expansion of concretes containing the<br />
MSWI materials is to immerse the ash materials in a solution of sodium hydroxide, till all<br />
hydrogen is produced, according to the following reaction<br />
3n<br />
NaOH Al H2O NaAlO2 H 2.<br />
(1)<br />
2<br />
For example Pera et al. [25] have immersed MSWI bottom ash in sodium hydroxide solution for<br />
15 days. The ash was then washed and dried. The concrete mixture with such treated ash<br />
addition has than revealed very perspective strength characteristics.<br />
Conclusions<br />
This review shows that MSWIMs are potentially attractive for application in building industry.<br />
They can find use above all in cement and concrete manufacturing as mineral binder or<br />
aggregate addition. Nevertheless, it should be pointed out that their widespread utilization in<br />
practice is limited by the variability in their composition. Therefore, detailed chemical and<br />
physical analysis has to be performed before their application. Some of MSWI materials require<br />
also pre‐treatment like wetting, washing, vitrification (melting) etc. for optimization of their<br />
properties.<br />
Acknowledgment<br />
This research has been supported by the Czech Science Foundation, under project No.<br />
P104/11/0438.<br />
177
References<br />
[1] BERTOLINI, L. – CARSANA, M. – CASSAGO, D. – CURYIO, A. Q. – COLLEPARDI, M.<br />
MSWI ashes as mineral addition in concrete, In: Cement and Concrete Research, vol. 34,<br />
2004, pp. 1899‐1906.<br />
[2] PEKÁREK, V. – KARBAN, J. – FIŠEROVÁ, E. – BUREŠ, M. – PACÁKOVÁ, E. –<br />
VEČERNÍKOVÁ, E. Dehalogenation Potential of Municipal Waste Incineration Fly Ash. 1,<br />
General Principles, In: Environmental Science and Pollution Research, vol. 10, 2003, pp. 39‐43.<br />
[3] EIGHMY, T.T. – EUSDEN, J.D. – KRZANOWSKI, J.E. – DOMIAGO, D.S. – STAMPFLI, D.<br />
– MARTIN, P.M. Comprehensive approach toward understanding element speciation and<br />
leaching behavior in municipal solid waste incineration electrostatic precipitator ash, In:<br />
Environmental Science & Technology, vol. 29, 1995, pp. 629‐646.<br />
[4] GONG, Y. – KIRK, D.W. Behaviour of municipal solid waste incinerator fly ash: I, General<br />
leaching study, In: Journal of Hazardous Materials, vol. 36, 1994, pp. 249‐264.<br />
[5] JAKOB, A. – STUCKI, S. – KUHN, P. Evaporation of heavy metals during the heat<br />
treatment of municipal solid waste incinerator fly ash, In: Environmental Science &<br />
Technology, vol. 29, 1995, pp. 2429‐2436.<br />
[6] KIRBY, C.S. – RIMSTLDT, J.D. Mineralogy and surface properties of municipal solid<br />
waste ash, In: Environmental Science & Technology, vol. 27, 1993, pp. 652‐660.<br />
[7] LIN, K.L. – WANG, K.S. – TZENG, B.Y. – LIN, C.Y. The reuse of municipal solid waste<br />
incinerator fly ash slag as a cement substitute, In: Resources, Conservation and Recycling,<br />
vol. 39, 2003, pp. 315‐324.<br />
[8] VOGG, H. – VEHLOW, J. Low Pollutant Waste Incineration ‐ a Systems‐Approach to<br />
Emissions and Residues, In: Interdisciplinary Science Reviews, vol. 18, 1993, pp. 199‐206.<br />
[9] SREENIVASARAO, K. – WARREN, G.W. – McKINLEY, M.D. – GAO, G.<br />
Hydrometallurgical treatment of municipal solid waste fly ash for simultaneous<br />
detoxification and metal recovery, In: Journal of Environmental Science and Health, Part A,<br />
vol: 32, 1997, pp. 1225‐1245.<br />
[10] ABE, S. – FUMIAKI, K. – OKADA, M. Ash melting treatment by rotating type surface<br />
melting furnace, In: Waste Management, vol: 16, 1996, pp. 431‐443.<br />
[11] NAKAMURA, S. – OOGAKI, Y. – HAMAGUCHI, K. Treatment of Incineration Ash and<br />
Fly Ash for Dioxin Decomposition, Patent JP 09 57,230, Application 95217,029, 25 Aug<br />
1995.<br />
[12] SUZUKI, T. – YAMADA, M. – HIGASHI, Y. – TAGASHIRA, S. – KAWABATA, H. – HO,<br />
T. – SHIMIZU, Y. Melting of MSW Incineration Fly Ash by Plasma melting Furnace, In:<br />
Organohalogen Compounds, vol. 12, 1993, pp. 65‐68.<br />
[13] PAINE, K.A. – DHIR, R.K. – DORAN, V.P.A. Unprocessed and processed incinerator<br />
bottom ash as a cement bound material, in: International Symposium on Sustainable<br />
Construction: Use of Incinerator Ash, University of Dundee (UK), 2000, pp. 267‐278.<br />
[14] KIKUCHI, R. Recycling of MSW for cement production: pilot‐scale test for transforming<br />
incineration ash of solid waste into cement clinker, In: Resources, Conservation and<br />
Recycling, vol. 31, 2001, pp. 137– 147.<br />
[15] LEE, T.C. – RAO, M.K. Recycling municipal incinerator fly‐ and scrubber‐ash into fused<br />
slag for the substantial replacement of cement in cement‐mortars, In: Waste Management,<br />
vol. 29, 2009, pp. 1952‐1959.<br />
178
[16] LEE, T.C. – LI, Z.S. Conditioned MSWI ash‐slag‐mix as a replacement for cement in<br />
cement Mortar, In: Construction and Building Materials, vol. 24, 2010, pp. 970‐979.<br />
[17] GAO, X.B. – WANG, W. – YE, T.M. – WANG, F. – LAN, Y.X. Utilization of washed MSWI<br />
fly ash as partial cement substitute with the addition of dithiocarbamic chelate, In: Journal<br />
of Environmental Management, vol. 88, 2008, pp. 293‐299.<br />
[18] AUBERT, J.E. – HUSSON, B. – VAQUIER, A. Use of Municipal solid waste incineration fly<br />
ash in concrete, In: Cement and Concrete Research, vol. 34, 2004, pp. 957 – 963.<br />
[19] MÜLLER, U. – RÜBNER, K. The Microstructure of Concrete Made with Municipal Waste<br />
Incinerator Bottom Ash as an Aggregate Component, In: Cement and Concrete Research, vol.<br />
36, 2006, pp. 1434–1443.<br />
[20] COLLEPARDI, M. – COLLEPARDI, S. – ONGARO, D. – CURZIO, A.Q. Concrete with<br />
Bottom Ash from Municipal Solid Wastes Incinerators. In: <strong>Proceedings</strong> of the Second<br />
International <strong>Conference</strong> on Sustainable Construction Materials and Technologies, Ancona, 2010,<br />
pp. 289‐298.<br />
[21] KEPPERT, M. – TYDLITÁT, V. – VOLFOVÁ, P. – ŠYC, M. – ČERNÝ, R. Characterization<br />
of Solid Waste Materials Produced by a Modern Municipal Solid Waste Incineration<br />
Facility from the Point of View of Civil Engineering, In: <strong>Proceedings</strong> of the Second<br />
International <strong>Conference</strong> on Sustainable Construction Materials and Technologies, Ancona, 2010,<br />
pp. 737‐743.<br />
[22] PAVLÍK, Z. – JERMAN, M. – KEPPERT, M. – REITERMAN, P. – PAVLÍKOVÁ, M. –<br />
ČERNÝ, R. Use of Municipal Solid Waste Incineration Waste Materials as Admixtures in<br />
Concrete, In: <strong>Proceedings</strong> of the Second International <strong>Conference</strong> on Sustainable Construction<br />
Materials and Technologies, Ancona, 2010, 743‐753.<br />
[23] KEPPERT, M. – REITERMAN, P. – PAVLÍK, Z. – PAVLÍKOVÁ, M. – JERMAN, M. –<br />
ČERNÝ, R. Municipal solid waste incineration ashes and their potential for partial<br />
replacement of Portland cement and fine aggregates in concrete, In: Cement Wapno<br />
Beton, vol. 15, 2010, pp. 187‐193.<br />
[24] PAVLÍK, Z. – KEPPERT, M. – PAVLÍKOVÁ, M. – VOLFOVÁ, P. – ČERNÝ, R. Application<br />
of MSWI Bottom Ash as Alternative Aggregate in Cement Mortar, In: WIT Transactions on<br />
Ecology and the Environment, vol. 3, 2011, pp. 335‐342.<br />
[25] PERA, J. – COUTAZ, L. – AMBROISE, J. – CHABABBET, M. Use of incinerator bottom<br />
ash in concrete, In: Cement and Concrete Research, vol. 27, 1997, pp. 1 – 5.<br />
[26] BERG, E. – NEAL, J.A. Municipal waste combustor ash in concrete, In: <strong>Proceedings</strong> of the<br />
Fifth International <strong>Conference</strong> on municipal solid waste combustor ash utilization, Edited by W.<br />
H. Chesner and F. J. Roethel, Arlington, 1992, pp. 155‐170.<br />
179
180<br />
Chosen physical properties of flours<br />
Milena Pavlíková, Radka Pernicová, Jaromír Žumár, Jan Fořt, Zbyšek Pavlík<br />
Faculty of Civil Engineering, Czech Technical University in Prague, Thákurova 7, CZ‐166 29<br />
Prague, Czech Republic<br />
email: milena.pavlikova@fsv.cvut.cz<br />
Abstract: In this paper, basic physical properties of three different types of wheat flour, nominally<br />
smooth flour, whole‐meal flour, and semi‐meal flour are studied at first. Here, powder density and matrix<br />
density are measured using the gravimetric method and helium pycnometry. Particle size distribution is<br />
measured on laser diffraction principle. For the studied materials, measurement of thermal conductivity,<br />
volumetric heat capacity and thermal diffusivity is done using the impulse method, whereas the<br />
measurement is performed in dependence on moisture content. Among the hygric properties, sorption and<br />
desorption isotherms are measured using dynamic water vapor sorption device. The results presented in<br />
this paper can find utilization in food industry. They can be applied for instance for the adjustments of<br />
the drying rate, for the calculations of the economical drying time and for the determination of energetic<br />
balances of drying processes.<br />
Keywords: smooth flour, whole‐meal flour, semi‐meal flour, physical properties, food industry<br />
1. Introduction<br />
Biological agricultural materials consist of highly heterogeneous sets of different substances,<br />
mixtures and structural components, including complex organic structures. Their<br />
inhomogeneous composition and high variability affect their behavior and cause complicated<br />
and variable physical properties. Physical properties of biological agricultural materials are<br />
dependent on moisture and temperature of the studied material, and mostly show a<br />
considerable hysteresis.<br />
Characterization of agricultural materials is the first step in food products formulation and<br />
development. Basic understanding of the properties of these materials can lead to improvement<br />
of both the products quality and ease of product development. Fundamental knowledge of<br />
physical characteristics and their variability, such as powder, moisture and particle size<br />
distribution, are helpful to ensure proper handling, storage, and drying, as well as help to<br />
determine the overall design of the processing system. Several studies have been conducted on<br />
the relationship between powder density and moisture content of grains or their products [1‐3].<br />
Accurate description of particle size distribution of milled wheat products is essential to feed<br />
formulation and manufacturing because it affects the feed’s processing conditions and<br />
nutritional efficiency [4]. Thermal conductivity, thermal diffusivity and specific heat capacity<br />
are important physical properties of food, and agricultural materials, are critical parameters in<br />
the engineering design of food production thermal processes as cooling, cooking, drying,<br />
extrusion and freezing [5]. Water vapor storage properties represent important parameter for<br />
flour storage and its use. On this account, chosen physical properties of three different types of<br />
wheat flour, nominally powder density, matrix density, particle size distribution, thermal<br />
properties and sorption and desorption isotherms are researched in the presented paper.
2. Materials and Sampling<br />
Three different types of wheat flour, nominally smooth flour (HLM), whole‐meal flour (HRM),<br />
and semi‐meal flour (PHM) are studied in the paper. All the researched materials are products<br />
of UNIMILLS, Inc., Prague, Czech Republic, and were studied in the dry state, initial state from<br />
the market and after exposure to 75% of relative humidity. The drying was performed for 90<br />
minutes at 130°C according to ISO 712.<br />
3. Experimental Methods<br />
All the experiments were realized in the air conditioned laboratory at constant temperature<br />
23˚C ± 1˚C and relative humidity 30% ± 5%.<br />
3.1 Measurement of basic material properties<br />
Among the basic properties, powder density and matrix density were measured on gravimetric<br />
principle combined with helium pycknometry.<br />
3.2 Particle size distribution<br />
The measurement was done on laser diffraction principle using the device Analysette 22 Micro<br />
Tec plus. It allows measurement of particle size in the range 0.08 – 2000 m. The measuring<br />
range is obtained with the utilization of two lasers with different wave length. A green laser is<br />
used for the small particle range whereas an IR‐laser is utilized for the measurement of larger<br />
particles. Due to movability of the measuring cell, the captured angle area of the diffracted<br />
respectively scattered laser light can be matched to the requirements of the individual sample.<br />
With larger particles a large distance between measuring cell and detector is chosen, so the here<br />
appearing small diffraction angles can still be detected very well. With fine and very fine<br />
powders, optimal conditions for the measurement of large scattering angles are obtained by<br />
selecting a small distance between measurement cell and detector distance. This results in high<br />
resolution and sensitivity.<br />
3.3 Measurement of thermal properties<br />
The thermal conductivity, thermal diffusivity and volumetric heat capacity as the main<br />
parameters of heat transport and storage were determined using the commercial device<br />
ISOMET 104 (Applied Precision, Ltd.). ISOMET 104 is equipped with various types of optional<br />
probes, needle probes are for porous, fibrous or soft materials, and surface probes are suitable<br />
for hard materials. The measurement is based on the analysis of the temperature response of the<br />
analyzed material to heat flow impulses. The heat flow is induced by electrical heating using a<br />
resistor heater having a direct thermal contact with the surface of the sample. The<br />
measurements in this paper were done using the needle probe.<br />
3.5 Sorption and desorption isotherms<br />
Sorption and desorption isotherms characterize the moisture storage in the hygroscopic<br />
moisture range, where the transport of water vapor is dominant mode of moisture transfer.<br />
They express the dependence of the moisture content in the material on the relative humidity.<br />
The sorption and desorption isotherms are mostly measured by traditional methods, which are<br />
181
employed in almost the same form for many decades. The basic principle of the methods is very<br />
simple. In the case of determination of a sorption isotherm, a dry specimen of a porous material<br />
is weighed and put into a chamber with an exactly specified value of relative humidity. Here,<br />
the specimen is left, until the equilibration between the moisture content in the porous space<br />
and the relative humidity in the surroundings is achieved, i.e., until the specimen stops to<br />
absorb water vapor from the air in the surroundings. This can take a relatively long time,<br />
usually several days or weeks but sometimes even several months [6].<br />
On this account, dynamic vapor sorption device DVS‐ Advantage II (Surface Measurement<br />
System Ltd.) was used for the measurement of sorption and desorption isotherms in the<br />
presented work. This device allows shorten the measuring time to three days.<br />
Results and Discussion<br />
Basic physical properties of studied flours are given in Table 1. Here, symbol i represents initial<br />
state of material, d dried material, and w flours exposed to 75% of relative humidity.<br />
182<br />
Table 1: Basic physical properties of studied flours<br />
Powder Matrix Moisture<br />
Material Density Density content<br />
[kg/m3 ] [kg/m3 ] mass [%]<br />
HLMi 647 1455 13.9<br />
HLMd ‐ 1489 ‐<br />
HLMw ‐ 1456 15.8<br />
PHMi 649 1454 12.4<br />
PHMd ‐ 1484 ‐<br />
PHMw ‐ 1457 16.1<br />
HRMi 685 1453 12.2<br />
HRMd ‐ 1472 ‐<br />
HRMw ‐ 1459 15.5<br />
Results of particle size distribution measurement are given in Figures 1, 2. We can see that the<br />
flour HLM is milled in comparison with other two flours finer, whereas the most roughly<br />
milled is flour HRM.<br />
Thermal properties are summarized in Table 2. Here, u is moisture content by mass, thermal<br />
conductivity, a thermal diffusivity, and c volumetric heat capacity. We can see their high<br />
dependence on moisture content changes, what is the consequence of water high thermal<br />
conductivity and specific heat capacity. The lowest thermal conductivity as well as thermal<br />
diffusivity exhibited flour PHM. On the other hand, the lowest volumetric heat capacity has<br />
HRM.
Figure 1: Particle size distribution of studied flours – cumulative curve.<br />
Figure 2: Particle size distribution of studied flours – distribution curve.<br />
Tab. 2 Thermo‐physical parameters of tested flours<br />
Type of grain u [W/mK] c *10 6 [J/m 3 K] a *10 ‐6 [m 2 /s]<br />
HLMi 13.9 0.138 1.440 0.144<br />
HLMd 0 0.133 0.919 0.091<br />
HLMw 15.8 0.203 1.450 0.150<br />
PHMi 12.4 0.137 1.410 0.152<br />
PHMd 0 0.136 0.900 0.093<br />
PHMw 16.1 0.216 1.470 0.155<br />
HRMi 12.2 0.128 1.440 0.142<br />
HRMd 0 0.125 0.832 0.088<br />
HRMw 15.5 0.204 1.460 0.153<br />
183
Sorption and desorption isotherms measured by dynamic vapor sorption device are graphed in<br />
Figures 3, 4. All the studied materials exhibited high hysteresis, what must be considered<br />
within their technological processing.<br />
Figure 3: Sorption and desorption isotherms of researched flours in initial state.<br />
Figure 4: Sorption and desorption isotherms of researched flours in dry state.<br />
184
4. Conclusions<br />
The results presented in this paper can find utilization in food industry in such processes where<br />
heat transport and storage properties of flours are indispensable. They can be applied for<br />
instance for the adjustments of drying rate, for the calculations of the economical drying time<br />
and for the determination of energetic balances of drying processes.<br />
Acknowledgment<br />
This research has been supported by the Ministry of Education, Youth and Sports of the Czech<br />
Republic, under project No 7AMB12SK035.<br />
References<br />
[1] WANG, Y.J. ‐ CHUNG, D.S. ‐ SPILLMAN, C.K. Physical properties of soybean meal, In:<br />
Cereal Chemistry, vol. 76, pp. 523‐526.<br />
[2] APPEL, W.B. 1985. Physical properties of feed ingredients, In: Feed Manufacturing<br />
Technology IIZ. 2nd Ed., (R.R. McEllhiney, ed.), 1985, pp. 557‐562.<br />
[3] KIM, Y.S. – FLORES, R.A., CHUNG, O.K. – BECHTEL, D.B. Physical, chemical and<br />
thermal characterization of wheat flour milling products, In: Journal of Food Process<br />
Engineering, vol. 26, 2003, pp. 469‐488.<br />
[4] HEALY, B.J. ‐ HANCOCK, J.D. ‐ KENNEDY, G.A. ‐ BRAMEL‐COX, P.J. – BEHNKE, K.C.<br />
– HINESE, R.H. Optimum particle size of corn and hard and soft sorghum for nursery<br />
pigs, In: Journal of Animal Science, vol.72, 1994, pp. 2227‐2236.<br />
[5] HUANG, L. – LIU, L.S. Simultaneous determination of thermal conductivity and thermal<br />
diffusivity of food and agricultural materials using a transient plane‐source method, In:<br />
Journal of Food Engineering, vol. 95, 2009, pp. 179‐185.<br />
[6] ČERNÝ, R. – ROVNANÍKOVÁ, P. Transport processes in concrete, Spon Press, Taylor and<br />
Francis Group, London, 2002. ISBN 0‐415‐24264‐9<br />
185
186<br />
DC Conductivity of Waste Calcite – Clay Ceramics in The<br />
Temperature Range 20 – 1050 °C<br />
Rudolf Podoba 1, 2 , Anton Trník 1, 3 , Igor Štubňa 1<br />
1Department of Physics, Constantine the Philosopher University, 949 74 Nitra, Slovakia<br />
2Department of Physics, Faculty of Civil Engineering, Slovak University of Technology in<br />
Bratislava, Radlinského 11,81368 Bratislava, Slovakia<br />
3Department of Materials Engineering and Chemistry, Czech Technical University, 166 29<br />
Prague, Czech Republic<br />
Abstract: Electrical conductivity of green ceramic materials (60 wt.% of clay, 0 and 20 wt.% of calcite<br />
waste and 20 and 40 wt.% of the clay fired at 1000 °C) was measured in the temperature range of 20 –<br />
1050 °C. DC electrical conductivity was measured with V‐A method (sensitivity of 1×10 ‐3 V and 1×10 ‐14<br />
A). Pt wires ( 0.5×150 mm) were used as the electrodes, which were inserted into the middle of the<br />
sample (20×10×10 mm). The samples passed through a release of the physically bound water, burning of<br />
the organic impurities, dehydroxylation of kaolinite and illite, decomposition of calcite and creation of<br />
anorthite and mullite. At low temperatures (20 – 200 °C), charge carriers are H + and OH ‐ ions bound to<br />
defects located on crystal surfaces and polar water molecules in the pores. After the releasing physically<br />
bound water, up to start of dehydroxylation at the temperature ~450 °C, DC conductivity is determined<br />
by a transport of Na + , Ca 2+ and K + . During dehydroxylation, the charge carriers are ions OH ‐ which are<br />
released from kaolinite and illite lattice. Between these ions, a reaction OH ‐ + OH ‐ → H2O(g) + O 2‐ leads to<br />
lowering of the concentration of OH ‐ ions and, consequently, to a temporary lowering of the DC<br />
conductivity. Decomposition of calcite runs between ~700 °C and 900 °C and leads to an increase in DC<br />
conductivity.<br />
Keywords: calcite, ceramics, DC conductivity<br />
1. Introduction<br />
Ceramic masses, which contain calcite, are often used in a brick industry. Instead of the<br />
relatively large calcite stones, it is profitable to exploit fine‐grain quarry waste. According to<br />
estimation, there is about 105 t of such waste in limestone quarries in Czech Republic.An<br />
advantage of the calcite addition is small irreversible contraction of the fired body during and<br />
after firing [1]. That is caused by a presence of anorthite which arises in the fired body at<br />
temperatures above 950 °C through metastable gehlenite. Gehlenite can be created by three<br />
ways: a) from CaO and metakaolinite, b) from CaO and metastable spinel phase, which<br />
precedes formation of mullite, and c) from CaO and mullite. The next step is transform<br />
gehlenite into anorthite [2]. A creation of gehlenite and anorthite is accompanied with<br />
increasing the fired body volume [3].<br />
A creation of anorthite in ceramic samples with different waste addition of CaCO3, Ca(OH)2,<br />
marble dust and plaster cast was studied in [4]. In every case were confirmed two steps of the<br />
creation of anorthite – firstly gehlenit appeared in exothermic reaction at 950 °C and then<br />
appeared anorthite in exothermic reaction at 980 °C. Similar results were obtained in [5].<br />
Since the ceramic sample contains kaolinite and/or illite as plastic constituents, dehydroxylation<br />
in the temperature region 450 °C – 650 °C takes place. This endothermic process is linked with<br />
significant mass loss. A contraction of the kaolinite volume is also registered. The volume of the
illite continues to expand in this temperature region [6, 7]. Both crystalline lattices,<br />
metakaolinite and dehydroxylated illite, exothermically collapse at the temperatures above 950<br />
°C which is accompanied with significant volume contraction [6, 8].<br />
The next important process is decomposition of calcite between 700 °C and 900 °C which<br />
present itself with high mass loss of the calcite phase (up to 44 wt.%) and volume contraction. A<br />
new phase CaO is porous [9, 10].<br />
If the sample is not dried, physically bounded water is released at the temperatures lower than<br />
200 °C [6].<br />
The objective of the paper is experimental study of phase development and the electrical<br />
properties of the ceramics samples with different content of calcite waste.<br />
2. Experimental<br />
We used two types of the samples, see Table 1. Clay B1, supplied by LB‐Minerals s.r.o., is a<br />
constituent of the each sample. As a filler was used clay B1 fired at 1000 °C with a soaking time<br />
90 min at the highest temperature. The clay B1 consists of kaolinite (65 wt.%), illite (25 wt.%),<br />
muscovite (3 wt.%), free quartz (5 wt.%) and undefined filler (2 wt.%) [11]. Calcite waste came<br />
from washing of the crushing the limestone in a quarry Omya, a.s., Vápenná, Czech Republic.<br />
The chemical compositions of clay B1 and calcite waste are in Table 2. The calcite waste was<br />
dried and then milled for 24 h in the laboratory dry ball mill. The equivalent mean spherical<br />
diameter d(0.5) of the milled calcite waste was 17.4 μm (measured with the particle size<br />
analyzer Mastersizer 2000).<br />
Table 1: Composition of measured samples (wt.%)<br />
Sample clay B1 B1 fired at 1000 °C Calcite waste<br />
A 60 40 ‐<br />
C 60 20 20<br />
Table 2: Chemical composition of clay B1 and calcite waste in wt.%<br />
SiO2 Al2O3 Fe2O3 TiO2 CaO MgO K2O Na2O<br />
sulphate<br />
s<br />
LOI<br />
clay B1 48.6 33.8 2.6 0.8 0.28 0.36 1.98 0.10 ‐ 11.3<br />
waste 0.01 0.08 0.09 0.01 54.55 0.6 0.02 ‐ 0.87 43.77<br />
Fired clay B1 was ground and sieved and then was mixed with clay, milled calcite waste, and<br />
the water to obtain a plastic mass with water content ~20 wt.%. Samples for measurement of DC<br />
conductivity are prepared according to standard STN 72 1565‐4. After filling the first part of the<br />
template with the material, the platinum wire electrodes are attached to it. A distance between<br />
the electrodes is 3 mm, see Figure 1.<br />
187
188<br />
20 mm<br />
3 mm<br />
10 mm<br />
3 mm<br />
1<br />
Figure 1: Location of electrodes in a sample with dimensions 20 × 10 × 10 mm. 1 – Pt wire diameter 0.5<br />
mm and length 150 mm, 2 – sample<br />
Then the second part of the template is attached. For better connection of various parts of the<br />
sample, the first part of the sample is wetted and then the second part is pressed on it and<br />
knocked in. The electrode is inserted into the sample in length 17 mm (Figure 1). Such an<br />
arrangement is chosen in order to minimize the surface electric current of the sample. DC<br />
conductivity of ceramics at elevated temperatures is measured in the same method as at room<br />
temperature [12].<br />
To measure the sample resistance R (or conductance 1/), we used the volt‐ampere method<br />
according to the scheme shown in Figure 2.<br />
Figure 2: Scheme of TCA measurement. 1 ‐ stabilized power BS 525, 2 – voltage stabilizer MA 7809, V –<br />
multimeter Hameg HM 8012, A – electrometer Keithley 6514<br />
A measuring circuit, see Figure 2, is fed with the DC power supply BS 525. Its voltage is set on<br />
12 V, but for the higher stability and higher smoothness of the voltage, the next stabilizing<br />
cascade was used. A voltage stabilizer MA 7809, with the output voltage 9 V, was inserted<br />
between the power supply and the sample. The voltage is recorded with a multimeter Hameg<br />
HM 8012 with a sensitivity of 1 mV. For measuring and recording the current, electrometer<br />
Keithley 6514 is used, which has sensitivity of 1×10 ‐14 A. As can be seen, the measuring circuit<br />
represents the serial connection of the power supply, the sample and the current measurer [13].<br />
There resulting conductivity was calculated using the relation<br />
12.88 <br />
<br />
(1)<br />
1<br />
2<br />
where U is voltage measured with the multimeter and I is current measured with the<br />
electrometer. The numerical value of 12.88 is a geometrical correction coefficient, which was<br />
experimentally obtained.<br />
V<br />
3 mm<br />
A<br />
2<br />
SAMPLE
3. Results and discussion<br />
The first peak in Figure 3, located in the range 3.36 – 2.36 K ‐1 (or 20 – 150 °C in Figure 4), reflects<br />
a release of the physically bound water. Its extent depends on the method of preparation and<br />
storage of the samples, which affects the physical content of bound water in the sample.<br />
Two mechanisms of electrical conductivity with a little different activation energies were<br />
identified from Figure 3 between 2.36 K ‐1 and 1.5 K ‐1 (i.e. 150 ° C ‐ 400 °C in Figure 4). The<br />
increase of the electrical conductivity at the temperatures lower than 260 °C (or 1.87 K ‐1 ) can be<br />
explained by the superposition of the deliberation of the residual physically bound water<br />
(transport of H + and OH ‐ ions) and by migration of Ca 2+ , Na + and K + ions.<br />
Figure 3: DC conductivity of the sample A (gray line) and C (black line)<br />
Above this temperature up to the temperature of the starting the dehydroxylation, the increase<br />
of the conductivity is caused by migration of Ca 2+ , Na + and K + ions. During dehydroxylation<br />
between 450 °C and 650 °C, two contradictory processes take place. The first process is a<br />
removal of OH ‐ groups from the kaolinite lattice which could increase the values of measured<br />
DC conductivity. The second process is a reaction between these OH ‐ groups according to<br />
equation OH ‐ + OH ‐ → H2O + O 2‐ [14]. This decreases the number of charge carriers. After its<br />
completion, an increase of the DC conductivity occurs as a consequence of the previously<br />
mentioned ion migration [15, 16, 17].<br />
A qualitative course of the both lines (A and C) begins to be more different after<br />
dehydroxylation. That is caused by a presence of CaCO3 in the sample C. The sample C has<br />
lower DC conductivity than sample A up to ~850 °C. This temperature is typical for<br />
decomposition reaction CaCO3 → CaO + CO2. After this reaction, DC conductivity significantly<br />
increases in the sample C, but we do not observe it in the sample A. Since the both samples (A<br />
and C) contain metakaolinite and dehydroxylated illite (metaillite), which collapse at ~950 °C,<br />
we observe a small maximum, which can be ascribed to this reaction [5].<br />
189
190<br />
Figure 4: DC conductivity of the sample A (gray line) and C (black line). Enlarged part of the<br />
relationships between 150 °C and 400 °C is in the inserted Figure<br />
4. Conclusion<br />
DC electrical conductivity of green ceramic materials (60 wt.% of clay, 0 and 20 wt.% of calcite<br />
waste and 20 and 40 wt.% of the clay fired at 1000 °C) was measured in the temperature range<br />
of 20 – 1050 °C using Pt wires ( 0.5×150 mm) electrodes. The samples passed through a release<br />
of the physically bound water, burning of the organic impurities, dehydroxylation of kaolinite<br />
and illite, decomposition of calcite and creation of anorthite and mullite. We found that:<br />
• at low temperatures (20 – 200 °C), charge carriers are H + and OH ‐ ions bound to defects<br />
located on crystal surfaces and polar water molecules in the pores.<br />
• after the releasing physically bound water, up to start of dehydroxylation at the<br />
temperature ~450 °C, DC conductivity is determined by a transport of Na + , Ca 2+ and K + .<br />
During dehydroxylation, the charge carriers are ions OH ‐ which are released from<br />
kaolinite and illite lattice. Between these ions, a reaction OH ‐ + OH ‐ → H2O(g) + O 2‐ leads<br />
to lowering of the concentration of OH ‐ ions and, consequently, to a temporary lowering<br />
of the DC conductivity.<br />
• decomposition of calcite runs between ~700 °C and 900 °C and leads to an increase in DC<br />
conductivity.<br />
• around the temperature 950 °C we observe a small maximum of the conductivity, which<br />
can be ascribed to a collapse of the metakaolinite and metaillite.<br />
Acknowledgments<br />
This research was supported by the grant APVV–0743–10 and VEGA 1/0646/12, Ministry of<br />
Education of Slovakia. Author A.T. gratefully acknowledges the financial support of the Czech<br />
Science Foundation, Project No. P105/12/G059.
References<br />
[1] SOKOLÁŘ, R. Effect of calcite on the brick body closing, Interceram, 2010, vol. 59, no. 4, p. 123<br />
‐ 127. ISSN 0020‐5214<br />
[2] RUOTSALA, A. Solid state formation of anorthite from some clay mineral – calcium mineral<br />
mixtures, The American Mineralogist, 48, 1963, p. 792‐803<br />
[3] PYTLÍK, P. – SOKOLÁŘ, R. Building Ceramics CERM, Brno 2002 (in Czech)<br />
[4] KURAMA, S. – OZEL, E. The influence of different CaO source in the production of anorthite<br />
ceramics. Ceramics International, 35, 2009,p . 827 ‐ 830<br />
[5] TRAORÉ, K. – KABRÉ, T.S. – BLANCHARD, P. Gehlenite and anorthite crystallisation from<br />
kaolinite and calcite mix, Ceramics International, 29, 2003, p. 377‐383<br />
[6] HANYKÝŘ, V. –KUTZENDORFER, J. Technology of ceramics, Silikátový svaz, Praha 2008<br />
(in Czech)<br />
[7] GUALTIERI, A.F. – FERRARI, S. Kinetics of illite dehydroxylation, Physics and Chemistry of<br />
Minerals, 33, 2006, p. 490‐501<br />
[8] HLAVÁČ J. A base of silicate technology, SNTL, Praha 1981 (in Czech)<br />
[9] RODRIGUEZ‐NAVARRO, C. – RUIZ‐AGUDO, E. – LUQUE, A. ‐ RODRIGUEZ‐<br />
NAVARRO, A.B. – ORTEGA‐HUERTAS, M. Thermal decomposition of calcite: Mechanism of<br />
formation and textured evolution of CaO nanocrystals. American Mineralogist, 94, 2009, p. 578‐<br />
593<br />
[10] TÓTH, A. Investigation of limestone during and after its thermal treatment, PhD thesis, UKF<br />
Nitra, Nitra 2010 (in Slovak)<br />
[11] SOKOLÁŘ, R. – VODOVÁ, L. The effect of fluidized flyash on the properties of dry pressed<br />
ceramic tiles based on flyash – clay body, Ceramics International, 37, 2011, p. 2879‐2885<br />
[12] TYDLITÁT V., KUTZENDORFER J. Přístroj ke stanovení elektrické vodivosti pevných látek za<br />
vysokých teplot v kontorlované atmosféře a ve vakuu, Silikáty 4, 1971, p. 373 – 379 (in Czech)<br />
[13] BROŽ, J. a kol. Základy fysikálních měření, SPN, Praha, 1967<br />
[14] DREBUSHCHAK, V.A. – MYLNIKOVA, L.N. – DREBUSHCHAK, T.N. The mass‐loss<br />
diagram for the ancient ceramics, J. Thermal Analysis and Calorimetry, 104, 2011, p. 459‐466<br />
[15] ŠTUBŇA I., KOZÍK T. Elektrická vodivosť kaolínov v intervale teplôt 150 ‐ 560 °C, XIII.<br />
konferencia TERMANAL, Stará Lesná 1994, p. 120‐121 (in Slovak)<br />
[16] ŠTUBŇA I., KOZÍK T. Electric conductivity of kaolin in the temperature range 150 – 560 °C,<br />
Journal of Thermal Analysis, 46, 1996, p. 607 – 610<br />
[17] RIEDLMAJER R., ŠTUBŇA I., VARGA G. Termoelektrická a termodilatometrická analýza<br />
anglických kaolínov, Silika, 2006, p. 119 – 121 (in Slovak)<br />
191
192<br />
The firing temperature of Gothic bricks from Pác<br />
Ľuboš Podobník 1 , Rudolf Podoba 1,2 , Igor Štubňa 1 , Peter Bačík 3 ,<br />
Jozefa Lukovičová 2<br />
1 Department of Physics, Constantine the Philosopher University, 949 74 Nitra, Slovakia<br />
email: lubos.podobnik@ukf.sk, istubna@ukf.sk<br />
2 Department of Physics, Faculty of Civil Engineering, Slovak University of Technology,<br />
813 68 Bratislava, Slovakia<br />
3 Department of Mineralogy and Petrology, Comenius University, 842 15 Bratislava, Slovakia<br />
Abstract: The paper deals with the bricks taken from the Gothic part of the church in Pác (Trnava<br />
County, Slovakia). The study of the temperature was based on results of thermodilatometric analysis<br />
(TDA), differential thermal analysis (DTA) and thermogravimetric analysis (TGA). These analyses were<br />
carried out at heating rate of 5 °C/min in the temperature range of 25 ‐ 1050 °C. The results revealed that<br />
the samples did not contain the glassy phase and contain calcite, which means that the bricks were fired at<br />
relatively low temperatures, not higher than 750 °C. It was also observed no signs of dehydroxylations of<br />
the clay constituent. A temperature of the start of dehydroxylation, 450 °C, can be considered as<br />
minimum firing temperature. It can be concluded that the historical bricks were fired at the temperature<br />
between 550 °C and 700 °C. Besides that, we could determine that the bricks contained calcite and quartz<br />
as fillers. A plastic constituent was illite as follows from the high temperature part of the DTA curve.<br />
Keywords: historical bricks, differential thermal analysis (DTA), thermogravimetry (TGA),<br />
thermodilatometry (TDA)<br />
1. Introduction<br />
In the past 40 years thermal analyses have been applied for more complete interpretation of the<br />
results obtained from archeological excavations. To learn about our history, we do not only<br />
analyze and preserve ceramic objects but also investigate and understand their technology [1].<br />
This is important in renovating of historical buildings where a damaged material should be<br />
replaced with a new one, the properties of which should be close to the properties of the<br />
historical material. Thermal analyses, especially DTA, TGA and thermodilatometry (TDA), are<br />
successfully applied to the study of historical building ceramics, such as bricks and tiles.<br />
The most frequent object of the thermoanalytical study of historical ceramics is the estimation of<br />
the firing temperature [2]. The estimation is based on the comparison of the TGA, DTA and<br />
TDA curves received from historical ceramic samples with the curves received from laboratory<br />
prepared samples [2]. The curves are known for the most frequent constituents of ceramic clay,<br />
i.e. kaolinite, illite, montmorillonite, muscovite, calcite, quartz and feldspar. These minerals<br />
change their structure as well as their chemical formula (except quartz) if subjected to heating.<br />
The degree of conversion, which characterizes phase transformation in clay during firing,<br />
depends on the temperature and time, f ( T , t)<br />
, if measured on a small powder sample. A<br />
different situation is in a large ceramic body, such as the brick. The layers, which are on the<br />
brick’s surface, are transformed sooner than the layers inside the brick. Experiments on large<br />
cylindrical green samples (80 mm) showed a clear dependence of the degree of kaolinite <br />
metakaolinite conversion on the location of the sample taken for the TGA. Consequently, we
have f ( T , t,<br />
r)<br />
, where r is the distance of the sample from the axis of rotation. It was also<br />
found that after heating at 650 °C for 10 h, the degree of conversion reached 0.95 and almost<br />
did not depend on r [3, 4].<br />
According to the description of firing of bricks in simple kilns used locally in Slovakia until<br />
early 1950s, the fuel was wood. Green bricks prepared by moulding the clay with water were<br />
formed, then dried, and finally inserted into the kiln and fired. The firing process took 4 – 6<br />
days depending on the kiln size and amount of bricks inside. The temperature was not<br />
measured [5]. As reported in [6], the upper temperature limit in such a kiln is 700 °C. We can<br />
suppose that the similar method and equipment were used for firing the bricks for the Gothic<br />
part of the church in Pác sometime in the 15th century.<br />
In this contribution, the study is focused on the analysis of historical bricks. Our goal was to<br />
estimate the firing temperature.<br />
2. Experimental<br />
The samples were bricks from a church located in Pác, Trnava County, Slovakia. The church<br />
was originally built in the Romanesque style, then was rebuilt in the Gothic style in 15 th century<br />
and enlarged in the Baroque style in 17 th century. The bricks, which are the object of this study,<br />
come from the Gothic part of the church.<br />
The DTA and TGA were performed on the modernized analyzer Derivatograph 1000 (Hungary)<br />
using a compact sample of 101020 mm cut from the surface layer of the brick and the heating<br />
rate 5 °C/min. A reference compact sample of the same size was made from a pressed powder<br />
Al2O3. The TDA was done on the dilatometer described in [7] with the sample 101040 mm at<br />
the heating rate 5 °C/min.<br />
The XRD analysis was performed with the diffractometer BRUKER D8 Advance with Cu<br />
anticathode (λα1 = 1.5406 Å), accelerating voltage 40 kV and beam current 40 mA. The XRD data<br />
were obtained by the BRUKER LynxEye detector.<br />
3. Results and discussion<br />
The results of the thermal analyses DTA and TGA are illustrated in Fig. 1. The first endothermic<br />
minimum on the DTA curve, which belongs to the interval of 20 – 300 °C, is typical for porous<br />
building clay ceramics, which does not contain glassy phase, i.e. fired at relatively low<br />
temperature. The minimum is related to the liberation of the physically bounded water<br />
absorbed on the faces of the crystals of minerals. It is known that the porosity of a green<br />
porcelain body increases by 4 – 5 % during dehydroxylation [8] and the specific surface of a<br />
kaolin body increases from 11 to 15 m 2 /g during this reaction [9]. The dehydroxylated ceramic<br />
body can absorb more water molecules than the green body. This fact was also observed in<br />
ancient ceramics investigated in [2, 10, 11].<br />
The second step of the mass loss has a sharp termination at 840 °C, which is a typical feature of<br />
the TG curve of the decomposition of calcite [12]. Between these two significant mass losses, a<br />
gradual mass loss is present, which can be explained by the presence of dissociated water<br />
molecules, i.e. ions H + and OH ‐ on the crystal surfaces. To liberate such water, a higher<br />
temperature (up to 600 °C) is necessary [13]. The second reason can be the liberation of OH ‐<br />
which could insert into dehydroxylated clay during redehydroxylation. Neither the<br />
endothermic minimum on the DTA curve, nor the step connected with the mass loss on the<br />
TGA curve, which could be ascribed to the second dehydroxylation, were not registered with<br />
193
these analyses. Redehydroxylation is a very slow process and 500 years, during which the<br />
bricks were hidden under a plaster, was probably not a sufficiently long time for the binding of<br />
greater amount of OH ‐ into the dehydroxylated clay structure.<br />
194<br />
temperature difference / °C<br />
1<br />
0<br />
-1<br />
-2<br />
-3<br />
-4<br />
-5<br />
0 500 1000<br />
temperature / °C<br />
Fig. 1: DTA (gray) and TGA (black) curves of the Gothic brick<br />
The results of TDA are depicted in Fig. 2. The TDA shows the presence of the significant<br />
amount of quartz, which corresponds to the small DTA endothermic peak at 580 °C. Above<br />
700 °C, the TDA curve begins to bend down, i.e. the contraction of the sample takes place. It<br />
reflects the decomposition of calcite [14]. If the decomposition is almost finished, the sample<br />
continues to expand up to the maximal experimental temperature 1050 °C. If the glassy phase<br />
would be present in the brick, it would be indicated on the TDA curve via a typical contraction<br />
caused by the pressing force of the dilatometer’s push‐rod [15]. This contraction appears above<br />
the transformation temperature of the glassy phase. Since the glassy phase can arise during<br />
firing at the temperatures higher than 900 °C, we can state that the maximal firing temperature<br />
of the bricks was lower than 900 °C.<br />
Fig. 2: Thermodilatometry of the Gothic brick<br />
1<br />
0<br />
-1<br />
-2<br />
-3<br />
-4<br />
-5<br />
relative mass loss / %
The time of the firing usually took 5 days. If we suppose a simple firing schedule according to<br />
Fig. 3, we see that a period with temperatures higher than 450 °C, which are suitable for<br />
dehydroxylation, is 50 h long. The period above 600 °C, where dehydroxylation runs<br />
intensively, is 28 h. Such conditions are sufficient for completing dehydroxylation. Heating rate<br />
0.2 °C/min is safe (from the cracking point of view) for the firing of such ceramic bodies as the<br />
investigated pavement bricks.<br />
temperature / °C<br />
800<br />
700<br />
600<br />
500<br />
400<br />
300<br />
200<br />
100<br />
0<br />
0 20 40 60<br />
time / h<br />
80 100 120<br />
Fig. 3: The probable firing schedule for 5‐day firing. Temperatures between horizontal lines are suitable<br />
for dehydroxylation<br />
A mineral composition of the bricks was determined with XRD analysis. As depicted in Fig. 4,<br />
quartz, calcite, feldspar and muscovite/illite are present in the brick after its firing. DTA and<br />
TDA clearly notice transformation of quartz and DTA together with TGA show<br />
endothermic effect between 650 – 900 °C. It can be ascribed to two reactions – decomposition of<br />
calcite and dehydroxylation of muscovite, both run simultaneously: dehydroxylation of<br />
muscovite starts at ~500 °C and terminates at the temperatures above 850 °C [16, 17] and<br />
decomposition of calcite starts at ~600 °C and terminates at the temperature ~850 °C [12, 14].<br />
Feldspar does not change its properties at the used temperatures, so it was not registered with<br />
TGA and DTA.<br />
It seems that the estimation of the firing temperature, based on the evaluation of the degree of<br />
conversion , is easily possible. But, in fact, we firmly know only two temperatures. The first of<br />
them is given by technical capability of the kiln (700 °C) and the second is the lowest<br />
temperature (500 °C) at which dehydroxylation runs at a reasonable rate. In this temperature<br />
interval only irreversible phase transformation is dehydroxylation. After the analysis of the<br />
probable firing schedule (Fig. 3), we can conclude that there was enough time to complete<br />
dehydroxylation in the whole brick’s volume, i.e. f ( T , t,<br />
r)<br />
can be simplified as f ( T , t)<br />
.<br />
We can reach the same degree of conversion by many combinations of the temperature and<br />
time. Therefore, we can not say exactly which the firing temperature was. The most probable<br />
interval for this temperature is 550 – 700 °C.<br />
195
196<br />
Fig. 4: XRD pattern of the Gothic brick. Q – quartz, F – feldspar, C – calcite, m – mica, illite<br />
4. Conclusions<br />
A pavement brick taken from a Gothic part of the church in Pác, Trnava County, Slovakia, was<br />
investigated by the thermal analyses DTA, TGA and TDA. It was found that the brick contained<br />
dehydroxylated clay, calcite and quartz. As revealed, dehydroxylation was completely finished<br />
and no redehydroxylation was observed. The decomposition of calcite was also found. The<br />
estimated firing temperature is between 550 °C and 700 °C. Besides this, we could determine<br />
that the green bricks contained calcite and quartz as fillers. A plastic constituent was illite as<br />
follows from the high temperature part of the DTA curve.<br />
Acknowledgements<br />
This work was supported by the grant VEGA 1/0646/12, Ministry of Education of Slovakia and<br />
UGA VI/21/<strong>2012</strong>, Constantine the Philosopher University in Nitra. One author (I.Š.) is indebted<br />
to Prof. D. Kluvanec for sharing his memories of the building of field kilns and preparing and<br />
firing the bricks. It helped us to imagine what the conditions could be in the past.<br />
References<br />
[1] P. Vandiver, The role of materials research in ceramics and archeology, Annual Review of<br />
Materials Research, 31, (2001) 373‐385.<br />
[2] V. A. Drebushchak, L. N. Mylnikova, T. N. Drebushchak, The mass ‐ loss diagram for the<br />
ancient ceramics, J. Thermal analysis and calorimetry, 104, (2011) 459‐466.<br />
[3] J. Ondruška, A. Trník, L. Vozár, Degree of conversion of dehydroxylation in a large<br />
electroceramic body, Int. J. <strong>Thermophysics</strong>, 32, (2011) 729‐735.<br />
[4] J. Ondruška, A. Trník, I. Medveď, Estimation of mass transfer parameters during<br />
dehydroxylation in a large ceramic body by inverse methods, Ceramics International, 37,<br />
(2011), 3293‐3305.<br />
[5] F. Kováč, Pálenie tehál poľným spôsobom, Dom techniky, Bratislava, 1960 (in Slovakian).
[6] S. N. Monteiro, C. M. F. Vieira, E. A. Carvalho, Technological behavior of red ceramic<br />
incorporated with brick waste, Revista Matéria, 10, (2005), 537‐542.<br />
[7] I. Štubňa, A. Vážanová, G. Varga, D. Hrubý, Simple push‐rod dilatometer for dilatometry<br />
of ceramics, Proc. Conf. Research and Teaching of Physics, SPU Nitra, Nitra, 2007, 69‐74.<br />
[8] I. Štubňa, T. Kozík, Permeability of the electroceramics to gas and its dependence on the<br />
firing temperature, Ceramics International, 23, (1997) 247‐249.<br />
[9] F. H. Norton, Fine ceramics technology and applications, McGraw‐Hill Co., New York,<br />
1970.<br />
[10] V. A. Drebushchak, L. N. Mylnikova, V. I. Molodin, Thermogravimetric investigation of<br />
ancient ceramics, J. Thermal analysis and calorimetry, 90, (2007) 73‐79.<br />
[11] V. A. Drebushchak, L. N. Mylnikova, T. N. Drebushchak, V.V. Boldyrev, The investigation<br />
of ancient pottery ‐ Application of thermal analysis, J. Thermal analysis and calorimetry ,<br />
82, (2005) 617‐626.<br />
[12] A. Teleki, L. Vozár, A. Tóth, Dynamika ireverzibilného chemického procesu, Cophys –<br />
International Physics Workshop, UKF Nitra, Nitra, 2008, 99‐107.<br />
[13] I. M. Kiselev, Firing of kaolin and investigation of fired products, PhD thesis stored in<br />
ONIITECHIM, Cerkassy, 1978, No. 1762178 (in Russian).<br />
[14] A. Tóth, Skúmanie fyzikálnych vlastností vápenca pred a po výpale, PhD dizertačná<br />
práca, UKF Nitra, Nitra, 2009 (in Slovakian).<br />
[15] C. Ventureli, M. Paganelli, Sintering behavior of clays for the production of ceramics,<br />
Cfi/Ber. DKG, 84, (2007) N5, E1‐E3.<br />
[16] L. A. Pérez‐Maqueda, J. M. Blanes, J. Pascual, J. L. Pérez‐Rodriguez, The influence of<br />
sonication on thermal behavior of muscovite and biotite, J. Europ. Ceram. Soc., 24, (2004)<br />
2793‐2801.<br />
[17] S. Guggenheim, Yu‐Hwa Chang, A. F. Koster van Groos, Muscovite dehydroxylation:<br />
high temperature studies, American Mineralogist, 72, (1987) 537‐550.<br />
197
Electronic and Thermal properties of Zinc Chalcogenides based<br />
on Density Function Theory<br />
198<br />
B. K. Sarkar 1 , G. Pavlendova 2 , I. Banik 2 , A. S. Verma 3<br />
1Department of Physics, Galgotias University, Greater Noida 201306, India<br />
2Department of Physics, Faculty of CE, Slovak University of Technology, Radlinského 11, 813 68<br />
Bratislava, Slovak Republic<br />
3Department of Physics, Panjab University, Chandigarh 160014, India<br />
Email: bks@physics.org.in<br />
Abstract: A great deal of attention has been given to Zinc chalcogenides (ZnX, X = S, Se and Te) due to<br />
their wide range of application as solid state optical devices having wide and direct band gap properties in<br />
blue and ultraviolet region. These materials become very popular because of their wide use in photovoltaic<br />
applications. In this paper we have applied the full‐potential linear‐augmented plane wave (FP‐LAPW)<br />
method within the skeleton of the density functional theory (DFT) for structural, electronic, and thermal<br />
characterisation of these materials. For the purpose of exchange‐correlation energy (Exc) determination in<br />
Kohn–Sham calculation, the standard local density approximation (LDA) formalism has been utilized.<br />
Murnaghan’s equation of state (EOS) has been used for volume optimization by minimizing the total<br />
energy with respect to the unit cell volume. With the knowledge of electronic density of states (DOS) and<br />
phonon dispersion, electronic, structural and thermal properties of Zinc chalcogenides have been<br />
estimated. The calculated lattice parameters and thermal parameters are in good agreement with other<br />
theoretical calculations as well as available experimental data.<br />
Keywords: Chalcogenides, electronic properties, thermal properties, DFT, FP‐LAPW.<br />
Introduction<br />
Chalcogenide glasses unlike conventional oxide glasses in recent times have attracted<br />
researcher with much attention as, they demonstrate semiconducting properties and show<br />
broad range of application in a variety of solid‐state devices. These resources, especially<br />
selenium glasses, demonstrate the distinctive property of reversible transformation [1], which<br />
turns these glasses into useful materials as optical memory devices. Chalcogenide glasses, like<br />
alloys of Se–Te system turn out to be materials of extensive commercial, scientific and<br />
technological value. These materials are broadly used for diverse applications in numerous<br />
fields such as optical recording due to their excellent sensitivity on laser writing, photography.<br />
They have a variety of electrographic applications such as photoreceptors in photocopying,<br />
laser printing, infrared spectroscopy, fibre optic techniques [2,3] etc. Amorphous Se–Te alloys<br />
have greater hardness, higher crystallization temperature, higher photosensitivity and smaller<br />
ageing effects than pure Se [4]. On the other hand doping in these glasses act as a role of<br />
chemical modifier, for example, by doping it is possible to expand the glass forming region,<br />
since it affects the compositional and configurational disorder [5]. The integration of a doping<br />
element like Zn to Se–Te binary system is expected to modify the optical and electrical<br />
properties of the mass alloy in device preparation. Zn is preferred for fine tune in chemical<br />
modification in the Se–Te system due to its important applications in photo‐doping in<br />
chalcogenide glasses [6]. Zinc Chalcogenides (ZnS, ZnSe ,ZnTe) belonging to the wide band gap
II‐VI system are the promising material for their application in several optoelectronic<br />
applications [7]. Bulk ZnSe is very essential material applicable as active medium in the blue<br />
range [8].<br />
Theoretically the structural, electronic, optical and dynamical properties for Zn chalcogenides<br />
have also been extensively studied [9–14]. An ab initio approach method was followed for the<br />
investigation of the lattice dynamics for ZnO [10]. Linear muffin tin orbital model [11] has been<br />
used for analysing the electronic structures of ZnX compounds. The empirical pseudopotential<br />
method has been exploited for the determination of band structure and of the density of states<br />
for ZnX binary compound [13].<br />
Comparatively less research has been devoted on the thermal properties study of<br />
chalcogenides. The objective of this paper is to employ the full‐potential linear‐augmented<br />
plane wave (FP‐LAPW) method within the application of the density functional theory (DFT)<br />
for the determination of structural, electronic, and thermal properties of ZnX materials. The<br />
exchange‐correlation energy (Exc) determination in Kohn–Sham calculation is performed with<br />
the standard local density approximation (LDA) method. Murnaghan’s equation of state (EOS)<br />
has been considered for volume optimization by minimizing the total energy with respect to the<br />
unit cell volume. Based on vibrational computation, phonon dispersion is dicussed and thermal<br />
properties has been elucidated.<br />
Computational details<br />
The structural, electronic and thermal properties of the compound ZnX have been studied in the<br />
frame work of the full potential linearized augmented plane wave plus local orbitals (FP‐<br />
LAPW+lo) with Wien2k code [15]. The generalized gradient approximation (GGA)<br />
parameterized by Perdew, Burke and Ernzerhof (PBE) [16] has been used. By optimization of<br />
the total energy with respect to the unit cell volume using Murnaghan’s equation of state [17],<br />
equilibrium structural parameters are estimated. The calculations were performed with RMTkmax<br />
= 7, to accomplish energy eigen value convergence, where RMT is the smallest radius of the<br />
muffin‐tin (MT) spheres and kmax is the maximum value of the wave vector. The maximum<br />
value of the angular momentum lmax is taken as 10 for the wave function expansion inside the<br />
atomic spheres. The k‐points used in the computational work are taken as 10×10×10 Monkhorst–<br />
Pack model [18] in the irreducible Brillouin zone (BZ) of the zinc‐blende structure. The iteration<br />
procedure is continued with total energy and charge convergence to 0.0001Ry and 0.001e ‐ ,<br />
respectively.<br />
Structural properties<br />
The zinc‐blende ZnX has a cubic symmetry as shown in Figure 1. The Zn atom is located at the<br />
origin and the X atom is located at (1/4, 1/4, 1/4). The space group is F‐43M. The ground‐state<br />
properties are obtained by minimization of the total energy with respect to the unit‐cell volume<br />
by fitting the results to the Murnaghan’s equation of state [17]:<br />
<br />
<br />
0<br />
B<br />
B0V V0/ V <br />
VoBo ETV 1 E0<br />
B <br />
0 B <br />
0 1 B <br />
0 1<br />
<br />
The minimization of the total energy with unit‐cell volume is shown in Figure 2.<br />
199
Figure 1. Crystal structure of the zinc‐blende ZnX (X = O, S, Se, Te). The violet ball is Zn atom and the<br />
green ball is X atom.<br />
Energy (Ry)<br />
Energy (Ry)<br />
Figure 2. Configuration energy with unit‐cell volume variation ZnX (X = O, S, Se, Te). For simulation<br />
Murnaghan’s equation of state has been considered. Different fitting parameters are shown in Table 1<br />
In Table 1, the results of bulk modulus B0, its pressure derivative B0ʹ and the equilibrium lattice<br />
constant a0, for the ZB structure of the binary ZnX at zero pressure is presented. The calculated<br />
lattice parameters are compared with other reported theoretical and experimental data. For<br />
ZnO, ZnS, ZnSe and ZnTe, the energy minimisation occurs for a = 4.612, 5.371, 5.632 and 6.198<br />
Å, which agree well with the experimental values of 4.620, 5.412, 5.667 and 6.103 Å, respectively<br />
with the maximal error of 1.56% with respect to experimental values. Hence well defined<br />
stucrural properties is sufficient for further study of electronic and thermal properties.<br />
200<br />
-4390.74<br />
-4390.75<br />
-3742.81<br />
-3742.82<br />
ZnS<br />
225 250 275 300<br />
ZnO<br />
150 175 200<br />
Volume ( a.u. 3 )<br />
-17186.08<br />
-17186.09<br />
-8452.78<br />
-8452.79<br />
-8452.80<br />
ZnTe<br />
350 375 400 425<br />
ZnSe<br />
275 300 325 350<br />
Volume ( a.u. 3 )
Table 1. Calculated bulk modulus B0 (GPa), its pressure derivative B0ʹ and lattice constant a0 (Å) of<br />
ZnX along with the available theoretical and experimental data.<br />
Compound Fitting Parameters Lattice Constant a0 (Å)<br />
B0(GPa) B0ʹ Present Others<br />
Exp. Theo.<br />
ZnO 141.37 5.12 4.612 4.620 [35] 4.614 [28]<br />
4.508 [29]<br />
4.504 [10]<br />
4.633 [30]<br />
ZnS 91.73 4.51 5.371 5.412 [35] 5.335 [31]<br />
5.352 [32]<br />
5.399 [11]<br />
5.451 [30]<br />
ZnSe 73.17 4.91 5.632 5.667 [36] 5.666 [11]<br />
5.618 [31]<br />
5.578 [33]<br />
5.666 [11]<br />
5.743 [30]<br />
ZnTe 57.39 4.78 6.198 6.103 [37] 6.174 [34]<br />
6.187 [30]<br />
6.019 [9]<br />
6.00 1 [13]<br />
6.195 [12]<br />
Electronic properties<br />
Figure 3 shows the calculated band structure at equilibrium for ZnS as a prototype since the band<br />
profiles are quit similar for all three compounds, with little differentiation. The overall bands are in<br />
quite good agreement with other theoretical results [19‐22]. The valence band maximum and<br />
conduction band minimum in each member of ZnX appears at the ( point. Thus the energy gap<br />
is direct between the top of the valence band and the bottom of conduction band at point. The<br />
X atom p bands shift up in energy starting from the sulphide to the telluride as a consequence<br />
of increase of the lattice parameters, as observed in other II–VI compounds too [23]. The detail<br />
of the band structure is presented in Table 2. The fact that the calculated band gap is<br />
underestimated in comparison with experiments results is due to the simple form of LDA<br />
which is not able to account the quasiparticle self energy [24]. In Figure 3, the density of states<br />
(DOS) for ZnO is shown. DOS in the other member of ZnX is very similar with small difference.<br />
Table 2: Different electronic energy band for ZnS, ZnSe and ZnTe in zinc‐blende structure.<br />
15v ‐ 1c 15v ‐ X1c 15v ‐ L1c L3v ‐ L1c<br />
ZnS Present 2.18 3.14 3.21 4.19<br />
Expt 3.8 4.1 4.4<br />
ZnSe Present 1.33 2.67 2.38 3.41<br />
Expt 2.82 4.3 3.7 4.7<br />
ZnTe Present 1.29 2.18 1.71 2.68<br />
Expt 2.39 3.3 3.1<br />
201
Figure 3. (Left): Electron energy band of ZnO. (Right): electron density of states of ZnO.<br />
Thermal properties<br />
Vibrational frequency is described with the dispersion relation = j(q) [25] where j is the<br />
branch index. Based on DFT, using linear response of phonon frequencies with atomic<br />
displacements matrix q [10] phonon dispersion spectrum is determined [26]. Figure 4 displays<br />
the phonon dispersion relation. The dispersion curve shows symmetry properties in q‐space<br />
subject to restriction in the first Brillouin zone. Unit cell of ZnX crystal having 2 atoms will<br />
contribute to six branches, three of acoustic and other three of optical brances. The phonon<br />
density of states (DOS) is also obtained from the phonon‐dispersion curves (Figure 5). The<br />
thermodynamic properties of ZnX can be obtained from the phonon spectrum.<br />
202<br />
Figure 4. Phonon frequencies of ZnO at zero pressure<br />
Figure 5. Phonon density of states of ZnO at zero pressure.
Entropy S as an extensive state function which describes the effects of irreversibility in<br />
thermodynamic systems has been estimated from the relation [27]:<br />
max<br />
<br />
<br />
S 3nNkB coth ln2sinh gd<br />
2kT 2 2<br />
0 B kT B kT B <br />
where n is the number of atoms per unit cell, N is the number of unit cells, kB is the Boltzmann<br />
constant, is the phonon frequency, max is the largest phonon frequency, T is temperature<br />
and g() is phonon density of states with normalization of <br />
ZnX at different temperature is shown in Figure 6.<br />
Conclusion<br />
s (J / mol-K)<br />
180<br />
160<br />
140<br />
120<br />
100<br />
80<br />
60<br />
40<br />
Figure 6. Entropy of ZnX at different temperatures<br />
<br />
max<br />
0<br />
g d<br />
1<br />
. Calculated entropy of<br />
The lattice dynamics and thermodynamic properties of ZnX (X = O, S, Se, Te) compound are<br />
determined by applying full‐potential linear‐augmented plane wave (FP‐LAPW) method within<br />
the frame work of the density functional theory. The standard local density approximation<br />
(LDA) is efficiently used for the exchange‐correlation energy estimation in Kohn–Sham<br />
computation. The calculated lattice parameters of ZnX compound are in good agreement with<br />
experimental results with accuracy of 1.56% error. Also at different phonon frequencies in the<br />
Brillouin zone, the phonon dispersion spectrum and phonon density of states are very<br />
comprehensive tools for the determination of thermal properties. The calculated entropy based<br />
on phonon dispersion finding is in very good agreement with experimental data.<br />
Acknowledgements<br />
ZnTe ZnSe<br />
500 1000 1500<br />
Temperature (K)<br />
2000 2500<br />
The first author (B. K. S.) is thankful to Galgotias University, Greater Noida, for its support and<br />
the fourth author (A. S. V.) acknowledges the assistance given by University Grant<br />
Commission, New Delhi, India, under the scheme of Dr. D. S. Kothari Post Doctoral Fellowship.<br />
ZnS<br />
ZnO<br />
203
References<br />
[1] TANAKA, K. Structural phase transitions in chalcogenide glasses. In Phys. Rev. B. 1989.<br />
39. 1270‐1279. ISSN: 1098‐0121<br />
[2] SHUKLA, S. and KUMAR, S. Effect of hydrostatic pressure on the structural, elastic and<br />
electronic properties of (B3) boron phosphide. In Pramana — J. Phys. <strong>2012</strong>. 78. 309–318.<br />
ISSN: 0304‐4289<br />
[3] OHTA, T. Phase‐change optical memory promotes the DVD optical disk. In J. Opto‐<br />
electron. Adv. Mater. 2001. 3. 609‐626. ISSN:1454‐4164<br />
[4] KASAP, S. O., WAGNER, T., AIYAH, V., KRYLOUK, O., BEKIROV, A., and TICHY, L.<br />
Amorphous chalcogenide Se1−x−y TexPy semiconducting alloys: thermal and mechanical<br />
properties. In J. Mater. Sci. 1999. 34. 3779‐3787. ISSN: 0022‐2461<br />
[5] AHMED, A., KHAN, S. A., KHAN, Z. H., ZULFEQUAR, M., SINHA K., HUSAIN, M.<br />
Differential scanning calorimetric study of Se80Te20−xCux chalcogenide glasses. In Physica B<br />
2006. 382, 92‐97. ISSN: 0921‐4526<br />
[6] LYUBIN, V., KLEBANOV, M., ARSH, A., FROUMIN N., KOLOBOV, A. V. Photoinduced<br />
diffusion of Zn in chalcogenide glassy films. In J. Non‐Cryst. Solids. 2003. 326–327. 189.<br />
ISSN: 0022‐3093<br />
[7] H. WENISCH, H., K SCHULL, K., D HOMANEL, D., G LANDEEHR, G., D SICHE D., H<br />
HARTMANN, H. Molecular beam epitaxial growth and characterization of ZnSe on (001)<br />
ZnSe substrates and its application in light‐emitting diodes. In Semiconductor Science<br />
Technology. 1996. 11. 107‐115. ISSN 0268‐1242<br />
[8] LI, H., JIE, W. Growth and characterizations of bulk ZnSe single crystal by chemical vapor<br />
transport. In J. Crystal Growth. 2003. 257. 110‐115. ISSN: 0022‐0248<br />
[9] AGRAWAL, BAL K., YADAV, P. S., AGRAWAL, S. Ab initio calculation of the electronic,<br />
structural, and dynamical properties of Zn‐based semiconductors. In Phys. Rev. B. 1994.<br />
50. 14881‐14887. ISSN: 1098‐0121.<br />
[10] SERRANO, J., ROMERO, A. H., MANJO´N, F. J., LAUCK, R., CARDONA, M., RUBIO, A.<br />
Pressure dependence of the lattice dynamics of ZnO: An ab initio approach. Phys. Rev. B.<br />
2004. 69. 094306‐094319. ISSN: 1098‐0121.<br />
[11] GANGADHARAN, R., JAYALAKSHMI, V., KALAISELVI, J., MOHAN, S., MURUGAN,<br />
R., PALANIVEL, B. Electronic and structural properties of zinc chalcogenides ZnX (X=S,<br />
Se, Te). J. Alloy. Compd. 2003. 359. 22‐26. ISSN: 0925‐8388<br />
[12] EL HAJ HASSAN, F., AKBARZADEH, H. First‐principles investigation of wide‐gap<br />
quaternary alloys Zn1−xMgxSyTe1−y. In J. Alloys Compd. 2007. 433. 306. ISSN: 0925‐8388<br />
[13] KHENATA, R., BOUHEMADOU, A., SAHOUN, M., RESHAK, ALI.H., BALTACHE, H.,<br />
RABAH, M. Elastic, electronic and optical properties of ZnS, ZnSe and ZnTe under<br />
pressure. In Comput. Mater. Sci. 2006. 38. 29‐38. ISSN: 0927‐0256.<br />
[14] CHARIFI, Z., BAAZIZ, H., RESHAK, ALI. H. Ab‐initio investigation of structural,<br />
electronic and optical properties for three phases of ZnO compound. In Phys. Status Solidi<br />
(b). 2007. 244. 3154–3167. ISSN: 1521‐3951<br />
[15] BLAHA, P., SCHWARZ, K., SORANTIN, P., RICKEY, S. B. Full‐potential, linearized<br />
augmented plane wave programs for crystalline systems. In Comput. Phys. Commun. 1990.<br />
59. 399. ISSN: 0010‐4655<br />
[16] PERDEW, J. P., BURKE, K., ERNZERHOF, M. Generalized Gradient Approximation<br />
Made Simple In Phys. Rev. Lett. 1996. 77. 3865‐3868. ISSN: 1098‐0121<br />
204
[17] MURNAGHAN, F. D. On the Theory of the Tension of an Elastic Cylinder. In Proc. Natl.<br />
Acad. Sci. USA. 1944. 30. 382‐384. ISSN: 0027‐8424<br />
[18] MONKHORST, H. J., PACK, J. D. Special points for Brillouin‐zone integrations. In Phys.<br />
Rev. B. 1976. 13. 5188‐5192. ISSN: 1098‐0121<br />
[19] ADACHI, S., TAGUCHI, T. Optical properties of ZnSe. In Phys. Rev. B. 1991. 43. 9569‐<br />
9577. ISSN: 1098‐0121<br />
[20] CHRISTENSEN, N. E., CHRISTENSEN, O. B. Electronic structure of ZnTe and CdTe<br />
under pressure. In Phys. Rev. B. 1986. 33. 4739‐4746. ISSN: 1098‐0121<br />
[21] GHAHRAMANI, E. D., MOSS, D. J., SIPE, J. E. Full‐band‐structure calculation of first‐,<br />
second‐, and third‐harmonic optical response coefficients of ZnSe, ZnTe, and CdTe. Phys.<br />
Rev. B. 1991. 43. 9700. ISSN: 1098‐0121<br />
[22] LEE, G.‐D., LEE, M. H., IHM, J. Role of d electrons in the zinc‐blende semiconductors ZnS,<br />
ZnSe, and ZnTe. In Phys. Rev. B. 1995. 52. 1459. ISSN: 1098‐0121<br />
[23] WEI, S.‐H. ZUNGER, A. Chemical trends in band offsets of Zn‐ and Mn‐based II‐VI<br />
superlattices: d‐level pinning and offset compression. Phys. Rev. B. 1996. 53. R10457‐<br />
R10460. ISSN: 1098‐0121<br />
[24] RASHKEEV, S. N., LAMBRECHT, W. R. L. Second‐harmonic generation of I‐III‐VI2<br />
chalcopyrite semiconductors: Effects of chemical substitutions. In Phys. Rev. B. 2001. 63.<br />
165212‐165223. ISSN: 1098‐0121<br />
[25] M.A. OMAR, Elementary Solid State Physics: Principles and Applications, Addison‐<br />
Wesley Publishing Company, Reading, Massachusetts, 1975.<br />
[26] DUAN, Y. H., PARLINSKI K. Density functional theory study of the structural, electronic,<br />
lattice dynamical, and thermodynamic properties of Li4SiO4 and its capability for CO2<br />
capture. Phys.Rev. B. 2011. 84. 104113‐104122. ISSN: 1098‐0121<br />
[27] MARADUDIN, A. A. et al., in: H.E. Ehrenreich (Ed.), Solid State Physics, second ed.<br />
Academic, New York, 1971 (Chapter 4).<br />
[28] JAFFE, J. E., HESS, A. C. Hartree‐Fock study of phase changes in ZnO at high pressure. In<br />
Phys. Rev. B 1993. 48. 7903‐7909. ISSN: 1098‐0121<br />
[29] JAFFE, J. E., SNYDER, J. A., LIN, Z., HESS, A. C. LDA and GGA calculations for high‐<br />
pressure phase transitions in ZnO and MgO. In Phys. Rev. B 2000. 62. 1660‐1665. ISSN:<br />
1098‐0121<br />
[30] KARAZHANOV, S. ZH., RAVINDRAN, P., KJEKSHUS, A., FJELLVAG, H., SVENSSON,<br />
B. G. Electronic structure and optical properties of ZnX (X=O, S, Se, Te): A density<br />
functional study. In Phys. Rev. B 2007. 75. 155104‐155117. ISSN: 1098‐0121<br />
[31] CASALI, R. A., CHRISTENSEN, N. E. Elastic constants and deformation potentials of ZnS<br />
and ZnSe under pressure. In Solid State Commun. 1998. 108. 793‐798. ISSN: 0038‐1098.<br />
[32] QTEISH, A. Self‐interaction‐corrected local density approximation pseudopotential<br />
calculations of the structural phase transformations of ZnO and ZnS under high pressure.<br />
J. Phys.: Condens. Matter 2000. 12. 5639‐5652. ISSN 0953‐8984.<br />
[33] OKOYE, C. M. I. First‐principles study of the electronic and optical properties of<br />
zincblende zinc selenide. In Physica B 2003. 337 1. ISSN: 0921‐4526.<br />
[34] CHRISTENSEN, N.E. CHRISTENSEN, O. B. Electronic structure of ZnTe and CdTe under<br />
pressure . Phys. Rev. B 1986. 33. 4739‐4746. ISSN: 1098‐0121<br />
[35] VES, S., SCHWARZ, U., CHRISTENSEN, N. E., SYASSEN, K., CARDONA, M. Cubic ZnS<br />
under pressure: Optical‐absorption edge, phase transition, and calculated equation of<br />
state. Phys. Rev. B 1990. 42. 9113‐9118. ISSN: 1098‐0121.<br />
205
[36] MAHON, M.I. MC., NELMES, R.J., ALLAN, D. R., BELMONTE, S. A.,<br />
BOVOMRATANARAKS, T. Observation of a Simple‐Cubic Phase of GaAs with a 16‐Atom<br />
Basis. In Phys. Rev. Lett. 1998. 80. 5564‐5567. ISSN: 0031‐9007<br />
[37] MADELUNG, O. (Ed.), Numerical Data and Functional Relationship in Science and<br />
Technology, Landolt Bo¨rnstein, New Series Group III, vol. 17, Springer‐Verlag, Berlin,<br />
1982.<br />
206
Application of fractals in condensed‐state processes<br />
Peter Šimon 1 , Oldřich Zmeškal 2 , Jaroslav Šesták 3<br />
1 Institute of Physical Chemistry and Chemical Physics, Faculty of Chemical and Food<br />
Tehnology, Slovak University of Technology, Radlinského 9, 812 37 Bratislava, Slovakia; e‐mail:<br />
peter.simon@stuba.sk<br />
2 Institute of Physical and Applied Chemistry, Faculty of Chemistry, Brno University of<br />
Technology, Purkyňova 118, 612 00 Brno, Czech Republic; e‐mail: zmeskal@fch.vutbr.cz<br />
3 New Technologies — Research Centre in the West Bohemian Region, West Bohemian<br />
University, Universitní 8, CZ‐30614 Pilsen, Czech Republic, e‐mail: sestak@fzu.cz<br />
Abstract: Heterogeneous condensed‐state processes take place at interfaces of different phases. In general,<br />
the surfaces are not perfectly flat and their properties are not homogeneous. They are mostly rough with<br />
many irregularities and inhomogeneities. Surface geometrical inhomogeneity is reflected in its chemical<br />
inhomogeneity. For the description of the structure of physical objects with inhomogeneous properties<br />
(roughness, mass density, heat density, etc.), the methods of fractal geometry can be applied [1]. In this<br />
paper, two phenomena will be analyzed, i.e. the heat capacity of fractal structures and the nucleation‐<br />
induced crystallization.<br />
Keywords: fractal geometry, heat capacity, nucleation‐induced crystallizaton<br />
1. Introduction<br />
Heterogeneous condensed‐state processes take place at interfaces of different phases. In general,<br />
the surfaces are not perfectly flat and their properties are not homogeneous. They are mostly<br />
rough with many irregularities and inhomogeneities. Surface geometrical inhomogeneity is<br />
reflected in its chemical inhomogeneity. For the description of the structure of physical objects<br />
with inhomogeneous properties (roughness, mass density, heat density, etc.), the methods of<br />
fractal geometry can be applied [1]. The word „fractal“ originates from the Latin word<br />
„fractus“, meaning broken. It is indicated that fractals are widespread and that the fractal<br />
geometry is the geometry of Nature [2]. Classical geometry provides a first approximation to<br />
the structure of physical objects; it is the language that we use to communicate the designs of<br />
technological products and, very approximately, the forms of natural creations. Fractal<br />
geometry is an extension of classical geometry. It can be used to make precise models of<br />
physical structures of rough surfaces, disordered layers on surfaces and porous objects (such as<br />
heterogeneous catalysts). Furthermore, gels, soot and smoke, and most macromolecules are also<br />
fractals [3].<br />
Father of the fractal geometry is Benoît Mandelbrot [4]. He described geometric fractals as ʺa<br />
rough or fragmented geometric shape that can be split into parts, each of which is (at least<br />
approximately) a reduced‐size copy of the wholeʺ. Fractals are self‐similar objects that exhibit<br />
dilatational symmetry. Fractals have details on all scales; therefore Euclidean geometry and<br />
classical calculus are insufficient for their description and the fractal geometry is required.<br />
Fractals are disordered systems; the disorder is described by generally non‐integer dimensions<br />
[3]. As long as surface irregularities show scale invariance ‐ that is, dilatational symmetry ‐ they<br />
can be characterized by a single number, the fractal dimension. This means that the surface<br />
exhibits self‐similarity over certain length scales. In other words, the structure exhibited at the<br />
207
scale of the basic building blocks is reproduced at the level of larger and larger conglomerates.<br />
Note that self‐similarity implies that the features of a structure look alike at different scales of<br />
length or time. This self‐similarity of a process at different scales of time can be characterized<br />
with a fractal dimension: A higher value of the fractal dimension indicates a higher level of<br />
heterogeneity or state of disorder.<br />
Fractals possess non‐trivial geometrical properties; in other words, they are geometrical<br />
structures with non‐integer dimensions. A consequence of the fractal nature is a power‐law<br />
dependence of a correlation function (rate constant, number of entities) on a coordinate (for<br />
example, time or scale). The repeating shape or form does not have to be identical [3].<br />
In this chapter, two illustrative examples of application of the fractal geometry on condensed‐<br />
state problems are demonstrated.<br />
2. Heat capacity of fractal structures<br />
Within the fractal theory, the number of objects, N(r), in the circumscribed area with the radius r<br />
can be given as<br />
208<br />
N <br />
D<br />
( r)<br />
K r<br />
(1)<br />
where K is the fractal measure and D stands for the fractal dimension.<br />
Applying the equipartition theorem [5] heat capacity C of a solid mass fractal structure<br />
embedded in E‐dimensional Euclidean space can be expressed as<br />
dU<br />
D<br />
C() r EkBN() r EkBKr (2)<br />
dT<br />
Here, U is the internal energy and T is temperature. In Eq. (2) it is taken into account that each<br />
object in the E‐dimensional solid matrix possesses E vibrational degrees of freedom.<br />
Heat capacity of solids is mostly normalized as<br />
1dU<br />
CV<br />
(3)<br />
m dT<br />
where m is the sample mass. If the fractal structure is composed of Nm(r) objects (atoms) with<br />
the average atomic mass u, the sample mass can be expressed as<br />
mr ( ) uN( r) uKr Dm<br />
m m<br />
(4)<br />
where K means the fractal measure of the mass distribution in the solid with fractal structure<br />
and Dm is the fractal dimension characterizing the mass distribution.<br />
Combining Eqs. (2) ‐ (4), one can get<br />
Ek K<br />
<br />
B DD CVr uKm<br />
m<br />
,<br />
When multiplying both the numerator and denominator of Eq.(5) with the Avogadro constant,<br />
we obtain<br />
nERK<br />
CVr MK<br />
DDm (6)<br />
m<br />
(5)
where R is the gas constant, M is the molar mass of the solid under consideration and n is the<br />
number of atoms in a molecule.<br />
It has been derived that the distribution of temperature in the fractal structure embedded in E‐<br />
dimensional space is given as [6‐8]<br />
DE2 Kc r<br />
Tr () <br />
k D( DE2) B<br />
where h /(2 )<br />
Combination of Eqs. (6) and (7) yields:<br />
nERK RT<br />
<br />
CV D( DE2) <br />
MKm KNAc DDm DE2 where NA is the Avogadro constant. The continuous fractal structure has the fractal dimension<br />
between 1 and 3 and is embedded in three‐dimensional space (E=3). Taking this into account,<br />
Eq.(8) can be simplified as:<br />
3nRK<br />
RT <br />
CV D( D1)<br />
<br />
MKm KNAc DD D1<br />
m<br />
Under the assumption that the distribution of internal energy and the distribution of mass have<br />
the same fractal dimension (D=Dm), Eq.(9) takes the form<br />
3nRK<br />
(10)<br />
CV MKm<br />
If the distribution of internal energy and the one of mass are identical (D=Dm and K=Km), Eq.(11)<br />
reduces to the form expected from the equipartition theorem for high temperatures:<br />
3nR<br />
CV<br />
(11)<br />
M<br />
However, the condition of identical distributions of the internal energy and the mass may not<br />
necessarily be allways fulfilled.<br />
The dependence of heat capacity of fractal objects on temperature, given by Eq.(11), differs from<br />
the dependences derived by Einstein or Debye. The Einstein model was derived under the<br />
assumption that each atom in a perfect crystal oscillates around its equilibrium position with a<br />
single frequency. Debye amended the model taking into account that the atoms in fact oscillate<br />
over a range of frequencies from zero up to a maximum value [5]. When deriving Eq. (9), fractal<br />
structure of the sample instead of perfectly regular crystalline matrix has been assumed.<br />
3. Nucleation‐induced crystallization<br />
Kinetics of condensed‐phase processes is very often described by the generalized kinetic<br />
equation<br />
d<br />
kT f (12)<br />
dt<br />
(7)<br />
(8)<br />
(9)<br />
209
where t is time and α is the degrese of conversion (or simply conversion). The functions k(T)<br />
and f(α) are the temperature and conversion functions and should be separable [9‐11]. This<br />
paragraph deals with the temperature and conversion functions in the process of nucleation‐<br />
induced crystallization and represents a modification of the approach used by Ozao and Ochiai<br />
[12].<br />
The basic concept of the kinetics of nucleation‐induced crystallization processes was<br />
established by Avrami [13‐15]. His model takes into account the interconnection of the growing<br />
grains. The assumptions adopted are: (i) Nucleation occurs randomly and homogeneously over<br />
the entire untransformed portion of the material; (ii) The growth rate does not depend on the<br />
extent of transformation. (iii) Growth occurs at the same rate in all directions. Hence, the<br />
constant rate of nucleation can be expressed as<br />
dn<br />
kn<br />
(13)<br />
dt<br />
where n stands for the number of grains. Volume of one grain with the fractal structure, V1, is<br />
210<br />
<br />
D<br />
1 1<br />
D<br />
V Kr K vt<br />
(14)<br />
Here, K is the volume conversion factor, r is the (effective) radius of the grains and v1 is the<br />
growth rate of grains. First, the growth of grains without their interconnection will be<br />
considered. Volume of the transformed matter, V, can be obtained as<br />
t t D<br />
dn<br />
D D kKv n 1 D+1<br />
1d n 1 d<br />
dt D1<br />
0 0<br />
(15)<br />
V V t k Kv t t t<br />
The degree of conversion is defined as the ratio of the volume transformed to the total volume,<br />
Vo. From Eq. (15) then follows:<br />
kKv<br />
w <br />
V D<br />
o<br />
D<br />
n 1<br />
1<br />
t<br />
D+1<br />
From Eq. (16) one can get<br />
1<br />
D+1<br />
o 1<br />
1<br />
D+1<br />
<br />
D<br />
w<br />
kKv n 1<br />
V D <br />
t <br />
<br />
Differentiation of Eq.(16) gives<br />
d<br />
dt<br />
V<br />
D<br />
w kKv n 1 D<br />
(18)<br />
o<br />
t<br />
Combination of Eqs. (17) and (18) leads to the result<br />
1<br />
D<br />
D1<br />
w kKv n 1<br />
D D<br />
D1<br />
D1 w<br />
o<br />
d<br />
dt<br />
V <br />
If the grains grow sufficiently large as to interconnect one another, only a fraction of αw is real;<br />
some portion of it lies on previously transformed material and is virtual. Since nucleation<br />
(16)<br />
(17)<br />
(19)
occurs at random, the fraction of overlapped volume should be proportional to the<br />
untransformed volume fraction 1‐ α. Hence, the actual degree of conversion, α, is related to αw<br />
by the relationship [12‐16]<br />
w<br />
d 1 d<br />
(20)<br />
After separation of variables and integration, from Eq. (20) it can be obtained:<br />
w<br />
<br />
ln 1<br />
<br />
(21)<br />
From Eq. (21) further follows:<br />
d<br />
dw<br />
1 (22)<br />
dt dt<br />
Combining Eqs. (19), (21) and (22), one gets<br />
1<br />
D1<br />
D D<br />
D1<br />
D<br />
d<br />
kKv <br />
n 1 D1 1ln1 dt<br />
V<br />
<br />
o <br />
The fractal dimension of the grains can be 1 < D < 3.<br />
Comparing Eqs. (12) and (23), it is obvious that the temperature function is a composite of<br />
several quantities:<br />
1<br />
D<br />
D1<br />
kKv D <br />
<br />
Vo<br />
<br />
n 1<br />
1<br />
k T D<br />
The conversion function is<br />
D D<br />
1<br />
<br />
f 1 ln 1 (25)<br />
Integration of Eq.(23) for a constant temperature leads to an Avrami‐like equation:<br />
D1<br />
<br />
kt <br />
1exp <br />
D1 <br />
Main diference with the Avrami derivation is that it is assumed here that the growth of grains<br />
may cease at any moment in any direction, not only by impinging on another growing grain. In<br />
this way the fomation of grains with fractal geometry from the very first moment of<br />
crystallization is admitted, not just the formation of spherical particles.<br />
When deriving Eq.(23), it was implicitely assumed that the process was isothermal. For non‐<br />
isothermal processes, kn and v1 obviously depend on temperature [17]. The dependence of k(T)<br />
on temperature is almost exclusively approximated by the Arrhenius function. In the case of<br />
crystal growth, it would be perhaps advisable to employ the equation by Harecourt and Esson<br />
[18]<br />
m<br />
kT AT<br />
(27)<br />
where A and m are kinetic parameters. The form of temperature power exponent in Eq.(27)<br />
indicates that the fractal nature of matter is taken into account.<br />
(23)<br />
(24)<br />
(26)<br />
211
4. Conclusions<br />
The two case studies shown above are just illustration of the application of fractal geometry.<br />
This chapter has no aspiration to present a complete picture on the subject. For example, Google<br />
provides 99900 responses to the keywords „fractal heat capacity“ and 167000 responses to the<br />
keywords „fractal crystallization“. Brownian motion has also the fractal character [19].<br />
Applications of fractals for the problems of adsorption, permeability, aggregation and growth,<br />
diffusion and reactions, spectroscopy, chemical degradation and other topics are summarized in<br />
the monography by Rotschild [20]. Fractal Approach to Heterogeneous Chemistry is reviewed<br />
in [21].<br />
However, a reaction medium does not have to be a geometrical fractal in order to exhibit fractal<br />
kinetics [22]. Classical reaction kinetics has been found unsatisfactory when the reactants are<br />
spatially constrained on the microscopic level by either walls, phase boundaries or force fields.<br />
Among the examples of fractal‐like kinetics are chemical reactions in the pores of membranes,<br />
charge recombination in the colloids and clouds, reactions catalyzed by catalytic islands on<br />
noncatalytic supports, etc. When applying classical reaction kinetics to the processes mentioned,<br />
anomalously large values of the reaction order can be found (from 3 to 75). The rate constant<br />
may depend on time, where the dependence is power‐law one [22].<br />
This contribution is a shortened version of chapter 12 from the book „Thermal analysis of<br />
micro‐, nano‐ and non‐crystalline materials“, edited by. J. Šesták and P. Šimon [23]. The book<br />
will appear this year.<br />
References<br />
[1] ŠESTÁK, J Science of Heat and Thermophysical Studies: a generalized approach to<br />
thermal analysis. Elsevier, Amsterdam, 2005, ISBN: 978‐0‐444‐51954‐2.<br />
[2] BARNSLEY, M.F. Fractals everywhere. Academic Press, 1993. ISBN 978‐0‐12‐079069‐2.<br />
[3] SADANA, A. Engineering Biosensors ‐ Kinetics and Design Applications. Academic Press,<br />
2002. ISBN 0‐12‐613763‐3.<br />
[4] MANDELBROT, B. The fractal geometry of nature. Macmillan, 1983, ISBN 978‐0‐7167‐1186‐5.<br />
[5] ATKINS, P.W. Physical Chemistry. Oxford Univ. Press, Oxford 1998, ISBN 0 19 850102 1.<br />
[6] ZMESKAL, O.‐ NEZADAL, M. ‐ BUCHNICEK M. Chaos, Solitons and Fractals 19 (2004)<br />
1013–1022: Field and potential of fractal–Cantorian structures and El Naschie‘s E‐ infinite<br />
theory,.<br />
[7] ZMESKAL, O. – BUCHNICEK, M., ‐ VALA, M. Chaos, Solitons and Fractals 25 (2005) 941–<br />
954.: Thermal properties of bodies in fractal and cantorian physics<br />
[8] ZMESKAL, O. – VALA, M.‐ WEITER, M.‐ STEFKOVA, P. Chaos, Solitons and Fractals 42<br />
(2009) 1878–1892: Fractal‐cantorian geometry of space‐time,.<br />
[9] ŠESTÁK, J.‐ KRATOCHVIL, J. Journal of Thermal Analysis and Calorimetry. 5 (1973) 193‐<br />
201: Rational approach to thermodynamic processes and constitutive equation..<br />
[10] ŠIMON, P. Journal of Thermal Analysis and Calorimetry 82 (2005) 651‐657: Considerations on<br />
the single‐step kinetics approximation.<br />
[11] ŠIMON, P. Journal of Thermal Analysis and Calorimetry 88 (2007) 709‐715: The single‐step<br />
approximation: Attributes, strong and weak sides.<br />
[12] OZAO, R. – OCHIAI, M., Journal of Thermal Analysis, 40 (1993) 1331‐1340: Fractal nature<br />
and thermal analysis of powders.<br />
212
[13] AVRAMI, M Journal of Chemical Physics 7 (1939) 1103–1112: Kinetics of Phase Change. I.<br />
General Theory.<br />
[14] AVRAMI, M Journal of Chemical Physics 8 (1940) 212–224: Kinetics of Phase Change. II.<br />
Transformation‐Time Relations for Random Distribution of Nuclei.<br />
[15] AVRAMI, M Journal of Chemical Physics 9 (1941) 177–184: Kinetics of Phase Change. III.<br />
Granulation, Phase Change, and Microstructure..<br />
[16] JENA, A.K. – CHATURVEDI, M.C. Phase Transformations in Materials. Prentice Hall, 1992,<br />
ISBN 0136630553.<br />
[17] KEMENY, T.‐ ŠESTÁK, J. Thermochimica Acta 110 (1987) 113‐129: Comparison of<br />
crystallization kinetics determined by isothermal and nonisothermal evaluation methods.<br />
[18] FLYNN, J.H. Thermochimica Acta 300 (1997) 83‐92: The „Temperature integral“ – its use<br />
and abuse.<br />
[19] KAYE, B.H. A random walk through fractal dimensions. VCH, Weinheim, 1994. ISBN 3‐527‐<br />
29078‐8.<br />
[20] ROTHSCHILD, W.G. Fractals in chemistry. John Wiley & Sons, 1998. ISBN 0‐471‐17968‐X.<br />
[21] AVNIR, D. Fractal Approach to Heterogeneous Chemistry. Wiley, New York, 1989.<br />
[22] KOPELMAN, R. Science 241 (1988) 1620‐1626: Fractal Reaction Kinetics.<br />
[23] ŠIMON, P.‐ ZMEŠKAL, O.‐ ŠESTÁK, J. Fractals in solid state processes. Chapter 12 in:<br />
Thermal analysis of micro‐, nano‐ and non‐crystalline materials, Eds. Šesták J, Šimon P,<br />
Springer Verlag, <strong>2012</strong>, in press.<br />
213
214<br />
Identification of thermal characteristics of a high‐temperature<br />
thermal accumulator<br />
Stanislav Šťastník, Jiří Vala<br />
Faculty of Civil Engineering, Brno University of Technology,<br />
Veveří 95, CZ‐602 00 Brno, Czech Republic,<br />
email: stastnik.s@fce.vutbr.cz, vala.j@fce.vutbr.cz<br />
Abstract: Advanced high‐temperature thermal accumulators are designed for the temperature ranges<br />
close to 900°C. Under such conditions, respecting the cyclic character of temperature loads, the high<br />
thermal accumulation ability of an applied material is required. The experimental identification of<br />
thermal characteristics of such materials forces the development of non‐standard experimental<br />
approaches. Namely, it can be done using the original measurement equipment, introduced in this paper,<br />
supported by certain non‐trivial computational tool.<br />
Keywords :Identification of thermal characteristics, high‐temperature thermal accumulators.<br />
Introduction<br />
Solar energy has a large potential for heating and cooling of buildings, preparation of warm<br />
water in households, growing of plants, etc. However, such energy source is discontinuous and<br />
poorly expectable and its exploitation is limited by the daylight. Its use needs effective storage<br />
of thermal energy, to save the superfluous heat for the night hours. Similar difficulties occur in<br />
systems with heat recuperation where the use of the waste heat is conditioned by its reasonable<br />
accumulation.<br />
The project of a thermal accumulator, whose technical solution is the subject of the project of<br />
Technological Agency of the Czech Republic (see Acknowledgement), solved at the Faculty of<br />
Civil Engineering of the Brno University of Technology (FCE BUT), assumes the temperature of<br />
working medium up to 900°C. According to the applied physical and chemical principle, the<br />
accumulation of the thermal energy can be performed i) as the accumulation of sensitive heat,<br />
ii) as the accumulation of latent heat, iii) as the absorption of water vapour, iv) by other<br />
processes. The substantial disadvantage of i) is the need of a great amount of medium,<br />
especially in the case of the small range of working temperature. Similarly, the enthalpy of the<br />
phase change of the working medium is exploited in the case ii). Three types of phase changes<br />
are possible in chemically pure media: melting / solidification, vaporization / condensation,<br />
sublimation / re‐sublimation. In accordance with iii), to store much vapour, some large<br />
equipment, resistant to high pressure loads, would be necessary; thus only the solid‐liquid<br />
phase transition has been implemented in practice. Especially such media, whose melting point<br />
is close to the required temperature, are used. In addition to chemically pure ones, as<br />
NaSO4.10H2O (with the enthalpy 243 kJ/kg at the melting temperature about 30°C), various<br />
mixtures are used, e.g. the paraffin‐based, where the needed phase change temperature can be<br />
better optimized, although the melting temperature range is much wider.<br />
The optimal design of such advanced thermal accumulator, working at high temperatures,<br />
cannot be based on standard considerations, reducing heat transfer phenomena to the (quasi‐<br />
)linear heat conduction; e.g. the radiation heat transfer is substantial here, moreover the<br />
assessment of additional physical and chemical processes is not allowed to be neglected at all.
However, in this paper we shall pay attention to the reliable setting of the basic temperature‐<br />
dependent heat conduction characteristics, namely of the volumetric heat capacity and of the<br />
thermal conductivity, at the elevated temperature. Unlike standard experimental and<br />
computational approaches, related to the (quasi‐)stationary insulation ability of building<br />
claddings, emphasizing the thermal conductivity, the identification of the heat capacity is the<br />
most important for thermal accumulation equipments; these requirements force substantial<br />
modifications of usual approaches due to technical standards, such as hot‐ball, hot‐plate or hot‐<br />
wire approach. We shall demonstrate that an appropriate approach, based on the hot‐wire<br />
experiments, supported by the effective computational algorithm, combining the least squares<br />
approach with the results from the theory of Bessel functions, is available.<br />
Experimental and computational approach<br />
For simplicity, let us consider both the geometrical and the physical arrangement of the hot‐<br />
wire experiment by the European standard [5], compatible with [2], p. 105; this approach (with<br />
special materials for a measurement device, resistant to high temperatures and aggressive<br />
environment) can be applied just under hard conditions, including fire simulations, fire clay<br />
production, etc. – cf. [10]. However, the usual approach, based on the one‐dimensional<br />
reduction due to the assumed (macroscopic) material homogeneity and isotropy, as well as to<br />
the geometrical radial symmetry, leading to the simplified formulation of heat conduction in<br />
polar coordinates, presented e.g. in [4], p. 265, refers to fundamental solutions that can be<br />
derived from the very classical list of solutions of Fourier equations of [1], although with certain<br />
tricky boundary conditions (in the limit sense), avoiding the use of Dirac measures (present in<br />
original mathematical formulations).<br />
The mathematical and computational background of this approach has been analyzed in [9] in<br />
more details. Searching for the distribution of temperature T( r, t ) where r denotes the distance<br />
from the origin where the heating wire is active and t means the time, starting from some<br />
appropriate value t 0 0;<br />
the corresponding temperature is assumed to be T0 everywhere. Let<br />
us reserve prime symbols for the partial derivatives with respect to r and dot symbols for those<br />
with respect to t .The initial and boundary conditions then are<br />
T<br />
lim( ) 0 lim 0<br />
Q(2 r)<br />
Trt ( 0)<br />
0,<br />
T T0<br />
r r0<br />
where Q , following [5] represents the electric energy input, related to the length unit of a hot<br />
wire; they are applied to the Fourier equation, rewritten in polar coordinates,<br />
rT ( rT ) ,<br />
containing two (a priori unknown) material characteristics: the volumetric heat capacity and<br />
the thermal conductivity . The announced general solution can be consequently found for any<br />
time t t0in the form<br />
where<br />
Trt ( ) T T( rt )dt<br />
0<br />
t<br />
t0<br />
<br />
215
216<br />
Q <br />
1<br />
T( rt) : exp( )d<br />
2<br />
4<br />
u u u<br />
<br />
2<br />
1 <br />
and lim ln<br />
2 4 (<br />
0)<br />
<br />
<br />
1<br />
<br />
n<br />
r r<br />
u Cen t<br />
t t k k<br />
057721566490153286060651209008240243104215933593992…. Using the well‐known notation of the elliptic integral<br />
2 2 2 3 4 2<br />
<br />
2 Q<br />
2 ( ) ( ) ( )<br />
T( rt) Ei( ) Celn( ) …<br />
,<br />
4 22 33 44 <br />
neglecting the third, fourth, etc. additive terms in the brackets, we are allowed to conclude<br />
Q t Q t<br />
T T0 ln … ln<br />
4 t 4 ( T T ) t<br />
0 0 0<br />
which is just the basic formula from [5], followed by standards least squares considerations.<br />
Nevertheless, we are interested more in the constant value (at least in some sufficiently small<br />
temperature range) than in that of . One could expect that the incorporation of higher<br />
terms from the decomposition of the elliptic integral will be helpful to obtain / , consequently<br />
also , but this may be disturbed substantially by the random errors of discrete measurements<br />
of T<br />
The natural remedy is to rewrite the Fourier equation in the variational form<br />
( vrT) ( v( rT )) ( vrg )<br />
with admissible abstract test functions (in more mathematical details: elements of the Bochner<br />
space of mappings of some finite time interval to the Sobolev spaces of square‐integrable<br />
functions, including their first derivatives) where<br />
Qr <br />
g : <br />
0 for r a<br />
,<br />
2<br />
( ) for0 ,<br />
taking into account the finite wire radius , as well as the outer sample radius a ; the couples<br />
in brackets are scalar products in the Lebesgue space of square integrable functions on the<br />
interval from 0 to r ; the same notation with the index 0 is introduced for the interval from 0 to<br />
and with the index 1 for the interval from to r . Since and are known from 0 to and<br />
have to be identified otherwise, it is natural to use the same indices for their values, too.<br />
The stationary solution of the Fourier equation, i.e. of that where T is neglected, can be<br />
obtained, using the classical differential calculus, as<br />
Qa Q r r <br />
Ts() r <br />
Q(2 1)ln( ar) for r a<br />
,<br />
2<br />
(2 1)ln( ) (4 0)(1 ( ) ) for 0 ,<br />
2 2<br />
Qr (2 0 ) for 0 r, rTs () r <br />
Q(2 1) for ra ,<br />
,
2<br />
1 Q(2 0 ) for 0 r ,<br />
r ( rTs( r))<br />
<br />
0 for r a .<br />
Applying the general Fourier method, we have<br />
with<br />
<br />
Trt ( ) T( r) ( rt ) ( xt ) <br />
( r) ( t )<br />
s i i<br />
i1<br />
qrt ( ) ( rT ) (<br />
rt ) ,<br />
( vr ) ( vr ) ( v( r)) ( v( r ))<br />
0<br />
,<br />
0 0 1 1 0 0 1 1<br />
( v( rT )) ( v( rT )) Q( )( vr ) .<br />
2<br />
0 s 0 1 s 1 0<br />
The corresponding initial and boundary conditions are<br />
Tr ( 0) T<br />
,<br />
0<br />
T(0 t) 0 T( 0) T( 0) T( a 0) 0,<br />
( r0) T Ts( r ) ,<br />
0<br />
0 1 <br />
(0 t) 0 ( 0) ( 0) (<br />
a 0) 0,<br />
0 1 <br />
T (0 t) 0 T ( ) T ( ) T ( a) T<br />
s 0 s 1 s <br />
s 0<br />
where the indices + and – refer to the right and left limits in the points of (at least potential)<br />
discontinuities.<br />
Let us notice that the Bessel functions<br />
1 <br />
Jn( r) cos( sin )d <br />
{012 },<br />
r n n …<br />
0<br />
studied in [6] and [7] in more details, have, from our point of view, very useful properties<br />
J () r J () r J () r J () r J () r r<br />
,<br />
0 1 1 0 1<br />
r ( rJ ( r)) r ( rJ ( r)) J<br />
( r) r J ( r) J<br />
( r ) ,<br />
1 1 1<br />
0 1 1 1 0<br />
r ( rJ ( r)) J ( r ) 0 ,<br />
1 0 0 <br />
<br />
r ( rJ ( r)) J ( r)<br />
0<br />
,<br />
1 2<br />
0 0<br />
for every positive , thus we can choose<br />
iJ0( i ir)<br />
for0 r ,<br />
i<br />
() r <br />
J0( ir ) for<br />
r a<br />
where<br />
: : , : : : 0 0 0 1 1 1 1 0 1 0 1 0<br />
217
and the equation<br />
218<br />
0 ( ) 0<br />
J ia<br />
<br />
defines all particular values of i (e.g. from Newton iterations).<br />
Some boundary conditions are then satisfied automatically, namely<br />
(0) 0 ( a ) 0.<br />
i i<br />
The remaining ones<br />
( ) ( ) ( ) ( ) (<br />
) ( )<br />
i i i i <br />
have to be obtained for special ii J ( ) J ( ) ,<br />
i 0 i i 0 i<br />
J ( ) ( ) J ( )<br />
i i 1 i i 1 i <br />
in the form<br />
J ( ) J<br />
( )<br />
,<br />
i 0 i 0 i i<br />
( ) J ( ) J ( ) .<br />
i 1 i 0 i <br />
This leads again, using the notation<br />
0 F( i): iJ1( i i ) iJ0(<br />
i i ) ,<br />
F( ) ( J ( ) J<br />
( )<br />
,<br />
i i i 0 i i i 1 i i<br />
to the Newton iterations for separate parameters<br />
F( ) F<br />
(<br />
) .<br />
i i i i<br />
<br />
from the couple of equations<br />
The application of the Green‐Ostrogradskii theorem gives<br />
( vr ) ( vr ) <br />
( v( r )) ( v( r )) 0<br />
,<br />
<br />
i 0 i 1 i 0 i 0 i 1<br />
i<br />
( vr ) ( vr ) <br />
( vr ) ( vr ) 0<br />
,<br />
<br />
2 2<br />
<br />
i 0 i 1 i 0 i 0 1<br />
i i i i<br />
in particular for v j moreover<br />
<br />
( vr ) ( vr ) <br />
( vr ) ( vr ) ( v( ) ( ) v(<br />
( ) 0<br />
;<br />
<br />
i 0 i 1 i 0 i 0 i 1 i 0 i i <br />
this guarantees certain quasi‐orthogonality<br />
( r ) ( r ) ( r ) ( r<br />
) ,<br />
2 2<br />
<br />
j i 0 j i 1 i 0 <br />
1<br />
i j i j i <br />
( ) ( r ) ( )( r ) 0<br />
2 2 2 2 2 2<br />
i j i j 0 i i j j i j 1<br />
2 2<br />
with i j .<br />
It remains to determine all i . This can be done from the eigenproblem
M K 0<br />
ji i ji i<br />
where<br />
2<br />
M : ( ) 0 ( ) 1 , : 0 <br />
( ) 0 ( ) 1)<br />
<br />
ji j r i j r i K ji i j r i j r i ,<br />
thus we have to search for unknown constant parameters Cp from<br />
V exp( t) C ;<br />
i ip p p<br />
here p is considered as the Einstein summation index. The matrix form of the resulting equation<br />
then is<br />
( MV KV)exp( t) C 0 MV KV .<br />
The MAPLE results for the effective MATLAB evaluations are for ij D<br />
ji<br />
J ( ) J ( ) <br />
(1 ) det ,<br />
<br />
0 j j 1 j <br />
J0( i ) iJ1( j )<br />
<br />
1 1 <br />
M ji Dji ,<br />
2 2 2 2 2 2 <br />
j j i i j i <br />
2<br />
2<br />
1 <br />
i<br />
ji 0 i ji <br />
2 2 2 2 2 2 <br />
<br />
j j i i j i<br />
K D<br />
,<br />
<br />
2 M a J ( a ) (1 ) J ( ) ( 1) J ( ),<br />
2 2 2 2 2 2 2<br />
ii 1 i 0 i i 0 i <br />
ii<br />
2<br />
0i 2 2<br />
1 i 2<br />
2<br />
i 2<br />
0 i 2<br />
<br />
2<br />
0 i <br />
2 K [ a J ( a ) ( ) J ( ) ( 1) J ( )].<br />
The constants Cp can be then received from one linear algebraic system of the form<br />
( vrT ( T)) ( vrT ( T)) ( vr ) ( vr ) VC ,<br />
<br />
0 s 0 0 s 1 i 0 i 1<br />
ip p<br />
in particular<br />
F0 F1 MVC<br />
where<br />
F0 j : j( jj)[( 0 1)<br />
J1(<br />
j j )<br />
2<br />
2 0( i i) J2( j j ) 0J3(<br />
j j )]<br />
0 : Q(2 0) 1: Q(2 0) 1:<br />
1ln( a)<br />
F : (ln( ar) rJ ( r))<br />
1j 1 0 j<br />
for v j , i.e.<br />
1<br />
C ( MV) ( F0 F<br />
1)<br />
.<br />
219
Let us notice that all terms except F1 j are analytic; for this case MAPLE generates Lommel<br />
integrals, whose direct evaluation has not been available in the MATLAB implementation.<br />
The last step of the derivation of the algorithm of identification of <br />
(thus also 1 1<br />
because 0 0<br />
are known in advance) is to make use of a integer finite number m<br />
measurements in the discrete time steps S { t1t2…t m}<br />
, i.e. T() t for tS from sensors<br />
located at the position r .Then we can follow the least squares approach by [9]: with the<br />
MATLAB support we are able to find a minimum of the function of 2 variables<br />
( ) <br />
2<br />
[ T( t)<br />
T<br />
( t )]<br />
220<br />
<br />
tS over a set of all technically admissible values of <br />
; the overview of various alternative<br />
approaches can be found in [3].<br />
Illustrative example<br />
As mentioned in Introduction, for high‐temperature accumulators all hot‐wire measurements<br />
need rather expensive special materials. The illustrative example documents the development<br />
of the experimental and computational identification procedure at the room temperature.<br />
Figure 1 shows the measurement device in the Laboratory of Building Physics of FCE BUT.<br />
Figure 1: Experimental setting of the hot‐wire measurement, compatible with [5].
Figure 2: Results of numerical simulation: distribution of<br />
T( r, t)<br />
for selected tS and first 8 Bessel<br />
functions (upper part);test of the robustness of the least squares iteration procedure (lower part).<br />
The uncertainty of identification of is a serious problem, whose physical, experimental<br />
and computational aspects cannot be analysed in this paper properly. The upper part of Figure<br />
2 shows the simulation results for the optimized <br />
; the visible oscillations for small times<br />
(expected in [5], too) have been caused by the time discontinuity of g and a low finite number<br />
of applied Bessel functions. The lower part of Figure 2 documents the robustness of the<br />
221
computational approach: the upper curve refers to the first (very rough) estimate of <br />
, the<br />
remaining curves refer to particular iterations. However, the dots obtained from real<br />
measurements are rather far from such optimized curve, which generates large values of<br />
standard deviations; this seems to be a motivation for the optimal arrangement of experiments.<br />
Conclusions<br />
The presented approach demonstrates the possibility of identification of both heat capacity and<br />
thermal conductivity from the simple hot‐wire measurements even under hard conditions,<br />
needed (as one partial task) for the design of the high‐temperature thermal accumulator.<br />
However, the practical example incites still other questions: i) howto organize experiments to<br />
reduce differences between measured and simulated temperatures, ii) how to prepare the best<br />
experimental conditions where all other processes except heat conduction, following the Fourier<br />
law, can be really neglected.<br />
Acknowledgement.<br />
This research has been supported by the project of specific university research of BUT, No.<br />
FAST‐S‐12‐25/1660, and by the Technological Agency of the Czech Republic, No. TA02021231.<br />
References<br />
[1] CARSLAW, H. S., JAEGER, J. C. Conduction of Heat in Solids. Clarendon Press, Oxford<br />
1959.<br />
[2] ČERNÝ, R (ed.). Complex Systems and Methods for Directed Design and Assessment of<br />
Functional Properties of Building Materials: Assessment and Synthesis of Analytical Data and<br />
Construction of the System. Czech Technical University in Prague, 2010.<br />
[3] COLA, M. J., ORLANDE, H. R. B., DULIKRAVICH, G. S. Inverse and optimization<br />
problems in heat transfer. Journal of the Brazilian Society of Mechanical Sciences and<br />
Engineering 28 (2006), pp. 1–24.<br />
[4] DAVIES, M. G. Building Heat Transfer. J. Wiley & Sons, 2004.<br />
[5] EN ISO 8894‐1. Refractory materials – Determination of thermal conductivity – Part 1: Hot‐wire<br />
methods (cross‐array and resistance thermometer). CEN (European Committee for<br />
Standardization), 2010.<br />
[6] GUTIERREZ‐MIRAVETE, E. Heat conduction in cylindrical and spherical coordinates. In:<br />
Conduction Heat Transfer, Chapter 3. Hartford University, 2006.<br />
[7] SINGH, S., JAIN, P. K., RIZWAN‐UDDIN. Analytical solution of time‐dependent<br />
multilayer heat conduction problems for nuclear applications. <strong>Proceedings</strong> of the 1 st<br />
International Nuclear and Renewable Energy <strong>Conference</strong> (INREC10) in Amman (Jordan), 2010,<br />
pp. 1–6.<br />
[8] TURGUT, A. A study of hot wire method of measuring thermal conductivity. Research<br />
report. Dekuz Eylul University in Izmir, 2004.<br />
[9] VALA, J. Least‐squares based technique for identification of thermal characteristics of<br />
building materials. International Journal of Mathematics and Computers in Simulation 5 (2011),<br />
pp.126–134.<br />
[10] WULLSCHLEGER, L., WAKILI, K. G. Numerical parameters of the thermal behaviour of<br />
a gypsum plaster board at fire temperature. Fire and Materials 32 (2008), pp. 103–119.<br />
222
Applications of thermophysics in science and industry –<br />
Nanofluids and Polymer Nanocomposites<br />
Ismail H. Tavman 1 , Alpaslan Turgut 2<br />
1,2 Dokuz Eylul University, Mechanical Eng. Department<br />
35397 Tinaztepe‐ Buca/Izmir ‐ Turkey<br />
e‐mail: ismail.tavman@deu.edu.tr<br />
Abstract: Thermophysical properties of mater are used in every aspect of science and industry. The<br />
correct knowledge of these properties in solid, liquid and gaseous phases are especially important for<br />
chemical processing industries, food processing industries, power plants technology for security as well as<br />
energy planning reasons. For energy savings in building industry, the knowledge of thermophysical<br />
properties of construction and insulating materials is important. Among the wide variety of materials,<br />
the focus of this study is to examine the effects nanoparticles have on the heat transfer of fluids and<br />
polymer solids. Nanofluids and polymer nanocomposites are relatively new class of engineering materials<br />
that offer the designer an opportunity to tailor properties to meet specific requirements. Sample<br />
preparation techniques that provide suitable nanoparticle dispersion in both liquid and solid samples are<br />
discussed. Water based nanofluids at different particle concentrations of SiO2 , TiO2 and Al2O3<br />
nanoparticles were prepared using a two‐step methods. For nanofluids the effective thermal conductivity<br />
were measured by using 3ω method and effective viscosity by vibro‐viscometer. Measured results showed<br />
that the effective thermal conductivity of nanofluids increase as the concentration of the particles increase.<br />
In the case of nanocomposites, thermal diffusivity of nanocomposites based on the ethylene‐ vinyl acetate<br />
(EVA) matrix filled with nano‐ structuralized expanded graphite (EG) and standard, micro‐sized<br />
graphite (UG) were investigated by using flash technique. Composite samples up to 29.3% graphite<br />
particle volumetric concentrations (50% weight concentration) were prepared by melt‐mixing process in<br />
a Brabender Plasticorder.<br />
Keywords: Thermophysical properties, Nanofluid, Polymer nanocomposite, thermal conductivity,<br />
thermal diffusivity<br />
1. Introduction<br />
In this work we report on the thermal transport properties of water‐based nanofluids, a new<br />
class of heat transfer fluids and graphite filled conducting polymer (EVA) nanocomposites.<br />
Nanofluids are stable colloidal suspensions of nanoparticles, nanofibers, or nanocomposites<br />
dispersed in base fluids, such as water, oil, ethylene‐glycol mixtures (antifreeze), polymer<br />
solutions, etc. In nanofluids, the particles are very small, nanometer‐sized particles with at least<br />
one dimension usually less than 100 nm (nanometers). The smallest nanoparticles which have<br />
only a few nanometers in diameter contain only a few thousand atoms. These nanoparticles can<br />
have properties that are substantially different from their parent materials. Similarly, nanofluids<br />
may have properties that are different from their base fluids, like much higher thermal<br />
conductivity [1‐4], among others.<br />
Various industries such as transportation, electronics, food, medical industries require efficient<br />
heat transfer fluids to either remove or transfer heat by means of a flowing fluid. Especially<br />
223
with the miniaturization in electronic equipments, the need for heat removal has become more<br />
important in order to ensure proper working conditions for these elements. Thus, new<br />
strategies, such as the use of new, more conductive fluids are needed. Most of the fluids used<br />
for this purpose are generally poor heat conductors compared to solids, Figure 1.<br />
224<br />
Thermal Conductivity (W/mK)<br />
1000<br />
100<br />
10<br />
1<br />
0.1<br />
Heat transfer fluids Metal Oxide Metal<br />
Cu<br />
Al<br />
Ethylene Glycol<br />
Oil<br />
Water<br />
TiO2<br />
Figure 1: Thermal conductivity of typical materials (solids and liquids) at 300 K.<br />
It is well known that fluids may become more conductive by the addition of conductive solid<br />
particles. However such mixtures have a lot of practical limitations, primarily arising from the<br />
sedimentation of particles and the associated blockage issues. These limitations can be<br />
overcome by using suspensions of nanometer‐sized particles (nanoparticles) in liquids, known<br />
as nanofluids. After the pioneering work by Choi and later on by Eastman of the Argonne<br />
National Laboratory, U.S.A. in 1995 [1,2] and their publications [2,3] reporting an anomalous<br />
increase in thermal conductivity of the base fluid with the addition of low volume fractions of<br />
conducting nanoparticles, there has been a great interest for nanofluids research both<br />
experimentally and theoretically. More than 2471 nanofluid‐related research publications have<br />
appeared in literature since then and the number per year appears to be increasing as it can<br />
seen from Figure 2. In 2011 alone, 581 research papers were published in Science Citation Index<br />
journals. However, the transition to industrial practice requires that nanofluid technology<br />
become further developed, and that some key barriers, like the stability and sedimentation<br />
problems be overcome. Some scientists argued that the anomalous enhancement in thermal<br />
conductivity is caused by inaccuracies of thermal measurement methods, [5, 6]. Comparing<br />
different measurement methods, error sources may result from the preparation of nanofluids,<br />
measurement process, and the formation of particle aggregates [7]. Thus, the controversy is still<br />
not over because of those uncertainties.<br />
CuO<br />
Al2O3
Number of paper published per year<br />
700<br />
600<br />
500<br />
400<br />
300<br />
200<br />
100<br />
0<br />
Papers in the title containing either "nanofluid" or<br />
"nanofluids" searched by the ISI web of science-with<br />
conference proceedings on August <strong>2012</strong><br />
4 3 6<br />
21 40<br />
92 121<br />
172<br />
Year<br />
337<br />
289<br />
438<br />
581<br />
367<br />
00 01 02 03 04 05 06 07 08 09 10 11 12<br />
Figure 2: Publications on nanofluids since 1999.<br />
Nanofluids are generally produced by two different techniques: a one‐step technique and a<br />
two‐step technique. The one‐step technique makes and disperses the nanoparticles directly into<br />
a base fluid simultaneously. The two‐step technique starts with nanoparticles which can usually<br />
be purchased and proceeds to disperse them into a base fluid. Most of the nanofluids containing<br />
oxide nanoparticles and carbon nanotubes reported in the open literature are produced by the<br />
two‐step process. The major advantage of the two‐step technique is the possibility to use<br />
commercially available nanoparticles, this method provides an economical way to produce<br />
nanofluids. But, the major drawback is the tendency of the particles to agglomerate due to<br />
attractive van der Waals forces between nanoparticles; then, the agglomerations of particles<br />
tend to quickly settle out of liquids. This problem is overcome by using ultrasonic vibration, to<br />
break down the agglomerations and homogenize the mixture.<br />
Nanocomposites are a new class of materials containing at least one filler dimension in the<br />
nanometer range. Polymeric materials are limited in their applications due to their low thermal<br />
conductivity and diffusivity, low thermal stability, high electrical resistivity, and ductile<br />
mechanical properties. However, polymers are easily processed to give them the required<br />
forms, and they are inexpensive and have high strength‐to‐weight ratios. With the addition of<br />
micro‐ and nano‐meter size particles or fibers into a polymer matrix, the properties may be<br />
enhanced and become suitable for the particular use intended for the material. The discovery of<br />
polymer nanocomposites by the Toyota research group [8] has opened a new dimension in the<br />
field of materials science. The use of inorganic nanomaterials as fillers in the preparation of<br />
polymer/inorganic composites has attracted increasing interest owing to their unique properties<br />
and numerous potential applications in the automotive, aerospace, construction and electronic<br />
industries [9, 10]. So far, the majority of research has focused on polymer nanocomposites<br />
based on layered materials of a natural origin, such as layered silicate compounds or synthetic<br />
225
clay [9, 10]. However, the electrical and thermal conductivity of clay minerals are quite low. In<br />
order to overcome these shortcomings, carbon‐based nanofillers, such as carbon black,<br />
expanded graphite (EG), carbon nanotube (CNT), and carbon nanofiber (CNF) have been<br />
introduced to the preparation of conductive polymer nanocomposites [11, 12]. From Figure 3,<br />
we can see that more than 3978 polymer nanocomposite related research publications have<br />
appeared in literature since 1999, and the number per year appears to be increasing each year.<br />
226<br />
Number of paper published per year<br />
2. Experimental<br />
2.1 Nanofluids<br />
800<br />
700<br />
600<br />
500<br />
400<br />
300<br />
200<br />
100<br />
0<br />
Papers in the title containing either "polymer<br />
nanocomposite" or "polymer nanocomposites" searched<br />
by the ISI web of science-with conference proceedings on<br />
August <strong>2012</strong><br />
741<br />
24<br />
250<br />
190<br />
134<br />
91<br />
45 62<br />
Year<br />
368<br />
527<br />
464<br />
633<br />
449<br />
00 01 02 03 04 05 06 07 08 09 10 11 12<br />
Figure 3: Publications on polymer nanocomposites since 1999.<br />
A two‐step method was used to produce water based nanofluids with, 0.45, 1.85 vol.%<br />
concentrations of SiO2 (12nm diameter) nanoparticles; 0.2, 1.0 and 2.0 vol.% concentrations of<br />
TiO2 (21nm diameter) nanoparticles and 0.5 and 1.5 vol.% concentrations of Al2O3 (30nm<br />
diameter) nanoparticles. In the first stage of preparation of nanofluids, the proper amount of<br />
dry nanoparticles necessary to obtain the desired volume percentage was mechanically mixed<br />
in de‐ionized water. The next step was to homogenize the mixture using ultrasonic vibration, to<br />
break down the agglomerations, the sonication time was 30 minutes.<br />
A 3ω method was used to measure simultaneous thermal conductivity k and thermal diffusivity<br />
a of nanofluids in a configuration using an “ac” excited hot wire combined with lock‐in<br />
detection of the third harmonic (3ω method), the theory and experimental setup was fully<br />
described in a previous publication [13]. A thin metal wire is employed in the liquid sample<br />
which serves both as heater and thermometer. In our case this thermal probe (ThP) is made of a<br />
40 μm in diameter and 19.0 mm long Ni wire, see Figure 4 for experimental setup. An<br />
alternating input current with frequency ω heats the wire and consequently the sample at 2ω
frequency. Since electrical conductivity of metal varies linearly with temperature, the output<br />
voltage includes a 3ω component which depends on thermal conductivity of the sample. The<br />
3ω voltage signal can be extracted using lock‐in amplifier. This method works with lower<br />
temperature excitation than other methods.<br />
2.2 Polymer Nanocomposites<br />
Figure 4: Schematic diagram of 3 experimental set‐up.<br />
In this study an ethylene‐vinyl acetate copolymer (EVA) containing 14 mass% of vinyl acetate<br />
(VA), Miravithen® D 14010 V supplied by Leuna Polymer GmbH, Germany was used as the<br />
matrix material. Its melt flow index is 9.8 g/10 min (190 °C/2.16 kg). The filler materials were<br />
expanded graphite (EG) having originally a size in the range of (5 to 6) μm in length and<br />
untreated graphite (UG) having a size from 20 μm to 25 μm. Most of the particles have an<br />
aspect ratio between 20 and 250. Ethylene‐vinyl acetate copolymer (EVA) – graphite mixtures<br />
were prepared in a Brabender Plasticorder PLE 331 internal mixer at 150 °C for a total mixing<br />
time of 10 min. After 10 min, the mixing chamber of the Brabender apparatus is opened and the<br />
resulting mixture is taken out, then after passing through rollers, the mixture is solidified. The<br />
resultant mixture is then put in a compression molding die and compressed in a compression<br />
molding press at 120 °C, under 40 kP pressure for one minute to obtain samples in the form of<br />
sheets.<br />
In this research, the thermal diffusivity of conductive nanocomposites based on ethylene‐vinyl<br />
acetate copolymer (EVA) filled natural graphite (UG) and expanded graphite (EG) were<br />
measured using a flash apparatus Netzsch Nanoflash LFA 447/1. In this method, a uniform,<br />
high intensity heat pulse of short duration compared to the transient time through the sample is<br />
incident on the front face (x=0) of a disc or square shaped sample of a few millimeters thick. The<br />
temperature rise on the rear face (x=e) is recorded. If two dimensionless parameters V and ω are<br />
defined by:<br />
T ( e,<br />
t)<br />
V ( e,<br />
t)<br />
(1)<br />
T<br />
M<br />
2<br />
at<br />
(2)<br />
2<br />
e<br />
227
Where, T(e,t) and TM are the instantaneous and maximum temperature increases of the rear<br />
face; (e) is the sample thickness; (t) is time and (a) is the thermal diffusivity. If no heat losses<br />
occur, the dimensionless temperature increase on the rear face is given by:<br />
228<br />
<br />
n1<br />
n<br />
2<br />
V ( e,<br />
t)<br />
1<br />
2 ( 1)<br />
exp( n<br />
)<br />
(3)<br />
It is a common practice to employ the half maximum temperature raise time t1/2 for which ω is<br />
equal to 1.38; hence, the thermal diffusivity (a) can be calculated using the following<br />
expression:<br />
2<br />
1.<br />
38e<br />
a (4)<br />
2<br />
t<br />
1/<br />
2<br />
3 Results and Discussions<br />
3.1 Nanofluids<br />
In Figure 5 our experimental results for SiO2, Al2O3 and TiO2 samples at room temperature were<br />
compared with classical effective thermal conductivity model, known as Hamilton – Crosser<br />
model [14]. Our experimental results for water based SiO2, Al2O3 and TiO2 nanofluids are lower<br />
than the H‐C model. Moreover, comparison of the TiO2 nanofluids with the Al2O3 nanofluids<br />
showed that the highly thermal conductive material is not always the excellent application for<br />
enhancing the thermal transport property of nanofluids. Thermal conductivity of TiO2 – water<br />
nanofluid has higher enhancement than the Al2O3 – water nanofluid, even TiO2 bulk thermal<br />
conductivity value is lower than the Al2O3.<br />
Relative Thermal Conductivity<br />
1.08<br />
1.07<br />
1.06<br />
1.05<br />
1.04<br />
1.03<br />
1.02<br />
1.01<br />
Figure 5: Relative thermal conductivity versus particle volume fraction of TiO2 , Al2O3 and SiO2<br />
nanofluids.<br />
3.2 Polymer Nanocomposites<br />
1<br />
water based nanofluids<br />
TiO2 experimental<br />
Al2O3 experimental<br />
SiO2 experimental<br />
H-C model TiO2<br />
H-C model Al2O3<br />
H-C model SiO2<br />
0 0.5 1<br />
Particle Volume Fraction (%)<br />
1.5 2<br />
The samples were square‐shaped with a side length of 10 mm and a thickness of 4 mm. For each<br />
filler concentration, four samples were prepared and five measurements were performed at<br />
room temperature on each of these samples. After exfoliation, a lower concentration should be
needed to reach the high thermal diffusivity. Figure 6 shows the thermal diffusivity of the<br />
exfoliated graphite filled EVA and unexpanded graphite filler EVA at various filler<br />
contents. Thermal diffusivity of expanded graphite filled EVA increases more rapidly than<br />
unexpanded graphite filled EVA composite. The maximum value thermal diffusivity occurs at<br />
29.3% volumetric concentration of filler, this value is 8.23 x10 ‐7 m 2 /s for EG filled EVA and 6.14<br />
x10 ‐7 m 2 /s for UG filled EVA which means that the increase of 4.7 times for EG/EVA<br />
nanocomposite, while the increase was only 3.5 times for UG/EVA composite over the pure<br />
EVA having the thermal diffusivity of 1.74 x10 ‐7 m 2 /s. This is due to the exfoliation of the<br />
graphite flake into sheets producing highly conductive material with a higher aspect ratio for<br />
expanded graphite (EG) than typical natural graphite (UG).<br />
Figure 6: Thermal diffusivity of EVA–EG and EVA–UG composites versus volume filler fraction<br />
Acknowledgments<br />
This research has been supported by TUBITAK (Project no: 107M160), Research Foundation of<br />
Dokuz Eylul University (project no: 2009.KB.FEN.018) and the Scientific Support of the bilateral<br />
Project No. 107M227 of TUBITAK and SAS (Slovak Academy of Sciences).<br />
References<br />
Thermal diffusivity (mm 2 /s)<br />
0.9<br />
0.8<br />
0.7<br />
0.6<br />
0.5<br />
0.4<br />
0.3<br />
0.2<br />
EVA - EG<br />
EVA - UG<br />
0.1<br />
0 5 10 15 20 25 30<br />
Particle volumetric concentration (%)<br />
[1] CHOI, S.U.S. Developments and Applications of Non‐Newtonian Flows, Ed. D. A. Siginer and<br />
H. P. Wang ~The ASME, New York, 1995, Vol. 231/MD‐Vol. 66, pp. 99–105.<br />
[2] EASTMAN, J.A.‐ CHOI, S.U.S. ‐ LI, S. ‐ YU, W. ‐ THOMPSON, L.J. Anomalously<br />
increased effective thermal conductivities of ethylene glycol based nanofluids contain‐<br />
ing copper nanoparticles. In Appl. Phys. Lett. 2001. 78. p. 718–720. ISSN 0003‐6951<br />
[3] CHOI, S.U.S. ‐ ZHANG, Z.G. ‐ YU, W. ‐ LOCKWOOD, F.E. ‐ GRULKE, E.A. Anomalous<br />
thermal conductivity enhancement in nanotube suspensions. In Appl. Phys. Lett. 2001. 79.<br />
p. 2252–2254. ISSN 0003‐6951<br />
229
[4] MURSHED, S.M.S. ‐ LEONG, K.C. ‐ YANG, C. Thermophysical and electro‐kinetic<br />
properties of nanofluids – a critical review. In Appl. Therm. Eng. 2008. 28. p. 2109–2125.<br />
ISSN 1359‐4311<br />
[5] KEBLINSKI, P. ‐ PRASHER, R. ‐ EAPEN, J. Thermal conductance of nanofluids: is the<br />
controversy over?. In J. Nanopart. Res. 2008. 10(7). p. 1089‐1097. ISSN 1388‐0764<br />
[6] TURGUT, A. ‐ TAVMAN, I. ‐ CHIRTOC, M. ‐ SCHUCHMANN, H.P. ‐ SAUTER, C. ‐<br />
TAVMAN, S. Thermal conductivity and viscosity measurements of water‐based TiO2<br />
nanofluids. In Int. J. Thermophys. . 2009. 30 (4). p. 1213–1226. ISSN 0195‐928X<br />
[7] YOO, D.H.– HONG, K.S.–YANG, H.S. Study of thermal conductivity of nanofluids for the<br />
application of heat transfer fluids. In Thermochim Acta. 2007. 455. p. 66‐69. ISSN 0040‐6031<br />
[8] Okada, A. – Kawasumi, M. – Usuki, A. – Kojima, Y. – Kurauchi, T. – Kamigaito, O.<br />
Synthesis and properties of nylon‐6/clay hybrids. In: Schaefer DW, Mark JE, editors.<br />
Polymer based molecular composites. vol. 171. MRS symposium proceedings. Pittsburgh PA:<br />
Materials Research Society; 1990. p. 45–50.<br />
[9] GODOVSKY, D.Y. Device applications of polymer‐nanocomposites. In Adv Polym Sci .<br />
2000. 153. p.163–205. ISSN 0065‐3195<br />
[10] ALEXANDRE, M. – DUBOIS, P. Polymer‐layered silicate nanocomposites: preparation,<br />
properties and uses of a new class of materials. In Mater Sci Eng:R . 2000. 28. p. 1–63. ISSN:<br />
0927‐796X<br />
[11] DEBELAK , B – LAFDI, K. Use of exfoliated graphite filler to enhance polymer physical<br />
properties. In Carbon. 2007. 45. p. 1727–34. ISSN 0008‐6223<br />
[12] TAVMAN, I.‐ KRUPA, I.‐ OMASTOVA, M. ‐ SARIKANAT, M.‐ NOVAK, I. ‐ SEVER, K. ‐<br />
OZDEMIR, I.‐ SEKI, Y. ‐ PODHRADSKÁ, S. ‐ MOSKOVA, D.‐ ERBAY, E.‐ GUNER, F.<br />
Effects of conductive graphite filler loading on physical properties of high‐density<br />
polyethylene composite. In Polym. Compos. <strong>2012</strong>. 33(7). P.1071‐1076. ISSN 1548‐0569<br />
[13] TURGUT, A.‐ SAUTER, C.‐ CHIRTOC, M.‐ HENRY, J. F.‐ TAVMAN, S. ‐ TAVMAN, I. ‐<br />
PELZL, J. AC Hot Wire Measurement of Thermophysical Properties of Nanofluids with 3<br />
Omega Method, In Europ. Phys.J. Special Topics, 2008. 153, p. 349‐352. ISSN: 1951‐6355<br />
[14] HAMILTON, R.L.‐ CROSSER, O.K. Thermal conductivity of heterogeneous two<br />
component systems. In Ind. Eng. Chem. Fund.. 1962. 1. p. 187–191. ISSN 0888 5885<br />
230
Thermal expansion measurement of lining boards<br />
Jan Toman, Tomáš Korecký<br />
Czech Technical University in Prague, Faculty of Civil Engineering, Department of Materials<br />
Engineering and Chemistry, Thákurova 7, CZ‐166 29 Prague 6, CZECH REPUBLIC<br />
Abstract: The linear thermal expansion coefficient is another thermal‐technical parameter which is<br />
important for applications of particular products on the building. Therefore it was decided to add this<br />
detail to already measured board materials.<br />
For measurement was used dilatometer into which was always put specimen of size 2 x 15 x board<br />
thickness, the temperature was gradually rising up to 1000 °C and change of length was being measured.<br />
Then the linear thermal expansion coefficient was easily calculated.<br />
Because the measured materials were thermally structurally instable the experiment was repeated after<br />
cooling down.<br />
Keywords: Linear thermal expansion, High temperatures<br />
1. Introduction<br />
During the research of thermal‐technical properties of composites materials [1] with respect to<br />
their thermal structural stability we measured several parameters after burning the samples on<br />
certain temperature.<br />
The linear thermal expansion coefficient is another thermal‐technical parameter which is<br />
important for applications particular products on the building. Therefore it was decided to add<br />
this detail to already measured board materials.<br />
2. Theory<br />
The linear thermal expansion coefficient is calculated from equation:<br />
L .( 1<br />
.<br />
t)<br />
, (1)<br />
L t<br />
0<br />
where: Lt is length of specimen at temperature t,<br />
L0 is length of specimen at temperature 0,<br />
α is linear thermal expansion coefficient and<br />
t is temperature,<br />
where it is often used measuring of elongation defined as:<br />
Lt L0<br />
.<br />
t . (2)<br />
L<br />
0<br />
Because elongation changes with the temperature, also the linear thermal expansion coefficient<br />
must depend on the temperature. That the reason why is often considered average value of the<br />
linear thermal expansion coefficient for temperature interval from 0 to t<br />
<br />
0 t <br />
(3)<br />
t<br />
and for temperature t we must use differential expression<br />
231
d<br />
t (4)<br />
dt<br />
For 3D it is easy to prove, when omitting values of very low orders, we can write:<br />
232<br />
3.<br />
<br />
(5)<br />
t<br />
t<br />
where βt is volumetric thermal expansion coefficient.<br />
Particularly thermal dependence of thermal expansion on temperature we will find out by<br />
measuring of elongation for certain temperatures (most suitably every 100 °C up to 1000°C) and<br />
all these measured values we will plot in to the Figures in dependence on temperature. This<br />
function we will analytically describe and with its derivation we can determine αt for each<br />
temperature.<br />
3. Measured materials<br />
All samples were delivered by Research Institute of Building Materials in Brno.<br />
PROMATECT – white composite material, board with thickness 3 cm.<br />
FIREBOARD – grey composite material, board with thickness 2,5 cm.<br />
PLASTERBOARD – pink material based on gypsum, board with thickness 1,2 cm.<br />
FERMACELL – white material based on gypsum, board with thickness 1,2 cm.<br />
Because they all are commercially produced materials their exact composition and formula are<br />
under the ownership rights of the company.<br />
Further composites materials which were made by Research Institute of Building Materials in<br />
Brno: SX6 B and SX6 K<br />
their composition is as follow: gypsum firm Gypstrend – Kobeřice,<br />
water ratio 0.328,<br />
additives: Retardant GK, Peramin 30,<br />
lightening mixture: 5% weight Experlit EP 150,<br />
reinforcement by fibres: SX6 B – 3 % of volume Baseltex 6 (basalt)<br />
SX6 K – 3 % of volume Kuralon (PVA)<br />
From above materials we cut specimens – beams of size 2 x 15 x board thickness.<br />
4. Methodology of measurement<br />
Measurement was performed on special dilatometer [2]. The measured specimen is put into it,<br />
temperature gradually grows up to 1000 °C and changes of length of the beam are being<br />
observed. From these values it is easy to calculate coefficient of thermal expansion.<br />
Because the structure of material is not always thermally stable the measurement was repeated<br />
after cooling the sample down. No changes were observed on the burned specimen after<br />
repeated rise of the temperature which would arise from its structural instability.<br />
5. Results of measurement<br />
All the measured results were plotted in to the Figures. Because the total change of the length<br />
which is recorded consists of change of the length of the measured specimen and contact a rod.
For final evaluation it is necessary to take the change of length of contact rod away. Its enabled<br />
by calibration of apparatus.<br />
It is interesting that most of the measurements shows totally shorting. It is probably caused by<br />
drying the specimens. At those materials which are thermally instable the shorting often caused<br />
by changes in the structure.<br />
In the Figure 1 is shown, as a sample, dependence of elongation on temperature for material<br />
PROMATECT. It is the first measurement, which means the specimen hadn´t been burned<br />
before. In the Figure 2 is shown the same specimen but after repeated measurement (after<br />
burning). By the same way were plotted all other Figures for all measured materials. From these<br />
Figures we will easily determine linear thermal expansion coefficient αt as derivation (tangent<br />
of curve) for each temperature t and α0t (secant of curve) so it is average value of linear thermal<br />
expansion coefficient for temperature interval from 0 to t °C.<br />
Figure 1: Measured dilatations of material Promatect<br />
Figure 2: Measured dilatation of material Promatect, repeated experiment<br />
233
In the Table 1 are shown calculated average values of the linear thermal expansion coefficients<br />
α0t for each measured material in dependence on the temperature.<br />
Table 1: Average values of linear thermal expansion<br />
MATERIAL 100°C 200°C 300°C 400°C 500°C 600°C 700°C 800°C 900°C 1000°C<br />
The first measrement [.10 ‐6 K ‐1 ]<br />
Promatect 6.72 10.56 2.40 2.15 1.42 2.52 6.29 5.51 ‐4.62 5.40<br />
Fireboard 0.0 ‐5.1 ‐15.0 ‐25.3 ‐24.8 ‐19.8 ‐20.1 ‐35.0<br />
Fermacell 0.0 ‐5.0 ‐60.0 ‐55.0 ‐58.0 ‐ 65.0 ‐65.0 ‐65.0<br />
Sádrokarton 0.0 ‐10.0 ‐15.0 ‐40.0 ‐35.0 ‐40.0 ‐50.0 ‐40.0 35.0<br />
SX6‐B 2.0 8.0 4.0 ‐8.0 ‐12.0 ‐10.0 ‐10.0 ‐20.0 ‐16.0 ‐20.0<br />
The second measurement [.10 ‐6 K ‐1 ]<br />
Promatect 7.8 7.6 6.2 6.2 6.4 7.7 7.3 7.6 7.9 8.0<br />
Ferrmacell 10.0 15.0 15.0 15.0 12.0 12.0 12.0 10.0<br />
SX6‐B 12.5 12.1 12.1 12.3 12.6 15.8 14.0 15.4 16.2 14.5<br />
6. Discussion<br />
During the measurements it was found out that it is better to heat specimens slowly and<br />
gradually instead of in steps of 100 °C. Delay of temperature rising is insignificant but the<br />
Figures are more continuously and calculating of derivation is therefore more accurate.<br />
The results of measurement show that it is necessary to measure the specimens at least twice<br />
because at the first measurement caused drying and thus contraction. Another contraction is<br />
caused by material structural instability.<br />
7. Conclusionn<br />
The measurement proved premise that the materials based on gypsum are at higher<br />
temperatures structurally instable and at the temperatures over 800 °C destruction of material<br />
happens. As the best seems to be the material Promatect.<br />
Acknowledgement<br />
This work has been financially supported by the Ministry of Education. Youth and Sports of<br />
Czech Republic. under project No MSM: 6840770031 and by the Ministry of Industry and Trade<br />
of Czech republic. under project No MPO FR – TI 1/216.<br />
References<br />
[1] Toman J.. Michalko O.. Korecký T.:VÝBER NAJVHODNEJŠIEHO MATERIÁLU NA<br />
POŽIARNE OBKLADOVÉ DESKY. In: Stavebné materiály 03/<strong>2012</strong> str.50-53. JAGA<br />
Groop s.r.o. Bratislava<br />
[2] Toman J.. Krička A.. Trník A.: Zařízení pro měření délkových změn materiálu při<br />
vysokých teplotách. Užitný vzor č. 21752. ÚPV Praha. 2011.<br />
234
Heat Inertia Correction of Data Measured by a Conduction<br />
Calorimeter.<br />
Vratislav Tydlitát, Jan Zákoutský, Robert Černý<br />
Czech Technical University. Faculty of Civil Engineering. Thákurova 7. CZ‐166 29 Prague.<br />
Czech Republic<br />
Abstract: Data obtained using a heat conduction calorimeter are affected by a time delay caused<br />
by the heat inertia of the apparatus. In this paper. a data correction obtained by the solution of a<br />
linear differential equation is presented.<br />
Introduction<br />
The theory of measurement of heat power in conduction calorimeter was published by Calvet<br />
and Prat [1] before nearly fifty years. They describe the measurement of temperature differences<br />
by thermopiles using very sensitive mirror galvanometers. Since these times very much<br />
progress sis realized in measurement of heat flow. but the principle of conduction calorimetry<br />
does not changed. Very sensitive picking up of thermal differences proportional to heat flow is<br />
the base of measurement the heat flow. The sensitive galvanometer is now replaced by data<br />
logger. taking low electric voltage in short time intervals. With long time stability make this<br />
method possible monitoring of hydration reactions for many days.<br />
Conduction calorimeter<br />
The conduction calorimeter in principle makes possible among others measurement of heat<br />
flow generated by hydration reactions. These reactions are basis of setting concrete and other<br />
binders of different kind in civil engineering. To measure released heat the calorimeter has three<br />
basic parts: 1.the vessel. where hydration reaction proceeds. in heat contact with them is 2.the<br />
sensor of heat flow. 3. The heat from heat flow sensor receipts isothermal component. which has<br />
either enough heat capacity or is isothermal cooled. In our case the heat from copper vessel is<br />
transported by conduction. convection and radiation from wings with thermopiles through the<br />
air to heavy aluminous coat. The used calorimeter is on Fig.1.<br />
Figure 1: Calorimeter KC01<br />
235
Balance of heat in calorimeter<br />
The balance of heat flow from calorimetric vessel is following: one part of heat flow which is<br />
used for his measurement is absorbed in part three. This measured part generates electric<br />
voltage U(t). recorded in the data logger. Other part of heat is consumed to increase the<br />
temperature of the first and second part of calorimeter. This accumulated heat can be expressed<br />
as C*[dT(t)/dt]. where C [J/K] is the heat capacity of the reaction vessel with sample. The heat<br />
flow sensor is usually of low heat capacity and his temperature is between between the<br />
temperature of the calorimeter vessel and isothermal component and here it can be in<br />
considerations neglected. The power produced in calorimetric cell. Ncor(t). can be after Calvet<br />
and Prat [1] described by Tian equation<br />
236<br />
∗ ∗ /. (1)<br />
where f [mW/mV] is the calibration coefficient of the heat flow measuring system (based on<br />
thermopiles) and T is the time constant of the instrument. (1) is a non‐homogenous differential<br />
equation of 1 st order. If we assume. that the Ncor = 0 in the time t1 and the U(t1) = U1. than the<br />
equation (1) takes the form<br />
∗∗/0 (2)<br />
The solution of homogenous equation (2) is simple.<br />
U(t‐t1) = U1*exp (‐ (t‐t1)/T) (3)<br />
and will be used later.<br />
Calibration<br />
Calibration of the calorimeter will be done by Joule heat of direct current by the use of thermal<br />
constant resistance 10 kilo ohm. by copper lead‐in of resistance less than 1 ohm and very stable<br />
source of the current. The course of calibration is in graphs of Fig.2. We see that after<br />
stabilization the signal U is constant. and in equation (1) the second term on right side is zero.<br />
Thermal powers 5. 10. 15. 20 mW were used for calibration and on Fig.2 are graphs of the course<br />
of signal U [mV]. The calibration characteristics is linear with the slope 16.878 mW/mV at 25 °C<br />
(R 2 = 0.99997).
Determination of time constant<br />
Figure 2: Characteristic calibration courses U [mV]<br />
The courses of calibration curves show after the current was switched off and if the cooling<br />
obeys exponential course after equation (3). the time constant T can be computed from the<br />
graph of ln(U(t+t1)/U1) again time. This was done on Fig. 3. As the graph in not linear. but can<br />
be interlay by polynomial of 2 nd order. At origin we obtain guideline of the value ‐1/T. Here T =<br />
0.079315 h was found.<br />
Figure 3: Determination of time constant T of the calorimeter by plotting ln(U/U0) again time after<br />
disconnecting the calibration heat power at 10 mW<br />
237
Transformation of calorimeter output to true heat power dependence<br />
The true heat power dependence of measured hydration heat power was computed from data.<br />
obtained by picking up them with the data logger every 15 second (15/3600 h). The dU/dt was<br />
for lucidity expressed in [mV/h] and the graph has time axis in hours. The results are on Fig. 4.<br />
Results and discussion<br />
On the Fig. 4 are graphs of uncorrected hydration heat power N(t) [mW/g] and after (1)<br />
corrected Ncor(t) for hydration course of the cement CEM I 42.5R (w/c = 0.47) at 25 °C. The<br />
operation at the begin of measurement proceed subsequently: the steady calorimeter with<br />
sample and syrette with water will be opened. by syrette slow inject the water. than cement<br />
with water mixed by plastic mixer manufactured from plastic tube (also tempered). the<br />
mixer snipped and the calorimeter stoppered and closed.<br />
On the graph. which describes 10 h of hydration are evident only differences between Ncor and<br />
N during the first hour. The first maximum reaches for Ncor 40 mW/g again the value 15 mW/g<br />
for N. On the second graph with finer time measure we see that the main maximum<br />
accompanies two adjacent maxima. The first adjacent maximum can be adjudged to injecting of<br />
water (wetting of the cement) and the second can be from mixing the cement with water. About<br />
resolution of the heat at addition of water and at mixing in calorimeter with time constants near<br />
3 min refers Evju [2].<br />
The first main maximum is known as hydration of C3A phase and forming ettringite. see<br />
Collepradi [5].<br />
238
Figure 4: Uncorrected and correted hydration power of cement CEM I 42.5R. (w/c=0.47) after Tian<br />
equation. Two initial maxima of addition water and mixing are on enlarged graph<br />
Conclusions<br />
Hydr. Heat power [mW/g]<br />
40<br />
30<br />
20<br />
10<br />
0<br />
The inertia correction at hydration of Portland cement CEM I 42.5R showed details of heat<br />
production at initial manipulation with the sample by measurement of hydration heat power in<br />
calorimeter KC02 [3. 4] and can be used to control of correctness of the initial process.<br />
Acknowledegement<br />
Uncorrected and corrected hydration heat<br />
power for CEM I 42.5R (w/c=0,47]<br />
0 0.1 0.2 0.3 0.4 0.5<br />
Time [h]<br />
This research has been supported by the Ministry of Education. Youth and Sports of the Czech<br />
Republic. under project No MSM: 6840770031.<br />
Nkor<br />
N<br />
239
References<br />
[1] Calvet. E.. Prat. H. Recent progress in microcalorimetry. Pergamon Press. Oxford. 1963<br />
[2] Evju. C. Initial hydration of cementitious systeme using a simple isothermal calorimeter<br />
and dynamic correction. J. Therm. Anal. Calorim.. Vol. 71. 2003. pp. 829‐840<br />
[3] Tydlitát V.. Zákoutský J.. Černý R.: Theoretical analysis of sensitivity of heat flow sensor<br />
in isothermal calorimeter. THERMOPHYSICS 2011 Valtice. Cz. Rep. 2‐4.11.2011 p.207‐214.<br />
ISBN 978‐80‐214‐4345‐7 Ed. Brno University of Technology. 2011.<br />
[4] Tydlitát V..Tesárek P.. Černý R.: Calorimeter for measurement namely of hydration heats<br />
of cement and plasters . Utility design No. 18347. Office of Industrial Ownership. Prague<br />
2008 (in Czech). 2009. ISBN 88‐901469‐4‐X.<br />
240
Application of zeolite as alternative binder in concrete<br />
Eva Vejmelková 1 , Michal Ondráček 2 and Robert Černý 1<br />
1Faculty of Civil Engineering. Czech Technical University in Prague. Thákurova 7. CZ‐166 29 Prague.<br />
Czech Republic<br />
2Faculty of Chemistry. Brno University of Technology. Purkyňova 118. CZ‐612 00 Brno. Czech Republic<br />
email: eva.vejmelkova@fsv.cvut.cz<br />
Abstract: Natural zeolite is applied as an alternative binder in concrete. Experimental results<br />
show that although from both environmental and economical points of view it would be desirable<br />
to use its highest possible amounts in concrete production. the extent of Portland cement<br />
replacement which can be chosen in preparation of concrete mixes has certain limitations. The<br />
main limiting parameter is found the compressive strength.<br />
Keywords: natural zeolites. high‐performance concrete. hydric properties. mechanical<br />
1. Introduction<br />
Natural materials were used as supplementary cementitious materials (SCM) since ancient<br />
times. due to their pozzolanic properties. In the old Rome. fine volcanic (pozzolanic) ashes were<br />
used in a mixture with lime. At present natural pozzolanas are used as SCM for Portland<br />
cement concrete mainly in the countries where they are easily available. Natural zeolites are<br />
probably the most often used natural SCM. However. zeolite concrete is a much less frequent<br />
subject of investigation as compared for instance with silica fume. metakaolin. fly ash or ground<br />
granulated blast furnace slag as SCM.<br />
In the analyses of properties of concrete containing zeolites as SCM the various investigators<br />
concentrated mainly on mechanical properties which are commonly considered the most<br />
important for any type of concrete [1. 2]. Pozzolanic activity of zeolites was also a widely<br />
studied subject [3‐5]. Other properties were measured only seldom. Water sorptivity of concrete<br />
with zeolite additive was investigated by Chan and Ji [6]. Ikotun and Ekolu [7]. chloride<br />
diffusion by Chan and Ji [6]. Ahmadi and Shekarchi [8]. oxygen permeability by Ikotun and<br />
Ekolu [7]. Ahmadi and Shekarchi [8]. Thermal properties of autoclaved aerated concrete with<br />
zeolite addition were measured by Karakurt et al. [9].<br />
In this paper. mechanical and water transport properties of high performance concrete<br />
containing natural zeolite as partial replacement of Portland cement are studied and compared<br />
with reference high performance concrete.<br />
2. Materials<br />
The high performance concrete mixtures presented in Table 1 were prepared with Portland<br />
cement CEM I 42.5 R as the main binder. A part of cement was replaced by natural zeolites. The<br />
chemical composition of cement and natural zeolites is shown in Table 2.<br />
The measurement of material parameters of hardened concrete mixes was done (unless<br />
mentioned otherwise) after 28 days of standard curing. It took place in a conditioned laboratory<br />
at the temperature of 22±1°C and 25‐30% relative humidity.<br />
241
3.. Experimental Methods<br />
3.1 Basic Physical Properties<br />
242<br />
Table 1: Composition of Studied Concretes<br />
Composition [kgm<br />
Component<br />
‐3 ]<br />
BZ‐ref BZ10 BZ20 BZ40<br />
CEM I 42.5 R 484 436 387 305<br />
natural zeolites ‐ 48 97 179<br />
aggregates 0‐4 mm 812 812 812 812<br />
aggregates 8‐16 mm 910 910 910 910<br />
plasticizer Mapei Dynamon SX 5.3 5.3 5.3 5.3<br />
water 172 194 221 244<br />
Table 2: Chemical Composition of Cement and Natural Zeolites<br />
Component Amount [%]<br />
Cement Zeolites<br />
SiO2 21.89 68.15<br />
Al2O3 5.60 12.30<br />
Fe2O3 3.75 1.30<br />
CaO 62.33 2.63<br />
MgO 1.04 0.90<br />
K2O 0.92 2.80<br />
Na2O 0.11 0.75<br />
TiO2 0.30 0.20<br />
P2O5 0.17 ‐<br />
SO3 2.88 ‐<br />
Among the basic properties. the bulk density. matrix density and open porosity were measured<br />
using the water vacuum saturation method [10]. Each sample was dried in a drier to remove<br />
majority of the physically bound water. After that the samples were placed into the desiccator<br />
with deaired water. During three hours air was evacuated with vacuum pump from the<br />
desiccator. The specimens were then kept under water not less than 24 hours. The measurement<br />
was done on the samples with the dimensions of 50 x 50 x 20 mm.<br />
3.2 Mechanical Properties<br />
The measurement of compressive strength was done using the hydraulic testing device VEB<br />
WPM Leipzig 3000 kN. The apparatus consists of a stiff loading frame having the capacity of<br />
3000 kN. A constant strain rate of 0.1 – 0.2 MPa s ‐1 was imposed on the 150 x 150 x150 mm<br />
specimens. The tests were performed according to ČSN EN 12390‐3 [11].
3.3 Hydric Properties<br />
3.3.1 Water Transport Properties<br />
The water sorptivity was measured using a standard experimental setup. The specimen was<br />
water and vaporproof insulated on four lateral sides and the face side was immersed 1‐2 mm in<br />
the water. Constant water level in tank was achieved by a Mariotte bottle with two capillary<br />
tubes. One of them. inside diameter 2 mm. was ducked under the water level. second one.<br />
inside diameter 5 mm. was above water level. The automatic balance allowed for recording the<br />
increase of mass. The water absorption coefficient A [kgm ‐2 s ‐1/2 ] was then calculated using the<br />
formula<br />
i A<br />
t . (1)<br />
where i [kgm ‐2 ] is the cumulative water absorption. t is the time from the beginning of the<br />
suction experiment. The water absorption coefficient was then used for the calculation of the<br />
apparent moisture diffusivity in the form [12]<br />
2<br />
A <br />
<br />
<br />
<br />
<br />
<br />
app . (2)<br />
wc<br />
<br />
where wc [kgm ‐3 ] is the saturated moisture content.<br />
In the experimental work 5 specimens of 50 x 50 x 20 mm were used.<br />
3.3.2 Water Vapor Transport Properties<br />
The wet cup method and dry cup method were employed in the measurements of water vapor<br />
transport parameters [13]. In the dry cup method the sealed cup containing silica gel was placed<br />
in a controlled climatic chamber with 50% relative humidity and weighed periodically. For wet<br />
cup method sealed cup containing water was placed in an environment with 50% relative<br />
humidity. The measurements were done at 25 C in a period of two weeks. The steady state<br />
values of mass gain or mass loss determined by linear regression for the last five readings were<br />
used for the determination of water vapor transport properties.<br />
The water vapor diffusion coefficient D [m 2 s ‐1 ] was calculated from the measured data<br />
according to the equation<br />
m<br />
d R T<br />
D <br />
. (3)<br />
S <br />
M p<br />
p<br />
where m is the amount of water vapor diffused through the sample [kg]. d the sample<br />
thickness [m]. S the specimen surface [m 2 ]. the period of time corresponding to the transport<br />
of mass of water vapor m [s]. pp the difference between partial water vapor pressure in the<br />
air under and above specific specimen surface [Pa]. R the universal gas constant. M the molar<br />
mass of water. T the absolute temperature [K].<br />
On the basis of the water vapor diffusion coefficient D the water vapor diffusion permeability δ<br />
[s] and the water vapor diffusion resistance factor [‐] were determined.<br />
D a<br />
M<br />
D ., <br />
(4)<br />
RT D<br />
where Da is the diffusion coefficient of water vapor in the air.<br />
In the experimental work 3 cylindrical specimens with the diameter 105 mm and thickness 20<br />
mm were used.<br />
243
4. Experimental Results<br />
4.1 Basic Physical Properties<br />
The basic physical properties of studied materials measured by the water vacuum saturation<br />
method are shown in Table 3. The bulk density of the analyzed concretes decreased with the<br />
increasing amount of natural zeolites. The open porosity increased in the corresponding way.<br />
The values of matrix density were almost the same (within a 3% limit) for all studied concretes.<br />
4.2 Mechanical Properties<br />
244<br />
Table 3: Basic Physical Properties of Studied Materials<br />
HPC [kg m ‐3 ] mat [kg m ‐3 ] [%]<br />
BZ‐ref 2244 2590 0.134<br />
BZ10 2194 2601 0.157<br />
BZ20 2132 2601 0.180<br />
BZ30 2036 2623 0.224<br />
Figure 1 shows that the compressive strength of studied concretes decreased with the increasing<br />
amount of natural zeolites used as the replacement of Portland cement. The 7‐days strengths<br />
were similar for the reference concrete and BZ10. For higher amounts of natural zeolites in the<br />
mix the compressive strength was significantly lower which was an expected outcome. taking<br />
into account the pozzolanic properties of zeolites. The values of compressive strength after 28<br />
days showed that up to the 20% replacement level the concretes still maintained their high<br />
performance character but for BZ40 a 50% decrease was observed which was not satisfactory.<br />
The differences in compressive strength after 360 days were very similar to 28 days.<br />
4.3 Hydric Properties<br />
Figure 1: Compressive Strength of Studied Materials<br />
4.3.1 Water Transport Properties<br />
The results of water sorptivity measurements are presented in Table 4. We can see that the<br />
increase of open porosity with increasing mass of pozzolanic admixtures led to a significant
enhancement of liquid water transport. The moisture diffusivity of BZ40 was about five times<br />
higher than reference concrete. Similarly as with the compressive strength. 20% replacement<br />
level could be considered a reasonable limit. as for the liquid water transport parameters..<br />
Table 4: Water Transport Properties of Studied Materials<br />
HPC [kg m ‐2 s ‐1/2 ] [m 2 s ‐1 ]<br />
BZ‐ref 2244 2590<br />
BZ10 2194 2601<br />
BZ20 2132 2601<br />
BZ30 2036 2623<br />
4.3.2 Water Vapor Transport Properties<br />
Table 5 shows that the water vapor diffusion coefficient of studied materials increased with<br />
increasing amount of natural zeolites in the mix which was in accordance with the open<br />
porosity data in Table 3. The measured data also revealed that the values of water vapor<br />
diffusion coefficient corresponding to the lower values of relative humidity (5/50 %) were<br />
always lower than those for higher relative humidity values (97/50 %). This is related to the<br />
partial transport of capillary condensed water in the wet‐cup arrangement [14].<br />
Table 5: Water Vapor Transport Properties of Studied Materials<br />
HPC<br />
5. Conclusions<br />
5/50% 97/50%<br />
[s] D [m 2 s ‐1 ] [‐] [s] D [m 2 s ‐1 ] [‐]<br />
BZ‐ref 1.58.10 ‐12 2.18.10 ‐7 106.69 1.92.10‐12 2.64.10 ‐7 89.75<br />
BZ10 2.05.10 ‐12 2.82.10 ‐7 81.87 2.43.10‐12 3.34.10 ‐7 68.87<br />
BZ20 2.85.10 ‐12 3.92.10 ‐7 58.78 3.57.10‐12 4.91.10 ‐7 49.45<br />
BZ40 4.72.10 ‐12 6.49.10 ‐7 35.42 6.51.10‐12 8.95.10 ‐7 29.80<br />
Experimental results presented in this paper confirmed that natural zeolites can be considered<br />
an environmental friendly binder with a potential to replace a part of Portland cement in<br />
concrete in building industry. However. it was shown that although from both environmental<br />
and economical points of view it would be desirable to use its highest possible amounts in<br />
concrete production. the extent of Portland cement replacement which could be chosen in<br />
preparation of high performance concrete mixes had certain limitations. The main limiting<br />
parameter was found the compressive strength. For higher replacement levels than 20% of mass<br />
of cement the compressive strength decreased very fast and the produced concrete lost its high<br />
performance character. The water transport parameters increased with increasing amount of<br />
zeolites in the mix relatively fast but for the replacement level up to 20% they could still be<br />
considered satisfactory. Water vapor transport parameters increased with the increasing<br />
amount of natural zeolites as well but the enhanced water vapor transport did not present any<br />
danger from the point of view of concrete durability. In a summary. we can state that concrete<br />
with the replacement of Portland cement by natural zeolites in the amount of 20% by mass was<br />
the most suitable solution among the mixes analyzed in this paper.<br />
245
Acknowledgements<br />
This research has been supported by the Ministry of Education. Youth and Sports of the Czech<br />
Republic. under project No MSM: 6840770031.<br />
References<br />
[1] FRANGOULIS. D. – CHANIOTAKIS. E. – STAMATAKIS. M. G. Zeolitic Tuffs of Kimolos<br />
Island. Aegean Sea. Greece and Their Industrial Potential. In: Cement and Concrete<br />
Research. 27. 2007. pp. 889‐905.<br />
[2] CANPOLAT. F. – YILMAZ. K. – KOESE. M. M. – SUEMER. M. – YURDUSEY. M. A. Use<br />
of zeolite. coal bottom ash and fly ash as replacement materials in cement production. In:<br />
Cement and Concrete Research. 34. 2004. pp. 731–735.<br />
[3] HARBERT. G. – CHOUPAY. N. – MONTEL. J. M. – GUILLAUME. D. – ESCADEILLAS.<br />
G. Effects of the secondary minerals of the natural pozzolans on their pozzolanic activity.<br />
In: Cement and Concrete Research. 38. 2008. pp. 963–975.<br />
[4] CAPUTO. D. – LIGUORI. B. – COLELLA. C. Some advances in understanding the<br />
pozzolanic activity of zeolites: The effect of zeolite structure. In: Cement & Concrete<br />
Composites. 30. 2008. pp. 455–462.<br />
[5] MERTENS. G. ‐ SNELLINGS. R. ‐ VAN BALEN. K. ‐ BICER‐SIMSIR. B. ‐ VERLOOY. P. ‐<br />
ELSEN. J. Pozzolanic reactions of common natural zeolites with lime and parameters<br />
affecting their reactivity. In: Cement and Concrete Research. 39. 2009. pp. 233–240.<br />
[6] CHAN. S. Y. N. ‐ JI. X. Comparative study of the initial surface absorption and chloride<br />
diffusion of high performance zeolite. silica fume and PFA concretes. In: Cement &<br />
Concrete Composites. 21. 1999. pp. 293‐300.<br />
[7] IKOTUN. B. D. ‐ EKOLU. S. Strength and durability effect of modified zeolite additive on<br />
concrete properties. In: Construction and Building Materials. 24. 2010. pp. 749‐757.<br />
[8] AHMADI. B. ‐ SHEKARCHI. M. Use of natural zeolite as a supplementary cementitious<br />
material. In: Cement & Concrete Composites. 32. 2010. pp. 134‐141.<br />
[9] KARAKURT. C. ‐ KURAMA. H. ‐ TOPCU. I.B.. Utilization of natural zeolite in aerated<br />
concrete production. In: Cement & Concrete Composites. 32. 2010. pp. 1–8.<br />
[10] ROELS. S. ‐ CARMELIET. J. ‐ HENS. H. ‐ ADAN. O. ‐ BROCKEN. H. ‐ ČERNÝ. R. ‐<br />
PAVLÍK. Z. ‐ HALL. C. ‐ KUMARAN. K. ‐ PEL. L. ‐ PLAGGE. R. Interlaboratory<br />
Comparison of Hygric Properties of Porous Building Materials. Journal of Thermal Envelope<br />
and Building Science. 27. 2004. pp. 307‐325.<br />
[11] ČSN EN 12390‐3. Testing of hardened concrete – Part 3: Compressive strength. Czech<br />
Standardization Institute: Prague. 2002.<br />
[12] KUMARAN. M. K. Moisture diffusivity of building materials from water absorption<br />
measurements. Journal of Thermal Envelope and Building Science. 22. 1999. pp. 349‐355.<br />
[13] ROELS. S. ‐ CARMELIET. J. ‐ HENS. H. ‐ ADAN. O. ‐ BROCKEN. H. ‐ ČERNÝ. R. ‐<br />
PAVLÍK. Z. ‐ HALL. C. ‐ KUMARAN. K. ‐ PEL. L. ‐ PLAGGE. R. Interlaboratory<br />
Comparison of Hygric Properties of Porous Building Materials. Journal of Thermal Envelope<br />
and Building Science. 27. 2004. pp. 307‐325.<br />
[14] ČERNÝ. R. ‐ ROVNANÍKOVÁ. P. Transport Processes in Concrete. Spon Press: London.<br />
2002.<br />
246
Determination of the thermal diffusivity of paint and the<br />
thickness of a paint layer by photothermal IR thermography<br />
Bert Verstraeten, Jichuan Xiong and Christ Glorieux<br />
Laboratorium voor Akoestiek en Thermische Fysica. Department of Physics and Astronomy.<br />
Celestijnenlaan 200D. B3001 Heverlee. Belgium<br />
Abstract: Since the thermal characterization of thin layers requires the thermal diffusion length to be of<br />
the order of the layer thickness. measurement on a short enough time scale is necessary. In this paper. an<br />
all‐optical technique is presented. in which both the photothermal excitation part and the optical detection<br />
part are sufficiently fast. with a geometry adapted to the specific properties of the sample of interest. i.e. a<br />
bulk paint sample. and a sub‐mm layer of paint on a steel substrate. The thermal diffusivity of the paint<br />
was determined in the framework of the development of a non‐contact photothermal thermography<br />
method for real‐time determining its thickness during spraying. The feasibility of the latter approach is<br />
experimentally confirmed.<br />
Keywords: Photothermal method. thin layer. thermal diffusivity. paint.<br />
1. Introduction<br />
The all‐optical approach of photothermal methods has made them very popular and powerful<br />
tools for thermally characterizing thin layers. The bandwidth of the optical excitation and<br />
detection used in photothermal methods is so high that they achieve a time resolution well<br />
beyond what is needed to monitor heat transport occurring over very short distances and thus<br />
to study parts of very small structures. Roughly speaking. the length over which heat can<br />
diffuse in a time t. the socalled thermal length . is given by =(t) 1/2 . with [m 2 .s ‐1 ] the<br />
material’s thermal diffusivity. which reflects how well heat can diffuse through it [1].<br />
In this article. we verify the feasibility of a dedicated photothermal technique to determine the<br />
thermal diffusivity of a bulk paint sample. The research is performed in the framework of the<br />
development of a method to determine by non‐contact IR thermography or IR radiometry the<br />
thickness of paint layers on steel. Since the limitations and experimental parameters to be used<br />
to tackle this task are strongly dependent on the thermal diffusivity of the paint. knowledge of<br />
its value is crucial to assess the feasibility of the method. Both the method to determine the<br />
thermal diffusivity of paint and the method to determine the thickness of paint are<br />
experimentally demonstrated.<br />
2. Measurement principle<br />
In order to determine the thermal diffusivity of the paint. we have illuminated the surface of a<br />
(7 cm thick) ‘thermally thick’ (i.e. sufficiently thick so that the heat. produced at the top surface<br />
of the paint. did not have sufficient time to reach the bottom of the paint) volume of paint. The<br />
light was coming from a Coherent FAP System laser (30 Watt maximum power) set to about 5<br />
Watt power and a wavelength of 810 nm. and focused to a strip of light (further referred to as<br />
the ‘laser line’) of 4 mm width and 12 mm length.<br />
In the chosen experimental approach. when switching on the laser light. the illuminated strip<br />
was heating up. and the heat started to gradually diffuse out of the illuminated region. An IR<br />
247
camera (CEDIP JADE UC J330R. 8‐12 micron. 80mK@F/0.8@30C typical. 14 bits. 320x240 pixels)<br />
with a sampling frequency of 50 Hz was monitoring the optically accessible part of the sample<br />
surface on and around the laser line. The camera was detecting the IR radiation emitted by the<br />
paint. which is proportional with its change of temperature.<br />
By fitting the time dependence of the dynamically changing temperature field. in particular of<br />
the width on half maximum. d(t). around the laser line (width d0). to a simple theoretical model.<br />
the thermal diffusivity verf can be determined. In practice we did not fit the evolution of every<br />
pixel. but. equivalently. the evolution of the temperature at different distances of the laser line<br />
along lines parallel with the laser line. The fit also took into account the finite width of the laser<br />
line itself. The spreading out of heat around the hot line was mapped directly. via d(t). which<br />
2 2 2<br />
relates directly to the thermal diffusivity. via dt () d0 () t d0 paintt<br />
.<br />
Figure 1: Photo of the measurement setup. A heating IR laser beam is imaged onto the surface of the dark<br />
blue paint via an optical fiber. a spherical and a cylindrical lens. and a mirror. The IR camera on the top<br />
left is monitoring the evolution of the temperature field in the vicinity of the hot line.<br />
248
3. Experimental results and analysis<br />
0<br />
4 5 6 7 8 9 10<br />
time after heating step (s)<br />
Figure 2: Evolution of the effective thermal diffusivity. paint. effective(t). determined from the evolution<br />
of d(t). the instantaneous width at half maximum of the spreading warm line. according to the expression.<br />
2 2<br />
paint,effective() t d () t d0with d0 the width of the laser line.<br />
T 1/2 max (a.u.)<br />
thermal diffusivity (m 2 /s)<br />
x 10-7<br />
1.5<br />
0.5<br />
Figure 3: Evolution of the temperature at half maximum of the spreading warm region.<br />
Figures 2 shows the evolution of the temperature at half maximum of the spreading warm area.<br />
During the continuous heating. the heat is steadily spreading out. with a rate that is related to<br />
the thermal diffusivity. The experimental data are contained in between the curves<br />
corresponding to the ‐30% and +30% deviating values compared to the best fitting value.<br />
The mean value of the effective instantaneous thermal diffusivity in Figure 2. calculated as<br />
2 2<br />
() t d () t d . is expected to correspond with the real thermal diffusivity. and was<br />
paint,effective 0<br />
determined at paint=(0.80.3).10 ‐7 m2 .s ‐1 .<br />
1<br />
0.8<br />
0.6<br />
0.4<br />
0.2<br />
1<br />
0<br />
0 2 4 6<br />
time (s)<br />
8 10 12<br />
T/T max (a.u.)<br />
1<br />
0.8<br />
0.6<br />
0.4<br />
0.2<br />
experimental data<br />
best fit<br />
+30 %<br />
-30 %<br />
110 µm<br />
385 µm<br />
480 µm<br />
0<br />
-0.5 0 0.5 1<br />
time (s)<br />
1.5 2<br />
Figure 4: Experimental evolution of the IR thermographic signal (normalized to its maximum value)<br />
during and after a 200 ms illumination period. The signal. which was taken from the warmest pixel of the<br />
IR camera. in the middle of the laser spot. is roughly proportional to the local temperature. For the used<br />
laser power and spot size. the maximum temperature increase was about 10 Kelvin.<br />
249
As mentioned in the introduction. for a paint layer with a given thermal diffusivity. IR<br />
thermography can also be used to determine the layer thickness. This is illustrated in Figure 4.<br />
Paint layers of different thickness were illuminated by a 4 Watt laser spot of 8 mm diameter.<br />
The evolution of the signal at the warmest pixel of the IR thermographic image during and after<br />
200 milliseconds of illumination is monotonically depending on the thickness of the paint layer.<br />
The thinner the layer. the quicker the heat produced by illuminating the paint surface is<br />
reaching the steel background. Since steel has a higher thermal effusivity than paint. the<br />
presence of steel is accelerating the decay of the temperature. The result demonstrates that.<br />
provided a proper calibration. the temperature decay rate after the end of the illumination pulse<br />
can be used to determine the paint thickness in a non‐contact. all‐optical way. For similar work<br />
on IR thermographic determination and other photothermal determination techniques of<br />
thermal properties of materials and layers. we refer to [2].[3].[4].[5].[6] and references therein.<br />
Acknowledgments<br />
This research was financially supported by KU Leuven. Belgium (research project<br />
OT/11/064).<br />
References<br />
[1] CARSLAW. H. S. – JAEGER. J. C. Conduction of Heat in Solids. 2. Ed. Clarendon Press.<br />
London. 2003 . pp. 510. ISBN 0‐19‐853368‐3<br />
[2] “Thermal characterization of anisotropic media in photothermal point. line and grating<br />
configuration”. G. KALOGIANNAKIS. S. LONGUEMART. J. RAVI. A. OKASHA. D.<br />
VAN HEMELRIJCK and C. GLORIEUX. J. Appl. Phys. 100. 063521 (1‐12)(2006)<br />
[3] “Thermal properties of paint coatings on different backings using a scanning<br />
photoacoustic technique”. O. RAGHU and J. PHILIP. Meas. Sci. Technol. 17. 2945–2949<br />
(2006)<br />
[4] “A compact. portable wet paint thermal wave thickness monitor”. JEFFREY P SARGENT<br />
and SIMON CHURCH. www.ndt.net/article/ecndt2010/reports/1_05_14.pdf. last viewed<br />
on 21/8/<strong>2012</strong><br />
[5] “Thermal diffusivity measurement of black and metallic graphite paint coatings”. M.M.<br />
MOKSIN. I.V. GROZESCU. Z.A. WAHAB and W.M.M. YUNUS. Meas. Sci. Technol. 10.<br />
7–10 (1999)<br />
[6] “Investigation of thermal touch response of coated steel plates employing square wave<br />
excited photothermal infrared radiometry”. PREETHY MENON. RAVINDRAN RAJESH.<br />
JICHUAN XIONG and CHRIST GLORIEUX. Int. J. Thermophys. <strong>2012</strong>. DOI:<br />
10.1007/s10765‐012‐1240‐y<br />
250
Monitoring of concrete setting and hardening by<br />
thermophysical measurements<br />
Viliam Vretenár, Ľudovít Kubičár, Vlastimil Boháč<br />
Institute of Physics SAS, Dúbravská cesta 9, 845 11 Bratislava, Slovakia<br />
Abstract: Transient regime of Hot‐ball method is used for measurement of thermophysical properties,<br />
namely, thermal diffusivity, specific heat and thermal conductivity, of concrete during the setting and<br />
hardening processes. Setting time determines the end of workability of fresh concrete, whereas the<br />
hardening corresponds with compressive strength of finally hardened concrete. The method together with<br />
laboratory experimental apparatus is presented and tested. Variation of thermophysical parameters is<br />
measured as a function of time and analysis for given concrete sample is carried out. The results that<br />
satisfy to undergoing theory are discussed.<br />
Keywords: concrete, thermophysical properties, Hot‐ball method, setting, hardening<br />
1. Introduction<br />
Concrete is the most frequently used material in building industry considering its strength, a<br />
possibility to form required shapes, volume stability, durability, resistance to high temperatures<br />
and resistance to chemical substance attacks. A broad range of concretes exists that can be<br />
divided to various classes considering different criteria like strength, density, thermal isolation,<br />
waterproof ability, fireproof ability, etc. Different additives are used to improve the concrete<br />
properties. Such broad scales of concretes are reached using various technologies where final<br />
quality is determined by material components and concrete mixture composition. Important<br />
technical characteristics of hardened concrete depend on the way of workability of fresh<br />
mixture and on curing conditions of the fresh concrete. Utility properties of concrete are<br />
significantly influenced by the quality and quantity of the formed hydration products, and<br />
consequently by the developed pore structure. Both are conditioned by concrete material<br />
composition, the way of its manufacturing, compacting and initial curing, taking into<br />
consideration the present climatic conditions. In the case of transport concrete also conditions of<br />
concreting and finishing on the construction site are very important [1–5]. Lifespan of concrete<br />
is influenced by the following processes:<br />
‐setting of the concrete mixture, i.e. transformation from the fresh concrete grout to solid state<br />
based on initial hydration,<br />
‐hardening and the concrete long‐term exposition in the environment at the place of use, e.g. at<br />
industrial agglomerations one would take into account higher degree by CO2 and SO2 attack,<br />
‐concrete degradation during long‐term exposition in different aggressive environments like<br />
demineralized water, acid, sulphate, magnesium ammonia waters and soils, or gaseous and/or<br />
liquid industrial air pollutants, or dynamical load factors.<br />
Modern technology requires a full control of the above mentioned processes. This can be<br />
achieved by monitoring of the suitable parameters that characterize the mentioned processes. A<br />
broad scale of techniques exist that monitor setting of the concrete mixtures [1–9]. Techniques<br />
are used in laboratory usually. Determinations of the concrete workability, formation of<br />
251
hydration heat, compressive strength and elasticity module, belong to the most frequently used<br />
laboratory techniques that are applied to characterize qualitative parameters of the concrete.<br />
Acousto‐ultrasonic techniques, methods for measuring of AC and DC electrical conductivity or<br />
pH as well as some microwave techniques are the most frequently used methods for monitoring<br />
concrete behaviour in the field [1–9]. The listed techniques are suitable for mixtures as well as<br />
for solids. The scanned signal correlates to immobilization of the free ions or to content of water<br />
in pores as well as to increase of the elastic constants in the process of setting and hardening.<br />
A Hot‐ball sensor of thermal conductivity has been recently designed and constructed in our<br />
laboratory [10]. Introduction tests of this sensor on polymerization and on moisture monitoring<br />
in porous structures have been performed [11, 12]. In order to employ such sensor for<br />
monitoring of concrete processes, the complete set of thermophysical parameters is necessary to<br />
be measured. The working equation of the Hot‐ball method is thus chosen to evaluate whole<br />
transient part of temperature response in contrast with steady‐state approach of thermal<br />
conductivity measurement. The principle of such sensors lies in the measurement of<br />
temperature fields, which are less influenced by free ions in comparison to electric or magnetic<br />
fields and thus gained information is more objective.<br />
The final target of our work is aimed at the measurement and prediction of utility properties of<br />
concretes, mainly the compressive strength and Young’s modulus of elasticity by using the<br />
probes enabling measurements of thermophysical quantities in fresh, still plastic concrete and<br />
the recently hardened concrete in the horizon of few days from the date of concrete<br />
manufacture. Rapid and efficient prediction of concrete utility properties in the constructions is<br />
also the subject of the public order and also is testified by the building practice interest.<br />
2. Hot‐ball sensor<br />
The working principle of the thermophysical sensor might be described as follows (Figure 1,<br />
left). Concrete mixture is in local thermodynamic equilibrium. A heat source is placed inside the<br />
concrete mixture at the suitable place that starts to generate a constant heat flux, i.e. a small<br />
disturbance is generated. A suitable place is such a position in the sample volume, where the<br />
peripheral parts or any possible structural elements do not affect significantly the measurement<br />
process. Response to this small disturbance is the local temperature change that is function of<br />
time and place. Use of appropriate mathematical models that correspond to sensor<br />
configuration, the thermophysical parameters can be evaluated. The model of hot ball of real<br />
heat capacity with perfect thermal contact was considered and details were described in [10].<br />
252<br />
Figure 1: Schematic sketch of Hot‐ball method (left) and picture of real sensor (right)
A hot‐ball sensor (Figure 1, right) has been constructed consisting of two elements, a heater and<br />
a thermometer (patent pending). Both elements are fixed in the metallic ball using highly<br />
thermal conductive epoxy resin. The diameter of the hot balls was 3 mm. The individual<br />
thermophysical parameters as thermal diffusivity, specific heat and thermal conductivity are<br />
calculated using an appropriate fitting algorithm (Levenberg–Marquardt) upon temperature<br />
response.<br />
3. Experimental apparatus<br />
The measurements have been carried out by laboratory system for the thermophysical sensors<br />
testing (Figure 2). Concrete samples were temperature stabilized in measuring chamber<br />
RTB1.01 (Transient MS) and controlled by thermostat Lauda MK20 having accuracy of ±0.01°C<br />
and temperature range from ‐40 to 170 °C. For heat flow generated in the hot ball the precise<br />
source meter Keithley 2400 (up to 1 A and 200 V) was employed. Highly sensitive digital<br />
multimeter Keitley 2010 measured the temperature response. PC with custom software<br />
developed in our laboratory (TMS ver. 1.4) controlled all units.<br />
Figure 2: Picture of laboratory system for the measurement of thermophysical properties of solids and<br />
liquids in the temperature range from ‐40 up to 170 °C<br />
4. Experiments and results<br />
As initial study we decided to use commercial product Hobby Concrete (Baumit) for<br />
preparation of concrete samples. For each experiment, 800 g of dry concrete mixture was mixed<br />
with 100ml of tap water and stirred at least for 10 minutes. Then the densification process<br />
followed. The hot ball sensor was immersed into middle position of such mixture and fixed.<br />
The temperature was kept at 25°C during the all monitoring process. In Figure 3 the typical<br />
temperature response is depicted together with numerical fitting analysis. Good agreement<br />
between model and experiment itself is clearly visible.<br />
253
254<br />
Figure 3: Typical temperature response during the measurements<br />
Our methodology is based on thermodynamic and heat transport principles. Debye theory<br />
gives equation for thermal conductivity λ in a form<br />
aC , (1)<br />
ac p<br />
Temperature [ o C]<br />
0.4<br />
0.3<br />
0.2<br />
0.1<br />
0.0<br />
0 5 10 15 20<br />
Time [s]<br />
measured data<br />
fitted model<br />
where a is thermal diffusivity, cp is specific heat, ρ is density and C is heat capacity. While heat<br />
capacity gives us information on thermodynamic, i.e. on hydration, the thermal diffusivity<br />
gives us information how fast the temperature field is spreading over material. Using relation<br />
1<br />
a vl<br />
, (2)<br />
3<br />
where v is mean velocity of the ultrasound waves and l is mean free path of phonons, we may<br />
calculate the mean velocity of ultrasound waves, which is related to elastic constants and thus<br />
to stiffness of concrete under investigation [13]. The configuration component of the heat<br />
capacity strongly changes in concrete setting period. In addition, transversal components of the<br />
spread of ultrasound waves that are related to shear module increase in setting period. The<br />
thermal conductivity is complex parameter that includes information on both, the change of<br />
configuration component as well as material stiffness. Since the thermal diffusivity increases<br />
and vice versa the specific heat decreases due to solidification of concrete, interpretation of the<br />
thermal conductivity change might be misleading.<br />
Typical dependence of individual thermophysical parameters on time of concrete ageing is<br />
shown in Figure 4. As expected, the thermal diffusivity is increasing over time, whereas there is<br />
a distinct decrease of the specific heat. The thermal conductivity as a product of both<br />
parameters, is slightly increasing over the early stage of concrete setting, but finally it is<br />
decreasing after 20 hours. After detailed inspection it was found that several processes could be<br />
identified over the time. First phase includes dissolving of reactants, initial hydration and<br />
nucleation of isolated C‐S‐H gel products (highlighted by blue region). The significant increase<br />
of the number of degrees of freedom in the system by dissolving of cement particles (decreases<br />
ratio of solid phases) results in an increase of heat capacity. The percolation phenomenon takes
place when the creation of C‐S‐H gel products gets intensified and results in concrete setting<br />
(red region). Since this phase is declared as most active, the biggest changes of measured values<br />
are observed directly in this region. The last phase is connected with long term process of<br />
concrete hardening, lasting for some concrete mixtures up to hundreds of days. Of course, the<br />
process of degradation is then co‐acting as well.<br />
Thermal diffusivity [m 2 s -1 ]<br />
Specific heat [J kg -1 K -1 ]<br />
Thermal conductivity [W m -1 K -1 ]<br />
1.1x10 -6<br />
1.0x10 -6<br />
9.0x10 -7<br />
8.0x10 -7<br />
650<br />
600<br />
550<br />
500<br />
1.34<br />
1.32<br />
1.30<br />
1.28<br />
1.26<br />
Dissolving of reactants, hydration and nucleation<br />
Creation of C‐S‐H gel products and percolation<br />
Concrete setting<br />
Concrete hardening<br />
0 20 40 60 80 100 120 140 160<br />
Time [hour]<br />
Figure 4: Thermophysical parameters as a function of concrete ageing<br />
During the setting phase, there is a significant swing of measured values denoted by red arrow<br />
in Figure 4. This disturbance (or anomaly) was measured in all performed experiments, and<br />
thus the possible measurement error was excluded in this way. Probably, some physical or<br />
chemical process as phase change or chemical reaction, are occurring there. As a hypothesis one<br />
can imagine that the re‐crystallization of C‐S‐H products might take a place. Nevertheless, it is<br />
interesting phenomena for further investigation and study.<br />
255
5. Conclusion<br />
The new technique for monitoring of the concrete setting and hardening along with the<br />
methodology of measurement has been presented. Hot‐ball sensor for measuring of all three<br />
thermophysical parameters has been successfully designed and tested. The measured variations<br />
of such parameters positively correlate with effect of setting and hardening of concrete mixture.<br />
The development of new concrete mixtures needs a range of productive testing techniques that<br />
clearly differentiate the technical parameters of concrete. The present testing technique<br />
increases the segment of tests, which has so far been limited in terms of sample size and the<br />
time required for measurement.<br />
Acknowledgments<br />
This work was supported by the Slovak Research and Development Agency under the contract<br />
No. APVV‐0641‐10 and by the Scientific Grant Agency of Ministry of Slovak Republic and<br />
Slovak Academy of Sciences, projects VEGA 2/0190/12 and VEGA 2/0182/12.<br />
References<br />
[1] GARBOCZI, E.J. ‐ BENTZ, D.P. ‐ Snyder, K.A. ‐ MARTYS, N.S. ‐ STUTZMAN, P.E. ‐<br />
FERRARIS, C.F. ‐ BULLARD, J.W. Modeling and Measuring the Structure and Properties<br />
of Cement‐Based Materials, http://ciks.cbt.nist.gov/garbocz/monograph/tablecontents<br />
.html, Materials and Construction Research Division Building and Fire Research<br />
Laboratory National Institute of Standards and Technology, USA, 1998<br />
[2] ZHANG, H. ‐ STRUBLE, L. ‐ KIM, T.Y. Setting of Cement and Concrete, Journal of<br />
Cement, Concrete and Aggregates. 2001. 23(2). DOI 10.1520/CCA10480J<br />
[3] GLIŠIC, B. ‐ SIMON, N. Monitoring of concrete at very early age using stiff SOFO sensor.<br />
Cement & cement composites. 2000. 22.p. 115‐119<br />
[4] LUŠÁK, M. ‐ KUSÁK, I. ‐ PAZDERA, L. ‐ BÍLEK, V. Sledování hydratace betonu v<br />
odlišném prostedí metodou impedantní spektroskopie. Zbornik 37. medzinarodni<br />
conference Defektoskopie 2007. 2007.p. 142‐146<br />
[5] DARQUENNNES, A. ‐ STAQUET, S. ‐ ESPION, B. ‐ GERMAIN, O. ‐ PIERRE, Ch.<br />
Comparison between different techniques for monitoring setting and hardening of<br />
concrete. NDTC”09. Non‐destructive testing in civil engineering. Nantes, France. 2009<br />
[6] GABRIJEL, I. ‐ MIKULIC, D. ‐ BIJELIC, N. Ultrasonic Characterization of Cement<br />
Composites During Hydration, Tehnicki Vjesnik‐Technical Gazette. 2010. 17(4). ISSN<br />
1330‐3651<br />
[7] PHILIPPIDIS, T.P. ‐ AGGELIS, D.G. An acousto‐ultrasonic approach for the determination<br />
of water‐to‐cement ratio in concrete. Cement and Concrete Research. 2003. 33(4). p. 525‐<br />
538. DOI 10.1016/S0008‐8846(02)00999‐7<br />
[8] KIM, B.Ch. ‐ KIM, J.Y. Characterization of ultrasonic properties of concrete. Mechanics<br />
Research Communications. 2009. 36(2). p. 20‐214. DOI 10.1016/j.mechrescom.2008.07.003<br />
256
[9] REINHARDT, H.W. ‐ GROSSE, C.U. Continuous monitoring of setting and hardening of<br />
mortar and concrete. Construction and Building Materials. 2004. 18(3). p. 145‐154. DOI<br />
10.1016/j.conbuildmat.2003.10.002<br />
[10] KUBIČÁR, Ľ. ‐ VRETENÁR, V. ‐ ŠTOFANIK, V. ‐ BOHÁČ, V. Hot ball method for<br />
measuring thermal conductivity. Int. J of <strong>Thermophysics</strong>. 2010. 31(10). p. 1904‐1918. DOI<br />
10.1007/s10765‐008‐0544‐4<br />
[11] KUBIČÁR, Ľ. ‐ ŠTOFANIK, V. ‐ BOHÁČ, V. ‐ BÁGEĽ, Ľ. The hot ball sensor: Application<br />
in measurement of moisture. Innovative Feuchtungmessung in Forschung und Praxis 3,<br />
Berrichtsband Workshop 2007. Aedificatio Verlag. 2007. p. 29‐36<br />
[12] KUBIČÁR, L. ‐ ANIBARRO, C.C. ‐ VRETENÁR, V. ‐ DIEŠKA, P. ‐ NOVÁK, I. ‐ CHODÁK,<br />
I. Monitoring of Epoxy Curing by a Thermal‐Conductivity Sensor Based on the Hot‐Ball<br />
Transient Method. In Int J Thermophys. <strong>2012</strong>. 33. p. 1164 ‐ 1176. ISSN 0195‐928X<br />
[13] GRIMVALL, G. Thermophysical properties of materials, North‐Holland, 1986, pp. 444.<br />
ISBN 978‐0444827944<br />
257
258<br />
Study of PCM material diffusivity<br />
Oldrich Zmeskal 1 , Lenka Dohnalova 1 , Stanislav Nespurek 1,2<br />
1 Brno University of Technology. Faculty of Chemistry. Purkynova 118. CZ‐612 00 Brno.<br />
CZECH REPUBLIC. zmeskal@fch.vutbr.cz<br />
2 Institute of Macromolecular Chemistry AS CR. Heyrovského nám. 2.<br />
162 06 Praha 6. CZECH REPUBLIC. nespurek@imc.cas.cz<br />
Abstract: The paper deals with the application of multi‐regression analysis for the determination of<br />
thermal parameters from transient responses to step wise heat power imput. The dependences of thermal<br />
diffusivity a. thermal conductivity . heat source quality parameter s. and heat losses parameter R on<br />
time were calculated from different parts of transient responses. The influence of the heat source fractal<br />
dimension D (determined from the heat source quality parameter s) on thermal parameters is discussed.<br />
The results correlate with the fractal model of heat transport. The dependences of thermal diffusivity on<br />
the fractal dimension of PCM differ from PMMA due to the phase change around the temperature 25 °C.<br />
Keywords: transient method. fractal model of heat transport. thermal diffusivity. thermal conductivity.<br />
specific heat<br />
1. Theoretical background<br />
1.1 General Fractal Model of Heat Transfer<br />
The model will be derived from the fractal theory of a physical field published by authors in [1].<br />
[2]. The dependence of the temperature T on the radius r of space‐time for the thermal field [3]<br />
can be written for this model as<br />
c<br />
ΔT<br />
( r)<br />
<br />
k<br />
B<br />
D<br />
E<br />
2<br />
K r<br />
D ( D E 2)<br />
where is the modified Planck constant. c is the speed of heat propagation. kB is Boltzmann’s<br />
constant. and E. D. K are Euclidean and fractal dimension and fractal measure. respectively.<br />
2 2 2 2 2 2 2<br />
If the size of the space‐time vector is rewritten as r rT<br />
c ( t t0)<br />
h c t 4a0t<br />
. where r is T<br />
2 2 2 2<br />
the radius of topological space. t is the time response delay.<br />
0<br />
h c t0<br />
rT<br />
is the square of the<br />
2<br />
corrected sample size. a0 c t0<br />
2 is the maximal value of the thermal diffusivity (for D = E). Eq.<br />
(1) can be rewritten as<br />
( D<br />
E 2)<br />
/ 2<br />
2 2<br />
K c<br />
( 4a<br />
<br />
0t)<br />
D E 2 h c t<br />
ΔT<br />
<br />
exp<br />
<br />
<br />
<br />
<br />
r ( t)<br />
. (2)<br />
kB<br />
D (<br />
D E 2)<br />
<br />
2 4a0t<br />
4a0<br />
<br />
2<br />
where x h<br />
2<br />
x<br />
( 4a0t)<br />
c t ( 4a0)<br />
and 1 x e .<br />
When the thermal diffusivity is written as a 2a 0 ( D E 2)<br />
a0<br />
( 1 s)<br />
. and the heat loss<br />
parameter as R a [ c(<br />
1 s)<br />
] . we can then write<br />
4 0<br />
Kc<br />
1 D E <br />
ΔTr<br />
( t)<br />
<br />
2k<br />
D 2<br />
B<br />
2 <br />
<br />
<br />
( D<br />
E ) / 2<br />
( D<br />
E 2)<br />
2<br />
4at exp<br />
2 <br />
4at<br />
R <br />
<br />
<br />
h<br />
2<br />
(1)<br />
4at<br />
<br />
. (3)
And finally. if we define the heat source quality parameter as s ( E D)<br />
2 ( a a0<br />
) a and the<br />
power of the heat source in relation to the thermal conductivity of the real sample<br />
(characterized by fractal dimension D) as<br />
B<br />
s<br />
P K c<br />
1 <br />
<br />
. (4)<br />
k E 2s<br />
1<br />
s <br />
we can write for the dependence of the change of temperature with on time after step‐wise<br />
heating with power P. the equation.<br />
P(<br />
4at)<br />
ΔT<br />
( t)<br />
<br />
2<br />
1s<br />
2 h 4at<br />
<br />
exp<br />
<br />
<br />
2 . (5)<br />
4at<br />
R <br />
The thermal conductivity of a real material can be written as c p a . where is its mass<br />
density and c p is the specific heat.<br />
The results for the special cases (point. linear and planar heat source – Dirac pulse) and a<br />
homogeneous infinite material are in an agreement with the theory derived from a system of<br />
differential equations. e.g. [4].<br />
1.2 Method for Evaluation of Transient Measurement<br />
The described method can be used for the determination of the real fractal model parameters.<br />
Eq. (5) using a regression method applied to<br />
1s<br />
2<br />
P(<br />
4a)<br />
<br />
h 4at<br />
y(<br />
t)<br />
ln ΔT<br />
( t)<br />
ln<br />
( 1<br />
s)<br />
lnt<br />
m 2 0 m1x1<br />
m2x<br />
2 m3x3<br />
2 <br />
<br />
. (6)<br />
<br />
4at<br />
R<br />
where x1 ln t . x2 1 t . and x3 t . From the parameters 0 m . 1 m . 2 m . and m the<br />
3<br />
thermophysical and other parameters of the measured system can be calculated: the heat source<br />
quality parameter s ( E D)<br />
2 1 m (or fractal dimension D of heat source in 3D space.<br />
1<br />
E = 3). the heat loss parameter proportional to the measured sample diameter R h m2m3<br />
. the<br />
thermal diffusivity<br />
2 2 a h 4m2<br />
. and the thermal conductivity P 2 h m1<br />
m0<br />
m2<br />
e .<br />
From the last two parameters and the known mass density . the specific heat c p ( a)<br />
can<br />
be calculated.<br />
2. Experimental<br />
The step wise method was used for measurement PMMA and PCM (Micronal ® in gypsum)<br />
materials. After a four‐hour relaxation at the reference temperature. one‐hour pulses of defined<br />
power was applied to measured sample. The arrangement of experiment was taken from [3].<br />
The experiment was realized for different initial<br />
conditions (steady state) within the temperature<br />
interval T 0 20,<br />
40 C<br />
. The responses for heating by<br />
power P = 0.01 W (PMMA. one hour heating) and<br />
cooling after switching heating off (P = –0.01 W. one<br />
Figure 1: Character of the heat pulse hour relaxation) were analyzed by three methods.<br />
259
2.1 Multi‐parametric linear analysis<br />
First were analysed the entire dependences for up and down heating [6]. The results of this<br />
analysis for T0 20C<br />
and both PMMA and PCM are presented in Figure 2 and Table 1. It is<br />
evident from the table that the fractal dimensions of heat source are higher than the dimension<br />
of planar heat source (D = 2). Then the diffusivity (and following additional parameters) are<br />
higher than the tabulated values. even if there are no differences between experimental and<br />
model dependencies (see Figure 2)<br />
Figure 2: Experimental and model dependences for PMMA and PCM for up and down measurement by<br />
step wise method in linear and logarithmic scale<br />
260<br />
Table 1: Results of multi regression analysis of transient responses (P = 0.01 W. T0=20°C)<br />
t (s) D P (W) T (°C) T (°C) a (mm 2 .s ‐1 ) R (m) (W.m ‐1 .K ‐1 ) cp (kJ.K ‐1 .kg ‐1 )<br />
PMMA tabul ‐‐‐ 2.000 ‐‐‐ ‐‐‐ ‐‐‐ 0.112 0.015 0.193 1.450<br />
PMMA<br />
PCM<br />
up 0.916 2.659 0.010 19.96 0.511 6.990 0.390 0.924 7.094<br />
down 1.140 2.634 0.010 ‐0.31 0.525 1.785 0.319 0.693 8.368<br />
up 2.815 3.165 0.017 20.19 0.416 0.544 0.807 7.491 19.850<br />
down 2.108 3.258 0.017 0.02 0.498 0.110 0.681 4.466 16.300<br />
2.2 Dragging multi‐parametric linear analysis<br />
The second method was based on the recalculation of all parameters to fractal dimension D = 2<br />
using the equation a 2a 0 ( D E 2)<br />
a0<br />
( 1 s)<br />
. see Chapter 1.1. In this case. the evaluation<br />
was performed of one hundred data by dragging multi‐parametric linear regression through<br />
the different positions in time response of change temperature. The dependences of all<br />
parameters on time were recorded. The dependences of fractal dimensions for PMMA and PCM<br />
for up and down measurement by the step wise method are given as an example in Figure 3.<br />
From these Figures. it is evident that for short times (beginning of experiment) the values are
close to the values in Table 1. But for the higher times the values dramatically differs because<br />
the losses play a significant role. At the intersection with the line of fractal dimension D = 2 are<br />
located the values of diffusivities (and all other thermal parameters the same) and their average<br />
values are in the Table 2. We can see a better agreement between the tabulated and<br />
experimental values than for the first method for PMMA (see Table 1)<br />
Figure 3: Dependences of fractal dimension of heat source calculated from different parts of transient<br />
responses for PMMA and PCM and up and down measured step wise method.<br />
Table 2: Results of multi‐regression analysis of transient responses (P = 0.01 W. T0 = 20°C)<br />
t (s) D P (W) T (°C) T (°C) a (mm 2 .s ‐1 ) R (m) (W.m ‐1 .K ‐1 ) cp (kJ.K ‐1 .kg ‐1 )<br />
PMMA tabul ‐‐‐ 2.000 ‐‐‐ ‐‐‐ ‐‐‐ 0.112 0.015 0.193 1.450<br />
PMMA<br />
PCM<br />
up 0.916 2.009 0.010 19.96 0.516 0.051 0.034 0.108 1.791<br />
down 1.040 2.002 0.010 ‐0.307 0.501 0.053 0.036 0.123 1.973<br />
up 1.672 2.005 0.017 20.193 0.416 0.116 0.052 0.310 3.853<br />
down 1.584 2.002 0.017 0.107 0.498 0.136 0.062 0.324 3.429<br />
2.3 Complex analysis of thermal diffusivity<br />
The third method is based on the analysis of thermal parameters dependences on the fractal<br />
dimension. The evaluation of all parameters was performed of one hundred data by dragging a<br />
multi‐parametric linear regression through the different positions in the time response of<br />
temperature change. The typical reciprocal dependences of thermal diffusivity on the fractal<br />
dimension (E ‐ D). where E is Euclidean dimension of space. are given in Figure 4. In an<br />
agreement with the term 1 a ( D E 2)<br />
2a<br />
0 ( 1 s)<br />
a is the dependence linear and its slope is<br />
0<br />
proportional to the reciprocal value of thermal diffusivity for homogeneous heat distribution<br />
(D = E). The horizontal dependence in Figure 4 is a slope of regression dependence ( 1 2a<br />
0 ). The<br />
cross‐section of both dependences gives information about the deviation due to the ideal case.<br />
261
262<br />
Figure 4: Dependences of reciprocal thermal diffusivity (1/a) on the fractal dimension (E‐D) for the<br />
PMMA and PCM<br />
The dependences of approximated thermal diffusivities to D = E for different temperatures and<br />
repeated independent measurements (up and down) are presented in Figure 5 for PMMA (left<br />
Figure) and PCM (right Figure). It is evident that approximated thermal diffusivities are not<br />
dependent on the temperature for PMMA. The values of approximated thermal diffusivities<br />
differs for phase change temperature (about 25 °C) and for solid (T < 25 °C) and liquid states of<br />
PCM (T > 25 °C).<br />
Figure 5: Up and down measurements of normalized thermal diffusivity (a0) for different temperatures<br />
(PMMA – left. PCM – right) for twelve independent measurements
Similar results for normalised fractal dimension (see Figure 5) are presented in Figure 6.<br />
Corresponding fractal dimension D0 is about 2.3 for PMMA for E = 3. (E – D0) ~ 0.7 and similarly<br />
the same for PCM (except for the phase change temperature which is higher. up to 2.4). (E –<br />
D0) ~ 0.6. It follows that the quality of the heat source thermal contact is for both materials<br />
similar. except for the temperature of phase change. where the added heat source is volume<br />
material.<br />
Figure 6: Up and down measurements of normalised fractal dimension (D0) for different temperatures<br />
(PMMA – left. PCM – right)<br />
The summarized results (the average values of data from Figures 5 and 6) are presented in the<br />
Figure 7 for different temperatures. Also. from this Figure (left) it is evident that the<br />
approximated value of fractal dimension are in the interval 2.3 – 2.4 and PCM maximal value of<br />
approximated fractal dimension is for temperature 25 °C. where (E – D0) ~ 0.6. It is also obvious<br />
(from Figure 7. right) that the approximated value of thermal diffusivity is about one order of<br />
magnitude higher for PCM.<br />
Figure 7: Average values of normalised fractal dimension (D0 ‐ left) and normalized thermal diffusivity<br />
(a0 ‐ right) for different temperatures<br />
The summarized results from the Figure 7 are presented at the Table 3. too. Other thermal<br />
parameters (thermal conductivity. specific heat. heat losses parameter) were determined by<br />
similar way.<br />
263
264<br />
Table 3: Thermal dependences of normalized thermal diffusivity a0 and fractal dimension D0<br />
T (°C) E ‐ D0 D0 for E = 3 a0 (mm 2 .s ‐1 ) E ‐ D0 D0 for E = 3 a0 (mm 2 .s ‐1 )<br />
20 °C 0.673 2.327 0.0221 0.684 2.316 0.148<br />
25 °C 0.688 2.312 0.0220 0.611 2.389 0.161<br />
30 °C 0.716 2.284 0.0223 0.708 2.292 0.132<br />
35 °C 0.649 2.351 0.0226 0.695 2.305 0.136<br />
40 °C 0.670 2.330 0.0223 0.695 2.305 0.135<br />
3. Conclusion<br />
Three different methods of thermal parameters determination were presented. The last one<br />
seems most appropriate to evaluate both types of experimental dependences (heating and<br />
cooling dependences). The determined parameters for PMMA give the best match with<br />
tabulated values.<br />
Acknowledgments<br />
This work was supported by the project ʺCentre for Materials Research at FCH BUTʺ No.<br />
CZ.1.05/2.1.00/01.0012 from ERDF by grant FR‐TI1/144 from the Ministry of Industry and Trade<br />
of the Czech Republic<br />
References<br />
[1] BUCHNICEK. M. – VALA. M. Thermal properties of bodies in fractal and<br />
Cantorian physics. In Chaos. Solitons & Fractals. 2005. 25(5). p. 941 ‐ 954. ISSN 0960‐<br />
0779<br />
[2] ZMESKAL. O. – VALA. M. – WEITER. M. – STEFKOVA. P. Fractal–Cantorian<br />
geometry of space‐time. In Chaos. Solitons and Fractals. 2009. 42. p. 1878 – 1892.<br />
ISSN 0960‐0779<br />
[3] ZMESKAL. O. – STEFKOVA. P. – DOHNALOVA. L. – BARINKA. R. Use of PCM<br />
Boards for Solar Cell Cooling. Int. J. Thermophys. p. 1–15. DOI 10.1007/s10765‐012‐<br />
1196‐y (<strong>2012</strong>).<br />
[4] CARSLAW. H. S. – JAEGER. J. C. Conduction of Heat in Solids. 2. Ed. Clarendon<br />
Press. London. 2003 . pp. 510. ISBN 0‐19‐853368‐3
Identification of heat transfer coefficient inside a hollow<br />
cylinder containing a gas‐dynamic control block of medium‐<br />
range ballistic missile<br />
Janusz Zmywaczyk 1 , Piotr Koniorczyk 1 , Marek Preiskorn 1 , Bogdan Machowski 1<br />
1 Faculty of Mechatronics and Aviation. Military University of Technology. Kaliskiego 2 00‐908<br />
Warsaw. Poland<br />
Abstract: The aim of this study was to estimate the heat transfer coefficients occurring on the inner and<br />
outer surfaces of a hollow steel cylinder containing the gas‐dynamic control block of a medium‐range<br />
missile during combustion of propulsion charge. During an experiment carried out on a special test stand<br />
temperatures were recorded by means of K‐type thermocouples in a number of measuring points located<br />
on the outer surface of hollow cylinder and inside it. In parallel. the combustion process was recorded<br />
with the high‐speed infrared camera Phantom V210 at 500Hz full frame rate with resolution 800 x 600<br />
pixels per frame. Based on the temperature histories measured at selected points and knowing from<br />
additional studies the thermophysical properties of the cylinder material the heat transfer coefficients were<br />
estimated using an inverse method.<br />
Keywords: inverse problem. thermophysical parameters. heat transfer coefficient<br />
1. Introduction<br />
Heat transfer by convection mode in which the energy is transferred by diffusion and the bulk<br />
motion of fluid is quantitatively described by Newtonʹs law of cooling<br />
Q = hA(Ts‐Tf) (1)<br />
where h[W/m 2 /K] is the heat transfer coefficient. A[m 2 ] is the surface area. Ts . Tf [K. 0 C] stand for<br />
temperatures of the bounded surface and fluid. respectively and Q [W] is the convective heat<br />
flux. Despite its simplicity Eq.1 is very complicated due to the heat transfer coefficient h<br />
dependency on the fluid thermal and mechanical properties within domain of boundary layers<br />
(hydromechanic and thermal) [1] . Determination of the heat transfer coefficient h is possible for<br />
simple problems in a analytical way or by using engineering formulas for the Nusselt number<br />
but for more complex problems the efficient methods are experimental studies of heat and mass<br />
transfer problems or numerical modelling of boundary‐value problems. Another approach to<br />
determining the heat transfer coefficient may be inverse methods based on minimization of a<br />
mean square functional J(h) involving the measured and computed numerically temperatures at<br />
selected locations.<br />
The subject of the present study is identification of the heat transfer coefficients (h1) inside a<br />
hollow steel cylinder containing the gas‐dynamic control block of a medium‐range missile<br />
during combustion of propulsion charge and outside it (h2) (see Fig.1). Knowledge of the heat<br />
transfer coefficients is essential to calculate the heat fluxes in radial and axial directions of the<br />
analysed component of missile which are quite difficult to measure. In addition to this the<br />
working temperature of the control unit is limited hence this work was undertaken to assess the<br />
intensity of heat exchange in the considered element of missile.<br />
265
Figure 1: View of gas‐dynamic control block (left) and a part of test stand (right)<br />
2. Experiment and results of thermophysical properties measurement of R35 steel<br />
The element of research is a central part of medium‐range ballistic missile ground to ground<br />
caliber 122mm containing a block of gas‐dynamic control shown in Fig.1. This control block<br />
enables missile guidance on target due to control its gravity center motion by means of normal<br />
forces. The control unit consists of on‐board generator that generates gas under sufficient<br />
pressure and a valve actuator which is equipped with an electromagnetic valve separating<br />
gunpowder gases into two channels where they flow out alternately in radial direction outside<br />
the hollow cylinder [4].<br />
The hollow cylinder of length H = 360mm and with inner diameter d1 = 118mm and outer d2 =<br />
122mm is made of R35 steel (AISI 1015). Temperature measurement was made in 7 points using<br />
sheathed thermocouples of K‐type each with outer diameter of 0.5mm. Four thermocouples<br />
were attached to the outer surface of gas generator evenly along its length (TC2 – TC5). one to<br />
the outer surface of the hollow cylinder (TC7) and one to the base of the block (TC6). The hot<br />
junction of thermocouple (TC1) was placed at the gas outlet from the nozzle of gas‐dynamic<br />
control. The speed and the exhaust gas temperature were recorded using high‐speed infrared<br />
camera Phantom V210 at 500Hz full frame rate with resolution 800 x 600 pixels per frame. The<br />
temperature histories TC1. TC3. TC5. TC7 recorded by K‐type thermocouples are shown in Fig.<br />
2. One can notice in Fig. 2 that the temperature of the outer surface of gas‐generator TC3<br />
reaches its maximum (about 650 0 C) at t =28s while on the outer surface of the hollow cylinder<br />
the temperature TC7 is equal to 250 0 C at t = 150s. The temperature at points TC3. TC5. TC7<br />
affects the temperature of exhaust gas TC1 which reaches it maximum twice TC1=919 0 C at t =<br />
36s and TC1 = 982 0 C at t = 103s.<br />
266
Figure 2: Temperature histories recorded by sheathed thermocouples at some locations<br />
2.1. Measurement of thermophysical properties of R35 steel<br />
Temperature characteristics of the specific heat cp(T) and the thermal diffusivity a(T) of the R35<br />
steel. which is equivalent to AISI 1015. were performed using commercial measurement stands<br />
manufactured by Netzsch: LFA‐427 for measurement of the thermal diffusivity and DSC 404 F1<br />
Pegasus for the specific heat. The test specimens were cut from a piece of hollow cylinder at the<br />
end of measurements. The specimen for the thermal diffusivity measurements was made in a<br />
form of cylinder with diameter ddyf = 12.60mm and thickness l = 2.44mm. Both faces of the<br />
specimen were sprayed from an aerosol can (~1m layer thickness) of GRAPHIT 33<br />
manufactured by CRC Industries Europe NV to make better laser pulse absorption. A typical<br />
measurement signal corresponding to the sample temperature T = 69.3 0 C is visible in Fig. 3.<br />
Figure 3: Typical for LFA‐427 measurement result of thermal diffusivity of R35 steel at T = 69.3 0C<br />
267
For determining the thermal diffusivity values of R35 steel (AISI 1015) within temperature<br />
range 33 0 C 508 0 C the Cape‐Lehmann with pulse correction theoretical model was used.<br />
Experimental investigations of the specific heat of R35 steel were carried out within<br />
temperature range 60 0 C 860 0 C using DSC 404 F1 Pegasus. The test specimen had a mass<br />
m=167.99mg and was made in a form of cylinder with diameter dCp =5.0mm. The sample was<br />
inserted into the platinum‐rhodium pan. The values of the specific heat were calculated using<br />
the method of 3‐curves. i.e. the base line. the reference sapphire and the tested specimen. The<br />
heating rate and the cooling rate amounted to 10 K/min. As an inert gas helium was used.<br />
Results of the thermal diffusivity a(T). the specific heat cp(T). the density (T) and the thermal<br />
conductivity k(T) measurements of R35 steel (AISI 1015) are given in Table 1 and shown in Figs<br />
4. 5. The thermal conductivity k(T) values were calculated as [1]<br />
k(T) = (T)a(T)cp(T) (2)<br />
and were compared with the data for AISI 1015 steel derived from the Temperature Dependent<br />
Elastic & Thermal Properties Database (MPDB) v.7.47. The values of density (T) for<br />
calculations of own results of k(T) were taken as equal to the reference ones from MPDB v.7.47.<br />
Table 1: Results of own investigations of thermophysical properties of R35 steel<br />
268<br />
T [ 0 C] a [mm 2 /s] a [mm 2 /s] cp [J/kg/K] [kg/m 3 ] k [W/m/K] kref [W/m/K]<br />
56.0 12.952 0.0554 437 7850.834 44.386 52.218<br />
69.3 12.893 0.0378 439 7847.053 44.429 52.167<br />
80.2 12.714 0.0144 442 7844.315 44.016 52.095<br />
90.3 12.574 0.015 446 7840.988 43.720 52.012<br />
101.2 12.569 0.0162 448 7838.182 43.909 51.893<br />
161.9 11.583 0.0143 464 7819.538 41.519 50.839<br />
203.6 11.014 0.0104 474 7806.713 40.135 49.791<br />
256.3 10.258 0.0102 485 7788.976 38.102 48.176<br />
309.0 9.677 0.00933 495 7771.273 36.600 46.341<br />
359.3 9.029 0.00918 505 7753.077 34.774 44.495<br />
410.4 8.257 0.00934 528 7735.179 32.509 42.589<br />
457.8 7.646 0.00882 545 7717.701 30.916 40.865<br />
508.4 7.016 0.00925 569 7699.328 29.486 39.265<br />
Figure 4: Results of own investigations of R35 (AISI 1015) steel (thermal diffusivity–left. specific heat–right)
Figure 5: Reference density values (left) and thermal conductivity own investigations vs. MPDB (right)<br />
3.. Identification of heat transfer coefficients<br />
To identify the heat transfer coefficients h1 and h2 an inverse approach was used. The following<br />
simplifying assumptions were accepted to solve the direct boundary‐value problem:<br />
2D axially‐symmetric geometry of the domain(see Fig. 2);<br />
Meddium is homogenous and isotropic;<br />
Thermal radiation is neglected;<br />
Thermophysical properties of the R35 steel are temperature dependent;<br />
Heat transfer coefficients h1 and h2 are of constant values;<br />
Temperature inside the hollow cylinder is time dependent and it is equal to the temperature of<br />
the outer surface of gas‐generator;<br />
Temperature outside the hollow cylinder is constant and is equal to the ambient temperature;<br />
Initially at time t = 0 there is a homogenous temperature distribution T0 = 29.5 0 C in the<br />
considered domain<br />
The boundary conditions of the 3 rd ‐kind were assumed at r = d1/2. r = d2/2 and z=H. The bottom<br />
surface of the hollow cylinder (z = 0) was treated as an adiabatic one.<br />
Solution of the inverse problem of 2D axially‐symmetric transient heat conduction problem can<br />
be brought up to minimization of the mean square functional J<br />
Nt<br />
<br />
n1<br />
T<br />
T<br />
2<br />
J ( h1,<br />
h2)<br />
J ( u ) [ T ( P,<br />
t ; u ) Y<br />
( P,<br />
t )] min<br />
(3)<br />
n<br />
n<br />
where T(P . tn ; u T ) is the model temperature being a solution of the direct problem at the same<br />
location P and moments tn as the measured temperatures Y(P. tn) for the currently estimated<br />
components of the vector u<br />
To solve the nonlinear direct problem the Finite Volume Method in which the ADI (alternating<br />
direction implicite) with Peaceman‐Rachford algorithm were applied. More details are given in<br />
[3]. Minimum of the mean square functional J(u T ) was searched iteratively using the Levenberg<br />
Marquardt optimization method. New components of the vector u for iteration (s+1) were<br />
calculated as [2]<br />
s1)<br />
( s)<br />
T ( s)<br />
( s)<br />
1<br />
T ( s)<br />
u u [ X ( u ) X ( u ) μ I]<br />
X ( u ) <br />
( ) Y T ( u ) <br />
( s<br />
s<br />
where X(u) stands for the sensitivity coeffcients.<br />
(4)<br />
269
The sensitivity coefficients were calculated numerically applying the central finite difference<br />
scheme<br />
270<br />
T[<br />
P,<br />
tn<br />
; u j ( 1<br />
)] T[<br />
P,<br />
tn<br />
; u j ( 1<br />
)]<br />
u idem,<br />
k <br />
2u<br />
<br />
n<br />
X i,<br />
j<br />
k<br />
j<br />
To initialize the the Levenberg Marquardt procedure (Eq. 4) of minimization the functional J(u T )<br />
the following starting values were accepted: (h1) 0 =50W/m 2 /K. (h2) 0 =10W/m 2 /K. 0 = 10 ‐3 . =10 ‐4 .<br />
The results of computation of the reduced sensitivity coefficients (hj = hj(T/hj )) and the<br />
temperature corresponding to location TC7 (see Fig. 2) after s = 6 iterations are depicted in Fig.<br />
6.<br />
Figure 6: Reduced sensitivity coefficients (left) and the computed vs. measured temperature TC7 (right)<br />
for estimated heat transfer coefficients h1 and h2.<br />
One can see in Fig. 6 that the reduced sensitivity coefficients hj reach their extreme values<br />
within the measuring time interval 0s < t < 490s. For the coeffient h1 its maximal value equals<br />
124.4 0 C at t=83s and for the coeffient h2 we have (‐73.6 0 C) at t = 241s. In addition to this it can be<br />
seen in Fig. 6 (on the right) that the finding estimates of the heat transfer coefficients obtained<br />
from the solution of inverse problem allow to achieve a relatively good temperature fitting on<br />
the outer surface of the hollow cylinder at the measuring point signed in Fig. 2 as TC7.<br />
Knowing from the solution of inverse problem the heat transfer coefficients h1 and h2 now it is<br />
poosible to calculate the heat fluxes in radial ‐ Q(r. t) and axial ‐ Q(z.t) directions. The calculated<br />
heat fluxes are presented in Fig. 7<br />
Figure 7: Heat fluxes in radial and axial directions<br />
j<br />
(5)
4. Discussion of the results and conclusions<br />
The results of estimation the heat transfer coefficients by inverse method equal h1=(83.04 1.46)<br />
W/m 2 /K and h2 = (44.02 1.03) W/m 2 /K should be regarded as average values. It should be bore<br />
in mind that while the gas‐generator is working there is not only a heat transfer but there is also<br />
a mass transfer through the hollow cylinder. The burning gunpowder in the gas‐generator<br />
emits gases which flow inside and outside the hollow cylinder changing the thickness of the<br />
boundary layers and hence the values of heat transfer coefficients. The gas velocity flowing in<br />
radial direction outside the hollow cylinder through the control nozzle (see Fig. 1) was<br />
determined to be 90 m/s as a result of analysis the frames recorded using high‐speed infrared<br />
camera Phantom V210 at 500Hz full frame rate. In this case there is a forced convection on both<br />
sides of the hollow cylinder and the estimated value of h2 = (44.02 1.03) > 10 W/m 2 /K seems to<br />
be acceptable. Despite numerous simplifying assumptions the measured and calculated<br />
temperatures at point TC7 (see Fig. 6. on the right) are relatively in good agreement. Results<br />
obtained in this work is a prelude to further study of heat and mass transfer in missile elements.<br />
Acknowledgments<br />
This work was carried out as a part of a development project OR00 003208 ʺ122mm precision<br />
missile destructionʺ supported by funds for science in 2009 – <strong>2012</strong>. Measurements of<br />
thermophysical properties were performed within the project co‐financed by the European<br />
Union through the European Regional Development Fund. ʺModernization and construction of<br />
new R&D infrastructure of Military University of Technology and Warsaw University of<br />
Technology for joint numerical and experimental study of turbine aircraft engines<br />
References<br />
[1] INCROPERA. F.P. ‐ DEWITT. D.P. ‐ BERGMAN. T.L. ‐ LAVINE. A.S. Fundamentals of<br />
heat and mass transfer. 6‐th Ed.. 2007. John Wiley & Sons. Inc.. ISBN‐13 978‐0‐471‐45728‐2<br />
[2] OZISIK. M.N. ‐ ORLANDE. H.R.B. Inverse Heat Transfer ‐ Fundamentals and<br />
Applications. Taylor & Francis. New York. 2000. ISBN 1‐56032‐838‐X<br />
[3] ZMYWACZYK. J. ‐ GAPSKI. M. Estimation of thermophysical parameters of stainless<br />
steel 1H18N9T by an inverse method. Proc. <strong>Thermophysics</strong> 2010. Valtice. Czech Republik<br />
2010. p. 253‐260. ISBN 978‐80‐214‐4166‐8<br />
[4] MACHOWSKI. B. ‐ MAKOWSKI. M. ‐ SURMA. Z. Laboratory stand for testing of<br />
dynamics of gasodynamic missile control system. Problems of Mechatronics. Armament.<br />
Aviation. Safety Engineering (in Polish. under review)<br />
271
List of participants<br />
272<br />
1. prof. Ivan Baník, Ph.D., Slovak University of Technology, Faculty of Civil Engineering,<br />
Radlinského 11, Bratislava, SLOVAKIA<br />
2. Ing. Vlastimil Boháč CSc., Slovak Academy of Sciences, Institute of Physics, SAS,<br />
Dúbravská cesta 9, 845 11 Bratislava 45, SLOVAKIA<br />
3. prof. Ing. Robert Černý, DrSc., Czech Technical University, Faculty of Civil<br />
Engineering, Thakurova 7, Prague, CZECH REPUBLIC<br />
4. Ing. Lenka Dohnalová, Brno University of Technology, Faculty of Chemistry,<br />
Purkynova 118, Brno, CZECH REPUBLIC<br />
5. Mgr. Patricia Ekkertová, Comenius University in Bratislava, Faculty of Natural<br />
Sciences, Mlynská dolina, Bratislava, SLOVAKIA<br />
6. Ing. Danica Fidríková, Slovak Academy of Sciences, Institute of Physics, Dúbravská<br />
cesta 9, Bratislava, SLOVAKIA<br />
7. prof. Christ Glorieux, KU Leuven, Laboratory for Acoustics and Thermal Physics,<br />
Celestijnenlaan 200D, Heverlee B, BELGIUM<br />
8. Ing. Jan Kočí, Czech Technical University, Faculty of Civil Engineering, Thákurova 7,<br />
Prague, CZECH REPUBLIC<br />
9. Ing. Václav Kočí, Czech Technical University, Faculty of Civil Engineering, Thákurova<br />
7, Praha 6, CZECH REPUBLIC<br />
10. Prof. Piotr Koniorczyk, DSC., Military University of Technology, Institute of Aviation<br />
Technology, Kaliskiego 2, Warsaw, POLAND<br />
11. prom. fyz. Olga Koronthalyova, CSc., Slovak Academy of Sciences, Institute of<br />
Construction and Architecture, Dúbravská c. 9, Bratislava, SLOVAKIA<br />
12. Mgr. Jozef Kováč, Constantine the Philosopher University, Tr. A. Hlinku 1, Nitra,<br />
SLOVAKIA<br />
13. Mgr. Peter Krupa, Constantine the Philosopher University, Faculty of Natural Sciences,<br />
Tr. Andreja Hlinku 1, Nitra, SLOVAKIA<br />
14. Ing. Ludovít Kubičár, Dr., Slovak Academy of Sciences, Dúbravska cesta 9, Bratislava,<br />
SLOVAKIA<br />
15. Ing. E. Martines‐Lopez, Centro Nacional de Metrologia, Thermometry Division, km 4.5<br />
Carretera a Los Cues, el Marques, Queretaro, MEXICO<br />
16. doc. RNDr. Jozefa Lukovičová, Ph.D., Slovak University of Technology, Faculty of Civil<br />
Engineering, Radlinského 11, Bratislava, SLOVAKIA<br />
17. doc. Ing. Svetozár Malinarič, CSc., Constantine the Philosopher University, Faculty of<br />
Natural Scientes, Trieda Andreja Hlinku 1, Nitra, SLOVAKIA<br />
18. Ing. Peter Matiašovský, CSc., Slovak Academy of Sciences, Institute of Construction<br />
and Architecture, Dúbravská cesta 9, Bratislava 45, SLOVAKIA
19. doc. RNDr. Igor Medveď. Ph.D., Constantine the Philosopher University, Faculty of<br />
Natural Sciences, Tr. A. Hlinku 1, 94974 Nitra, SLOVAKIA<br />
20. Ing. Peter Mihálka, PhD., Slovak Academy of Sciences, Institute of Construction and<br />
Architecture, Dubravska cesta 9, Bratislava, SLOVAKIA<br />
21. prof. RNDr. Stanislav Nespurek, DrSc., Brno University of Technology, Faculty of<br />
Chemistry, Purkynova 118, Brno, CZECH REPUBLIC<br />
22. Mgr. Ján Ondruška, Constantine the Philosopher University, Faculty of Natural<br />
Sciences, Tr. A. Hlinku 1, Nitra, SLOVAKIA<br />
23. Ing. Gabriela Pavlendová, Ph.D., Slovak University of Technology, Faculty of Civil<br />
Engineering, Radlinského 11, Bratislava, SLOVAKIA<br />
24. doc. Ing. Zbyšek Pavlík, Ph.D., Czech Technical University, Faculty of Civil<br />
Engineering, Department of Materials Engineering and Chemistry, Thákurova 7,<br />
Prague, CZECH REPUBLIC<br />
25. Ing. S. Olof Mundt‐Petersen, M.Sc., Lund University, Faculty of Engineering/ Building<br />
Physics, Box 118, Lund, SWEDEN<br />
26. Mgr. Lubos Podobnik, Constantine the Philosopher University, Faculty of Natural<br />
Sciences, Tr. A. Hlinku 1, Nitra, SLOVAKIA<br />
27. Andres Gomez Ruiz, Institute of Physics, Slovak Academy of Sciences, Dúbravska cesta<br />
9, Bratislava, SLOVAKIA<br />
28. doc. Ing. Monika Rychtarikova, Ph.D., Slovak University of Technology, Faculty of<br />
Civil Engineering, Radlinského 11, Bratislava, SLOVAKIA<br />
29. Mgr. Ivana Šimková, Comenius University, Faculty of Natural Sciences, Mlynská<br />
dolina, Bratislava, SLOVAKIA<br />
30. prof. Peter Šimon, DrSc., Slovak University of Technology, Faculty of Chemical and<br />
Food Technology, Radlinského 9, Bratislava, SLOVAKIA<br />
31. Prof. Dr. I. H. Tavman, Ph.D., Dokuz Eylul University, Mechanical Engineering<br />
Department, Dokuz Eylul University Mechanical Engineering Department 35397<br />
Tinaztepe Buca Izmir, Tinaztepe Buca Izmir, TURKEY<br />
32. prof. Mgr. Jan Toman, DrSc., Czech Technical University, Faculty of Civil Engineering,<br />
Department of Materials Engineering and Chemistry, Thákurova 7, Prague, CZECH<br />
REPUBLIC<br />
33. RNDr. Anton Trník, Ph.D., Constantine the Philosopher University, Faculty of Natural<br />
Sciences, Tr. A Hlinku 1, Nitra, SLOVAKIA<br />
34. RNDr. Vratislav Tydlitát, CSc., Czech Technical University, Faculty of Civil<br />
Engeneering, Thakurova 7, Prague 6, CZECH REPUBLIC<br />
35. prof. Ing. Jiří Vala, CSc., Brno University of Technology, Faculty of Civil Engineering,<br />
Veveří 95, Brno, CZECH REPUBLIC<br />
36. Ing. Viliam Vretenár, PhD., Slovak Academy of Sciences, Institute of Physics,<br />
Dúbravská cesta 9, Bratislava, SLOVAKIA<br />
273
274<br />
37. prof. Ing. Oldrich Zmeskal, CSc., Brno University of Technology, Faculty of Chemistry,<br />
Purkynova 118, Brno, CZECH REPUBLIC<br />
38. Assoc. Prof Janusz Zmywaczyk, Ph.D, Faculty of Mechatronics and Aviation, Military<br />
University of Technology, Kaliskiego 2, Warsaw, POLAND
275
Title <strong>Thermophysics</strong> <strong>2012</strong> – <strong>Conference</strong> <strong>Proceedings</strong><br />
Editor Oldřich Zmeškal<br />
Publisher Institute of Physics, Slovak Academy of Science in Bratislava<br />
Dúbravská cesta 9, SK‐845 11 Bratislava<br />
Print Brno University of Technology, Faculty of Chemistry<br />
Purkyňova 464/118, CZ‐612 00 Brno<br />
Edition first<br />
Year of first edition <strong>2012</strong><br />
Number of pages 276<br />
Number of copies 70<br />
ISBN 978‐80‐214‐4599‐4<br />
276


