the case of the synthetic dye industry, 1857–1914 - Maastricht ...
the case of the synthetic dye industry, 1857–1914 - Maastricht ...
the case of the synthetic dye industry, 1857–1914 - Maastricht ...

You also want an ePaper? Increase the reach of your titles
YUMPU automatically turns print PDFs into web optimized ePapers that Google loves.
J Evol Econ (2001) 11: 177–205<br />
c○ Springer-Verlag 2001<br />
Comparing evolutionary dynamics<br />
across different national settings:<br />
<strong>the</strong> <strong>case</strong> <strong>of</strong> <strong>the</strong> syn<strong>the</strong>tic <strong>dye</strong> <strong>industry</strong>, <strong>1857–1914</strong> ⋆<br />
Johann Peter Murmann1 and Ernst Homburg2 1 Kellogg Graduate School <strong>of</strong> Management, Northwestern University, Evanston, IL 60208, USA<br />
(e-mail: jpm@nwu.edu)<br />
2 Department <strong>of</strong> History, University <strong>of</strong> <strong>Maastricht</strong>, P.O. Box 616, 6200 MD <strong>Maastricht</strong>,<br />
The Ne<strong>the</strong>rlands (e-mail: E.Homburg@history.unimaas.nl)<br />
Abstract. Current models <strong>of</strong> <strong>industry</strong> evolution suggest that development patterns<br />
should be <strong>the</strong> same across different levels <strong>of</strong> analysis. In comparing <strong>the</strong><br />
evolution <strong>of</strong> <strong>the</strong> syn<strong>the</strong>tic <strong>dye</strong> <strong>industry</strong> at <strong>the</strong> global level and in <strong>the</strong> five major<br />
producer countries before World War I (Britain, Germany, France, Switzerland<br />
and <strong>the</strong> United States), it is shown that patterns <strong>of</strong> <strong>industry</strong> evolution differed<br />
significantly across national contexts. Based on a quantitative and qualitative<br />
database <strong>of</strong> all firms and plants in <strong>the</strong> <strong>industry</strong>, <strong>the</strong> paper analyzes how German<br />
firms came to dominate <strong>the</strong> <strong>industry</strong> and identifies factors such as availabilities<br />
<strong>of</strong> crucial skills, economies <strong>of</strong> scale and scope, and positive feedback mechanisms<br />
between firms and national institutions that likely produced <strong>the</strong>se national<br />
differences. The empirical analysis calls for formal models <strong>of</strong> evolution that<br />
incorporate differences in institutional environments.<br />
Key words: Comparative <strong>industry</strong> evolution – Institutional analysis – Technological<br />
innovation – Longitudinal dataset <strong>of</strong> firm and plants<br />
JEL classification: 031, 032<br />
⋆ We would like to thank Marjan van de Goor, Thessa van Hoorn and Es<strong>the</strong>r van’t Klooster for<br />
<strong>the</strong>ir research assistance, as well as Ashish Arora (Pittsburgh, USA), Peter Morris (London, UK),<br />
and Tony Travis (Jerusalem, Israel) for <strong>the</strong>ir valuable comments on an earlier draft <strong>of</strong> this paper. We<br />
are also grateful to Steven Klepper for his excellent editorial guidance.<br />
Correspondence to: J.P. Murmann
178 J.P. Murmann and E. Homburg<br />
1 Introduction<br />
Empirical investigations <strong>of</strong> <strong>the</strong> evolution <strong>of</strong> <strong>industry</strong> have flourished over <strong>the</strong> last<br />
two decades. But with <strong>the</strong> exception <strong>of</strong> Carroll and Hannan’s automobile study<br />
(1995) and to some degree Chesbrough’s (1999) work on <strong>the</strong> hard drive <strong>industry</strong>,<br />
no one has examined in a systematic fashion whe<strong>the</strong>r evolutionary patterns are<br />
<strong>the</strong> same in different social contexts (see Carroll and Hannan, 2000, for a survey).<br />
The goal <strong>of</strong> this paper is to present some striking dissimilarities in patterns <strong>of</strong><br />
evolution that appear when <strong>the</strong> level <strong>of</strong> analysis is not <strong>the</strong> global level, but ra<strong>the</strong>r<br />
individual countries. These variations in country patterns raise questions about<br />
current models <strong>of</strong> industrial evolution and call out for an explanation. Based on<br />
our detailed study <strong>of</strong> <strong>the</strong> syn<strong>the</strong>tic <strong>dye</strong> <strong>industry</strong> from 1857 to 1914, 1 we propose a<br />
number <strong>of</strong> general factors that may be <strong>the</strong> driving forces behind <strong>the</strong>se differences.<br />
To assess <strong>the</strong> generality <strong>of</strong> <strong>the</strong> causal processes identified in <strong>the</strong> present study,<br />
future research needs to test our conjectures in o<strong>the</strong>r industrial settings.<br />
The syn<strong>the</strong>tic <strong>dye</strong> <strong>industry</strong> is a promising setting for a number <strong>of</strong> reasons.<br />
First, <strong>dye</strong> production started in different countries at about <strong>the</strong> same time – Britain<br />
(1857), France (1858), Germany (1858), and Switzerland (1859) – enabling us<br />
to compare <strong>the</strong> simultaneous evolution <strong>of</strong> national firm populations. Second, <strong>the</strong><br />
syn<strong>the</strong>tic <strong>dye</strong> <strong>industry</strong> is <strong>of</strong>ten referred to as <strong>the</strong> first science-based <strong>industry</strong> because<br />
<strong>of</strong> two distinguishing characteristics. It represents one <strong>of</strong> <strong>the</strong> first instances<br />
in which scientific research led directly to a new commercial product, and <strong>the</strong><br />
<strong>industry</strong> was <strong>the</strong> setting where industrial R&D labs were created for <strong>the</strong> first<br />
time in <strong>the</strong> 1870s. It took about a year for <strong>the</strong> discovery <strong>of</strong> <strong>the</strong> first syn<strong>the</strong>tic<br />
or coal-tar <strong>dye</strong> to be translated into an industrial product, and scientists continued<br />
to develop new <strong>dye</strong>s in <strong>the</strong> decades that followed. This feature will allow<br />
scholars to compare <strong>the</strong> path <strong>of</strong> <strong>the</strong> syn<strong>the</strong>tic <strong>dye</strong> <strong>industry</strong> with <strong>the</strong> evolution <strong>of</strong><br />
contemporary high-tech industries and identify invariant patterns as well as <strong>the</strong><br />
drivers <strong>of</strong> differences. Third, our data set <strong>of</strong> virtually all firms in <strong>the</strong> syn<strong>the</strong>tic<br />
<strong>dye</strong> <strong>industry</strong> from 1857 to 1914 makes it possible to contribute to contemporary<br />
research in industrial organization and add a historical perspective to <strong>the</strong> present<br />
debate on competitiveness. 2<br />
Our research into <strong>the</strong> evolution <strong>of</strong> <strong>the</strong> early syn<strong>the</strong>tic <strong>dye</strong> <strong>industry</strong> is novel<br />
in a number <strong>of</strong> ways. As we have collected data not only on firms in all <strong>dye</strong>producing<br />
countries but also on <strong>the</strong>ir plants and <strong>the</strong> various types <strong>of</strong> products<br />
<strong>the</strong>y made, we are able to provide new evidence about <strong>the</strong> process <strong>of</strong> <strong>industry</strong><br />
evolution. Our data allow us to examine in more detail than previous studies <strong>the</strong><br />
causal dynamics that lead firms to enter and exit an <strong>industry</strong>.<br />
1 The present investigation stops in 1914 because <strong>the</strong> First World War triggered massive state<br />
intervention in all countries and dramatically altered <strong>the</strong> <strong>industry</strong>’s dynamics all over <strong>the</strong> world.<br />
2 Our data set also includes makers <strong>of</strong> organic intermediate chemicals since we wanted to be able<br />
to investigate how many such producers integrated forward into <strong>dye</strong> making. Some observers have<br />
claimed that German firms came to dominate <strong>the</strong> <strong>dye</strong> <strong>industry</strong> because <strong>the</strong>y were <strong>the</strong> only ones that<br />
made <strong>the</strong>ir own intermediates. We wanted to be in <strong>the</strong> position to test this claim in a systematic<br />
manner.
Comparing evolutionary dynamics across different national settings 179<br />
Second, we have conducted a study <strong>of</strong> <strong>the</strong> syn<strong>the</strong>tic <strong>dye</strong> <strong>industry</strong> that involved<br />
both quantitative and qualitative methods. Our database <strong>of</strong> firms and plants contains<br />
numerical as well as relevant qualitative data. Because we pulled toge<strong>the</strong>r<br />
information from a wide variety <strong>of</strong> sources - histories <strong>of</strong> <strong>the</strong> <strong>dye</strong> and chemical<br />
industries, histories <strong>of</strong> firms, trade directories <strong>of</strong> various kinds, reports on firms<br />
exhibiting at world exhibitions, trade association membership lists, and biographies<br />
<strong>of</strong> leading industrialists and chemists - our database is considerably richer<br />
than any hi<strong>the</strong>rto amassed. 3<br />
Third, we constructed our database <strong>of</strong> firms and plants after we had already<br />
acquired a considerable understanding <strong>of</strong> <strong>the</strong> dynamics that marked <strong>the</strong> <strong>industry</strong>.<br />
One <strong>of</strong> us, Ernst Homburg, participated in a Dutch research team that in <strong>the</strong><br />
1980s investigated <strong>the</strong> syn<strong>the</strong>tic <strong>dye</strong> <strong>industry</strong> before <strong>the</strong> First World War (Homburg,<br />
1983; van den Belt et al., 1984; van den Belt and Rip 1987; Homburg,<br />
1992; Hornix, 1992; van den Belt, 1992). Our knowledge <strong>of</strong> this <strong>industry</strong> allowed<br />
us to design <strong>the</strong> database with an eye toward potentially key micro-variables that<br />
influenced <strong>the</strong> development <strong>of</strong> <strong>the</strong> <strong>industry</strong>. For instance, we tracked products<br />
such as syn<strong>the</strong>tic alizarin, which has been identified as an important innovation<br />
in <strong>the</strong> historiography <strong>of</strong> <strong>the</strong> syn<strong>the</strong>tic <strong>dye</strong> <strong>industry</strong>. These data would make it<br />
possible to examine hypo<strong>the</strong>ses advanced in <strong>the</strong> historiography <strong>of</strong> <strong>the</strong> <strong>industry</strong> in<br />
a more systematic fashion. A <strong>case</strong> in point is <strong>the</strong> idea that a new wave <strong>of</strong> entry<br />
occurred in <strong>the</strong> <strong>industry</strong> because <strong>of</strong> <strong>the</strong> development <strong>of</strong> syn<strong>the</strong>tic alizarin. Fur<strong>the</strong>rmore,<br />
we realized that while some firms disappeared, <strong>the</strong>ir plants continued<br />
to operate because <strong>the</strong>y were taken over by o<strong>the</strong>r firms. This led us to develop a<br />
separate plant database that tracked all plants and <strong>the</strong>ir key products. We exploit<br />
<strong>the</strong> plant level database in <strong>the</strong> present paper by examining, for example, whe<strong>the</strong>r<br />
<strong>the</strong> evolution <strong>of</strong> <strong>the</strong> <strong>industry</strong> is marked by a trend toward multi-plant firms.<br />
To investigate similarities and differences in <strong>the</strong> patterns <strong>of</strong> industrial evolution<br />
across social settings, we first examine <strong>the</strong> global pattern <strong>of</strong> <strong>the</strong> <strong>industry</strong>’s<br />
evolution from 1857 to 1914. Before <strong>the</strong> First World War, syn<strong>the</strong>tic <strong>dye</strong>s were<br />
produced in Britain, Germany, France, <strong>the</strong> USA, and Switzerland (major producer<br />
nations), as well as in Russia, <strong>the</strong> Austrian Empire, <strong>the</strong> Ne<strong>the</strong>rlands, Belgium,<br />
Italy, and – very shortly before <strong>the</strong> war – in Rumania (one firm), Greece (one<br />
firm), and Canada (two firms). Next we compare <strong>the</strong> global pattern with that <strong>of</strong><br />
Britain, Germany, and France. Because <strong>of</strong> <strong>the</strong> small number <strong>of</strong> firms in Switzerland<br />
and <strong>the</strong> U.S., we treat <strong>the</strong>se two countries more briefly. We <strong>the</strong>n attempt to<br />
identify some causes that may generate differences in <strong>industry</strong> evolution across<br />
social settings. Finally, we discuss some <strong>of</strong> <strong>the</strong> implications <strong>of</strong> our study for<br />
research on industrial evolution.<br />
3 We plan to make <strong>the</strong> database available over <strong>the</strong> Internet sometime in <strong>the</strong> future. Because we<br />
identify all our sources for a particular firm or plant record, researchers will be able go back to <strong>the</strong><br />
original data.
180 J.P. Murmann and E. Homburg<br />
2 Patterns <strong>of</strong> evolution at <strong>the</strong> global level<br />
Number <strong>of</strong> producers (density)<br />
William Henry Perkin, <strong>the</strong> inventor <strong>of</strong> <strong>the</strong> first syn<strong>the</strong>tic <strong>dye</strong>, started production <strong>of</strong><br />
aniline purple near London at <strong>the</strong> end <strong>of</strong> 1857 and remained <strong>the</strong> only producer<br />
for at least a few months. To commence <strong>dye</strong> production, Perkin also had to<br />
develop processes to make crucial chemical inputs, <strong>the</strong> so-called ’intermediates’<br />
(i.e. organic chemical compounds that are made from raw materials). While some<br />
<strong>of</strong> <strong>the</strong> organic intermediates were already made for o<strong>the</strong>r industrial purposes,<br />
Perkin could not buy all necessary intermediates in <strong>the</strong> market and had to make<br />
nitro-benzene, for example, in-house.<br />
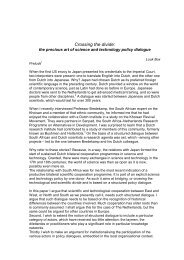
The year 1858 already saw a dramatic increase to 8 firms participating in<br />
<strong>the</strong> <strong>industry</strong>. 4 The number <strong>of</strong> firms continued to increase steeply in <strong>the</strong>se early<br />
years. By 1864 a temporary maximum <strong>of</strong> 68 firms was reached. Over <strong>the</strong> next<br />
fifty years <strong>the</strong> global population grew much more slowly, reaching a peak <strong>of</strong><br />
about 84 firms (see Fig. 1, upper graph).<br />
If we restrict our analysis to <strong>the</strong> five leading countries, Britain, France, Germany,<br />
Switzerland, and <strong>the</strong> USA, <strong>the</strong> patterns look very similar, except for <strong>the</strong><br />
period after 1900, when <strong>the</strong> number <strong>of</strong> firms drops for <strong>the</strong> 5-country aggregate<br />
but rises for <strong>the</strong> entire world. The number <strong>of</strong> firms in a given year is, <strong>of</strong> course,<br />
determined by <strong>the</strong> number <strong>of</strong> firm entries and exits since <strong>the</strong> previous year. Showing<br />
in more detail <strong>the</strong> global <strong>industry</strong> dynamics <strong>of</strong> <strong>the</strong> early years, Figure 2 plots<br />
<strong>the</strong> 3-year moving averages <strong>of</strong> <strong>the</strong> number <strong>of</strong> entries and exits in each year. The<br />
entry graph reveals that <strong>the</strong> largest amount <strong>of</strong> entry occurred very early in <strong>the</strong><br />
<strong>industry</strong> around 1863.<br />
The rapid entry <strong>of</strong> firms between 1858 and 1864 was propelled by a strong<br />
demand for aniline <strong>dye</strong>s, especially in <strong>the</strong> field <strong>of</strong> luxury textiles (silks) and<br />
highly priced fashionable designs. The number <strong>of</strong> syn<strong>the</strong>tic <strong>dye</strong> producers rose<br />
so quickly that <strong>the</strong> intensifying competition soon led to falling prices for <strong>the</strong><br />
new <strong>dye</strong>s. By 1864, <strong>the</strong> price <strong>of</strong> fuchsine (aniline red), for instance, had fallen<br />
to about ten percent <strong>of</strong> <strong>the</strong> 1860 levels (Morris and Travis, 1992, p. 65). A<br />
number <strong>of</strong> firms could not cope with <strong>the</strong> swift decline in prices that resulted<br />
from production overcapacity and were forced to exit. The number <strong>of</strong> exits at<br />
<strong>the</strong> global level peaked in 1864 with 9 exits (see <strong>the</strong> firm exit graph in Fig. 2). 5<br />
The period from 1864 to 1869 was marked by a process <strong>of</strong> consolidation.<br />
Many companies now produced more than a few <strong>dye</strong>s and <strong>of</strong>fered a full “rainbow”<br />
<strong>of</strong> <strong>dye</strong>s to customers. This proliferation <strong>of</strong> syn<strong>the</strong>tic <strong>dye</strong>s led to a decline<br />
in sales <strong>of</strong> such natural <strong>dye</strong>s as archil and cochenille-carmine. 6 But competition<br />
4 All graphs in figures report three-year moving averages.<br />
5 Meyer-Thurow studied contemporary reports <strong>of</strong> chambers <strong>of</strong> commerce in Germany and found<br />
that local <strong>of</strong>ficials became quite aware <strong>of</strong> a crisis in <strong>the</strong> <strong>dye</strong> <strong>industry</strong> in <strong>the</strong> years 1863-4. Manufacturers<br />
complained about falling prices and typically blamed overcapacities for <strong>the</strong> difficulties in<br />
selling product (personal communication to one <strong>of</strong> <strong>the</strong> authors).<br />
6 It took several decades before all natural <strong>dye</strong>s were replaced by syn<strong>the</strong>tic equivalents. Natural<br />
<strong>dye</strong>s such as <strong>dye</strong>woods were produced on a large scale until <strong>the</strong> 1880s and to a lesser extent well
Comparing evolutionary dynamics across different national settings 181<br />
Fig. 1. Number <strong>of</strong> <strong>dye</strong> firms in <strong>the</strong> world, <strong>1857–1914</strong><br />
Fig. 2. Global firm entries and exits <strong>1857–1914</strong><br />
from new syn<strong>the</strong>tic <strong>dye</strong>s also took sales away from older syn<strong>the</strong>tic <strong>dye</strong>s such as<br />
aniline purple.<br />
into <strong>the</strong> 20th century. The advent <strong>of</strong> <strong>the</strong> direct cotton (azo) <strong>dye</strong>s in <strong>the</strong> 1880s dealt a major blow to<br />
several <strong>of</strong> <strong>the</strong> natural <strong>dye</strong>s. It is safe to assume that a couple <strong>of</strong> thousand syn<strong>the</strong>tic <strong>dye</strong>s appeared<br />
on <strong>the</strong> market between 1857 and 1914. Dyers and printers could choose from at least 900 different<br />
<strong>dye</strong>s when World War I broke out. Such a variety was never available before <strong>the</strong> advent <strong>of</strong> syn<strong>the</strong>tic<br />
<strong>dye</strong>s.
182 J.P. Murmann and E. Homburg<br />
In more general terms, two important developments characterized <strong>the</strong> market<br />
penetration <strong>of</strong> syn<strong>the</strong>tic <strong>dye</strong>s after <strong>the</strong> creation <strong>of</strong> <strong>the</strong> first syn<strong>the</strong>tic <strong>dye</strong>: (1)<br />
unremittingly falling prices and (2) <strong>the</strong> continual invention <strong>of</strong> new classes <strong>of</strong><br />
syn<strong>the</strong>tic <strong>dye</strong>s. Ever-lower <strong>dye</strong> prices made it possible for syn<strong>the</strong>tic <strong>dye</strong>s to be<br />
used not only on luxury textiles but also on more common cottons and woolens.<br />
Falling prices were a key force driving <strong>the</strong> gradual replacement <strong>of</strong> natural <strong>dye</strong>s (<strong>of</strong><br />
which <strong>the</strong>re were about thirty different kinds) by cheaper syn<strong>the</strong>tic equivalents.<br />
The invention <strong>of</strong> new classes <strong>of</strong> syn<strong>the</strong>tic <strong>dye</strong>s was even more important in this<br />
substitution process. The early aniline <strong>dye</strong>s replaced only a few <strong>of</strong> <strong>the</strong> natural<br />
<strong>dye</strong>s. Later innovations led to <strong>the</strong> gradual replacement <strong>of</strong> <strong>the</strong> o<strong>the</strong>r natural <strong>dye</strong>s.<br />
Every single major breakthrough led to new waves <strong>of</strong> entry in <strong>the</strong> syn<strong>the</strong>tic <strong>dye</strong><br />
business.<br />
The second entry wave, which occurred between 1871–1873, provides a good<br />
example <strong>of</strong> <strong>the</strong> consequences <strong>of</strong> such a major breakthrough. The development <strong>of</strong><br />
syn<strong>the</strong>tic alizarin in 1868 opened up a huge market that was formerly served by<br />
natural <strong>dye</strong> makers. Many firms sought to pr<strong>of</strong>it from this fast-growing market<br />
and entered <strong>the</strong> <strong>industry</strong>, leading to ano<strong>the</strong>r significant jump in <strong>the</strong> number <strong>of</strong><br />
firms in <strong>the</strong> <strong>industry</strong>. We found support for <strong>the</strong> proposition that firms entered<br />
<strong>the</strong> <strong>industry</strong> to take advantage <strong>of</strong> <strong>the</strong> alizarin market by comparing <strong>the</strong> product<br />
portfolios <strong>of</strong> all syn<strong>the</strong>tic <strong>dye</strong> producers on January 1, 1868, with <strong>the</strong> product<br />
portfolios <strong>of</strong> new producers in <strong>the</strong>ir entry year for <strong>the</strong> period from 1868 to 1876.<br />
There were 52 producers <strong>of</strong> aniline <strong>dye</strong>s on January 1, 1868, 4% <strong>of</strong> which also<br />
made azo <strong>dye</strong>s, 19% made natural <strong>dye</strong>s, 17% fine chemicals, 8% inorganic basic<br />
chemicals, 13% organic basic chemicals, and 33% intermediates. None <strong>of</strong> <strong>the</strong>se<br />
firms made alizarin (see Table 1). In 1869 a few existing companies (Hoechst,<br />
BASF and Perkin & Sons) started to make alizarin. But soon new companies<br />
were founded that started as specialized alizarin producers. In 1870, 2 <strong>of</strong> <strong>the</strong> 7<br />
entrants (28.6%) made alizarin and 5 <strong>of</strong> <strong>the</strong> 7 entrants (71%) made aniline <strong>dye</strong>s.<br />
In 1871, 20% <strong>of</strong> 10 entrants made alizarin, in 1872 75% <strong>of</strong> <strong>the</strong> 4 entrants did,<br />
and from 1873 to 1876 between 33% and 66% <strong>of</strong> <strong>the</strong> new entrants were founded<br />
as alizarin producers (Table 1). 7<br />
The third entry wave, 1878–1885, was stimulated by <strong>the</strong> invention <strong>of</strong> a new<br />
class <strong>of</strong> azo <strong>dye</strong>s that were based on <strong>the</strong> so-called “coupling” reaction. This<br />
coupling reaction gave rise to seemingly endless possibilities for new <strong>dye</strong>s (van<br />
den Belt and Rip, 1987, pp. 148–149). By <strong>the</strong> First World War, <strong>the</strong> largest number<br />
<strong>of</strong> <strong>dye</strong>s sold in <strong>the</strong> market fell into <strong>the</strong> class <strong>of</strong> azo <strong>dye</strong>s.<br />
The fourth entry wave, 1904–1913, probably was a result <strong>of</strong> <strong>the</strong> general<br />
economic uplift in <strong>the</strong> years just before <strong>the</strong> First World War, as well as <strong>the</strong><br />
development <strong>of</strong> a new class <strong>of</strong> <strong>dye</strong>s (<strong>the</strong> so-called sulfur <strong>dye</strong>s), <strong>the</strong> growing specialization<br />
among <strong>the</strong> <strong>dye</strong> firms, and <strong>the</strong> emergence <strong>of</strong> <strong>dye</strong> firms in some smaller<br />
countries. Sulfur <strong>dye</strong>s were cheap and easy to make and <strong>the</strong>refore facilitated<br />
<strong>the</strong> entry <strong>of</strong> new firms into <strong>the</strong> syn<strong>the</strong>tic <strong>dye</strong> <strong>industry</strong> (as, for example, in <strong>the</strong><br />
<strong>case</strong>s <strong>of</strong> Th. Handschin & Co. and James Robinson & Co., Ltd.). Fur<strong>the</strong>rmore,<br />
7 At first glance <strong>the</strong> numbers in Table 1 seem somewhat different from those in Figures 1 and 2.<br />
But this is not so. Figures 1 and 2 present <strong>the</strong> 3-year moving averages <strong>of</strong> <strong>the</strong> data in Table 1.
Comparing evolutionary dynamics across different national settings 183<br />
Table 1. Alizarin producers among existing firms and entrants (1868–1876)<br />
Year Number <strong>of</strong> % Alizarin Number % Alizarin<br />
entrants producers <strong>of</strong> existing firms producers<br />
1868 1 0.0 52 0.0<br />
1869 0 0.0 53 3.8<br />
1870 7 28.6 48 8.3<br />
1871 10 20.0 52 11.6<br />
1872 4 75.0 54 14.8<br />
1873 13 46.2 56 26.8<br />
1874 3 33.3 57 33.3<br />
1875 3 66.6 54 29.9<br />
1876 6 50.0 55 29.1<br />
some firms entered <strong>the</strong> <strong>industry</strong> to produce <strong>dye</strong>s for niche applications such as<br />
lea<strong>the</strong>r (as in <strong>the</strong> <strong>case</strong> <strong>of</strong> <strong>the</strong> Central Dyestuff & Chemical Co.). Finally, <strong>the</strong><br />
industrialization <strong>of</strong> smaller countries toge<strong>the</strong>r with protectionist national policies<br />
encouraged entrepreneurs to start <strong>dye</strong> plants that would serve <strong>the</strong> growing home<br />
market.<br />
A comparison <strong>of</strong> <strong>the</strong> entry and exit graphs shows that <strong>the</strong> patterns for <strong>the</strong><br />
two processes are remarkably similar. Very <strong>of</strong>ten spikes in exits followed spikes<br />
in entry with a one- or two-year delay. Large numbers <strong>of</strong> new entries invariably<br />
seem to lead to exits ei<strong>the</strong>r because incumbent firms experienced more competition<br />
and were more likely to fail or because <strong>the</strong> new entrants did not have <strong>the</strong><br />
strength to survive in <strong>the</strong> <strong>industry</strong> and were quickly forced out again. Starting<br />
around 1897 <strong>the</strong> number <strong>of</strong> exits in many years was larger than <strong>the</strong> number <strong>of</strong><br />
entries. We also analyzed <strong>the</strong> entry and exit data excluding <strong>dye</strong> firms that were<br />
subsidiaries <strong>of</strong> ano<strong>the</strong>r <strong>dye</strong> firm and hence could be interpreted as not constituting<br />
a de novo entrant. With <strong>the</strong>se slightly reduced samples we never<strong>the</strong>less obtained<br />
very similar patterns.<br />
General trends<br />
One <strong>of</strong> <strong>the</strong> striking patterns at <strong>the</strong> global level (as well as at <strong>the</strong> leading 5-country<br />
aggregate) is that no visible shakeout – a dramatic reduction in <strong>the</strong> number <strong>of</strong><br />
firms – occurred in <strong>the</strong> period before 1914 (Fig. 1). Shakeouts have been found<br />
in many studies <strong>of</strong> U.S. industries (Gort and Klepper, 1982; Klepper and Graddy,<br />
1990; Klepper, 1997). Carroll and Hannan (1995) also report shakeouts in <strong>the</strong><br />
automobile industries <strong>of</strong> Britain, Germany, France as well as <strong>the</strong> United States.<br />
Ano<strong>the</strong>r remarkable pattern is <strong>the</strong> extent to which production became concentrated<br />
in Germany. For <strong>the</strong> first 8 years, until <strong>the</strong> middle <strong>of</strong> <strong>the</strong> 1860s, British<br />
and French firms were clearly market leaders. But in <strong>the</strong> second half <strong>of</strong> <strong>the</strong><br />
1860s German firms caught up and surpassed <strong>the</strong>ir British and French rivals.<br />
Around 1870, German firms were responsible for 50% <strong>of</strong> world production. By<br />
1900, Germany’s worldwide share climbed as high as 75% where it remained
184 J.P. Murmann and E. Homburg<br />
with relatively minor fluctuations until <strong>the</strong> First World War. If one also counts<br />
German-owned plants in foreign countries, German market share reached as high<br />
as 90% (Thissen, 1922).<br />
Concentration processes also occurred within national industries after <strong>the</strong><br />
1860s. In all major countries output became increasingly held in <strong>the</strong> hands <strong>of</strong> a<br />
few firms. These firms were all relatively early entrants. Britain, Germany, and<br />
<strong>the</strong> USA illustrate this trend. In Germany <strong>the</strong> top three producers accounted for<br />
55% <strong>of</strong> <strong>the</strong> 60 million marks domestic <strong>dye</strong> production in 1883. More specifically,<br />
BASF had a market share <strong>of</strong> 23.3%, Hoechst <strong>of</strong> 16.7% and Bayer <strong>of</strong> 15% (Meyer-<br />
Thurow 1982). In 1914, <strong>the</strong> top three producers accounted for 66% <strong>of</strong> domestic<br />
production. BASF, Bayer, and Hoechst were each responsible for about 22% <strong>of</strong><br />
domestic production and, given Germany’s world market share, for almost 20%<br />
<strong>of</strong> world production each. 8 At <strong>the</strong> start <strong>of</strong> <strong>the</strong> First World War, Levinstein and<br />
Read Holliday also possessed a dominant position among domestic producers in<br />
Great Britain with a share <strong>of</strong> about 30% each <strong>of</strong> British production. 9 At this time,<br />
in <strong>the</strong> U.S., Schoellkopf held a 50% share <strong>of</strong> domestic <strong>dye</strong> production, Heller<br />
& Merz had 21%, and <strong>the</strong> Bayer subsidiary, Hudson River Aniline, had 17%<br />
(Haynes, 1954, p. 313).<br />
Important drivers behind <strong>the</strong>se concentration tendencies were economies <strong>of</strong><br />
scope and to a lesser extent economies <strong>of</strong> scale. The <strong>case</strong> <strong>of</strong> Bayer, a firm that<br />
became one <strong>of</strong> <strong>the</strong> three largest German <strong>dye</strong> producers, illustrates <strong>the</strong> process<br />
<strong>of</strong> exploiting scope and scale economies. Bayer achieved unit cost reductions<br />
through a variety <strong>of</strong> ways. Over <strong>the</strong> years it increased <strong>the</strong> size <strong>of</strong> production<br />
reactors by several orders <strong>of</strong> magnitude. In 1868 Bayer used autoclaves with a<br />
capacity <strong>of</strong> 30 liters; by 1905 it used 2000-liter autoclaves (Bayer, 1918, pp.<br />
251-252). At <strong>the</strong> beginning <strong>of</strong> <strong>the</strong> azo <strong>dye</strong> era, Bayer reactors had at most a size<br />
<strong>of</strong> between 1000 and 2000 liters (Bayer, 1918, p. 182). By 1907 a reactor to<br />
make azo <strong>dye</strong> had a capacity <strong>of</strong> 20,000 liters (Bayer, 1918, p. 182).<br />
These economies applied not only to production but to R&D as well. (See also<br />
Chandler, 1990, on <strong>the</strong> importance <strong>of</strong> scale and scope economies in o<strong>the</strong>r industries.)<br />
In <strong>the</strong> era where firms’ R&D laboratories replaced university laboratories<br />
as <strong>the</strong> main source <strong>of</strong> new <strong>dye</strong>s, large-scale experimentation and testing <strong>of</strong> <strong>dye</strong>s<br />
reduced <strong>the</strong> cost <strong>of</strong> finding competitive new <strong>dye</strong>s. In 1906, Meyer-Thurow (1982)<br />
reports, 2,656 new chemical compounds were syn<strong>the</strong>sized in Bayer’s research<br />
laboratories. Sixty <strong>of</strong> those were tested on a larger scale after a first screening,<br />
and only 36 ever reached <strong>the</strong> market. 10 Syn<strong>the</strong>sizing only a few new molecules<br />
and testing some <strong>of</strong> <strong>the</strong>m for <strong>the</strong>ir usability on different fabrics was likely to yield<br />
8 The latter figure is calculated from data provided in Redlich (1914, p. 18) and Beer (1959, p.<br />
138).<br />
9 It is very difficult to come by exact numbers on British market shares. We have estimated this<br />
figure from <strong>the</strong> information that Levinstein and Read Holliday were <strong>the</strong> two largest <strong>dye</strong> firms <strong>of</strong><br />
comparable size (Reader, 1954, p. 263) and that after <strong>the</strong>ir merger <strong>the</strong> combined firm held about<br />
75% <strong>of</strong> domestic production in 1918 (Richardson, 1962, p. 117).<br />
10 Hoechst, besides BASF, Bayer’s biggest rival, developed a similar testing organization. In 1900<br />
Hoechst tested 3,500 <strong>of</strong> its new colors or combination <strong>of</strong> old colors. Only 18 reached <strong>the</strong> market. A<br />
few years later 29 out <strong>of</strong> 8000 tested <strong>dye</strong>s were marketed (Beer, 1959, p. 89).
Comparing evolutionary dynamics across different national settings 185<br />
no new <strong>dye</strong>. It is important to keep in mind that competition was very fierce and<br />
large firms constantly introduced new <strong>dye</strong>s to follow changes in market trends.<br />
If a company employed only a single research chemist, for example, his efforts<br />
would be unlikely to yield a new <strong>dye</strong>. By contrast, if a firm employed a large<br />
team <strong>of</strong> chemists who would syn<strong>the</strong>size thousands <strong>of</strong> new compounds, <strong>the</strong> odds<br />
were much better that a firm would be able to come up with a competitive product<br />
before fashion trends changed. This is why hiring a large number <strong>of</strong> research<br />
chemists created <strong>the</strong> scale at which <strong>the</strong> unit cost <strong>of</strong> developing a new <strong>dye</strong> would<br />
go down significantly.<br />
Economies <strong>of</strong> scope and scale also affected distribution and marketing. The<br />
<strong>case</strong> <strong>of</strong> Bayer again serves as a good illustration. In 1913 Bayer had 44 sales<br />
subsidiaries and 123 sales agents (Verg, 1988, p. 198). When Bayer stopped relying<br />
solely on sales agents but also on <strong>the</strong> company’s own sales force to market<br />
product, <strong>the</strong> first unit <strong>of</strong> <strong>dye</strong>s sold was much more costly than <strong>the</strong> n-th unit.<br />
Similarly, in terms <strong>of</strong> translating <strong>dye</strong> labels and marketing campaigns into foreign<br />
languages, <strong>the</strong> first unit <strong>of</strong> <strong>dye</strong>s sold would be much more expensive than a<br />
later unit. But why was it so important for <strong>dye</strong> firms to do <strong>the</strong>ir own marketing<br />
ra<strong>the</strong>r than contracting that function out to independent firms that would sell <strong>the</strong><br />
products <strong>of</strong> many firms? One important reason why all leading German <strong>dye</strong> firms<br />
developed <strong>the</strong>ir own marketing and distribution capabilities was that it provided<br />
<strong>the</strong>ir R&D departments with direct feedback from users. AGFA, for example,<br />
initially sold its products through an exclusive sales firm in Magdeburg, Töpfke<br />
& Leidl<strong>of</strong>f. But in 1879 AGFA bought Töpfke & Leidl<strong>of</strong>f and took sales, distribution,<br />
and marketing into its own hands. Similarly, in 1873 BASF bought two<br />
<strong>of</strong> its key sales firms, H. Siegle and R. Knosp, both <strong>of</strong> Stuttgart, and integrated<br />
<strong>the</strong>se companies into its own operation. A general sales firm which distributed<br />
<strong>the</strong> <strong>dye</strong>s <strong>of</strong> many different companies simply did not possess any incentives to<br />
provide one particular <strong>dye</strong> maker with detailed feedback from users. Consistent<br />
with Teece’s (1986) argument that stresses <strong>the</strong> need <strong>of</strong> co-specialized assets to<br />
pr<strong>of</strong>it from innovation, <strong>the</strong> large German <strong>dye</strong> firms felt compelled to internalize<br />
a large portion <strong>of</strong> <strong>the</strong>ir marketing and distribution functions. These in-house<br />
sales and marketing capabilities allowed a large <strong>dye</strong> maker to obtain reliable<br />
knowledge and feedback from users, making it easier to create competitive new<br />
<strong>dye</strong>s.<br />
Moreover, as Chandler (1990) pointed out, a company could not afford to<br />
build large plants if it could not count on a steady flow <strong>of</strong> orders. Building large<br />
distribution networks hence was an effective tool for ensuring relatively steady<br />
demand for a firm’s product. Investing large sums in R&D allowed firms to keep<br />
up with advances in <strong>dye</strong> technology and introduce <strong>dye</strong>s that were adapted to<br />
changes in market demand.<br />
It is necessary to reemphasize that scope economies were relatively more important<br />
in <strong>dye</strong> making than scale economies. The marketing power <strong>of</strong> a firm like<br />
Bayer was based on its ability to construct and sell complete classes <strong>of</strong> similar<br />
<strong>dye</strong>s (that is, <strong>dye</strong>s that came in all possible shades, but had similar chemical<br />
properties such as acidity, solubility, etc.). These scope economies were crucial
186 J.P. Murmann and E. Homburg<br />
for winning customers because <strong>dye</strong>rs wanted to be able to mix and combine different<br />
<strong>dye</strong>s to construct <strong>the</strong>ir own fashionable shades. German companies such<br />
as Bayer could only make <strong>the</strong>se series <strong>of</strong> <strong>dye</strong>s because <strong>the</strong>y produced a large<br />
number <strong>of</strong> chemical intermediates. A firm that made many intermediates and<br />
<strong>dye</strong>s could make an even larger number <strong>of</strong> <strong>dye</strong>s because a particular <strong>dye</strong> <strong>of</strong>ten<br />
served as an intermediate for o<strong>the</strong>r <strong>dye</strong>s. Making hundreds <strong>of</strong> <strong>dye</strong>s and intermediates<br />
gave rise to <strong>the</strong> possibility <strong>of</strong> making thousands <strong>of</strong> different <strong>dye</strong>s. As<br />
a result, <strong>the</strong> number <strong>of</strong> different <strong>dye</strong>s increased exponentially with <strong>the</strong> number<br />
<strong>of</strong> different intermediates available. The leading syn<strong>the</strong>tic <strong>dye</strong> firms in Germany<br />
exploited <strong>the</strong>se scope economies and developed elaborate production schedules<br />
for producing different intermediates and <strong>dye</strong>s in <strong>the</strong> same production facilities<br />
(see van den Belt et al. 1984, for details). Because smaller firms could not afford<br />
to make <strong>the</strong> large number <strong>of</strong> intermediates required to make all possible shades<br />
<strong>of</strong> a <strong>dye</strong> family, large firms such as Bayer possessed an important competitive<br />
advantage. To be sure, a market for <strong>the</strong> high volume <strong>dye</strong> intermediates such as<br />
aniline developed over time, but such a market did not emerge for most intermediates<br />
before 1914. This had a number <strong>of</strong> reasons. First, patents protected several<br />
key intermediates. Second, for an independent firm to begin <strong>the</strong> manufacture<br />
<strong>of</strong> a particular intermediate, it had to have <strong>the</strong> perception that <strong>the</strong> size <strong>of</strong> <strong>the</strong><br />
market would be large enough to allow efficient production. Some firms such as<br />
Merk and Hahn produced intermediates on a very small scale to supply university<br />
laboratories and o<strong>the</strong>r experimental establishments. But a demand for large<br />
volumes <strong>of</strong> many <strong>dye</strong> intermediates did not exist, which would have enabled<br />
large-scale independent producers to enter <strong>the</strong> business at a pr<strong>of</strong>itable level. The<br />
large German <strong>dye</strong> firms recognized <strong>the</strong>ir advantage in producing intermediates<br />
efficiently and selectively sold some <strong>of</strong> <strong>the</strong>ir intermediates to o<strong>the</strong>r firms that<br />
were not perceived as a serious competitive threat. For all <strong>the</strong>se reasons, smaller<br />
firms were forced to concentrate on niche markets, e.g. make only blue <strong>dye</strong>s for<br />
blue and white textiles; or make black <strong>dye</strong>s for shoe polish, and so on.<br />
The syn<strong>the</strong>tic <strong>dye</strong> <strong>industry</strong> before 1914 was also characterized by a trend<br />
toward multi-plant firms. While most <strong>of</strong> <strong>the</strong> firms remained one-plant firms,<br />
some firms came to have more plants as <strong>the</strong> <strong>industry</strong> developed. In 1864 firms<br />
with two or more plants were rare. In 1913 <strong>the</strong>re were several (German) firms<br />
that operated more than four plants (in one instance even 9 plants) at home<br />
and abroad. 11 Table 2 presents <strong>the</strong> distribution <strong>of</strong> plants across firms. Our unit<br />
<strong>of</strong> analysis, which we call “firm-year,” is a particular firm in a particular year.<br />
Calculations based on firm-years produce analyses that take <strong>the</strong> life-times <strong>of</strong> <strong>the</strong><br />
firms into account. We have divided <strong>the</strong> entire period <strong>of</strong> our study (1857 to<br />
1914) into two equally long periods to examine in more detail <strong>the</strong> distribution<br />
11 In 1864, 93 firms have 99 plants; 87 are one-plant firms and 6 are two-plant firms. In 1913, 130<br />
firms have 156 plants; 114 are one-plant firms, 9 are two-plant firms, 5 are three-plant firms, 1 is a<br />
four-plant firm, and 1 is a 5-plant firm. If foreign subsidiaries are counted not as separate firms, <strong>the</strong><br />
trend toward multi-plant is even more striking. 1864: 86 firms have 99 plants, on average 1.15; 73<br />
are one-plant firms and 13 are two-plant firms. 1913: 101 firms have 166 plants, on average 1.64:<br />
77 are one-plant firms, 10 are two-plant firms, 7 are three-plant firms, 2 are four-plant firms, 2 are<br />
5-plant firms, 2 are six-plant firms, and 1 is an eight-plant firm.
Comparing evolutionary dynamics across different national settings 187<br />
<strong>of</strong> plants across firms. Altoge<strong>the</strong>r <strong>the</strong>re are 6102 firm-year observations in our<br />
database – 2522 observations until 1886 and 3580 observations after 1886. The<br />
vast majority <strong>of</strong> firms (87%) are single-plant firms in both periods. In <strong>the</strong> later<br />
period, <strong>the</strong>re are fewer 2-plant firms (8.3% versus 10.8%) and more 3-plant,<br />
4-plant, and 5-plant firms (4.8% versus 2.3%) (see Table 2 for details). If we<br />
count foreign-owned plants as plants <strong>of</strong> <strong>the</strong> mo<strong>the</strong>r company, <strong>the</strong> trend toward<br />
multi-plant firms is even more striking. In <strong>the</strong> later period, <strong>the</strong>re are fewer singleand<br />
two-plant firms (87.3% vs. 95.5%), but more firms that operate more than<br />
three plants (12.6% vs. 4.5%).<br />
Table 2. Distribution <strong>of</strong> plants across different firms in two periods<br />
Number <strong>of</strong> plants per Number <strong>of</strong> firm-years (% between brackets)<br />
firm Domestic plants only Foreign and domestic plants<br />
1857–1886 1887–1914 1857–1886 1887–1914<br />
1 2194 3114 1958 2192<br />
(87.0) (87.0) (83.1) (75.9)<br />
2 271 297 291 329<br />
(10.8) (8.3) (12.4) (11.4)<br />
3–4 57 153 97 281<br />
(2.3) (4.3) (4.1) (9.7)<br />
5–6 0 16 10 55<br />
(0.0) (0.5) (0.4) (1.9)<br />
7–9 0 0 0 30<br />
(0.0) (0.0) (0.0) (1.0)<br />
Total 2522 3580 2356 2887<br />
3 Country patterns<br />
Present formulations <strong>of</strong> evolutionary <strong>the</strong>ory make no predictions that patterns <strong>of</strong><br />
<strong>industry</strong> evolution at smaller social units such as countries would be different<br />
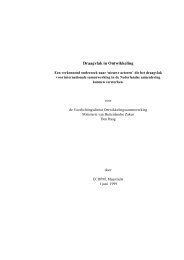
from patterns at <strong>the</strong> global level. A plot <strong>of</strong> <strong>the</strong> number <strong>of</strong> firms for individual<br />
countries (Fig. 3) reveals, however, striking dissimilarities at <strong>the</strong> country level<br />
from <strong>the</strong> pattern we saw earlier at <strong>the</strong> global level. 12<br />
Industry shakeout in France<br />
France, just as in <strong>the</strong> <strong>case</strong> <strong>of</strong> <strong>the</strong> global <strong>industry</strong>, displays a steep rise in <strong>the</strong><br />
number <strong>of</strong> firms from 1858 to 1862. The rise would be even steeper if we were<br />
12 We should note at this point that <strong>the</strong> national industries are, <strong>of</strong> course, not fully isolated from one<br />
ano<strong>the</strong>r but linked through trading and sometimes through common ownership. Carroll and Hannan<br />
(2000) argue that national industries are also linked by helping to legitimize a new business model<br />
at <strong>the</strong> global level. As a first approximation, it is useful to treat national industries as independent<br />
units. We will later acknowledge that know-how and products flow across borders.
188 J.P. Murmann and E. Homburg<br />
Fig. 3. Number <strong>of</strong> <strong>dye</strong> firms by country, <strong>1857–1914</strong><br />
to count also <strong>the</strong> number <strong>of</strong> intermediate chemical makers, which were numerous<br />
in France. Between 1862 and 1870 a constant steep decline occurred in <strong>the</strong><br />
French syn<strong>the</strong>tic <strong>dye</strong> <strong>industry</strong> from 21 to 7 firms (40 firms to 15 including intermediate<br />
makers). Between 1870 and 1914 <strong>the</strong> number <strong>of</strong> firms in <strong>the</strong> French<br />
<strong>dye</strong> <strong>industry</strong> stayed at a remarkably constant low level. 13 France is a clear example<br />
<strong>of</strong> an <strong>industry</strong> shakeout that appears to characterize many industries. The<br />
automobile <strong>industry</strong> is perhaps <strong>the</strong> most prominent <strong>case</strong> <strong>of</strong> a severe <strong>industry</strong><br />
shakeout documented in <strong>the</strong> literature (Carroll and Hannan, 1995; Klepper and<br />
Simmons, 1997). Carroll and Hannan report that between 1920 and 1930 <strong>the</strong><br />
American automobile <strong>industry</strong> and between 1924 and 1934 <strong>the</strong> German, British<br />
and French automobiles industries all experienced a severe shakeout. In <strong>the</strong> <strong>case</strong><br />
<strong>of</strong> <strong>the</strong> French <strong>dye</strong> <strong>industry</strong>, however, <strong>the</strong> shakeout came much more quickly than<br />
in <strong>the</strong> automobile <strong>industry</strong>. Carroll and Hannan (1995, p. 195) place <strong>the</strong> start<br />
<strong>of</strong> <strong>the</strong> French automobile <strong>industry</strong> in 1885, with <strong>the</strong> shakeout happening about<br />
40 years later. In <strong>the</strong> French <strong>dye</strong> <strong>industry</strong> <strong>the</strong> shakeout occurred within about<br />
a decade after <strong>the</strong> start <strong>of</strong> <strong>the</strong> syn<strong>the</strong>tic <strong>dye</strong> <strong>industry</strong> in 1858. Carroll and Hannan<br />
(2000) speculate that in high-tech industries shake-outs come more quickly.<br />
Syn<strong>the</strong>tic <strong>dye</strong>s undoubtedly were a high-tech <strong>industry</strong> in <strong>the</strong> 19 th century, partly<br />
confirming <strong>the</strong> Carroll-Hannan hypo<strong>the</strong>sis. But <strong>the</strong> fact that a clear shake-out<br />
only occurred in <strong>the</strong> French <strong>dye</strong> <strong>industry</strong> and not <strong>the</strong> o<strong>the</strong>r countries suggests<br />
13 The graph does not show a decline <strong>of</strong> <strong>the</strong> number <strong>of</strong> firms in <strong>the</strong> wake <strong>of</strong> <strong>the</strong> Franco-Prussian<br />
war. The loss <strong>of</strong> <strong>the</strong> few Alsatian firms was compensated by <strong>the</strong> formation <strong>of</strong> new French firms.
Comparing evolutionary dynamics across different national settings 189<br />
that being a high-tech <strong>industry</strong> is not sufficient to cause a quick shake-out. Social<br />
context matters too, as we describe in more detail below.<br />
Relatively small fluctuations in Britain<br />
The British pattern in <strong>the</strong> early years <strong>of</strong> <strong>the</strong> syn<strong>the</strong>tic <strong>dye</strong> <strong>industry</strong> resembles more<br />
<strong>the</strong> S-shaped curve that has been found in studies <strong>of</strong> diffusion <strong>of</strong> innovations,<br />
diseases, or fashions. The entry slope for Britain is not as steep as that <strong>of</strong> France.<br />
Britain, with a peak <strong>of</strong> 16 firms, never reached <strong>the</strong> <strong>industry</strong> participation level <strong>of</strong><br />
France. The period <strong>of</strong> rapid growth took place from 1859 to 1863. Britain also<br />
experienced a decline <strong>of</strong> syn<strong>the</strong>tic <strong>dye</strong> firms from 1864 to 1866, but <strong>the</strong> decline<br />
was not nearly as dramatic as in <strong>the</strong> <strong>case</strong> <strong>of</strong> France, where one can truly speak<br />
<strong>of</strong> a shakeout. Existing historiography emphasizes that Britain was <strong>the</strong> leading<br />
country in <strong>the</strong> early syn<strong>the</strong>tic <strong>dye</strong> <strong>industry</strong>, with France closely following and<br />
Germany far behind (Beer, 1959; Travis, 1993). Our data show, however, that<br />
France was not trailing at all. These findings call for a reevaluation <strong>of</strong> <strong>the</strong> early<br />
period in <strong>the</strong> syn<strong>the</strong>tic <strong>dye</strong> <strong>industry</strong> (see Fig. 3). Growth in France was earlier<br />
and quicker, and more firms participated in <strong>the</strong> French <strong>industry</strong> in <strong>the</strong> very early<br />
years. Figure 4, which plots <strong>the</strong> fraction <strong>of</strong> <strong>the</strong> global firm population that resided<br />
in each <strong>of</strong> <strong>the</strong> five major countries in a given year, makes this point forcefully.<br />
Already in 1858 <strong>the</strong> French share in <strong>the</strong> global firm population surpassed <strong>the</strong><br />
British share, and until 1870 <strong>the</strong> number <strong>of</strong> syn<strong>the</strong>tic <strong>dye</strong> firms in Britain was<br />
lower than in France. The British <strong>industry</strong> reached <strong>the</strong> lowest (relative) level<br />
in <strong>the</strong> number <strong>of</strong> firms in 1864. From 1864 to 1914 <strong>the</strong> number <strong>of</strong> <strong>industry</strong><br />
participants remained fairly constant in Britain. The British <strong>industry</strong> stabilized<br />
earlier than <strong>the</strong> French, but it is striking how <strong>the</strong> levels <strong>of</strong> <strong>industry</strong> participation<br />
became similar in <strong>the</strong> two countries from <strong>the</strong> 1870s onward, with Britain having<br />
a slightly larger number <strong>of</strong> firms than France.<br />
Germany: Long rise in <strong>the</strong> number <strong>of</strong> firms<br />
Germany also displays a steep rise in <strong>the</strong> number <strong>of</strong> firms between 1858 and<br />
1863. The number increased from 2 firms in 1858 to about 22 in 1863. Existing<br />
historiography does not discuss this early entry <strong>of</strong> a large number <strong>of</strong> firms<br />
in Germany, in part because <strong>the</strong>se early German entrants did not possess <strong>the</strong><br />
visibility <strong>of</strong> <strong>the</strong> leading British and French firms during this period. The timing<br />
<strong>of</strong> <strong>the</strong> German rise is about <strong>the</strong> same as in France, but Germany began at a<br />
lower level in 1858. The striking difference between Germany, on <strong>the</strong> one hand,<br />
and Britain and France, on <strong>the</strong> o<strong>the</strong>r, is that <strong>the</strong> number <strong>of</strong> firms in Germany<br />
continued to increase after 1863. The lasting growth in <strong>the</strong> number <strong>of</strong> German<br />
firms is <strong>the</strong> reason <strong>the</strong> dramatic shakeout that occurred in France does not show<br />
up at <strong>the</strong> global level. After a short consolidation phase (1873-76), <strong>the</strong> growth<br />
continued from 1877 to 1897. In this period <strong>the</strong> number <strong>of</strong> firms increased as<br />
a step function, alternating between periods <strong>of</strong> rapid growth and stabilization,
190 J.P. Murmann and E. Homburg<br />
Fig. 4. Country shares <strong>of</strong> global firm population<br />
rising from 24 firms in 1877 to 43 firms in 1897. This pattern is very different<br />
from both France and Britain where such growth phases did not take place. A<br />
substantial decline in <strong>the</strong> number <strong>of</strong> firms occurred in Germany much later than<br />
in France. Between 1897 and 1907 <strong>the</strong>re was a consolidation in <strong>the</strong> German <strong>dye</strong><br />
<strong>industry</strong>, and participation fell to <strong>the</strong> 1870s level <strong>of</strong> about 25 firms.<br />
Small players: Switzerland and U.S.<br />
Whereas syn<strong>the</strong>tic <strong>dye</strong> production started in Switzerland at about <strong>the</strong> same time<br />
(1859) it did in Germany and France, <strong>the</strong> first producer in <strong>the</strong> U.S. appeared<br />
only in 1864. Just as Britain, Germany and France, Switzerland experienced a<br />
steep growth from 1858–1862 when <strong>the</strong> number <strong>of</strong> firms increased from 0 to 8.<br />
Parallel to <strong>the</strong> situation in France, a first decline set from 1862 to 1866 in which<br />
<strong>the</strong> number <strong>of</strong> firms fell from 8 to 4. Between 1867 and 1873 <strong>the</strong> number <strong>of</strong><br />
firms increased again from 4 to 7. This is different from France where <strong>the</strong> number<br />
<strong>of</strong> firms did not increase in <strong>the</strong> late 1860s and early 1870s, but was similar to<br />
<strong>the</strong> German pattern <strong>of</strong> growth in <strong>the</strong> number <strong>of</strong> firms. From 1871 until <strong>the</strong> First<br />
World War <strong>the</strong> number <strong>of</strong> firms was roughly <strong>the</strong> same in France and Switzerland,<br />
but <strong>the</strong>re was one important difference: on average <strong>the</strong> Swiss firms were larger<br />
than <strong>the</strong>ir French counterparts. With a 7% share in world <strong>dye</strong> production in<br />
1913, <strong>the</strong> Swiss <strong>dye</strong> <strong>industry</strong> had, to be sure, only one tenth <strong>of</strong> <strong>the</strong> size <strong>of</strong> <strong>the</strong>ir<br />
German counter parts, but it was larger than <strong>the</strong> <strong>dye</strong> <strong>industry</strong> <strong>of</strong> countries with<br />
a far greater population or textile <strong>industry</strong>, such as Great Britain (6.5% <strong>of</strong> world
Comparing evolutionary dynamics across different national settings 191<br />
<strong>dye</strong> production), France (5.4%) and <strong>the</strong> United States (3.3%) (Thissen, 1922,<br />
p. 18). 14 If we eliminate from our analysis all domestic or foreign subsidiary<br />
firms, it becomes even more apparent that <strong>the</strong> Swiss <strong>dye</strong> <strong>industry</strong> surpassed <strong>the</strong><br />
French one. Figure 5 graphs <strong>the</strong> number <strong>of</strong> firms by country without counting<br />
subsidiaries and shows that by 1884 <strong>the</strong>re were more domestically owned firms<br />
in Switzerland than in France. German companies had bought up many <strong>of</strong> <strong>the</strong><br />
French plants.<br />
Fig. 5. Number <strong>of</strong> <strong>dye</strong> firms by country, <strong>1857–1914</strong><br />
The United States is different from <strong>the</strong> four o<strong>the</strong>r countries in that it did<br />
not experience an initial steep take-<strong>of</strong>f (Fig. 3). From 1864 to 1875 only two<br />
firms participated in <strong>the</strong> <strong>industry</strong> (1868 being an exception with 3 firms). A<br />
steep growth occurred in <strong>the</strong> U.S. from 1878 to 1882 when <strong>the</strong> number <strong>of</strong> firms<br />
increased from 3 to 10 firms. What happened at this time in <strong>the</strong> U.S. is in striking<br />
contrast to France and Britain, but parallel to <strong>the</strong> growth in Germany. Between<br />
1883 and 1884 <strong>the</strong> number <strong>of</strong> firms decreased rapidly by 50% from 10 to 5 firms.<br />
For <strong>the</strong> next 20 years <strong>the</strong> number <strong>of</strong> firms hovered around 5 firms. Unlike in <strong>the</strong><br />
four o<strong>the</strong>r countries, <strong>the</strong> number <strong>of</strong> firms in <strong>the</strong> U.S. <strong>industry</strong> grew from 5 in<br />
1897 to 12 in 1914. This increase sharply contrasts with <strong>the</strong> consolidation <strong>of</strong> <strong>the</strong><br />
German <strong>industry</strong> after 1897.<br />
14 Comparing <strong>the</strong> number <strong>of</strong> firms in two countries does not necessarily tell us about <strong>the</strong>ir relative<br />
market share. One country with fewer firms could have more output than a second country with<br />
more firms. However, in comparing longitudinal trends in an <strong>industry</strong> where firms compete with one<br />
ano<strong>the</strong>r across borders, it can give us a hint about <strong>the</strong> relative performance <strong>of</strong> national industries.
192 J.P. Murmann and E. Homburg<br />
Comparing <strong>the</strong> distribution <strong>of</strong> plants across firms in <strong>the</strong> five different countries<br />
Earlier, at <strong>the</strong> global level, we saw that <strong>the</strong> frequency <strong>of</strong> multi-plant firms increased<br />
over time (see Table 2). Before examining whe<strong>the</strong>r this pattern holds<br />
true in <strong>the</strong> five major countries as well, it is useful to look at <strong>the</strong> distribution<br />
<strong>of</strong> multi-plant firms for each country over <strong>the</strong> entire period. Table 3 reveals that<br />
only German and French firms ever had more than two domestic plants. And<br />
only German firms ever operated at home more than three plants at <strong>the</strong> same<br />
time. The temporal dynamics at <strong>the</strong> country level are also noteworthy. The trend<br />
<strong>of</strong> an increasing frequency <strong>of</strong> multi-plant firms that we saw at <strong>the</strong> global level is<br />
not true for every single country. Again comparing <strong>the</strong> period before 1887 with<br />
<strong>the</strong> period 1887-1914, <strong>the</strong> number <strong>of</strong> multi-plant firms declines in Britain and<br />
France. 15 German firms were clearly driving <strong>the</strong> global pattern. The frequency<br />
<strong>of</strong> 3-plant firms increases from 4.4 % to 6.9%, 4-plant firms from 0.6% to 2.9%<br />
and 5-plant firms from 0% to 1.0%.<br />
Table 3. Number <strong>of</strong> <strong>dye</strong> plants per firm across <strong>the</strong> different countries<br />
Numbers Number <strong>of</strong> firm-years (% in paren<strong>the</strong>ses)<br />
<strong>of</strong> Britain France Germany Switzerland U.S.<br />
plants/<br />
firm<br />
Home All Home All Home All Home All Home All<br />
1 834 747 966 683 2082 1813 352 272 492 325<br />
(83.1) (79.3) (93.4) (87.6) (80.2) (72.5) (96.7) (78.6) (97.8) (96.7)<br />
2 169 173 62 75 295 308 12 30 11 11<br />
(16.8) (18.4) (6.0) (9.6) (11.4) (12.3) (3.3) (8.7) (2.2) (3.3)<br />
3–4 0 22 6 18 204 291 0 40 0 0<br />
(0.0) (2.3) (0.6) (2.3) (7.5) (11.6) (0.0) (11.6) (0.0) (0.0)<br />
5–6 0 0 0 4 16 57 0 4 0 0<br />
(0.0) (0.0) (0.0) (0.5) (0.6) (2.3) (0.0) (1.2) (0.0) (0.0)<br />
7–9 0 0 0 0 0 30 0 0 0 0<br />
(0.0) (0.0) (0.0) (0.0) (0.0) (1.2) (0.0) (0.0) (0.0) (0.0)<br />
Total 1003 942 1034 780 2597 2499 364 346 503 336<br />
Explanation <strong>of</strong> <strong>the</strong> table: “Home” refers to domestic plants <strong>of</strong> a firm; “All” refers to <strong>the</strong> sum <strong>of</strong> (1)<br />
<strong>the</strong> domestic plants that are not owned by a foreign firm and (2) <strong>the</strong> plants owned by domestic firms<br />
in o<strong>the</strong>r countries.<br />
When <strong>the</strong> analysis also includes plants that firms owned in foreign countries,<br />
<strong>the</strong> patterns are even more striking. If a German firm owned a plant in <strong>the</strong> U.S.,<br />
for example, <strong>the</strong> plant would not be counted in this analysis among <strong>the</strong> U.S.<br />
plants but among <strong>the</strong> German. The maximum number <strong>of</strong> plants controlled by a<br />
particular firm <strong>the</strong>n jumps from 5 to 9 for Germany, from 2 to 6 for Switzerland,<br />
from 3 to 6 for France, and from 2 to 3 for Britain. In <strong>the</strong> <strong>case</strong> <strong>of</strong> <strong>the</strong> U.S. <strong>the</strong><br />
maximum remains at 2. The trend toward multi-plant firms appears not to be true<br />
for Britain, and only partially true for France (<strong>the</strong> percentage <strong>of</strong> 2-plant firms<br />
15 More detailed figures on <strong>the</strong> distribution <strong>of</strong> plants across firms for <strong>the</strong> different national industries<br />
can be obtained from <strong>the</strong> first author upon request.
Comparing evolutionary dynamics across different national settings 193<br />
increases from 3.8% to 9.5% but <strong>the</strong> percentage <strong>of</strong> three-plant firms falls from<br />
0.9% to 0%). The most significant drivers behind <strong>the</strong> trend are still Germany and<br />
Switzerland. In Germany <strong>the</strong> frequency <strong>of</strong> 3-plant firms increased from 3.2%<br />
before 1887 to 11.0% in <strong>the</strong> years 1887–1914. The numbers for 4-, 5-, 6-, 7-,<br />
8- and 9-plant firms also increased after 1887. In Switzerland, <strong>the</strong> frequency <strong>of</strong><br />
3-plant firms increases from 0% to 13.8%, and numbers for 4-, 5- and 6-plant<br />
firms increased as well.<br />
4 Forces causing differences in evolutionary patterns<br />
Until now we have <strong>of</strong>fered descriptions but we have not provided any explanation<br />
for <strong>the</strong> observed differences in patterns. Our next task is to excavate <strong>the</strong> forces<br />
that most likely were responsible for <strong>the</strong> specific country patterns. Let us briefly<br />
bring back into focus some <strong>of</strong> <strong>the</strong> striking patterns and <strong>the</strong>n identify plausible<br />
causes. We need to explain<br />
1) why rapid entry occurred early in <strong>the</strong> <strong>industry</strong> in Germany, Britain, France,<br />
and Switzerland, but not <strong>the</strong> U.S.?<br />
2) why, in <strong>the</strong> very early years, more firms entered in France than in any o<strong>the</strong>r<br />
country?<br />
3) why, in <strong>the</strong> very early years, more firms entered in Germany than in Britain<br />
(18 versus 10)?<br />
4) why German <strong>industry</strong> participation continued to increase after <strong>the</strong> consolidation<br />
phases in <strong>the</strong> mid 1860s while British and French <strong>industry</strong> participation<br />
stayed ra<strong>the</strong>r steady at a much lower level?<br />
5) why a dramatic shakeout occurred only in France?<br />
6) why France never recovered from <strong>the</strong> shakeout while <strong>the</strong> U.S. and Switzerland<br />
saw <strong>the</strong>ir numbers <strong>of</strong> firms increase from <strong>the</strong> late 1870s onward?<br />
7) why <strong>the</strong> number <strong>of</strong> firms decreased in Germany after 1897, but much less so<br />
in France and Britain?<br />
8) why U.S. <strong>industry</strong> participation increased in <strong>the</strong> years just before <strong>the</strong> First<br />
World War?<br />
9) and why Germany came to dominate <strong>the</strong> <strong>industry</strong> with 75% market share in<br />
1914?<br />
Let us take <strong>the</strong>m in turn. Given <strong>the</strong> space limitations <strong>of</strong> an article, we can support<br />
many <strong>of</strong> our arguments only with a short discussion. For a more detailed treatment<br />
<strong>of</strong> many points, see Murmann (1998, 2000).<br />
Pattern 1: The United States did not experience rapid entry into <strong>the</strong> <strong>industry</strong><br />
because <strong>the</strong> market for syn<strong>the</strong>tic <strong>dye</strong>s in <strong>the</strong> U.S. was much smaller than in<br />
Europe in <strong>the</strong> early years. Initially, syn<strong>the</strong>tic <strong>dye</strong>s were very expensive and<br />
only applied to luxury textiles such as silk. Because colorists traveled from one<br />
<strong>dye</strong>r to <strong>the</strong> next, a network <strong>of</strong> leading silk <strong>dye</strong>ing firms had developed across<br />
Europe. The biographies <strong>of</strong> <strong>the</strong> leading colorists reveal that this network extended<br />
from Britain to Russia (and everywhere in between) in <strong>the</strong> 1860s, but not to
194 J.P. Murmann and E. Homburg<br />
<strong>the</strong> U.S. The U.S. was simply not included in this important network through<br />
which <strong>the</strong> early aniline <strong>dye</strong> knowledge was transmitted (Homburg, 1983). Second,<br />
and less significantly, 16 <strong>the</strong> U.S. did not possess a large number <strong>of</strong> people who<br />
had <strong>the</strong> skills to start production <strong>of</strong> organic intermediate chemicals or syn<strong>the</strong>tic<br />
<strong>dye</strong>s. Without organic intermediates, <strong>dye</strong> production was not possible unless<br />
entrepreneurs imported intermediates from Europe.<br />
Pattern 2: France most likely experienced <strong>the</strong> largest amount <strong>of</strong> entry in<br />
<strong>the</strong> early years because <strong>of</strong> <strong>the</strong> very three factors that were absent in <strong>the</strong> U.S.<br />
Most importantly, as home <strong>of</strong> <strong>the</strong> largest market for luxury textiles, <strong>the</strong> highest<br />
demand for <strong>the</strong> initially very expensive syn<strong>the</strong>tic <strong>dye</strong>s occurred in France. Many<br />
entrepreneurs decided to enter <strong>the</strong> market when <strong>the</strong>y saw how large <strong>the</strong> demand<br />
for Perkin’s aniline purple was in France (Homburg, 1983). The perceived size <strong>of</strong><br />
<strong>the</strong> French market acted as an inducement for potential entrepreneurs. Secondly,<br />
before 1857, an infrastructure <strong>of</strong> organic intermediate producers existed in France<br />
who supplied producers <strong>of</strong> perfumes and semi-syn<strong>the</strong>tic <strong>dye</strong>s sold on <strong>the</strong> luxury<br />
market (Chateau, 1868). 17 These intermediate producers had experience that <strong>the</strong>y<br />
could use to integrate forward into syn<strong>the</strong>tic <strong>dye</strong> production or, alternatively, to<br />
produce and sell <strong>dye</strong> intermediates to newly formed syn<strong>the</strong>tic <strong>dye</strong> companies.<br />
Thirdly, besides a developed market for intermediates, France possessed two<br />
important centers <strong>of</strong> chemistry, one in Paris and one in Lyon. Pelouze’s laboratory<br />
in Paris trained students who subsequently founded many <strong>of</strong> <strong>the</strong> syn<strong>the</strong>tic <strong>dye</strong><br />
firms around <strong>the</strong> city (Travis, 1993, pp. 149-150, pp. 71–72, p. 79).<br />
Pattern 3: Why was <strong>the</strong> entry rate in <strong>the</strong> early years higher in Germany than in<br />
Britain even though Germany’s textile <strong>industry</strong> was about 23 times smaller than<br />
that <strong>of</strong> Britain? The most important reason seems to lie in <strong>the</strong> patent system. In<br />
Britain <strong>dye</strong>s were protected by patents, whereas in Germany no such protection<br />
existed because <strong>the</strong> customs union (Zollverein) eliminated any effective patent<br />
protection. 18 This meant that anyone who wished to enter <strong>the</strong> syn<strong>the</strong>tic <strong>dye</strong><br />
business in Germany could do so. But in Great Britain entry into <strong>the</strong> <strong>dye</strong> business<br />
was severely restricted because, starting with Perkin’s aniline purple, many <strong>of</strong><br />
<strong>the</strong> syn<strong>the</strong>tic <strong>dye</strong>s were under patent protection.<br />
Pattern 4: Why did German <strong>industry</strong> participation continue to increase after<br />
<strong>the</strong> mid 1860s, contrary to <strong>the</strong> developments in France and Britain? Again <strong>the</strong><br />
patent legislation seems to have made all <strong>the</strong> difference. Because patent protection<br />
was not available in Germany until unification and <strong>the</strong> creation <strong>of</strong> an<br />
16 Skills in organic chemistry were much less important in this early phase. We came to this<br />
conclusion in part by studying <strong>the</strong> question <strong>of</strong> why a syn<strong>the</strong>tic <strong>dye</strong> <strong>industry</strong> did not emerge in <strong>the</strong><br />
Ne<strong>the</strong>rlands in <strong>the</strong> 1860s. There was some <strong>of</strong> knowledge <strong>of</strong> organic chemistry in <strong>the</strong> Ne<strong>the</strong>rlands, but<br />
virtually no silk <strong>dye</strong>ing or o<strong>the</strong>r production activity for <strong>the</strong> luxury textile market. The Dutch textile<br />
firms were isolated from <strong>the</strong> leading textile producers abroad and hence did not learn about <strong>the</strong> new<br />
<strong>dye</strong>s as quickly.<br />
17 A semi-syn<strong>the</strong>tic <strong>dye</strong> such as murexide involved in its manufacture and application both <strong>the</strong><br />
traditional natural <strong>dye</strong> extraction techniques as well as syn<strong>the</strong>tic chemical procedures. See Homburg<br />
(1983) for details.<br />
18 A special article (an 1842 addition) in <strong>the</strong> Zollverein (customs union) agreement did allow <strong>the</strong><br />
member states to grant patents in <strong>the</strong>ir territories, but forbade members to prevent producers in o<strong>the</strong>r<br />
member states from selling <strong>the</strong> product in all member states (Penrose, 1951, p. 14; Heggen, 1975).
Comparing evolutionary dynamics across different national settings 195<br />
all-German patent system (1877), German entrepreneurs could continue to enter<br />
<strong>the</strong> <strong>industry</strong> after <strong>the</strong> consolidation phase in <strong>the</strong> mid 1860s by imitating <strong>the</strong><br />
products <strong>of</strong> existing producers both at home and abroad. A second reason why<br />
<strong>industry</strong> participation probably resumed its growth in Germany relates to <strong>the</strong> entrepreneurial<br />
risk set. Several German states invested considerably in <strong>the</strong> creation<br />
<strong>of</strong> chemical laboratories for <strong>the</strong> training <strong>of</strong> students. During <strong>the</strong> 1860s Prussia<br />
built large and luxurious chemical laboratories in Bonn and Berlin, and Saxony<br />
erected a laboratory <strong>of</strong> similar standing at Leipzig (Bentley, 1972; Homburg,<br />
1993, pp. 11–12). Germany, unlike France and Britain, continued to produce an<br />
ever larger number <strong>of</strong> qualified chemists who could venture into <strong>the</strong> syn<strong>the</strong>tic<br />
<strong>dye</strong> <strong>industry</strong>. Fur<strong>the</strong>rmore, <strong>the</strong> large German syn<strong>the</strong>tic <strong>dye</strong> firms constituted an<br />
important knowledge and experience pool. Several <strong>of</strong> <strong>the</strong> smaller German firms<br />
were founded by chemists who had previously gained experience working for<br />
one <strong>of</strong> <strong>the</strong> larger firms. 19 In <strong>the</strong> British and French <strong>dye</strong> industries, which beginning<br />
in 1862 were populated by fewer firms (see Fig. 3), opportunities for such<br />
spillovers were more limited. In Germany <strong>the</strong>re were more entries, but also more<br />
exits in <strong>the</strong> <strong>dye</strong> <strong>industry</strong>. Because German firms in <strong>the</strong> early period <strong>of</strong> <strong>the</strong> <strong>dye</strong><br />
<strong>industry</strong> were not protected by patents as was <strong>the</strong> <strong>case</strong> in Britain and France, in<br />
Germany a Darwinian type <strong>of</strong> process weeded out many firms and only allowed<br />
<strong>the</strong> strongest firms to survive.<br />
Why did <strong>the</strong> number <strong>of</strong> German firms not go down in <strong>the</strong> mid-1860s when<br />
competition became very fierce? The market for syn<strong>the</strong>tic <strong>dye</strong>s continued to<br />
expand because step by step natural <strong>dye</strong>s were replaced by syn<strong>the</strong>tic counterparts.<br />
Moreover, <strong>the</strong> German economy as a whole was growing much faster than <strong>the</strong><br />
economies <strong>of</strong> France and Britain. It is very likely that <strong>the</strong> number <strong>of</strong> German<br />
firms rose until around 1890 because technological advances in syn<strong>the</strong>tic <strong>dye</strong>s<br />
opened up new market segments. When this was no longer <strong>the</strong> <strong>case</strong> in <strong>the</strong> mid-<br />
1890s, <strong>the</strong> number <strong>of</strong> firms dropped in Germany.<br />
Pattern 5: Why did a dramatic shakeout occur only in France? France had<br />
an effective patent law on <strong>the</strong> books. The shakeout in France most likely was a<br />
direct result <strong>of</strong> one company, La Fuchsine, receiving a sweeping patent grant in<br />
late 1863 after a protracted legal battle with rival producers. By court order, La<br />
Fuchsine obtained a patent for aniline red that served as a precursor to numerous<br />
o<strong>the</strong>r syn<strong>the</strong>tic <strong>dye</strong>s and <strong>the</strong>reby was able to use <strong>the</strong> French police to shut down<br />
many rival producers (van den Belt, 1992). In effect, <strong>the</strong> French patent ruling<br />
was responsible for <strong>the</strong> shakeout that occurred in France. At least seven firms<br />
19 Examples are: Dr. E. Ullrich was chemist at Bayer, 1865-1867. Thereafter he was involved in <strong>the</strong><br />
founding <strong>of</strong> several small firms: Frische (& Ullrich) in 1867; Ullrich & Gro<strong>the</strong> around 1874, and an<br />
alizarin factory in Austria. Dr. P. Greiff was a chemist <strong>of</strong> J.W. Weiler in <strong>the</strong> 1860s. He <strong>the</strong>n founded<br />
Chemische Fabrik von Dr. P. Greiff. Dr. E. ter Meer was chemist at BASF, and founded Dr. E. ter<br />
Meer & Co. in 1878. Dr. Marx and Dr. Mueller both were chemists at <strong>the</strong> ter Meer company. They<br />
founded Marx and Mueller in 1887. Dr. F. Raschig was a BASF-chemist before founding his own<br />
company, Dr. F. Raschig. Dr. Wal<strong>the</strong>r Wolff was chemist at AGFA before he founded Dr. Wal<strong>the</strong>r<br />
Wolff.
196 J.P. Murmann and E. Homburg<br />
(Feer, Durand, Dollfus, Guinon/Monnet, Gerber-Keller, and Poirrier 20 ) closed<br />
down production and set up shops across <strong>the</strong> border in Switzerland (which had<br />
no patent law). O<strong>the</strong>r French firms had to focus on minor <strong>dye</strong>s. In Britain, by<br />
contrast, Thomas Holliday through litigation was able to invalidate <strong>the</strong> important<br />
arsenic acid process patent for aniline red held by <strong>the</strong> firm Simpson, Maule and<br />
Nicholson, and as a result firms could enter freely into this important <strong>dye</strong> market<br />
by 1865 (Travis 1993, pp. 104–137).<br />
Pattern 6: But why did <strong>the</strong> French <strong>industry</strong> not recover after new <strong>dye</strong>s were<br />
invented that did not fall under <strong>the</strong> La Fuchsine patent? It seems that three<br />
dynamics conspired to make it very difficult for <strong>the</strong> French <strong>industry</strong> to reclaim<br />
its leadership position. German companies had become very strong by <strong>the</strong> late<br />
1860s and exported <strong>the</strong>ir product to France. 21 This meant that new entrants into<br />
<strong>the</strong> French <strong>dye</strong> <strong>industry</strong> would have to convince customers that <strong>the</strong>ir product was<br />
ei<strong>the</strong>r cheaper or better than what German and existing French firms had to <strong>of</strong>fer.<br />
Second, German firms started to patent new <strong>dye</strong> innovations in France, buy up<br />
French plants, and produce <strong>the</strong> patented <strong>dye</strong> in France in small quantities while<br />
exporting large quantities from <strong>the</strong>ir German plants. By concentrating production<br />
in <strong>the</strong>ir home factories, German firms captured economies <strong>of</strong> scale and scope.<br />
A third factor was that <strong>the</strong> most influential teacher in <strong>the</strong> field <strong>of</strong> industrial<br />
organic chemistry in France, Th.-J. Pelouze, died in 1867. His private laboratory<br />
had been a breeding ground for dozens <strong>of</strong> young industrial chemists, several<br />
<strong>of</strong> whom went into <strong>the</strong> <strong>dye</strong> <strong>industry</strong>. When Pelouze died <strong>the</strong>re was no one to<br />
continue his successful teaching laboratory, and <strong>the</strong>refore <strong>the</strong> production <strong>of</strong> highly<br />
qualified organic chemists who could start new <strong>dye</strong> ventures virtually ended for<br />
many years (Leprieur, 1979). As a result, <strong>the</strong> risk set <strong>of</strong> potential entrepreneurs<br />
decreased dramatically in France. At this particular time, <strong>the</strong> structural differences<br />
in <strong>the</strong> French and German university systems made <strong>the</strong> supply <strong>of</strong> entrepreneurs<br />
in France much less robust than in Germany. The centralized French academic<br />
system, which had one major chemical research center in Paris and one more<br />
in Lyon, was much more vulnerable to a temporary dramatic loss in quality and<br />
output than <strong>the</strong> decentralized German system. If one German center declined for<br />
some time, <strong>the</strong>re were still about 7 major centers <strong>of</strong> organic chemistry research<br />
and teaching left. 22<br />
Why did <strong>the</strong> number <strong>of</strong> Swiss and U.S. firms increase at <strong>the</strong> same time? The<br />
superior performance <strong>of</strong> <strong>the</strong> Swiss <strong>dye</strong> <strong>industry</strong> appears to have been mainly due<br />
to two factors: <strong>the</strong> aforementioned absence <strong>of</strong> a patent law, and <strong>the</strong> presence<br />
20 Poirier did not close down its entire firm in France but transferred its fuchsine <strong>dye</strong> production<br />
to Switzerland.<br />
21 German companies had become very competitive because only <strong>the</strong> strongest ones survived <strong>the</strong><br />
intense competition among <strong>the</strong> German producers in <strong>the</strong> early years <strong>of</strong> <strong>the</strong> <strong>dye</strong> <strong>industry</strong>. Germany<br />
had a larger pool on which selection could operate because <strong>the</strong> manufacture <strong>of</strong> fuchsine (= aniline<br />
red) was a precursor in <strong>the</strong> production <strong>of</strong> many o<strong>the</strong>r <strong>dye</strong>s that were derived from fuchsine [for<br />
details see Hornix (1992) and Hornix in van den Belt et al. (1984)]. In <strong>the</strong> mid-1860s, <strong>the</strong>re were<br />
many fuchsine producers in Germany, in Britain a few, and in France only one, La Fuchsine.<br />
22 Altoge<strong>the</strong>r <strong>the</strong>re were about 30 university and technical university departments in organic chemistry<br />
in Germany at <strong>the</strong> time.
Comparing evolutionary dynamics across different national settings 197<br />
<strong>of</strong> <strong>the</strong> Eidgenössiche Technische Hochschule (ETH), which <strong>the</strong>n was a leading<br />
research center in organic and industrial chemistry. The absence <strong>of</strong> a patent law<br />
had been a major cause in <strong>the</strong> birth <strong>of</strong> <strong>the</strong> Swiss <strong>dye</strong> <strong>industry</strong> - when several<br />
French <strong>dye</strong> makers settled in Switzerland in order to evade <strong>the</strong> La Fuchsine <strong>dye</strong><br />
monopoly in France – and remained important since it enabled <strong>the</strong> Swiss to copy<br />
<strong>the</strong> inventions made by <strong>the</strong>ir foreign competitors. (The U.S. <strong>case</strong> is discussed in<br />
pattern 8.)<br />
Pattern 7: Why did <strong>the</strong> number <strong>of</strong> firms decrease substantially in Germany<br />
after 1897, but much less so in France and Britain? Until <strong>the</strong> early 1890s new<br />
classes <strong>of</strong> syn<strong>the</strong>tic <strong>dye</strong>s were being discovered that gave firms an opportunity to<br />
move into less competitive niches. This was no longer <strong>the</strong> <strong>case</strong> by <strong>the</strong> mid-1890s.<br />
The large firms had all created R&D laboratories and <strong>of</strong>fered a full portfolio <strong>of</strong><br />
<strong>dye</strong>s to customers. Moreover, by this time nearly all natural <strong>dye</strong>s gradually had<br />
been replaced by syn<strong>the</strong>tic ones. The process <strong>of</strong> substitution - which had given<br />
<strong>the</strong> syn<strong>the</strong>tic <strong>industry</strong> an additional growth impetus during <strong>the</strong> first decades <strong>of</strong><br />
its existence - came to an end. Unable to avoid fierce competition, some firms<br />
decided to exit <strong>the</strong> <strong>industry</strong> or engage in mergers, 23 initiating a consolidation<br />
<strong>of</strong> <strong>the</strong> German <strong>industry</strong>. This increased level <strong>of</strong> competition manifested itself<br />
also in <strong>the</strong> formation <strong>of</strong> large cartels. 24 Unlike <strong>the</strong> <strong>case</strong> in Britain, German law<br />
made it possible to enforce cartel agreements in a court <strong>of</strong> law just as any o<strong>the</strong>r<br />
regular business contract. The first attempt to form a cartel took place in 1877<br />
among alizarin producers, and cartel agreements for particular classes <strong>of</strong> <strong>dye</strong>s<br />
subsequently proliferated. Between 1904 and 1907, <strong>the</strong> largest manufacturers<br />
formed two cartels (Dreibund [Union <strong>of</strong> Three] and Dreiverband [Association<br />
<strong>of</strong> Three]) which reduced competition within <strong>the</strong> two cartels, but at <strong>the</strong> same<br />
time threatened <strong>the</strong> existence <strong>of</strong> all <strong>the</strong> companies that stayed outside <strong>the</strong>se two<br />
powerful cartels. 25 Probably <strong>the</strong> chief reason why <strong>the</strong> number <strong>of</strong> firms did not<br />
fall even fur<strong>the</strong>r in France and Britain is that <strong>the</strong> dominant German producers<br />
found it in <strong>the</strong>ir interest to keep a few French or British firms in business.<br />
If all French and British producers had ceased to exist, <strong>the</strong>ir respective national<br />
governments would have been more responsive to calls demanding <strong>the</strong> protection<br />
<strong>of</strong> <strong>the</strong> national <strong>industry</strong> and, as a consequence, German producers likely would<br />
have suffered. Russia, for example, increased <strong>the</strong> protection <strong>of</strong> its <strong>dye</strong> <strong>industry</strong><br />
and this forced German firms to create local plants.<br />
Pattern 8: Why did <strong>the</strong> U.S. <strong>industry</strong> participation increase in <strong>the</strong> years just<br />
before WW I? The American textile market in 1913 was larger than that <strong>of</strong><br />
France (approximately 3.5 times), Germany (2.5 times) and Switzerland (20<br />
23 Notable examples <strong>of</strong> such mergers are (1) Chemische Fabrik Griesheim AG which merged with<br />
Chemische Fabrik Elektron and with Chemikalienwerk Mainthal, and (2) Marx & Müller, which<br />
merged with Farbwerk Griesheim, to form <strong>the</strong> Chemikalienwerk Griesheim.<br />
24 See Beer (1959, pp. 115–133) for details on how <strong>the</strong> increased competition led to <strong>the</strong> formation<br />
<strong>of</strong> cartels.<br />
25 The “Dreibund” (Union <strong>of</strong> Three), formed in 1904, was made up <strong>of</strong> Bayer, BASF as well as<br />
AGFA and <strong>the</strong> “Dreiverband” (Association <strong>of</strong> Three), formed in 1905–1907, was made up <strong>of</strong> Hoechst,<br />
Cassella and Kalle.
198 J.P. Murmann and E. Homburg<br />
times). 26 British, German and Swiss producers had always supplied <strong>the</strong> bulk<br />
<strong>of</strong> <strong>dye</strong>s to American <strong>dye</strong>rs and printers. Especially after <strong>the</strong> textile lobby was<br />
able to persuade <strong>the</strong> U.S. Congress in 1883 to lower <strong>the</strong> tariffs on syn<strong>the</strong>tic <strong>dye</strong>s<br />
by removing <strong>the</strong> 50 cents per pound specific duty (in addition to an ad valorem<br />
duty), half <strong>of</strong> <strong>the</strong> existing U.S. firms failed. This led to an even greater dependence<br />
on foreign producers. Just as in <strong>the</strong> <strong>case</strong> <strong>of</strong> Britain, <strong>the</strong> powerful textile<br />
<strong>industry</strong> <strong>of</strong> <strong>the</strong> United States was able to prevent, with one exception in 1897,<br />
<strong>the</strong> enactment <strong>of</strong> higher tariffs (Haynes, 1954, p. 311). 27 What, <strong>the</strong>n, caused an<br />
increase in <strong>the</strong> number <strong>of</strong> firms just before <strong>the</strong> First World War?<br />
It is well known in <strong>the</strong> historiography <strong>of</strong> <strong>the</strong> American <strong>dye</strong> <strong>industry</strong> that before<br />
1914 some German and Swiss firms opened subsidiaries in <strong>the</strong> U.S. where <strong>the</strong>y<br />
produced small quantities <strong>of</strong> <strong>dye</strong>s while shipping most <strong>of</strong> <strong>the</strong> <strong>dye</strong>s to <strong>the</strong> U.S.<br />
from Europe. To rule out <strong>the</strong> possibility that <strong>the</strong> increase in <strong>the</strong> number <strong>of</strong> firms<br />
was solely due to newly-established German and Swiss subsidiaries in <strong>the</strong> U.S.,<br />
we analyzed <strong>the</strong> <strong>industry</strong> structures in <strong>the</strong> 5 countries omitting from <strong>the</strong> sample<br />
those firms that were owned by ano<strong>the</strong>r <strong>dye</strong> firm (see Fig. 5 for <strong>the</strong> results <strong>of</strong> this<br />
analysis). In <strong>the</strong> <strong>case</strong> <strong>of</strong> <strong>the</strong> U.S. this means, for example, that all subsidiaries<br />
<strong>of</strong> foreign firms would not count as part <strong>of</strong> <strong>the</strong> U.S. <strong>dye</strong> <strong>industry</strong>. Based on this<br />
definition <strong>of</strong> a domestic <strong>industry</strong>, no firm operated in <strong>the</strong> American <strong>dye</strong> <strong>industry</strong><br />
in <strong>the</strong> years from 1869 to 1875, and after 1875 <strong>the</strong>re was always at least one<br />
British, German and Swiss firm that ran a subsidiary in <strong>the</strong> U.S. But even under<br />
this restricted definition <strong>of</strong> <strong>the</strong> U.S. <strong>dye</strong> <strong>industry</strong>, a sharp increase in <strong>the</strong> number<br />
<strong>of</strong> firms shows up starting in 1908. American-owned firms are clearly behind<br />
this entry wave. The number <strong>of</strong> firms jumps from 5 in 1906 to 12 in 1909.<br />
The most likely factor responsible for <strong>the</strong> increase in <strong>the</strong> number <strong>of</strong> U.S.<br />
firms is that <strong>the</strong> technology for some organic intermediates had gradually diffused<br />
to <strong>the</strong> U.S. Although most <strong>dye</strong> intermediates were still imported at this<br />
time from Germany, <strong>the</strong> availability <strong>of</strong> some <strong>dye</strong> intermediates in <strong>the</strong> U.S. allowed<br />
entrepreneurs to enter <strong>the</strong> <strong>industry</strong> in niche markets where <strong>the</strong>y would not<br />
be as easily attacked by <strong>the</strong> large German and Swiss <strong>dye</strong> firms. The most concerted<br />
effort to break <strong>the</strong> German hold upon key coal-tar intermediates was <strong>the</strong><br />
Benzol Products company, which was organized in 1910 by <strong>the</strong> suppliers <strong>of</strong> key<br />
raw-materials – General Chemical, acids; Semet-Solvay, benzol and alkalis; and<br />
Barrett, which provided <strong>the</strong> plant. When <strong>the</strong> new company began to sell its products,<br />
German producers started a price-war, absorbing a recently enacted 10%<br />
tariff on aniline oil and lowering prices to undercut <strong>the</strong> new entrant (Welsh, 1944,<br />
pp. 65–66; Haynes, 1954, pp. 316–317). The Benzol company in <strong>the</strong> beginning<br />
sold aniline for $0.115 per pound and later could only charge $0.02 per pound.<br />
While <strong>the</strong> dramatic reduction in price was bad for <strong>the</strong> company itself – it rarely<br />
made a pr<strong>of</strong>it before <strong>the</strong> First World War – it is likely that local entrepreneurs<br />
took advantage <strong>of</strong> much lower intermediate prices and entered <strong>the</strong> syn<strong>the</strong>tic <strong>dye</strong><br />
<strong>industry</strong>.<br />
26 The British textile market was still twice as large as that <strong>of</strong> <strong>the</strong> U.S.<br />
27 Hesse (1915) provides a very detailed account <strong>of</strong> <strong>the</strong> battle for <strong>dye</strong> tariffs from <strong>the</strong> 1860s until<br />
1914. See also Steen (1995) for data on how <strong>the</strong> tariff levels changed from 1864 to 1914.
Comparing evolutionary dynamics across different national settings 199<br />
Pattern 9: Why did Germany come to dominate <strong>the</strong> <strong>industry</strong> with 75% market<br />
share in 1914? With respect to understanding <strong>the</strong> sources <strong>of</strong> economic success,<br />
<strong>the</strong> increasing German dominance <strong>of</strong> <strong>the</strong> global syn<strong>the</strong>tic <strong>dye</strong> <strong>industry</strong> between<br />
1870 and 1914 stands out as <strong>the</strong> most remarkable pattern. What allowed <strong>the</strong><br />
German <strong>industry</strong> to increase its market share from about 50% in 1870 to 75%<br />
in 1900? The absence <strong>of</strong> entry barriers in <strong>the</strong> form <strong>of</strong> patent protection created<br />
enormous competition among German firms from <strong>the</strong> very beginning <strong>of</strong> <strong>the</strong> <strong>industry</strong>.<br />
Those German firms that had survived <strong>the</strong> fierce competition <strong>of</strong> <strong>the</strong> early<br />
years tended to have better business skills than <strong>the</strong> British and French firms that<br />
were sheltered behind <strong>the</strong>ir patent protection. In <strong>the</strong> late 1860s, a number <strong>of</strong> <strong>the</strong><br />
German firms (e.g. BASF, Bayer, and Hoechst) developed distribution networks<br />
in <strong>the</strong> major foreign markets, a strategy that was not pursued to <strong>the</strong> same extent<br />
by French and British firms. This gave German firms a bridgehead from which<br />
<strong>the</strong>y could increase <strong>the</strong>ir activities in foreign markets. When in 1877 <strong>the</strong> electrical<br />
<strong>industry</strong> and <strong>the</strong> Association <strong>of</strong> German Engineers (VDI) were able to convince<br />
<strong>the</strong> German parliament to enact a patent law, lobbying efforts <strong>of</strong> <strong>the</strong> <strong>dye</strong> <strong>industry</strong><br />
were successful in obtaining a special clause for chemicals, pharmaceuticals, and<br />
food products that allowed only process – not product – patents in <strong>the</strong>se industries.<br />
This forced German companies to find all possible process routes to make<br />
a particular <strong>dye</strong> and, as a result, stimulated <strong>the</strong> inventiveness <strong>of</strong> German <strong>dye</strong><br />
firms. In addition, <strong>the</strong> passage <strong>of</strong> <strong>the</strong> all-German patent law provided German<br />
firms with <strong>the</strong> incentives to undertake R&D because <strong>the</strong>y could now obtain a<br />
15-year monopoly for patented <strong>dye</strong> making processes. After 1877, a number <strong>of</strong><br />
German <strong>dye</strong> firms hired chemists to focus on creating new <strong>dye</strong>s and production<br />
processes. The R&D laboratory as a routine function <strong>of</strong> <strong>the</strong> corporation was invented<br />
in <strong>the</strong> German <strong>dye</strong> <strong>industry</strong> (Homburg, 1992) and gave those firms that<br />
pioneered this new organizational form a large advantage, not only at home but<br />
also abroad, where German <strong>dye</strong> firms engaged in a strategy <strong>of</strong> “carpet patenting”<br />
to prevent foreign firms from entering <strong>the</strong> <strong>dye</strong> <strong>industry</strong>. German firms in 1891<br />
engaged in ano<strong>the</strong>r successful lobbying effort to make it impossible for Swiss<br />
firms to continue <strong>the</strong>ir practice <strong>of</strong> copying German patented <strong>dye</strong>s and shipping<br />
<strong>the</strong>m into Germany.<br />
To staff <strong>the</strong>ir growing R&D laboratories, German <strong>dye</strong> firms also successfully<br />
lobbied <strong>the</strong> state to provide more facilities and resources for <strong>the</strong> training <strong>of</strong><br />
chemists. A dynamic was set into motion in which <strong>the</strong> economic success <strong>of</strong><br />
German firms allowed <strong>the</strong>m to engage in collective action as well as investing<br />
in <strong>the</strong> development <strong>of</strong> firm capabilities in production, R&D, distribution, and<br />
marketing. Unlike British firms, for instance, some German firms would translate<br />
<strong>the</strong>ir <strong>dye</strong>ing manuals and packing labels into foreign languages and provide<br />
<strong>dye</strong>rs all over <strong>the</strong> world with technical assistance in <strong>the</strong> applications <strong>of</strong> syn<strong>the</strong>tic<br />
<strong>dye</strong>s. German firms developed large enterprises with capabilities that any aspiring<br />
foreign firm would first have to replicate. Because leading German firms took<br />
every opportunity to expand <strong>the</strong>ir product portfolios and <strong>the</strong>ir ability to exploit<br />
scale and particularly scope economies, <strong>the</strong>y developed a lock on <strong>the</strong> market that<br />
was difficult to break.
200 J.P. Murmann and E. Homburg<br />
The most likely reasons why <strong>the</strong> number <strong>of</strong> firms did not decline at <strong>the</strong><br />
global level in <strong>the</strong> decade before World War I despite German dominance was<br />
that smaller producer countries enacted protectionist policies to aid domestic<br />
producers, and some entrepreneurs spotted niches that were not served by <strong>the</strong><br />
large producers. But this pattern should not distract from <strong>the</strong> overwhelming fact<br />
that German firms completely dominated <strong>the</strong> ever-growing market for syn<strong>the</strong>tic<br />
<strong>dye</strong>s.<br />
5 Classifying causal forces<br />
The context-specific accounts and <strong>the</strong> causes presented above can be reclassified<br />
into more general categories that can potentially be applied to o<strong>the</strong>r industries.<br />
The <strong>case</strong> <strong>of</strong> <strong>the</strong> syn<strong>the</strong>tic <strong>dye</strong> <strong>industry</strong> has shown that: 1) <strong>the</strong> same causal forces<br />
did not operate throughout <strong>the</strong> entire period from <strong>1857–1914</strong>, and 2) what happened<br />
in one country was not entirely independent <strong>of</strong> o<strong>the</strong>r countries since local<br />
firms <strong>of</strong>ten experienced competition from foreign rivals. As a simple methodological<br />
rule we conclude from our <strong>dye</strong> <strong>industry</strong> study that in comparing <strong>industry</strong><br />
evolution in different countries it is necessary to ascertain to what extent <strong>the</strong> different<br />
national industries are linked through trade and how key causal variables<br />
change over time. If <strong>the</strong> <strong>case</strong> <strong>of</strong> <strong>the</strong> <strong>dye</strong> <strong>industry</strong> generalizes to o<strong>the</strong>r industries,<br />
<strong>the</strong> following are promising candidates for key causal forces <strong>of</strong> <strong>industry</strong><br />
evolution:<br />
Legal environment<br />
It appears that <strong>the</strong> legal environment can act as a barrier or facilitator <strong>of</strong> entry<br />
into <strong>the</strong> <strong>industry</strong> and hence influence <strong>industry</strong> dynamics in fundamental ways. In<br />
<strong>the</strong> syn<strong>the</strong>tic <strong>dye</strong> <strong>industry</strong>, <strong>the</strong> differences in patent laws across countries shaped<br />
<strong>industry</strong> evolution by ei<strong>the</strong>r encouraging or discouraging <strong>the</strong> formation <strong>of</strong> new<br />
firms. While patent laws seem to have <strong>the</strong> uniform effect <strong>of</strong> reducing entry, <strong>the</strong><br />
competitive implications <strong>of</strong> patent laws depend on <strong>the</strong> <strong>industry</strong>’s level <strong>of</strong> development.<br />
Patent laws can ei<strong>the</strong>r help or hurt <strong>the</strong> competitive position <strong>of</strong> domestic<br />
firms, depending on <strong>the</strong> policies <strong>of</strong> o<strong>the</strong>r countries and <strong>the</strong> firms <strong>the</strong>rein. 28 In<br />
order for patent laws to have a competitive effect, <strong>the</strong>y obviously must vary<br />
across countries. Competition laws in countries can also have a direct effect on<br />
<strong>industry</strong> dynamics. The formation <strong>of</strong> cartels in <strong>the</strong> German <strong>dye</strong> <strong>industry</strong> was a<br />
mechanism to reduce competition between some <strong>of</strong> <strong>the</strong> large firms, especially<br />
after 1904. 29<br />
28 For a review <strong>of</strong> different <strong>the</strong>ories on <strong>the</strong> economic effects <strong>of</strong> patents, see Mazzoleni and Nelson<br />
(1998).<br />
29 At <strong>the</strong> end <strong>of</strong> 1925, <strong>the</strong> entire German <strong>dye</strong> <strong>industry</strong> was consolidated into one firm, I.G. Farbenindustrie<br />
(also known as IG Farben).
Comparing evolutionary dynamics across different national settings 201<br />
Availability <strong>of</strong> skills<br />
When a new <strong>industry</strong> emerges, <strong>the</strong> number <strong>of</strong> entries in a particular social environment<br />
appears to be limited by <strong>the</strong> number <strong>of</strong> people in that environment who<br />
have <strong>the</strong> skills to carry on <strong>the</strong> business. Not every person in <strong>the</strong> five countries was<br />
in <strong>the</strong> “risk set” <strong>of</strong> starting a syn<strong>the</strong>tic <strong>dye</strong> business. On average, entrepreneurs<br />
will seek out an <strong>industry</strong> where <strong>the</strong>y believe <strong>the</strong>y have a reasonable chance <strong>of</strong> succeeding.<br />
For example knowledge <strong>of</strong> organic chemistry was an important skill that<br />
entrepreneurial ventures needed to possess. Because Germany had many more<br />
trained organic chemists than Britain, Germany possessed many more potential<br />
entrants than Britain once Perkin showed that syn<strong>the</strong>tic <strong>dye</strong>s were commercially<br />
feasible. The availability <strong>of</strong> core skills is, in turn, partly a result <strong>of</strong> public policies<br />
taken toward education and <strong>the</strong> training <strong>of</strong> <strong>the</strong> workforce.<br />
Existing industrial infrastructure<br />
The availability <strong>of</strong> entrepreneurs appears also related to industrial activities that<br />
are undertaken in <strong>the</strong> country at a particular point in time. In terms <strong>of</strong> skills and<br />
knowledge that <strong>the</strong>y require, some industries are closer to a new <strong>industry</strong> than<br />
o<strong>the</strong>rs. If a country has many people engaged in an <strong>industry</strong> with similar skills,<br />
<strong>the</strong> pool <strong>of</strong> possible entrepreneurs for <strong>the</strong> novel <strong>industry</strong> is larger.<br />
The existing industries not only form an “infrastructure,” <strong>the</strong>y also form a<br />
social structure in terms <strong>of</strong> who buys and sells to whom, who has more resources,<br />
and how actors in particular industries are connected to each o<strong>the</strong>r and to governmental<br />
organizations. In <strong>the</strong> battles between <strong>the</strong> domestic <strong>dye</strong> <strong>industry</strong> and<br />
domestic textile <strong>industry</strong>, <strong>the</strong> power equation in Britain and <strong>the</strong> U.S. was always<br />
heavily tilted toward <strong>the</strong> textile firms, and as a result textile firms typically obtained<br />
tariff regimes <strong>the</strong>y favored. In Germany – where <strong>the</strong> textile <strong>industry</strong> was<br />
not nearly as large as in Britain or <strong>the</strong> U.S. when <strong>the</strong> syn<strong>the</strong>tic <strong>dye</strong> <strong>industry</strong><br />
appeared on <strong>the</strong> scene – <strong>the</strong> <strong>dye</strong> <strong>industry</strong> was able to achieve tariff regimes that<br />
were in its favor (Beer, 1959, pp. 109–110; Haber, 1958, pp. 216, 221–224). 30<br />
Economies <strong>of</strong> scale and scope<br />
Because cost could be reduced by manufacturing a portfolio <strong>of</strong> <strong>dye</strong>s with <strong>the</strong> same<br />
production equipment and by scaling up plants, those firms which were able to<br />
scale up more quickly had an economic advantage over those firms operating at<br />
smaller scale and scope. In <strong>the</strong> syn<strong>the</strong>tic <strong>dye</strong> <strong>industry</strong> scope economies appear<br />
to have been <strong>the</strong> key drivers that made firms such as Bayer, BASF and Hoechst<br />
30 Unlike o<strong>the</strong>r branches <strong>of</strong> <strong>the</strong> chemical <strong>industry</strong> which lobbied successfully to be protected against<br />
foreign competition, <strong>the</strong> <strong>dye</strong> <strong>industry</strong> had no interest in imposing tariffs on <strong>dye</strong> imports into Germany<br />
because <strong>of</strong> its dominant position in <strong>the</strong> world after 1875. Both in 1879 and in 1902 when <strong>the</strong> tariff<br />
law came up for revision, <strong>the</strong> German government decided that syn<strong>the</strong>tic <strong>dye</strong>s would be admitted<br />
without tariffs just as <strong>the</strong> German <strong>dye</strong> <strong>industry</strong> demanded through its trade organization.
202 J.P. Murmann and E. Homburg<br />
<strong>the</strong> global leaders. By producing a large number <strong>of</strong> chemical intermediates, <strong>the</strong>se<br />
firms were able to <strong>of</strong>fer a full portfolio <strong>of</strong> <strong>dye</strong>s that smaller firms could not<br />
deliver to <strong>the</strong>ir customers. Because <strong>the</strong>y give larger firms a lower cost structure,<br />
economies <strong>of</strong> scale and scope can act as general forces that, over time, eliminate<br />
smaller competitors from <strong>the</strong> market.<br />
Technological dynamics<br />
Technological dynamics can have a direct impact on industrial dynamics. The<br />
invention <strong>of</strong> syn<strong>the</strong>tic <strong>dye</strong>s destroyed <strong>the</strong> business <strong>of</strong> natural <strong>dye</strong> growers. When<br />
substitute products are created, existing producers who are not able to switch to<br />
a new technology are likely to be eliminated. 31 Technology can also change <strong>the</strong><br />
minimum efficient scope and scale (<strong>the</strong> plant size at which production cost per<br />
unit is lower than at any o<strong>the</strong>r size). In <strong>the</strong> <strong>dye</strong> industriy, for example, production<br />
equipment was scaled up dramatically from 1857 to 1914. In many industries<br />
technological innovation increases <strong>the</strong> minimum efficient scale. But technological<br />
innovations can also have <strong>the</strong> opposite effect <strong>of</strong> decreasing <strong>the</strong> minimum efficient<br />
scale. An example is <strong>the</strong> invention <strong>of</strong> minimills in <strong>the</strong> steel <strong>industry</strong>. As a general<br />
hypo<strong>the</strong>sis, we propose that increases in <strong>the</strong> minimum efficient scope or scale<br />
reduce <strong>the</strong> number <strong>of</strong> firms, and decreases in <strong>the</strong> minimum efficient scope or<br />
scale increase <strong>the</strong> number <strong>of</strong> firms.<br />
Positive feedback<br />
Much <strong>of</strong> economic <strong>the</strong>ory is based on <strong>the</strong> logic <strong>of</strong> negative feedback. If prices<br />
for a commodity increase substantially, new producers will enter <strong>the</strong> market and<br />
<strong>the</strong> additional quantities <strong>of</strong> goods on <strong>the</strong> market will bring prices down again. In<br />
a world <strong>of</strong> negative feedback, <strong>the</strong> development <strong>of</strong> advantages in market share,<br />
industrial infrastructure, or in legal environment will not make a difference over<br />
time. The incentives for o<strong>the</strong>r players to catch up will be large and with time<br />
lead to a competitive equalization <strong>of</strong> positions. In a world <strong>of</strong> positive feedback,<br />
however, small differences in conditions can translate into large differences in<br />
outcomes over time (Arthur, 1994). The monopoly <strong>of</strong> La Fuchsine that led to a<br />
shakeout in France appears to have given German firms a small advantage that<br />
<strong>the</strong>y were able to translate into a complete domination <strong>of</strong> <strong>the</strong> French <strong>dye</strong> <strong>industry</strong><br />
before <strong>the</strong> First World War. The central feedback mechanisms in this setting were<br />
pr<strong>of</strong>it levels and investments in new firm capabilities, and later lobbying efforts.<br />
Initially small differences in market share were translated into large differences<br />
in market share because successful firms could invest more than less successful<br />
rivals. A firm that made less money possessed fewer resources to invest in <strong>the</strong><br />
31 Among <strong>the</strong> firms that switched from natural <strong>dye</strong>s to syn<strong>the</strong>tic <strong>dye</strong>s early on were Jäger, Knosp,<br />
and Geigy and later Thomas Frères (madder producers). When syn<strong>the</strong>tic alizarin killed <strong>the</strong> madder<br />
business, <strong>the</strong> largest Dutch madder producer, Salomonson, successfully switched to making phosphate<br />
fertilizers.
Comparing evolutionary dynamics across different national settings 203<br />
next period and over time this led to a few firms (mainly German) with large<br />
market shares. A key challenge in understanding <strong>industry</strong> evolution, <strong>the</strong>n, is to<br />
determine whe<strong>the</strong>r and when positive feedback mechanisms are stronger than<br />
negative ones.<br />
6 Implications for research on <strong>industry</strong> evolution<br />
The primary objective <strong>of</strong> this paper was to demonstrate that patterns <strong>of</strong> evolution<br />
at <strong>the</strong> global level can differ from patterns at lower levels <strong>of</strong> aggregation. We<br />
showed this in <strong>the</strong> <strong>case</strong> <strong>of</strong> countries, but we have no reason to believe that this<br />
would not hold true as well for o<strong>the</strong>r levels <strong>of</strong> analysis, such as regions. Given<br />
that patterns <strong>of</strong> evolution also were different from one country to <strong>the</strong> next – in<br />
fact, none <strong>of</strong> <strong>the</strong> five countries examined displayed exactly <strong>the</strong> same pattern – we<br />
conclude that research on <strong>industry</strong> evolution needs to search for <strong>the</strong> underlying<br />
causes <strong>of</strong> this variation. Instead <strong>of</strong> trying to construct models that hold true<br />
for all times and places, we believe that useful models <strong>of</strong> <strong>industry</strong> evolution<br />
will incorporate important contextual features (see Tilly, 1984, for a forceful<br />
articulation <strong>of</strong> why social processes should be grounded in time and place).<br />
In <strong>the</strong>ir recent ma<strong>the</strong>matical model <strong>of</strong> <strong>industry</strong> evolution, Malerba, Nelson,<br />
Orsenigo, and Winter (1999) found it essential to build “stylized facts” <strong>of</strong> a particular<br />
<strong>industry</strong> (in <strong>the</strong>ir <strong>case</strong> <strong>the</strong> U.S. computer <strong>industry</strong>) into <strong>the</strong> model to make<br />
<strong>the</strong> exercise <strong>of</strong> modeling long-term <strong>industry</strong> dynamics a useful one. Malerba et<br />
al.’s specific research strategy was to achieve a more sophisticated understanding<br />
<strong>of</strong> key factors behind <strong>industry</strong> evolution by trying to generate a historical<br />
path <strong>of</strong> <strong>the</strong> computer <strong>industry</strong>. It is important to recognize that, if a number <strong>of</strong><br />
scholars had not carried out a large amount <strong>of</strong> historical work in <strong>the</strong> past decades<br />
on <strong>the</strong> evolution <strong>of</strong> <strong>the</strong> computer <strong>industry</strong>, Malerba et al. would not have been<br />
able to construct <strong>the</strong>ir “history friendly” ma<strong>the</strong>matical models. To create “history<br />
friendly” models not only for one <strong>industry</strong> in one country, but for several<br />
industries in several countries, researchers need to construct detailed empirical<br />
accounts <strong>of</strong> <strong>the</strong> evolution <strong>of</strong> different industries across a number <strong>of</strong> countries.<br />
To make significant progress, evolutionary economics needs longitudinal data<br />
sets that track firms participating in <strong>the</strong> <strong>industry</strong>, market shares, new products<br />
and so on. With <strong>the</strong> exception <strong>of</strong> Klepper (1982, 1990) and Agarwal and Gort<br />
(1996), such work has not been done by economists but by organizational ecologists<br />
such as Hannan and Freeman (1989) and Hannan and Carroll (1992) and<br />
management scholars such as Tushman and Anderson (1986) and Romanelli and<br />
Tushman (1994). To create robust <strong>the</strong>ories <strong>of</strong> <strong>industry</strong> evolution, we believe that<br />
evolutionary economics needs many more longitudinal data sets <strong>of</strong> <strong>the</strong> kind that<br />
we are constructing for <strong>the</strong> global syn<strong>the</strong>tic <strong>dye</strong> <strong>industry</strong>.<br />
A close look at <strong>the</strong> syn<strong>the</strong>tic <strong>dye</strong> <strong>industry</strong> reveals that, in addition to populations<br />
<strong>of</strong> firms, patent laws and patent practices evolved as well. The evolution<br />
<strong>of</strong> patent laws in <strong>the</strong> different countries was directly influenced by <strong>the</strong> lobbying<br />
activities <strong>of</strong> firms. Our research has convinced us that <strong>the</strong> interaction between
204 J.P. Murmann and E. Homburg<br />
firms and competitively relevant features <strong>of</strong> <strong>the</strong> social environment should be<br />
modeled as a coevolutionary process. 32 For <strong>the</strong> last 30 years, evolutionary biologists<br />
have devoted much attention to constructing coevolutionary models that<br />
achieve a more precise understanding <strong>of</strong> how species evolve [see Nitecki (1983)<br />
and Thompson (1994) for an overview]. It is time that research on <strong>industry</strong><br />
evolution starts to examine coevolutionary processes as well.<br />
References<br />
Agarwal R, Gort M (1996) The evolution <strong>of</strong> markets and entry, exit and survival <strong>of</strong> firms. Review<br />
<strong>of</strong> Economics & Statistics 78(3): 489–498<br />
Arthur WB (1994) Increasing returns and path dependence in <strong>the</strong> economy. Ann Arbor, University<br />
<strong>of</strong> Michigan Press<br />
Beer JH (1959) The emergence <strong>of</strong> <strong>the</strong> German <strong>dye</strong> <strong>industry</strong>. University <strong>of</strong> Illinois Press, Urbana, IL<br />
Bentley J (1972) H<strong>of</strong>mann’s return to Germany from <strong>the</strong> Royal College <strong>of</strong> Chemistry. Ambix 19:<br />
197–203<br />
Carroll GR, Hannan MT (1995) Automobile manufacturers. In: Carroll GR, Hannan MT (eds) Organizations<br />
in <strong>industry</strong>: strategy, structure, and selection, pp. 195–214. Oxford University Press,<br />
New York, NY<br />
Carroll GR, Hannan MT (2000) The demography <strong>of</strong> corporations and industries. Princeton University<br />
Press, Princeton<br />
Chandler AD (1990) Scale and scope: <strong>the</strong> dynamics <strong>of</strong> industrial capitalism. Harvard University<br />
Press, Cambridge<br />
Chateau T (1868) Noveau manuel complet théorique et pratique de la fabrication et de l’emploi des<br />
couleurs d’aniline, d’acide phénique, de naphtaline et de homoloques de ces substances. Roret,<br />
Paris<br />
Chesbrough H (1999) Arrested development: <strong>the</strong> experience <strong>of</strong> European hard disk drive firms in<br />
comparison with US and Japanese firms. Journal <strong>of</strong> Evolutionary Economics 9(3): 287–329<br />
Farbenfabriken-Bayer (1918) Geschichte und Entwicklung der Farbenfabriken vormals Friedrich<br />
Bayer in Elberfeld in den Ersten Fünfzig Jahren (Also known as Böttingerschrift). Bayer, Leverkusen<br />
Gort M, Klepper S (1982) Time paths in <strong>the</strong> diffusion <strong>of</strong> product innovations. Economic Journal<br />
92(367): 630–661<br />
Haber LF (1958) The chemical <strong>industry</strong> during <strong>the</strong> Nineteenth Century. Oxford University Press,<br />
Oxford<br />
Hannan M, Freeman J (1989) Organizational ecology. Harvard University Press, Cambridge, MA<br />
Hannan MT, Carroll GR (1992) Dynamics <strong>of</strong> organizational populations. Oxford University Press,<br />
New York<br />
Haynes W (1954) American chemical <strong>industry</strong>: background and beginnings. Van Nostrand, New York<br />
Heggen A (1975) Erfindungsschutz und Industrialisierung in Preussen: 1793–1877. Vandenhoeck und<br />
Ruprecht, Göttingen<br />
Hesse BC (1915) Lest we forget! Who killed Cock Robin? The U.S. Tariff-History <strong>of</strong> Coal-Tar Dyes.<br />
Journal <strong>of</strong> Industrial and Engineering Chemistry 7: 694–709<br />
Homburg E (1983) The influence <strong>of</strong> demand on <strong>the</strong> emergence <strong>of</strong> <strong>the</strong> <strong>dye</strong> <strong>industry</strong>. The roles <strong>of</strong><br />
chemists and colourists. Journal <strong>of</strong> <strong>the</strong> Society <strong>of</strong> Dyers and Colourists 99: 325–333<br />
Homburg E (1992) The emergence <strong>of</strong> research laboratories in <strong>the</strong> <strong>dye</strong>stuffs <strong>industry</strong>, 1870–1900.<br />
British Journal for <strong>the</strong> History <strong>of</strong> Science 25: 91–111<br />
Homburg E (1993) ‘Chemiker’ by occupation: <strong>the</strong> rise <strong>of</strong> <strong>the</strong> industrial chemist and polytechnic education<br />
in Germany, 1790–1850 (written in Dutch). Delftse Universitaire Pers., Delft, Ne<strong>the</strong>rlands<br />
Hornix WJ (1992) From process to plant: innovation in <strong>the</strong> early artificial <strong>dye</strong> <strong>industry</strong>. British<br />
Journal for <strong>the</strong> History <strong>of</strong> Science 25: 65–90<br />
Klepper S (1997) Industry life cycles. Industrial and Corporate Change 6(1): 145–182<br />
32 See Mowery and Nelson (1999) for o<strong>the</strong>r <strong>industry</strong> studies that arrive at a similar conclusion.
Comparing evolutionary dynamics across different national settings 205<br />
Klepper S, Graddy E (1990) The evolution <strong>of</strong> new industries and <strong>the</strong> determinants <strong>of</strong> market structure.<br />
Rand Journal <strong>of</strong> Economics 21(1): 27–42<br />
Klepper S, Simmons KL (1997) Technological extinctions <strong>of</strong> industrial firms: An inquiry into <strong>the</strong>ir<br />
nature and causes. Industrial and Corporate Change 1997(2): 379–460<br />
Leprieur F (1979) La formation des chimistes français au XIXe siècle. La Recherche 10: 732–740<br />
Malerba F, Nelson R, Orsenigo L, Winter S (1999) ‘History-friendly’ models <strong>of</strong> <strong>industry</strong> evolution:<br />
<strong>the</strong> computer <strong>industry</strong>. Industrial and Corporate Change 8(1): 3–40<br />
Mazzoleni R, Nelson RR (1998) Economic Theories about <strong>the</strong> benefits and <strong>the</strong> costs <strong>of</strong> patents.<br />
Journal <strong>of</strong> Economic Issues XXXII(4): 1031–1052<br />
Meyer-Thurow G (1982) The industrialization <strong>of</strong> invention: a <strong>case</strong> study from <strong>the</strong> German chemical<br />
<strong>industry</strong>. Isis 73: 363–381<br />
Morris PJT, Travis AS (1992) A history <strong>of</strong> <strong>the</strong> international <strong>dye</strong>stuff <strong>industry</strong>. American Dyestuff<br />
Reporter 81(11): 59–100, 192–195<br />
Mowery DC, Nelson RR (eds) (1999) Sources <strong>of</strong> industrial leadership: studies <strong>of</strong> seven industries.<br />
Cambridge University Press, New York<br />
Murmann JP (1998) Knowledge and competitive advantage in <strong>the</strong> syn<strong>the</strong>tic <strong>dye</strong> <strong>industry</strong>, 1850–1914:<br />
<strong>the</strong> coevolution <strong>of</strong> firms, technology, and national institutions in Great Britain, Germany and<br />
<strong>the</strong> United States. Doctoral Dissertation in <strong>the</strong> Graduate School <strong>of</strong> Arts and Sciences, Columbia<br />
University, New York, UMI Publication Number: AAT 9834359<br />
Murmann JP (2000) Knowledge and competitive advantage: <strong>the</strong> coevolution <strong>of</strong> firms, technology, and<br />
national institutions in <strong>the</strong> syn<strong>the</strong>tic <strong>dye</strong> <strong>industry</strong>, 1850–1914. Book Manuscript, forthcoming in:<br />
Cambridge University Press<br />
Nitecki MH (ed) (1983) Coevolution. The University <strong>of</strong> Chicago, Chicago<br />
Penrose ET (1951) The economics <strong>of</strong> <strong>the</strong> international patent system. The Johns Hopkins Press,<br />
Baltimore<br />
Redlich F (1914) Die volkswirtschaftliche Bedeutung der deutschen Teerfarbenindustrie. München-<br />
Leipzig<br />
Richardson HW (1962) The development <strong>of</strong> <strong>the</strong> British <strong>dye</strong>stuffs <strong>industry</strong> before 1939. Scottish<br />
Journal <strong>of</strong> Political Economy 9(2): 110–129<br />
Romanelli E, Tushman ML (1994) Organizational transformation as punctuated equilibrium: an empirical<br />
test. Academy <strong>of</strong> Management Journal 37(5): 1141–1166<br />
Steen K (1995) Wartime catalyst and postwar reaction: <strong>the</strong> making <strong>of</strong> <strong>the</strong> U.S. syn<strong>the</strong>tic organic chemicals<br />
<strong>industry</strong>, 1910–1930. Doctoral Dissertation. History Department, University <strong>of</strong> Delaware<br />
Teece DJ (1986) Pr<strong>of</strong>iting from technological innovation: implications for integration, collaboration,<br />
licensing and public policy. Research Policy 15: 285–305<br />
Thissen F (1922) Die Stellung der deutschen Teerfarbenindustrie in der Weltwirtschaft (vor, in, und<br />
nach dem Kriege). Doctoral Dissertation. University <strong>of</strong> Giessen<br />
Thompson JN (1994) The coevolutionary process. University <strong>of</strong> Chicago Press, Chicagogo London<br />
Tilly C (1984) Big structures, large processes, huge comparisons. Russel Sage Foundation, New York<br />
Travis AS (1993) The rainbow makers: <strong>the</strong> origins <strong>of</strong> <strong>the</strong> syn<strong>the</strong>tic <strong>dye</strong>stuffs <strong>industry</strong> in Western<br />
Europe. Lehigh University Press, Bethlehem<br />
Tushman ML, Anderson P (1986) Technological discontinuities and organizational environments.<br />
Administrative Science Quarterly 31: 439–465<br />
van den Belt H (1992) Why monopoly failed: <strong>the</strong> rise and fall <strong>of</strong> La Fuchsine. British Journal for<br />
<strong>the</strong> History <strong>of</strong> Science 25: 45–64<br />
van den Belt H, Gremmen B, Homburg E, Hornix W (1984) De Ontwikkeling van de Kleurst<strong>of</strong>industrie<br />
(The development <strong>of</strong> <strong>the</strong> syn<strong>the</strong>tic <strong>dye</strong> <strong>industry</strong>). Nijmegen, Faculteit der Wiskunde en<br />
Natuurwetenschappen, University <strong>of</strong> Nijmegen (final Report <strong>of</strong> Research Projekt)<br />
van den Belt H, Rip A (1987) The Nelson-Winter-Dosi model and syn<strong>the</strong>tic <strong>dye</strong> chemistry In: Bijker<br />
WE, Hughes TP, Pinch T (eds) The social construction <strong>of</strong> technological systems: new directions<br />
in <strong>the</strong> sociology and history <strong>of</strong> technology. The MIT Press, Cambridge, MA<br />
Welsh CA (1944) The world <strong>dye</strong>stuffs <strong>industry</strong>: a study in <strong>the</strong> interrelationships <strong>of</strong> technology,<br />
industrial organization, and national economic policies. New York University, New York