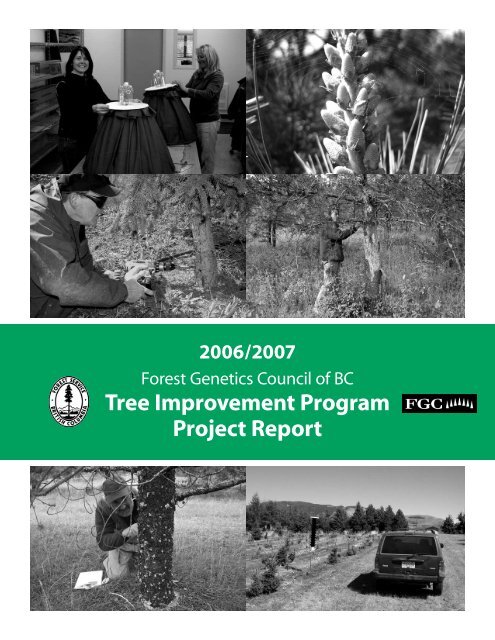
Tree Improvement Program Project Report 2006 / 2007
Tree Improvement Program Project Report 2006 / 2007
Tree Improvement Program Project Report 2006 / 2007

Create successful ePaper yourself
Turn your PDF publications into a flip-book with our unique Google optimized e-Paper software.
<strong>2006</strong>/<strong>2007</strong><br />
Forest Genetics Council of BC<br />
<strong>Tree</strong> <strong>Improvement</strong> <strong>Program</strong><br />
<strong>Project</strong> <strong>Report</strong>
INSIDE COVER
T R E E I M P R O V E M E N T P R O G R A M<br />
Forest Genet cs Counc l of BC<br />
<strong>Tree</strong> <strong>Improvement</strong> <strong>Program</strong><br />
<strong>Project</strong> <strong>Report</strong><br />
Coordinated and compiled by:<br />
Beacon Hill Communications Group Inc.<br />
and<br />
Keith Thomas<br />
<strong>Tree</strong> <strong>Improvement</strong> Branch<br />
British Columbia Ministry of Forests and Range<br />
P R O J E C T R E P O R T 2 0 0 6 / 2 0 0 7
Acknowledgements<br />
T R E E I M P R O V E M E N T P R O G R A M<br />
The <strong>Tree</strong> <strong>Improvement</strong> <strong>Program</strong> is now in its tenth year and has proven to be one of the most enduring<br />
and successful partnerships sponsored by the Provincial Government. Through your hard work and<br />
dedication this program has been quick to respond to the ever-changing environment and this year has<br />
been no exception. Mountain Pine beetle continued to be an issue and for the first time attacks were<br />
recorded in our southern interior orchards. We are very appreciative of Jim Corrigan, Robb Bennett,<br />
and the Pest Management TAC for being so responsive and providing excellent mitigation strategies that<br />
reduced the impacts and protected our orchards.<br />
This was also a year of transition. Roger Painter after dedicating the last ten years of his forest service<br />
career to the <strong>Tree</strong> <strong>Improvement</strong> <strong>Program</strong> bid farewell and retired. This program owes a lot to Roger<br />
because without his tenacity and perseverance this program would not be what it is today…Thank you<br />
Roger. We wish Roger the very best and I am sure we have not seen nor heard the last from him.<br />
Climate change continues to be at the forefront and over the next few years our energies will be<br />
focused on providing a comprehensive operational program for improved seed supply in the face of a<br />
changing climate. This will not be easy but I have no doubt that all our subprograms will rise to meet this<br />
challenge.<br />
The Forest Investment Council continues to recognize the value of investing in tree improvement. One<br />
of the key elements to our success is our goal of continuous improvement. Each year a review of at least<br />
one of our programs is done to ensure that it aligns with Council’s Strategic direction and continues to<br />
deliver value for investment. The processes we have in place will ensure a transparent program that delivers<br />
on its targets, continues to be well respected, and is used as a standard for others.<br />
This publication provides an excellent review of our efforts and highlights our successes for the<br />
forest industry. Sincere thanks to the <strong>Project</strong> Leaders for submitting their contributions in a timely<br />
fashion, and to Diane Douglas, Nick Ukrainetz and Gary Giampa for taking the time to review them.<br />
Acknowledgments also to Jim Corrigan, Lorraine Maclauchlan and Chris Walsh for providing the images<br />
for the front and back cover of this year’s report.<br />
Again, thanks to all those who have worked on this program in the past year and over the past ten<br />
years, including the review committees, species committees and various TAC’s. You are the reason that this<br />
program has a strong technical direction and is so successful. Congratulations to you all for an excellent<br />
tenth annual report. I hope you enjoy it. To all the <strong>Project</strong> Leaders, I wish you continued success for<br />
<strong>2007</strong>/2008.<br />
Keith Thomas<br />
<strong>Tree</strong> <strong>Improvement</strong> Co-ordinator<br />
Forest Genetics Council<br />
P R O J E C T R E P O R T 2 0 0 6 / 2 0 0 7
T R E E I M P R O V E M E N T P R O G R A M<br />
Forest Genet cs Counc l Co-cha rs<br />
Once again we thank the many industry and government staff who contributed to the provincial gene<br />
resource management program for their cooperation and dedication over the past year. Although forestry<br />
in BC is changing quickly, there is a consistent and solid base of support for tree improvement, and a wellestablished<br />
planning process in place.<br />
During the <strong>2006</strong>/07 fiscal year, substantial progress was made in several important areas:<br />
• The Challenge Dialogue was initiated. The results of this multi-stakeholder discussion will provide<br />
important and relevant input into the shaping of Council’s future strategic direction and upcoming 5yr<br />
plan review.<br />
• Ongoing Council membership changes were completed allowing long-serving councilors a rest and<br />
bringing new energy to gene resource management in B.C. In addition, the FGC, in its effort to ensure<br />
diverse representation, asked to have a First Nations representative on Council.<br />
• A seed supply analysis spurred on by the Mountain Pine Beetle (MPB) epidemic was completed.<br />
Recommendations were made and the FGC endorsed key orchard expansions to meet future seed<br />
supply demands.<br />
The coming year will continue to present challenges for Council. The MPB impacts on forest<br />
management and our orchards continue to be of concern. Through continued diligence and strategic<br />
planning Council is working to ensure an adequate seed-supply to meet our future reforestation needs and<br />
help meet the Province’s stewardship goals.<br />
Your program Co-chairs are confident that Council, and associated committees, will continue to rise to<br />
meet these challenges in <strong>2007</strong>/08.<br />
John Elmslie<br />
Industry Co-chair<br />
Dale Draper<br />
Ministry of Forests and Range<br />
Co-chair<br />
P R O J E C T R E P O R T 2 0 0 6 / 2 0 0 7
v<br />
T R E E I M P R O V E M E N T P R O G R A M<br />
The Forest Genetics Council Co-Chairs invite you to review the programs and projects described in this<br />
report and return any questions or comments to:<br />
<strong>Tree</strong> <strong>Improvement</strong> Coordinator<br />
Ministry of Forests and Range<br />
<strong>Tree</strong> <strong>Improvement</strong> Branch<br />
PO Box 9518 Stn Prov Govt<br />
Victoria, B. C. V8W 9C2<br />
Further <strong>Tree</strong> <strong>Improvement</strong> information can be found at our web sites:<br />
Forest Genetics Council http://www.fgcouncil.bc.ca<br />
Ministry of Forests and Range, <strong>Tree</strong> <strong>Improvement</strong> Branch http://www.for.gov.bc.ca/hti<br />
Ministry of Forests and Range, Research Branch http://www.for.gov.bc.ca/hre/forgen/index.htm<br />
P R O J E C T R E P O R T 2 0 0 6 / 2 0 0 7
Table of Contents<br />
T R E E I M P R O V E M E N T P R O G R A M<br />
Acknowledgements ......................................................................................................................................... ii<br />
Forest Genetics Council Co-chairs ................................................................................................................iii<br />
<strong>Tree</strong> <strong>Improvement</strong> in British Columbia ......................................................................................................... ix<br />
Ministry of Forests and Range <strong>Program</strong> Overview ................................................................................ ix<br />
Forest Genetics Council of B.C. ............................................................................................................ ix<br />
Genetic Resource Conservation and Management (GRM) Challenge Dialogue ............................................. x<br />
FIA – <strong>Tree</strong> <strong>Improvement</strong> Subprograms .......................................................................................................... xi<br />
1.0 Expansion of Orchard Seed Supply Subprogram (SelectSeed Co. Ltd.) .................................................. 1<br />
2.0 GRIM <strong>Project</strong> Accomplishments in <strong>2006</strong> and <strong>2007</strong> ............................................................................... 3<br />
3.0 Centre for Forest Conservation Genetics (CFCG) .................................................................................. 4<br />
4.0 <strong>Tree</strong> Breeding ......................................................................................................................................... 8<br />
4.1 Coastal Douglas-fir Breeding <strong>Program</strong> ........................................................................................... 8<br />
4.2 Sitka Spruce Breeding <strong>Program</strong> .................................................................................................... 10<br />
4.3 Western Hemlock Forest Genetics <strong>Program</strong> ................................................................................. 10<br />
4.4 True Fir Forest Genetics ............................................................................................................... 11<br />
4.5 Western Redcedar Breeding <strong>Program</strong> .......................................................................................... 11<br />
4.6 Yellow-cedar Breeding <strong>Program</strong> ................................................................................................... 11<br />
4.7 Coastal White Pine Breeding <strong>Program</strong> ......................................................................................... 12<br />
4.8 Coastal Broadleaf Genetics <strong>Program</strong> ............................................................................................ 12<br />
4.9 Interior Douglas-fir <strong>Tree</strong> Breeding <strong>Program</strong> ................................................................................. 13<br />
4.10 Interior Spruce <strong>Tree</strong> Breeding <strong>Program</strong> .........................................................................................15<br />
4.11 Western Larch <strong>Tree</strong> Breeding <strong>Program</strong> ......................................................................................... 16<br />
4.12 Lodgepole, White and Ponderosa Pines and Interior Broadleaved Species ................................... 17<br />
4.13 Assisted Migration Adaptation Trial ............................................................................................. 18<br />
5.0 Operational <strong>Tree</strong> <strong>Improvement</strong> – the Eleventh Year in Review ............................................................... 19<br />
5.1 Orchard <strong>Project</strong>s ........................................................................................................................... 20<br />
5.1.1 Saanich Forestry Centre (WFP) ........................................................................................ 20<br />
5.1.2 Sechelt Seed Orchard ........................................................................................................ 23<br />
5.1.3 Mt Newton Seed Orchard (TimberWest) .......................................................................... 23<br />
5.1.4 Bowser Seed Orchard ........................................................................................................ 25<br />
5.1.5 Kalamalka Seed Orchards ................................................................................................. 25<br />
5.1.6 Vernon Seed Orchard Company (VSOC) ......................................................................... 27<br />
5.1.7 Grandview Seed Orchards (PRT Armstrong) .................................................................... 29<br />
5.1.8 Eagle Rock Seed Orchards (Tolko Industries) ................................................................... 31<br />
5.1.9 Prince George <strong>Tree</strong> <strong>Improvement</strong> Station .......................................................................... 32<br />
5.1.10 Skimikin Seed Orchards .................................................................................................... 32<br />
5.1.11 Kettle River Seed Orchard ................................................................................................. 34<br />
5.1.12 Saanich Seed Orchard ....................................................................................................... 34<br />
5.1.13 Sorrento Seed Orchards ..................................................................................................... 35<br />
5.2 Technical Support <strong>Program</strong>s......................................................................................................... 35<br />
P R O J E C T R E P O R T 2 0 0 6 / 2 0 0 7<br />
v
v<br />
T R E E I M P R O V E M E N T P R O G R A M<br />
5.2.1 Cone and Seed Pest Management – Interior Operations.................................................... 35<br />
5.2.2 Western Redcedar Pollen Monitoring, Saanich Peninsula ................................................. 36<br />
5.2.3 Development of Pollen Management Guidelines for Yellow-cedar. .................................... 39<br />
5.2.4 Operational Crown Management Trials in Various Orchards: Interior Spruce High-<br />
density Seed Orchard 620 and Interior Douglas-fir Orchard 324 ...................................... 39<br />
5.2.5 Testing the Effects of Upgraded Irrigation Delivery Systems in an Interior Spruce Seed<br />
Orchard, an Interior Lodgepole Pine Seed Orchard, and a Western Larch Seed Orchard. 40<br />
5.2.6 Enhancing Seed Production in North Okanagan Lodgepole Pine Seed Orchards ............. 42<br />
5.2.7 Increasing Quality, Genetic Gain and Quantity of Yellow Cedar Cuttings ...................... 45<br />
5.2.8 Effect of Selfing and Flowering Phenology on Seed Production in Yellow-cedar Seed<br />
Orchards ........................................................................................................................... 46<br />
5.2.9 Crown Pruning Technique for North Okanagan Lodgepole Pine Seed Orchards. ............ 47<br />
5.2.10 Western Hemlock/Sitka Spruce Pollen Monitoring, Saanich Peninsula ............................. 49<br />
5.2.11 Enhancing Lower Crown Vigour and Cone Production in Mature Lodgepole Pine Seed<br />
Orchards ........................................................................................................................... 52<br />
5.2.12 The Effect of Seed Orchard Location on Progeny Performance: Seed Orchard After-<br />
effects ................................................................................................................................ 54<br />
5.2.13 Development of Pollen Quality Guidelines for Pollinations in Western Redcedar Seed<br />
Orchards ........................................................................................................................... 58<br />
5.2.14 Conducting a Series of Soil Tests in the Kalamalka Larch Seed Orchards to obtain<br />
a Baseline Indication of the Levels of Pythium and Fusarium ............................................. 59<br />
5.2.15 Collection of Crop Statistics for Interior Lodgepole Pine Orchards ................................... 59<br />
5.2.16 Female Differentiation Timing in Lodgepole Pine in Support of Operational<br />
Cone Induction ................................................................................................................. 63<br />
5.2.17 Development of Yellow-Cedar Stock Plant Nutrition Guidelines to Enhance Operational<br />
Rooting of Elite Clones ..................................................................................................... 71<br />
5.2.18 Fertility Variation in a Douglas-fir Seed Orchard as Determined by DNA<br />
Fingerprinting: an Update ................................................................................................. 71<br />
5.3 Mountain Pine Beetle Incremental <strong>Project</strong>s .................................................................................. 72<br />
5.3.1 Pollen Management in Lodgepole Pine Orchards .............................................................. 72<br />
5.3.2 Effective Crown Pruning in Lodgepole Pine ..................................................................... 72<br />
5.3.3 Upgrading of Lodgepole Pine Superior Provenance Seed ................................................... 72<br />
5.3.4 Engineering Consultation for Kiln and/or Controller Upgrades ........................................ 73<br />
6.0 Extension and Communications ........................................................................................................... 73<br />
6.1 ETAC Extension and Communications ........................................................................................ 73<br />
7.0 Seed Orchard Pest Management ........................................................................................................... 75<br />
Appendix 1 FGC Seed Planning Units ....................................................................................................... 76<br />
Appendix 2 <strong>Tree</strong> Species ............................................................................................................................. 77<br />
Appendix 3 Discussions by <strong>Tree</strong> Species ..................................................................................................... 78<br />
Appendix 4 Author Contact List ................................................................................................................ 79<br />
P R O J E C T R E P O R T 2 0 0 6 / 2 0 0 7
L st of F gures<br />
T R E E I M P R O V E M E N T P R O G R A M<br />
Figure 1. Relationship between FGC Strategic Plan, FIA-TIP, and participants in various forest<br />
gene resource management areas. ................................................................................................................... xi<br />
Figure 2. Schematic of organizational relationships among FGC, FIA, SelectSeed and seed users. ................. 1<br />
Figure 3. Percentage of Reforested Area Planted with Select Seed, by Management Unit ............................... 3<br />
Figure 4. Levels of self-pollination in northern peripheral, central, and southern peripheral continuous<br />
and disjunct populations of Sitka spruce. ....................................................................................................... 7<br />
Figure 5. Locations of Pacific dogwood (left) and Garry oak (right). .............................................................. 7<br />
Figure 6. Heights of coastal Douglas-fir at age 12 for seedlings in three genetic classes across four sites. ........ 8<br />
Figure 7. Volume at age 11 at Sutton Creek versus damage at Mt. Cain in high-elevation families<br />
progeny test. .................................................................................................................................................... 9<br />
Figure 8. View of realized-gain test at Norrish (Harrison area). ...................................................................... 9<br />
Figure 9. Armillaria fruiting bodies on artificially inoculated Interior Douglas-fir test seedling. ................... 14<br />
Figure 10. Thirty-year-old Arizona provenance showing extreme maladaptation to the Trinity Valley site. . 14<br />
Figure 11. Forward selections in the D’Arcy provenance in the Trinity Valley provenance test. .................... 14<br />
Figure 12. Picking pollen from forward selected trees in the Trinity Valley range-wide provenance test ....... 14<br />
Figure 13. Ten-year-old Series I Interior spruce second-generation progeny test near Prince George, BC. ......15<br />
Figure 14. One-year-old Interior spruce Series II progeny test at Prince George <strong>Tree</strong> <strong>Improvement</strong> Station. . 16<br />
Figure 15. Subapline larch growing at Pedley Pass near Invermere, BC. ........................................................ 16<br />
Figure 16. Subalpine larch ex-situ gene conservation/breeding archive at Kalamalka Forestry Centre. .......... 17<br />
Figure 17. Example of possible genetic worth responses of seedlots from two seed orchards based on two<br />
climate variables. .......................................................................................................................................... 18<br />
Figure 18. A controlled pollination crop is managed in the western redcedar seed orchard at Saanich<br />
Forestry Centre to address the effects of selfing and to assist in midge control. ............................................. 21<br />
Figure 19. The <strong>2007</strong> low elevation western hemlock crop at the Saanich Forestry Centre. ........................... 21<br />
Figure 20. The Saanich Forestry Centre high elevation western hemlock orchard. ....................................... 22<br />
Figure 21. Douglas-fir and western redcedar potted grafts. ........................................................................... 24<br />
Figure 22. Installing drainage in orchard 233. .............................................................................................. 28<br />
Figure 23. Crew applies pollen to Pli orchard 338. ........................................................................................ 30<br />
Figure 24. PRT seed orchard staff in Fdi orchard 321. .................................................................................. 30<br />
Figure 25. Collecting Pli using Girette. ......................................................................................................... 31<br />
Figure 26. Squirrel activity in the unmanaged white pine orchard (607), <strong>Project</strong> 1503. ............................... 33<br />
Figure 27. Temporary irrigation in the Ribes garden during white pine seedling inoculation, <strong>Project</strong> 411. .... 33<br />
Figure 28. Burning to reduce the fire risk at Skimikin. <strong>Project</strong> 4057 E13. .................................................... 33<br />
Figure 29. Mean daily western red cedar pollen catch for five regional Saanich peninsula sites. .................... 38<br />
Figure 30. Mean daily western red cedar pollen catch at WFP lower reservoir site........................................ 38<br />
Figure 31. Mean daily western red cedar pollen catch in WFP orchard 189. ................................................. 38<br />
Figure 32. Mean daily western red cedar pollen catch in the TW Mount Newton orchard site 140. ............ 39<br />
Figure 33. SMP on Lower Crown Cones Effect on Total Seed per Cone (TSPC). ........................................ 43<br />
Figure 34. SMP on Lower Crown Cones Effect on Filled Seed per Cone (FSPC)......................................... 43<br />
Figure 35. Control Cross Pollination on Lower Crown Cones Effect on Total Seed per Cone (TSPC). ........ 43<br />
Figure 36. Control Cross Pollination on Lower Crown Cones Effect on Filled Seed per Cone (FSPC). ....... 43<br />
P R O J E C T R E P O R T 2 0 0 6 / 2 0 0 7<br />
v
v<br />
T R E E I M P R O V E M E N T P R O G R A M<br />
Figure 37. Inventory of yellow cedar donor stock. ......................................................................................... 45<br />
Figure 38. Older yellow cedar stock 5 weeks after mid-season pruning......................................................... 45<br />
Figure 39. Younger yellow cedar donor stock 5 weeks after mid-season pruning. .......................................... 46<br />
Figure 40. Younger yellow cedar donor stock. ............................................................................................... 46<br />
Figure 41. Mean whole-tree seed-cone counts for each of the three pruning blocks. ..................................... 47<br />
Figure 42. Mean whole-tree seed-cone counts for treatments in pruning blocks. .......................................... 47<br />
Figure 43. Mean seed-cone counts for a major whorl branch in the upper and lower crown. ........................ 48<br />
Figure 44. Mean total seed per cone (TSPC). ............................................................................................... 48<br />
Figure 45. Filled seed per cone (FSPC) for the three top-pruned blocks. ...................................................... 48<br />
Figure 46. Filled seed per cone data from the three top-pruned blocks by lateral-pruning. ........................... 49<br />
Figure 47. Difference in seed yields by crown position. ................................................................................. 49<br />
Figure 48. Differences in seed cone yields by insect protection for each of the three topping blocks. ............ 49<br />
Figure 49. Mean daily western hemlock pollen cloud density values for five Saanich peninsula<br />
monitoring stations. ...................................................................................................................................... 51<br />
Figure 50. Mean daily Sitka spruce pollen cloud density values for five Saanich peninsula stations. ............. 51<br />
Figure 51. First- and second- year heights for the seed orchard aftereffects plantation (PGTIS). .................. 56<br />
Figure 52. First- and second- year heights for the seed orchard aftereffects plantation (WANSA). ................ 56<br />
Figure 53. Percent seedling damage at the WANSA plantation after the first winter. .................................... 56<br />
Figure 54. Percent seedling damage at the PGTIS plantation after the first winter. ...................................... 57<br />
Figure 55. Mean Julian date of bud burst for the WANSA plantation for each of the four female x male<br />
parent sources. .............................................................................................................................................. 57<br />
Figure 56. Mean Julian date of bud burst for the PGTIS plantation for each of the four female x male<br />
parent sources. .............................................................................................................................................. 57<br />
Figure 57. Mean height growth (cm) for the WANSA plantation for each of the four female x male<br />
parent sources. .............................................................................................................................................. 57<br />
Figure 58. Mean height growth (cm) for the WANSA plantation for each of the four female x male<br />
parent sources. .............................................................................................................................................. 57<br />
Figure 59. Mean cone numbers per tree derived by estimating whole tree and a 30-cone sub sample for 12<br />
lodgepole pine seed orchards. ....................................................................................................................... 61<br />
Figure 60. Mean filled seed production per tree for each of the 12 lodgepole pine seed orchards. ................ 61<br />
Figure 61. Mean total seed per cone for each of the 12 lodgepole pine seed orchards. .................................. 61<br />
Figure 62. Mean filled seed per cone for each of the 12 lodgepole pine seed orchards. ................................. 61<br />
Figure 63. Mean percent filled seed per cone for each of the 12 lodgepole pine seed orchards....................... 62<br />
Figure 64. Mean total seed per cone for insect protected cones and unprotected cones for each of the 12<br />
lodgepole pine seed orchards. ........................................................................................................................ 62<br />
Figure 65. Mean filled seed per cone for insect protected cones and unprotected cones from each of the 12<br />
lodgepole pine seed orchards. ........................................................................................................................ 62<br />
Figure 66. Mean difference between TSPC from insect bagged cones and unbagged cones from each<br />
of the 12 lodgepole pine seed orchards. ......................................................................................................... 62<br />
Figure 67. Mean difference between FSPC from insect bagged cones and unbagged cones from each of the 12<br />
lodgepole pine seed orchards. ........................................................................................................................ 62<br />
Figure 68. Longitudinal section of female bud of lodgepole pine from clone 1524. ....................................... 67<br />
Figure 69. Collection date (<strong>2006</strong>) versus long-shoot bud length. .................................................................. 67<br />
P R O J E C T R E P O R T 2 0 0 6 / 2 0 0 7
T R E E I M P R O V E M E N T P R O G R A M<br />
Figure 70. Comparison of clones 1531 and 1539 on October 3, <strong>2006</strong>. .......................................................... 67<br />
Figure 71. Whole male strobilus section showing the formation of microsporophylls. ................................. 68<br />
Figure 72. Figure of a lateral shoot bud. This sample was taken from the clone 1506 on August 1, <strong>2006</strong>. ... 68<br />
Figure 73. Short-shoot bud showing two opposite primordia. ....................................................................... 68<br />
Figure 74. Schematic of bud development in long-shoot buds. ...................................................................... 68<br />
Figure 75. Prince George area forest genetics field tour. ................................................................................ 74<br />
L st of Tables<br />
Table 1. Summary of SelectSeed orchard development status as of March 31, <strong>2007</strong>. ....................................... 2<br />
Table 2. Number of projects and funding by region. ..................................................................................... 19<br />
Table 3. Number of project/area of investment ............................................................................................. 20<br />
Table 4. Orchard composition activities by project. ...................................................................................... 26<br />
Table 5. Pollen management activities by project. ......................................................................................... 26<br />
Table 6. Summary of VSOC <strong>2006</strong> OTIP activities. ..................................................................................... 27<br />
Table 7. Summary of the main pest and disease management initiatives undertaken at VSOC. ................... 28<br />
Table 8. Total pollen load for 2005, <strong>2006</strong> and <strong>2007</strong>. .................................................................................... 38<br />
Table 9. Total pollen load for <strong>2007</strong>. ............................................................................................................... 38<br />
Table 10. Treatments applied to ramets in the interior spruce micro orchard <strong>2007</strong>. ...................................... 40<br />
Table 11. Average Shoot Growth Over Three Years. ...................................................................................... 41<br />
Table 12. Results of Irrigation Treatments. ................................................................................................... 41<br />
Table 13. Prepollination (April 15 to May 15). .............................................................................................. 44<br />
Table 14. Pollination (May 15 to May 31). .................................................................................................... 44<br />
Table 15. Fertilization and early embryo development (June). ...................................................................... 44<br />
Table 16. Seed cone differentiation (September). .......................................................................................... 44<br />
Table 17. Mean pollen load (regional) for western hemlock and Sitka spruce. ............................................... 52<br />
Table 18. Mean pollen load (regional) for western hemlock and Sitka spruce................................................ 52<br />
Table 19. Mean pollen load (orchard) for western hemlock and Sitka spruce.. .............................................. 52<br />
Table 20. Estimates of % contamination of Western Forest Products western hemlock orchard (170) and Sitka<br />
spruce orchard (172). .................................................................................................................................... 52<br />
Table 21. Fertilizer formulation. .................................................................................................................... 53<br />
Table 22. Percent seedling damage after the first winter by damage class and female x male parent source. .. 58<br />
Table 23. ....................................................................................................................................................... 59<br />
Table 24. Number of samples sectioned of the five clones from each collection date. .................................... 66<br />
Table 25. Developing female strobili found in the five clones collected from the KRS. ................................. 66<br />
Table 26. Pollen receptivity and cone production of the five clones selected at KRS. .................................... 66<br />
Table 27. Table showing the distribution of lateral shoot buds found in the five clones collected at KRS. ..... 66<br />
Table 28. ....................................................................................................................................................... 73<br />
Table 29. ....................................................................................................................................................... 75<br />
P R O J E C T R E P O R T 2 0 0 6 / 2 0 0 7<br />
x
x<br />
T R E E I M P R O V E M E N T P R O G R A M<br />
<strong>Tree</strong> <strong>Improvement</strong> n Br t sh Columb a<br />
M n stry of Forests and Range <strong>Program</strong> Overv ew<br />
Forest genetic resource management encompasses the conservation, controlled use, and enhancement of<br />
genetic resources of forest tree species and related communication and extension activities. The Forest<br />
Genetics Council of British Columbia (FGC) coordinates a provincial forest genetic resource management<br />
program that is implemented by stakeholders in the forest industry: the Ministry of Forests and Range<br />
(MFR), Canadian Forest Service (CFS), and universities.<br />
The Forest Investment Account (FIA) is a major funding agency for forest genetic resource<br />
management in British Columbia. Through the <strong>Tree</strong> <strong>Improvement</strong> <strong>Program</strong> (TIP), FIA invests in<br />
forest genetic resource management activities that support its objectives and are incremental to existing<br />
government and industry activities.<br />
The FIA BC <strong>Tree</strong> <strong>Improvement</strong> <strong>Program</strong> is guided by strategic and annual business plans prepared by<br />
the FGC.<br />
Forest Genet cs Counc l of B.C.<br />
The Forest Genetics Council of British Columbia (FGC) is a multi-stakeholder group representing the<br />
forest industry, the Ministry of Forests and Range (MFR), Canadian Forest Service (CFS), and universities.<br />
Council’s mandate is to champion forest genetic resource management in British Columbia, to oversee<br />
strategic and business planning for a co-operative provincial forest genetic resource management program,<br />
and to advise the province’s Chief Forester on forest genetic resource management policies. FGC members<br />
provide strategic direction to the provincial forest genetic resource management program. FGC Technical<br />
Advisory Committees (TACs) provide technical and policy information to Council and contribute to the<br />
development of FGC plans and associated budgets.<br />
Council’s goal is to maximize the economic benefits from tree improvement gains in wood quality,<br />
quantity, and pest tolerance by supporting a gene conservation program, developing long-term production<br />
capacity, doubling the average genetic gain of select seed, and increasing the amount of select seed used.<br />
The FGC Business Plan defines the annual set of activities and associated budgets to achieve this goal.<br />
Forest gene resource management is a co-operative effort. In broad terms, the MFR leads tree breeding<br />
activities and private industry leads operational production of reforestation materials. The Canadian Forest<br />
Service, MFR Research Branch, and universities undertake research supporting tree improvement, while<br />
private institutions focus on applied research related to operational production.<br />
“Select” refers to seed that comes from breeding programs that select from wild stands the trees with<br />
superior characteristics for growth, strength, or pest-resistance. “Seed” as used here refers to all selected<br />
reforestation materials, including vegetative propagules. The Forest Genetics Council does not support<br />
genetic engineering, and no genetically modified materials are used for Crown land reforestation in British<br />
Columbia.<br />
P R O J E C T R E P O R T 2 0 0 6 / 2 0 0 7
T R E E I M P R O V E M E N T P R O G R A M<br />
Genet c Resource Conservat on and Management<br />
(GRM) Challenge D alogue<br />
Br an Barber<br />
In November <strong>2006</strong>, Dale Draper, Director, <strong>Tree</strong> <strong>Improvement</strong> Branch; Alvin Yanchuk, Manager, Forest<br />
Genetics Section, Research Branch; and Jack Woods, on behalf of John Elmslie, Industry Co-Chair, Forest<br />
Genetics Council of BC prompted a conversation on Forest <strong>Tree</strong> Genetic Resource Conservation and<br />
Management (GRM) in BC. A number of drivers, such as climate change and the mountain pine beetle<br />
epidemic, precipitated this dialogue. The purpose of this challenge dialogue is to create a collective vision<br />
and strategy for GRM that supports sustainable forest management — and one that reflects the views and<br />
priorities of not only GRM practitioners, but also stakeholders and the public.<br />
These co-champions invited persons within the GRM “community of practice” (COP) in BC<br />
and several other provinces to respond to a challenge paper, which included a number of background<br />
statements, assumptions, and key questions. Responses were received from 35 individuals. This feedback<br />
confirmed that climate change is the top threat or driver. Respondents also agreed that although the<br />
existing GRM strategy has served us well, there is need for a more comprehensive, cohesive, and adaptive<br />
vision and strategy.<br />
The co-champions, Jim Snetsinger, Chief Forester, and Henry Benskin, Deputy Chief Forester,<br />
have subsequently used these responses to inform a second paper to be directed to the public and key<br />
stakeholders. Responses received from this paper, together with those previously received from the GRM<br />
COP, will be used to begin development of a GRM vision and framework in fiscal <strong>2007</strong>-08.<br />
Thanks are extended to all those who took the time to review the challenge paper and submit their<br />
comments. Thanks also to R.K. Jones and Associates for their leadership and assistance with this project.<br />
GRM Challenge Dialogue documents and information may be found at: http://www.for.gov.bc.ca/hti/<br />
grm/grm_dialogue.htm<br />
Brian Barber, RPF<br />
Deputy Director and Manager, Policy, Planning and Climate Change<br />
<strong>Tree</strong> <strong>Improvement</strong> Branch<br />
British Columbia Forest Service<br />
722 Johnson St., PO Box 9518 Stn Prov Govt<br />
Victoria, BC, V8W 9C2<br />
Ph (250) 356-0888; Fax (250) 356-8124<br />
P R O J E C T R E P O R T 2 0 0 6 / 2 0 0 7<br />
x
x<br />
Gene Conservation<br />
UBC, MFR<br />
<strong>Tree</strong> Breeding<br />
MFR, CFS<br />
T R E E I M P R O V E M E N T P R O G R A M<br />
FIA – <strong>Tree</strong> <strong>Improvement</strong> Subprograms<br />
The Forest Investment Account (FIA), <strong>Tree</strong> <strong>Improvement</strong> <strong>Program</strong> is consistent with the provincial<br />
strategy for forest genetic resource management developed by the FGC. The TIP goals are to increase the<br />
growth rate, wood quality, and pest resistance of seedlings, and to preserve the genetic diversity of tree<br />
species across the province. TIP activities are organized into seven subprograms:<br />
• Gene Conservation<br />
• <strong>Tree</strong> Breeding<br />
• Operational <strong>Tree</strong> <strong>Improvement</strong> <strong>Program</strong> (OTIP)<br />
• Expansion of Orchard Seed Supply (SelectSeed Ltd.)<br />
• Extension and Communication<br />
• Gene Resource Information Management<br />
• Seed Pest Management<br />
Forest Genetics Council of British Columbia Strategic Plan<br />
Forest Genetics Council, Technical Advisory Committees<br />
Operational <strong>Tree</strong> <strong>Improvement</strong><br />
<strong>Program</strong> (OTIP)<br />
MFR, CFS, Private Industry, Universities<br />
BC Forest Genetics Society<br />
Expansion of Class A<br />
Seed Supply<br />
SelectSeed<br />
Extension and Communication<br />
FGC, MFR, CFS, Private Industry,<br />
Universities<br />
FIA <strong>Tree</strong> <strong>Improvement</strong> <strong>Program</strong><br />
<strong>Program</strong> Steering Committee, <strong>Program</strong> Manager, <strong>Program</strong> Coordinator<br />
P R O J E C T R E P O R T 2 0 0 6 / 2 0 0 7<br />
Gene Resource<br />
Information Management<br />
$ $ $ $ $ $<br />
Seed Pest Management<br />
FGC, MFR, CFS, Private Industry,<br />
Universities<br />
F gure 1. Relat onsh p between FGC Strateg c Plan, FIA-TIP, and part c pants n var ous forest gene resource management areas.<br />
$
1.0 Expans on of<br />
Orchard Seed Supply<br />
Subprogram<br />
(SelectSeed Co. Ltd.)<br />
Jack Woods<br />
The Forest Genetics Council of BC (FGC) created<br />
SelectSeed Co. Ltd. on April 16, 1999 to expand provincial<br />
seed orchard capacity to meet long-term Council objectives<br />
for orchard seed use and genetically based plantation<br />
gains. SelectSeed is a provincially registered company<br />
that is wholly owned by the Forest Genetics Council of<br />
BC (FGC) through its registered Society. All SelectSeed<br />
orchard investments are through long-term contracts with<br />
private-sector companies. SelectSeed also provides program<br />
management services for the FGC, including organizing<br />
meetings; participating in ongoing policy, structural, and<br />
planning issues; preparing business plans and reports, and<br />
dealing with legal and accounting matters.<br />
Forest Investment<br />
Account (MFR)<br />
FIA funding guided<br />
by FGC Business Plan<br />
Competitive supply contracts<br />
with orchard owners<br />
Expanded seed orchard<br />
production<br />
Seed sales<br />
T R E E I M P R O V E M E N T P R O G R A M<br />
BC Forest<br />
Genetics Society<br />
SelectSeed Co. Ltd.<br />
SelectSeed directors<br />
SelectSeed<br />
management<br />
Seed inventory<br />
Directors<br />
Seed sales<br />
Seed Users<br />
(industry, MFR)<br />
P R O J E C T R E P O R T 2 0 0 6 / 2 0 0 7<br />
During the fiscal year ending March 31, <strong>2007</strong>, SelectSeed<br />
orchard developments continued to focus on bringing<br />
the orchard trees to the full production stage. SelectSeed<br />
orchards carried out propagation to replace mortality by<br />
grafting a total of 3,873 ramets. A total of 2,765 ramets were<br />
planted across 14 seed orchards, which brought the total<br />
number of ramets established to 34,160 (97% of the final<br />
planned number) (Table 1). Scion was also collected to assist<br />
other operators with orchard expansions.<br />
The young orchards are just entering the production<br />
phase, and <strong>2006</strong> produced a good crop of lodgepole pine<br />
flowers that received supplemental mass pollination. These<br />
will be harvested in the late summer of <strong>2007</strong>. Small Douglasfir<br />
and lodgepole pine crops were harvested, but <strong>2006</strong> was an<br />
off year for cone production.<br />
SelectSeed provided management services to the FGC,<br />
including organizing and planning five meetings, developing<br />
a business plan, producing species plans, completing the<br />
FGC Annual <strong>Report</strong> for 2005/06, producing mid-term<br />
reports, and dealing with legal and accounting matters<br />
related to the BC Forest Genetics Society.<br />
Forest Genetics<br />
Council<br />
Business Plan<br />
F gure 2. Schemat c of organ zat onal relat onsh ps among FGC, FIA, SelectSeed and seed users.<br />
1
2<br />
T R E E I M P R O V E M E N T P R O G R A M<br />
Figure xx. Summary of SelectSeed orchard development status as of March 31, <strong>2007</strong>*.<br />
Orchard Spp. Seed # ramets # ramets # ramets % estab. Orchard Location<br />
# zone grafted planted in currently company 1<br />
<strong>2006</strong>/07 established<br />
321 Fdi NE low 205 57 2,180 99% PRT Armstrong - Grandview<br />
232 Fdi QL 0 28 815 84% VSOC Vernon<br />
233 Fdi PG 0 17 787 100% VSOC Vernon<br />
343 Sx TO high 0 4 1,051 100% Tolko Armstrong - Eaglerock<br />
342 Sx TO low 0 3 452 99% Tolko Armstrong - Eaglerock<br />
337 Pli NE low 55 18 1000 100% PRT Armstrong - Grandview<br />
338 Pli TO low 448 310 4,761 99% PRT Armstrong - Grandview<br />
237 Pli PG low 1,363 1004 4,615 94% KRSO Kettle Valley<br />
236 Pli PG low 0 118 4,283 95% VSOC Vernon<br />
339 Pli TO high 316 165 3,364 96% Tolko Armstrong - Eaglerock<br />
234 Pli BV low 0 46 2,902 97% VSOC Vernon<br />
240 Pli BV low 349 199 2,964 96% Sorrento Sorrento<br />
241 Pli CP low 360 261 1,951 98% Sorrento Sorrento<br />
238 Pli CP low 777 535 3,019 97% KRSO Kettle Valley<br />
Totals 3,873 2,765 34,160 97%<br />
1 PRT – Pacific Regeneration Technologies Ltd.; VSOC – Vernon Seed Orchard Co. Ltd.;<br />
KRSO – Kettle River Seed Orchard Company Ltd.; Sorrento – Sorrento Nurseries Ltd.<br />
Table 1. Summary of SelectSeed orchard development status as of March 31, <strong>2007</strong>.<br />
P R O J E C T R E P O R T 2 0 0 6 / 2 0 0 7
2.0 GRIM <strong>Project</strong><br />
Accompl shments n<br />
<strong>2006</strong> and <strong>2007</strong><br />
Lesl e McAuley<br />
1. Initiated support for the Genetic Resource Conservation<br />
and Management (GRM) “Challenge Dialogue” process<br />
to engage the GRM community of practice in: 1) the<br />
development of a common GRM Sustainable Forest<br />
Management (SFM) vision and 2) active participation<br />
in the development of a provincial resource strategy for<br />
British Columbia’s forest-tree genetic resources. The<br />
coming year will see broader stakeholder engagement.<br />
The GRM strategy and Action Plan will guide and<br />
inform the GRM DSS project (see item 2 below).<br />
2. Initiated a multiple-year project to develop a Genetic<br />
Resource Conservation and Management (GRM)<br />
decision support system to address new and emerging<br />
business requirements, such as spatially enabled seed<br />
planning to address Mountain Pine Beetle seed needs,<br />
land-based effectiveness evaluation and resource<br />
stewardship monitoring, performance reporting (status<br />
and trends of GRM practices and genetic resource<br />
assets), and development of a climate-based seed<br />
transfer system. Developed a draft GRM DSS business<br />
architecture, including business mapping (current and<br />
anticipated), business requirements (including gaps and<br />
opportunities), and a business case (preliminary).<br />
3. Developed linkages between the Seed Planning and<br />
Registry (SPAR) system and SeedMap to support clients<br />
in seed planning, registration, and seedling request<br />
ordering and in meeting information requirements<br />
identified in the Chief Forester’s Standards for Seed<br />
Use. Map layers displayed in SeedMap are produced<br />
via a direct link to the Land Resource Data Warehouse,<br />
where official Seed Planning Zone source data resides.<br />
Completed further enhancements to support the<br />
new Chief Forester’s Seed Use Standards (effective<br />
April, 2005) and the Forest For Tomorrow (FFT)<br />
program. A Parent <strong>Tree</strong> data extract is now available for<br />
downloading.<br />
4. Completed the development of the Genetic Diversity<br />
indicator for The State of British Columbia’s Forests<br />
<strong>Report</strong>. Four questions are posed: 1) How well<br />
T R E E I M P R O V E M E N T P R O G R A M<br />
P R O J E C T R E P O R T 2 0 0 6 / 2 0 0 7<br />
conserved are the genetic resources of trees? 2) What<br />
genetic variation exists in unmanaged and managed<br />
forests? 3) What proportion of reforestation uses select<br />
seed? 4) Where is select seed planted? Indicator status<br />
and trends are based on information extracted from the<br />
<strong>Report</strong>ing Silviculture and Land Status Updates System<br />
(RESULTS), Forest Tenure and Administrative Status<br />
(FTAS), and the Seed Planning and Registry (SPAR)<br />
system. On-line publication is planned for Fall <strong>2007</strong>.<br />
See http://www.for.gov.bc.ca/hfp/sof/sof.htm.<br />
5. Benchmarking Genetic Diversity in British Columbia<br />
from 1970 to 2005 continued through work carried<br />
out as an intensive evaluation under the Forest and<br />
Range Evaluation program (FREP). The purpose of this<br />
evaluation is to benchmark GRM (seed use) practices at<br />
the provincial and regional level as we transition from<br />
a prescriptive, rules-based policy framework under the<br />
previous Forest Practices Code to one that is modeled<br />
on a professional reliance framework and results-based<br />
outcomes. Indicator status and trends are based on<br />
information extracted from the <strong>Report</strong>ing Silviculture<br />
and Land Status Updates system (RESULTS), the Seed<br />
Planning and Registry system (SPAR), and spatial and<br />
attribute overlays derived from data extracted from the<br />
Land Resource Data Warehouse (LRDW). A FREP<br />
technical report is currently being developed through<br />
external contract.<br />
F gure 3. Use of Select Seed, 2002/03. Percentage of Reforested<br />
Area Planted w th Select Seed, by Management Un t.<br />
3
3.0 Centre for Forest<br />
Conservat on Genet cs<br />
(CFCG)<br />
Sally A tken<br />
Introduct on<br />
In the past year and with much help from our collaborators<br />
and others in the forest genetics community in the form<br />
of technical assistance, access to data, and seed, and<br />
guidance from the Gene Conservation Technical Advisory<br />
Committee, the staff and graduate students of the CFGC<br />
have managed to make significant progress towards our<br />
understanding of the genetic structure and diversity of<br />
indigenous tree species and the best ways to safeguard<br />
that diversity as a resource for future environmental<br />
challenges and future generations. Within the framework<br />
of the Genetic Conservation Subprogram of the FGC,<br />
we have been able to wrap up several projects and initiate<br />
a few more. This report contains summaries of progress<br />
to date for our major projects organized into four areas<br />
(conservation strategies; cataloguing protection; climate<br />
change; and genetics of minor species) and a list of<br />
publications from the past year. More detailed information<br />
can be found on our website at www.genetics.forestry.ubc.<br />
ca/cfgc.<br />
Genet c Conservat on Strateg es<br />
The CFGC’s early research focused on developing<br />
conservation strategies. Much of this research has now<br />
reached completion with the establishment, acceptance by<br />
scientific peers, and publication of minimum thresholds<br />
for in situ conservation (Hamann et al. 2004, <strong>2006</strong>). Two<br />
PhD projects completed within the CFGC in recent years<br />
focused on different aspects of gene conservation strategies.<br />
Washington Gapare investigated spatial genetic<br />
structure within stands and distribution of rare and<br />
common alleles at varying spatial scales. He found that<br />
sampling strategy does not make much difference to<br />
capturing genetic diversity in central populations, but it can<br />
have profound effects in peripheral populations (Gapare et<br />
al. in press).<br />
Makiko Mimura examined both mating systems and<br />
tradeoffs between local adaptation and gene flow in central,<br />
peripheral, and disjunct populations to better understand<br />
the value of marginal populations for conservation. She<br />
T R E E I M P R O V E M E N T P R O G R A M<br />
P R O J E C T R E P O R T 2 0 0 6 / 2 0 0 7<br />
found that individual tree seed collections are likely to<br />
contain much greater levels of diversity in central than in<br />
marginal populations, in part because many fewer male<br />
parents contribute pollen to each seed parent in marginal<br />
populations and because these marginal populations<br />
also experience substantially higher levels of inbreeding<br />
(Figure 4; Mimura and Aitken <strong>2007</strong>a, <strong>2007</strong>b). This might<br />
lead some to question the value of marginal populations<br />
for conservation. However, she also found that isolated,<br />
marginal populations are likely to be adapted to more<br />
extreme conditions than those found in the continuous<br />
portion of the species range (Mimura and Aitken,<br />
manuscript under revision). These results have substantial<br />
implications for ex situ conservation collections, and they<br />
emphasize the need to identify and conserve isolated<br />
populations at a species margin.<br />
Catalogu ng Protect on Levels for BC <strong>Tree</strong><br />
Spec es<br />
Since the CFGC’s involvement in cataloguing in situ<br />
conservation started in 2000, a large volume of work has<br />
been produced on the in situ conservation status of BC tree<br />
species (Hamann et al. 2004, <strong>2006</strong>). Although many of<br />
the results have been published, we have not yet completed<br />
an overall, detailed synthesis with specific conservation<br />
recommendations. Scientist Christine Chourmouzis is<br />
currently preparing a technical compilation and synthesis<br />
of this information designed to reach a wider audience and<br />
catalyze operational gene conservation activities.<br />
The report is divided into two chapters that deal<br />
separately with 1) in situ, ex situ, and inter situ conservation<br />
of commercially important species by SPU; and 2) all<br />
indigenous species by BEC zone. Current species range<br />
distributions, protection levels across BC, and the potential<br />
for range expansion with climate warming are all considered<br />
when identifying gaps in protection. The first draft for the<br />
chapter on in situ conservation of all indigenous species was<br />
nearly completed in this fiscal year. Ms. Chourmouzis has<br />
started compiling the data for inter situ genetic resources<br />
(materials under test in the MFR Research Branch’s<br />
breeding programs) and ex situ resources (seed in long-term<br />
storage, mostly at the Ministry of Forests and Range <strong>Tree</strong><br />
Seed Centre) for commercially important species. During<br />
the <strong>2007</strong>-08 fiscal year, the GCTAC will develop a Forest<br />
Genetics Council Genetic Conservation Plan that will<br />
provide an operational approach to filling conservation and<br />
information gaps identified in this report.
Cl mate Change<br />
ClimateBC: Our ClimateBC model continues to be<br />
used widely in forestry research in BC and the number<br />
of non-forestry related applications is growing rapidly.<br />
CFGC Assistant Director Tongli Wang is upgrading it<br />
continually. Version 3.1 beta, including historical (1901<br />
– 2002) monthly climate data and 1971-2000 normal data,<br />
has been developed and is now ready for download from<br />
the CFGC website. ClimateBC v3.2, which will use finer<br />
(change from 1° to 0.5°) annual anomaly input data, is in<br />
development. The web version of ClimateBC v2.3 has been<br />
upgraded to version 3.1.<br />
Response of lodgepole pine populations to future<br />
climates: This work used growth response functions to<br />
determine the performance of each population in the<br />
Illingworth provenance trial along climatic gradients<br />
(Wang et al. <strong>2006</strong>). Results of this study suggest 1) the<br />
importance of using reliable climate models in genecology<br />
to avoid misleading conclusions and using anchor points<br />
and multivariate functions to improve the growth response<br />
functions; 2) that populations from the south are not<br />
necessarily the best choice for future climates; 3) the<br />
identity of populations adapted to a broad range of climatic<br />
conditions, particularly from NE low and PG low; and 4)<br />
that the potential for using optimized seed source selection<br />
to mitigate climate change is substantial.<br />
Graduate student Sierra Curtis-McLane is examining<br />
annual radial growth in lodgepole pine relative to changing<br />
climate patterns in British Columbia as part of her PhD<br />
research. She collected tree cores spanning 25-30 growth<br />
rings from nine provenances on 15 sites of the Illingworth<br />
provenance trial and is analyzing them to assess annual<br />
genotype-by-environment interactions across a spectrum<br />
of climatic conditions. She measured the tree rings using<br />
standard dendrochronological techniques and will use<br />
the measurements to analyze inter-annual variation in<br />
provenance growth in relation to weather records. She<br />
will compare the results to these provenances’ predicted<br />
responses to changes in climate.<br />
Predicting future distributions of ecosystems and<br />
seed planning units: Andreas Hamann and Tongli Wang<br />
used the ClimateBC model in their landmark <strong>2006</strong><br />
publication in the journal Ecology that predicted the future<br />
distribution of climates currently associated with BEC<br />
zones and tree species in BC (Hamann and Wang <strong>2006</strong>).<br />
As a continuation of this work and because small spatial<br />
units do not translate well into operational practices, Tongli<br />
Wang has developed a maximum probability approach to<br />
T R E E I M P R O V E M E N T P R O G R A M<br />
P R O J E C T R E P O R T 2 0 0 6 / 2 0 0 7<br />
predicting the future distribution of BEC zones and SPUs<br />
without extensive fragmenting across BC landscapes. We<br />
hope that these methods will be quite useful in the revision<br />
of seed transfer guidelines in anticipation of climate change.<br />
Incremental FIA Cl mate Change <strong>Project</strong>:<br />
Short-term testing of provenances and genotypes to<br />
predict response to climate change and adapt seed<br />
transfer policy: Because relatively few species have<br />
comprehensive provenance trials spanning a sufficient<br />
range of climates to derive provenance response curves,<br />
we are attempting to derive such curves based on seedling<br />
growth and phenology in controlled growth-chamber<br />
environments. Our current experiment builds upon<br />
research completed in 2004-2005, which investigated the<br />
response functions of lodgepole pine to temperature and<br />
CO 2 . The previous study found that height and volume<br />
growth of seedlings in controlled environments peaked at<br />
a simulated mean annual temperature (MAT) of 9°C or<br />
higher, whereas this peak was estimated to occur somewhere<br />
between 3 and 6°C in the field (Wang et al. <strong>2006</strong>). The<br />
most important difference, we believe, was that our climate<br />
regimes in the growth chambers were built to simulate<br />
monthly averages of daily average temperature and daily<br />
temperature range rather than daily variations as in real<br />
weather and did not include any application of drought.<br />
The new experiment includes more realistic climate<br />
regimes based on climatic means for locations with MAT<br />
4°C, MAT 7°, MAT 10°, and MAT 10° + 2 x ambient<br />
CO 2 , with daily variations added around weekly and<br />
monthly temperature averages. Each temperature regime<br />
includes both well-watered and drought treatments. The<br />
new experiment contains approximately 20 seedlots each<br />
of interior spruce and lodgepole pine, including both<br />
natural stands and improved seed orchard lots from across<br />
a broad geographic range. Most of the interior spruce<br />
seedlots are also part of a recently established, large field<br />
trial (the Sx genecology trial EP 670.71.12), and the wildstand<br />
lodgepole pine seedlots are also represented in the<br />
Illingworth trial. This will allow us to compare growthchamber<br />
data with field-growth performance later on.<br />
Seedlings are planted in boxes that allow for extensive root<br />
competition; this makes drought treatments more realistic.<br />
Plant height is being measured bi-weekly, and the growing<br />
season lasts 26 weeks. The experiment will be replicated<br />
twice, once now and again in winter, <strong>2007</strong>-08.
Genet cs and Conservat on of M nor Spec es<br />
Whitebark pine (Pinus albicaulis): Andy Bower completed<br />
his PhD on whitebark pine in the spring of <strong>2006</strong>, and we<br />
continue to publish the results of his thesis to help guide<br />
restoration and conservation efforts (Bower and Aitken<br />
<strong>2006</strong>, <strong>2007</strong>). He is revising the following manuscripts<br />
for publication: 1) the results of the common garden<br />
study and tentative recommendations for seed transfer in<br />
whitebark pine; and 2) genetic changes of cohorts with age<br />
and blister rust infection. Finally, he has completed a draft<br />
manuscript on seed stratification treatments, seed storage,<br />
and germination. We have also participated in the planning<br />
of a workshop on whitebark pine to be held in Whistler in<br />
August, <strong>2007</strong>, at which Bower will present some of these<br />
results. A new study on whitebark pine by PhD student<br />
Sierra Curtis-McLane is in the planning stages. It concerns<br />
field testing the bioclimatic envelope predictions of current<br />
and future distributions from the models of Hamann<br />
and Wang (<strong>2006</strong>) and evaluating strategies for facilitated<br />
migration.<br />
Pacific dogwood (Cornus nuttallii): Most of our<br />
research to date has focused on conifers, and little is<br />
known about the genetic structure and diversity of many<br />
of our broadleaves. We have projects underway with<br />
Pacific dogwood and Garry oak to try to fill some of<br />
this gap and to determine if these species show similar<br />
patterns of genetic diversity and genecology to those of<br />
the widespread conifers that have previously been studied.<br />
In <strong>2006</strong>, MSc student Karolyn Keir collected fresh foliage<br />
from 20 populations and seed from 11 populations of<br />
Pacific dogwood encompassing the entire species range<br />
(Figure 4). Currently, this leaf material is being genotyped<br />
with both nuclear DNA microsatellite and chloroplast<br />
markers to obtain estimates of population genetic diversity,<br />
structure, and history. Seeds were planted following an acid<br />
scarification and cold stratification in January <strong>2007</strong> for a<br />
common garden experiment.<br />
Garry oak (Quercus garryana): The extent of Garry oak<br />
in BC and beyond has diminished greatly over the past<br />
century due to agriculture, urbanization, and fire exclusion.<br />
There is considerable interest in restoration plantings of<br />
Garry oak, but there have been no genecological studies<br />
to guide seed transfer for this species, and the ability of<br />
this species to adapt to climate change is unknown. In late<br />
summer and early fall of <strong>2006</strong>, MSc student Colin Huebert<br />
conducted a range-wide seed collection, extending from<br />
central California to central Vancouver Island (Figure 5).<br />
In total, Huebert collected 3,500 acorns from 15 different<br />
6<br />
T R E E I M P R O V E M E N T P R O G R A M<br />
P R O J E C T R E P O R T 2 0 0 6 / 2 0 0 7<br />
populations. Average acorn weight was calculated for each<br />
family. Acorns were subsequently transported to the UBC<br />
research greenhouse where they had a high germination rate.<br />
In the autumn of <strong>2007</strong>, seedlings will be transplanted from<br />
the greenhouse to the outdoor raised beds at UBC, where<br />
they will remain until the end of the experiment. A second<br />
field common garden may be established on Vancouver Island<br />
if a suitable site can be located. The results will be used to<br />
develop seed transfer recommendations and predictions of the<br />
ability of Garry oak to adapt to climate change.<br />
CFGC Publ cat ons n <strong>2006</strong>-07<br />
Bower, A.D. and S.N. Aitken. <strong>2006</strong>. Geographic and seasonal<br />
variation in cold hardiness of whitebark pine. Can. J. For.<br />
Res. 36: 1842-1850.<br />
Bower, A.D. and S.N. Aitken. <strong>2007</strong>. Mating system and<br />
inbreeding depression in whitebark pine (Pinus albicaulis<br />
Engelm.). <strong>Tree</strong> Genetics & Genomes. In press; published<br />
online at http://dx.doi.org/10.1007/s11295-007-0082-4<br />
Gapare, W.J., A.D. Yanchuk and S.N. Aitken. <strong>2007</strong>. Optimal<br />
sampling strategies for capture of genetic diversity differ<br />
between core and peripheral populations of Picea sitchensis<br />
(Bong.) Carr. Conservation Genetics. In press.<br />
Hamann, A., and T. Wang. <strong>2006</strong>. Potential effects of climate<br />
change on ecosystem and tree species distribution in<br />
British Columbia. Ecology. 87:2773–2786.<br />
Mimura, M. and S.N. Aitken. <strong>2007</strong>a. Increased selfing and<br />
decreased effective pollen donor number in peripheral<br />
relative to central populations in Picea sitchensis (Pinaceae).<br />
Am. J. of Botany. 94: 991-998.<br />
Mimura, M. and S.N. Aitken. <strong>2007</strong>b. Adaptive gradients and<br />
Isolation by distance with postglacial migration in Picea<br />
sitchensis. Heredity. 99: 224-232.<br />
Wang, T., A. Hamann, A. Yanchuk, G. A. O’Neill, and S.<br />
N. Aitken. <strong>2006</strong>. Use of response functions in selecting<br />
lodgepole pine populations for future climate. Global<br />
Change Biology. 12:2404–2416.<br />
Wang, T., Hamann, A., Spittlehouse, D.L., and Aitken,<br />
S.N. <strong>2006</strong>. Development of scale-free climate data for<br />
western Canada for use in resource management. Intl. J.<br />
Climatology. 26(3): 383-397.<br />
Wang, T. <strong>2006</strong>. ClimateBC: A Computer <strong>Program</strong> to<br />
Generate High resolution Climate Data for British<br />
Columbia. TICtalk, 7, 17-19.
T R E E I M P R O V E M E N T P R O G R A M<br />
F gure . Levels of self-poll nat on (1=ent rely selfing, 0=ent rely<br />
outcross ng, calculated as 1-tm where tm s the mult locus<br />
outcross ng rate) n northern per pheral, central, and southern<br />
per pheral cont nuous and d sjunct populat ons of S tka spruce<br />
(from M mura and A tken <strong>2007</strong>b). D sjunct ( solated) per pheral<br />
populat ons are l kely to have h gher nbreed ng and lower levels<br />
of genet c d vers ty than central and cont nuous populat ons,<br />
but are also l kely to conta n phenotypes adapted to cl mat c<br />
extremes at spec es marg ns.<br />
F gure . Locat ons of Pac fic dogwood (left) and Garry oak (r ght) collect ons n <strong>2006</strong>. For Pac fic dogwood, tr angles<br />
nd cate locat ons of populat ons where fol age was collected for genet c marker analys s, and c rcles nd cate<br />
populat ons sampled for seed. For Garry oak, acorns were sampled at all s tes.<br />
P R O J E C T R E P O R T 2 0 0 6 / 2 0 0 7<br />
7
.0 <strong>Tree</strong> Breed ng<br />
.1 Coastal Douglas-fir<br />
Breed ng <strong>Program</strong><br />
M chael Stoehr, Ke th B rd, L sa Hayton<br />
Low-elevat on coastal Douglas-fir (orchard 01)<br />
Coastal Douglas-fir (Pseudotsuga menziesii var. menziesii)<br />
remained the highest-valued species in BC based on<br />
product value (SPU 1). Consequently, seed needs have risen<br />
over the past years to over 10.5 million seedlings planted<br />
per year. Breeding and testing for a third-generation seed<br />
orchard continued. In the spring of <strong>2006</strong>, we planted the<br />
third phase of sublines (out of a total of four) on four<br />
sites to obtain GCA estimates and on two sites for full-sib<br />
forward selections. Forward selections (based on an index of<br />
family and within-family performance) were made in fullsib<br />
family blocks of phase 1 tests (planted in 1999). From<br />
each subline, we grafted scions from three full-sib seedlings<br />
from three families each to speed graft development<br />
before making final selection decisions after wood-density<br />
evaluations (in <strong>2007</strong>). We are also currently looking at<br />
the use of optimum selection techniques to better balance<br />
gain and genetic diversity (relatedness) in the breeding and<br />
production (orchard) populations. We measured realized<br />
gains in the late fall of <strong>2006</strong>. Genetically improved stock<br />
was outperforming wild-stand controls on all four sites.<br />
Height (cm) at age 12<br />
800<br />
700<br />
600<br />
500<br />
400<br />
300<br />
200<br />
100<br />
0<br />
T R E E I M P R O V E M E N T P R O G R A M<br />
P R O J E C T R E P O R T 2 0 0 6 / 2 0 0 7<br />
Coastal- nter or Trans t on Zone (sub-mar t me<br />
zone) (SPU 19).<br />
In the interior-coast transition (sub-maritime ) zone, we<br />
assessed three progeny tests planted in 2005 for survival<br />
and tagged them. We will use this set of tests to estimate<br />
breeding values for parents in orchard 181 (backward<br />
selections), but we will supplement it with forward<br />
selections from open-pollinated genecology tests located in<br />
the sub-maritime zone (railroad site on the Hurley Road).<br />
We have already selected 20 genotypes from this site based<br />
on BLP estimates of individual trees. In co-operation<br />
with Barbara Hawkins (UVic), we are initiating a seedling<br />
drought-resistance study with a random set of 20 families<br />
from the op-progeny test.<br />
H gh-elevat on (700-1200 m) coastal Douglas-fir<br />
(SPU 31)<br />
We measured two open-pollinated progeny (age 11) test<br />
sites (at Sutton Creek and Mt. Cain on Vancouver Island)<br />
for estimates of breeding-value and for a selection of parents<br />
for CANFOR’s high-elevation seed orchard (116). We<br />
made backward selections based on BLP estimates, damage<br />
sustained on the harsher site (Mt. Cain), and growth<br />
stability across the two. Selected parent trees will be regrafted<br />
from clones in CANFOR’s orchard at Sechelt and<br />
re-established in Saanichton at WFP’s orchard complex.<br />
Expected gains for this orchardare around 15 percent<br />
for volume at rotation (60 yrs). Because of genotypeby-environment<br />
interactions (GxE), we applied an<br />
independent culling strategy in which we evaluated growth<br />
potential for Sutton Creek and damage sustained at the<br />
Figure 1: Heights of coastal Douglas-fir at age 12 for seedlings Mt. Cain site. This eliminated some of the fastest-growing<br />
in three genetic classes across four sites.<br />
parents from inclusion in the orchard because their progeny<br />
was heavily damaged at Mt. Cain.<br />
Campbell Lang Robertson Spirit<br />
Wildstand<br />
Mid Gain<br />
Top Cross<br />
F gure 6. He ghts of coastal Douglas-fir<br />
at age 12 for seedl ngs n three genet c<br />
classes across four s tes.
Volume Growth at Sutton<br />
Creek (cm^3)<br />
18000<br />
16000<br />
14000<br />
12000<br />
10000<br />
8000<br />
6000<br />
T R E E I M P R O V E M E N T P R O G R A M<br />
Figure 2. Volume at age 11 at Sutton Creek versus damage at Mt. Cain in<br />
high-elevation families progeny test. Selections are only made from families<br />
in the top left quadrant of the data points.<br />
2 2.5 3 3.5 4<br />
Damage at Mt. Cain<br />
F gure . V ew of real zed-ga n test at Norr sh (Harr son area).<br />
P R O J E C T R E P O R T 2 0 0 6 / 2 0 0 7<br />
F gure 7. Volume at age 11 at Sutton Creek<br />
versus damage at Mt. Ca n n h gh-elevat on<br />
fam l es progeny test. Select ons are only<br />
made from fam l es n the top left quadrant<br />
of the date plot.<br />
9
10<br />
.2 S tka Spruce Breed ng<br />
<strong>Program</strong><br />
John K ng, Dave Ponsford<br />
Weev l res stance program<br />
This year we are sowing the third and last series of the<br />
F1 breeding program — weevil resistance. We designated<br />
parents by their phenotypic resistance to the weevil and<br />
their source (mainly Haney or Big Qualicum). We also used<br />
some susceptible parents. This year we also planted the last<br />
of the OP collections from around the Big Qualicum area.<br />
Selection and breeding work continues, but our focus<br />
in this year is to select and breed for specific traits. The<br />
selections will still be field assessed for resistance after weevil<br />
augmentation, but we are undertaking a more detailed<br />
microscopic evaluation in order to classify parents according<br />
to putative mechanisms. This is particularly valuable for<br />
“constitutive” types of mechanisms such as sclereid cells or<br />
constitutive resin cells, and we are working to extend these<br />
techniques to look at some of the “inducible” mechanisms,<br />
particularly traumatic resin cell production.<br />
Ongoing trial assessments for weevil attack have<br />
continued, and these have included some of the hazard<br />
assessment trials. These were a series of trials established<br />
to test resistance over a variety of ecological areas and<br />
potential weevil hazard areas. The main objective is to aid<br />
in determining deployment guidelines. This exercise will<br />
be carried out with Don Heppner, the Coast Regional<br />
Entomologist, and we hope to provide regional guidelines<br />
for spruce over the next year.<br />
Major articles published over the last few years include:<br />
King J.N. and Alfaro R.I. 2004. Breeding for resistance<br />
to a shoot weevil of Sitka spruce in British Columbia,<br />
Canada. In: Carson M.J., Walter C. eds. Plantation<br />
Forest Biotechnology for the 21st Century. 2004 Forest<br />
Research, New Zealand.<br />
King J.N., Alfaro R.I., and Cartwright C. 2004. Genetic<br />
resistance of Sitka spruce (Picea sitchensis) populations<br />
to the white pine weevil (Pissodes strobi): distribution of<br />
resistance. Forestry 77:269-278.<br />
Alfaro R.I., van Akker L., Jaquish B., and King, J.N. 2004.<br />
Weevil resistance of progeny derived from putatively<br />
resistant and susceptible interior spruce parents. For.<br />
Ecol. and Mgmt. 202:369-377.<br />
T R E E I M P R O V E M E N T P R O G R A M<br />
P R O J E C T R E P O R T 2 0 0 6 / 2 0 0 7<br />
McKay-Byun A., Godard K-A., Toudefallah, M., Martin<br />
D.M., Alfaro R., King J.N., Bohlmann J., and Plant<br />
A.L., <strong>2006</strong>. Wound-induced terpene synthase gene<br />
expression in Sitka spruce that exhibit resistance or<br />
susceptibility to attack by the white pine weevil. Plant<br />
Physiology 104: 1009-1021.<br />
Other Components – QCI, NW Hybr d <strong>Program</strong><br />
The Queen Charlotte Island (QCI) program allows us to<br />
assess Sitka growth free from weevil attack and supports<br />
the Seed Orchard program (SO 142 and its replacement).<br />
Our major difficulty has been in getting “free-to-grow”<br />
conditions, in this case not free from weevil attack or brush<br />
but from deer browse, and a good deal of our maintenance<br />
effort is on browse protection.<br />
The transition program is designed mainly to test seed<br />
transferability in a very environmentally heterogeneous area<br />
with pressures from both frost and weevil. This year we did<br />
an assessment of aphid damage.<br />
.3 Western Hemlock Forest<br />
Genet cs <strong>Program</strong><br />
Charl e Cartwr ght<br />
Hemlock (SPU 03 and SPU 2 )<br />
The direction of the hemlock forest genetics program<br />
changed dramatically this year. Because of reduced planting<br />
as a result of reliance on natural regeneration and harvesting<br />
focussed on species with higher log values, measurements<br />
of advanced-generation trials were postponed as were<br />
measurements of first-generation trials. Maintenance and<br />
replanting in hemlock clone banks and breeding arboreta<br />
were reduced with an emphasis on putting trials “to bed”<br />
through re-tagging and removal of ingress.<br />
A history of the program was presented to FGC in<br />
December’06, emphasizing the success achieved through<br />
the several breeders who have led the program. The history<br />
also provided the perspective that hemlock represents 60<br />
percent of coastal products and that, with ample seed<br />
of considerable gain available, not planting represents a<br />
departure in attitudes to tree improvement for Coastal BC.
. True F r Forest Genet cs<br />
Charl e Cartwr ght<br />
Because of their limited value as solid wood products,<br />
true firs are mainly planted to meet green-up and<br />
diversity concerns. Nevertheless, gains due to seed source<br />
(provenance) of between 5 and 10 percent are available<br />
for several species. To date, plans for taking advantage of<br />
these potentially more vigorous sources of seed are still in<br />
development.<br />
Pac fic s lver fir – SPU 09<br />
Two new Pacific silver fir provenance test sites were<br />
established in <strong>2006</strong> to cover the use of the species in the<br />
regeneration of blocks in the mountain hemlock (Hm)<br />
BECs. As well, 12 test sites planted between 2002 and<br />
2003 were maintained. Eight of these were subsequently<br />
measured. We hope to report results from these trials in<br />
the next fiscal year. We sent seed from our provenance<br />
collection to Dr. Ulrick Nielsen of the Danish Centre<br />
for Forests, Landscape, and Planning for use in their<br />
provenance tests.<br />
Sub-alp ne fir<br />
Two new sub-alpine fir provenance test sites were<br />
established in <strong>2006</strong>, one to look at more extreme conditions<br />
than current installations, and the other to provide material<br />
in an appropriate environment that is also accessible for<br />
a larger part of the year. We reported results derived from<br />
data taken the previous year to the annual meeting of the<br />
Western Forest Geneticist Association in Anchorage in June<br />
<strong>2006</strong>. Seed was collected in the American West in the fall<br />
of <strong>2006</strong> to take advantage of good cone crops. The current<br />
seed inventory covers BC and adjacent Alberta, Yukon, and<br />
Washington State, but no provenances between 33 and 48<br />
degrees North are held, although the species is common at<br />
appropriate elevations in these latitudes.<br />
T R E E I M P R O V E M E N T P R O G R A M<br />
P R O J E C T R E P O R T 2 0 0 6 / 2 0 0 7<br />
. Western Redcedar Breed ng<br />
<strong>Program</strong><br />
John Russell, Cra g Ferguson<br />
There are 930 parents established in first-generation<br />
polycross tests for the maritime low SPU. Seven annual<br />
series of tests were planted on 46 sites over six SPUs.<br />
Breeding values for volume at rotation are currently<br />
available for 555 parents from series 1 based on 10-year<br />
heights, series 2-4 on seven-year heights and series 5 on<br />
five-year heights. Approximately 75 parents from the first<br />
five series have been selected for advanced generation based<br />
on height and established into breeding orchards. Breeding<br />
for second-generation tests is ongoing.<br />
Full-sib and self families from deer-browse-resistant<br />
selections (high-needle monoterpene concentration) are<br />
currently being established into field trials and further<br />
within-family selections for browse resistance and needle<br />
monoterpene concentrations are ongoing.<br />
.6 Yellow-cedar Breed ng<br />
<strong>Program</strong><br />
John Russell, Cra g Ferguson<br />
There are currently clonal values from approximately<br />
5,000 clones represented in three series of annual testing<br />
based on nine-year data from the first and second series<br />
of cloned progeny tests, and six-year data from the third<br />
series. These new clonal selections have been repropagated<br />
for operational release. Maintenance continued this<br />
year in both field trials and breeding orchards, as well as<br />
monitoring of pollen performance and production for<br />
collection for advanced-generation breeding.<br />
Various technical support projects were maintained<br />
and measured. These include clonal maturation, clonal<br />
competition, pollen viability, and deer-resistance studies.<br />
Fifteen-year data have been collected from both the first<br />
and second series of provenance trials.<br />
11
12<br />
.7 Coastal Wh te P ne Breed ng<br />
<strong>Program</strong><br />
John K ng, R ch Hunt (CFS), Dave Ponsford<br />
Two phases of an F1 breeding program have been<br />
established over the last few years (approximately 90<br />
families over three sites in each phase). A final phase was<br />
established in the fall of <strong>2006</strong>. Parents for this effort came<br />
from the CFS screening program and were designated as<br />
either Slow Canker Growth (SCG) or Difficult to Infect<br />
(DI). SCG or “slow rusting” trees occur more frequently<br />
than DI. Also included as parents were some of the best<br />
of the Texada trees and some Idaho, Interior. and Dorena<br />
trees.<br />
Although 2004 saw Rich Hunt’s “official” retirement,<br />
luckily we have managed to retain Rich, part time at least,<br />
through an appointment within the CFS. This fall we plan<br />
on having Dr. David Noshad who will be working on an<br />
NSERC post-doc with the program. David is a recently<br />
graduated PhD in pathology and it is hoped his experience<br />
in inoculation techniques will add greatly to our program.<br />
We started a large scale collection of whitebark pine and<br />
hope to incorporate this species in our blister rust screening<br />
in co-operation with USDA Forest Servvice scientists from<br />
Idaho and Oregon.<br />
Recent publications on the white pine program include:<br />
Hunt, R. S. 2004a. Blister-rust-resistant western white<br />
pine for British Columbia. Natural Resources Canada,<br />
Canadian Forestry Service Information <strong>Report</strong> BC-X-<br />
397.<br />
Hunt, R. S. 2004b. Environmental and inoculum source<br />
effects on resistance of Idaho F2 western white pine in<br />
British Columbia. Can. J. Plant Pathol. 26:351-357.<br />
Hunt, R. S., G. D. Jensen, and A. K. Ekramoddoullah.<br />
2004. Confirmation of dominant gene resistance<br />
(Cr2) in the U.S. white pine selections to white pine<br />
blister rust growing in British Columbia. Pp: 227-<br />
229 in Richard A. Sniezko,Safiya Samman, Scott E.<br />
Schlarbaum, and Howard B. Kriebel, eds. Breeding<br />
and genetic resources of five-needle pines: growth,<br />
adaptability, and pest resistance: 2001 July 23-27;<br />
Medford, OR, USA. IUFRO Working Party 2.02.15.<br />
Proceedings RMRS-P-32. Fort Collins, CO: U.S.<br />
Department of Agriculture, Forest Service, Rocky<br />
Mountain Research Station. 259 p.<br />
T R E E I M P R O V E M E N T P R O G R A M<br />
P R O J E C T R E P O R T 2 0 0 6 / 2 0 0 7<br />
King J. N. and R. Hunt. 2004. Five-needle pines in<br />
British Columbia, Canada: Past present and future.<br />
Pp: 12-19 in Richard A. Sniezko, Safiya Samman,<br />
Scott E. Schlarbaum,and Howard B. Kriebel, eds.<br />
Breeding and genetic resources of five-needle pines:<br />
growth, adaptability, and pest resistance; 2001 July<br />
23-27; Medford, OR, USA. IUFRO Working Party<br />
2.02.15. Proceedings RMRS-P-32. Fort Collins, CO:<br />
U.S. Department of Agriculture, Forest Service, Rocky<br />
Mountain Research Station. 259 p.<br />
King J. N. and A. David. <strong>2006</strong>. Genetic approaches to the<br />
management of blister rust in white pines. J. For. Ecol.<br />
and Mgmt. (accepted).<br />
. Coastal Broadleaf Genet cs<br />
<strong>Program</strong><br />
Chang-Y X e<br />
Prov nc al Status <strong>Report</strong> on Broadleaf Spec es<br />
The provincial status report on coastal broadleaf species<br />
has been completed and is in the process of preparation for<br />
internal publication as a technical report. This report covers<br />
four coastal broadleaf species: red alder (Alnus rubra Bong.),<br />
bigleaf maple (Acer macrophyllum Pursh), black cottonwood<br />
(Populus trichocarpa Torr. & Gray), and paper birch (Betula<br />
papyrifera Marsh).<br />
The report contains the following information:<br />
• geographic distribution and commercial ranges;<br />
• current inventories;<br />
• current harvest levels and potential for expanding the<br />
harvest;<br />
• current and potential commercial values;<br />
• current silviculture practices;<br />
• other advantages of managing broadleaves;<br />
• current policy and institutional impediments to<br />
improving management;<br />
• recommendations for improving the management of<br />
broadleaf species in coastal BC.
The provincial status report on interior broadleaf species<br />
is in preparation and should be completed by the end of<br />
<strong>2007</strong>.<br />
Red alder<br />
A clone bank for the southern breeding zone has been<br />
established at the Cowichan Lake Research Station with 87<br />
clones selected from the provenance-progeny trial at Bowser<br />
on Vancouver Island. Fifty-seven clones have also been<br />
selected from the provenance-progeny trial at Thunderbird<br />
near Terrace. As at the Bowser site, selection was based<br />
on the breeding value of the stem volume and other<br />
characteristics such as stem form, branch size and angle, etc.<br />
To control the relatedness of the clones, the bank includes<br />
no more than three individuals from each family.<br />
Black Cottonwood<br />
The third long-term provenance-clonal trial was established<br />
at Harrison Mills in the spring of <strong>2007</strong> with 3270 trees of<br />
516 clones from 142 provenances. The first measurements<br />
(age 2) have been taken for the Terrace and Red Rock trials<br />
planted in 2005. Significant vole damage at the Terrace<br />
site and frost damage at the Red Rock site were observed<br />
and will be surveyed this fall during the second round of<br />
measurements.<br />
B g-leaf Maple<br />
One–year-old seedlings in styroblocks 615 have been<br />
transplanted into styroblocks 723 for another growing<br />
season. Seedlings will be lifted this winter and planted out<br />
next spring. The total height of a seedling, including its<br />
root, will not exceed 36 inches. Four sites — Sayward on<br />
northern Vancouver Island, Skutz Falls on the south island,<br />
Powell River on the north coast, and Seabird Island in the<br />
southern mainland — have been selected for the long-term<br />
provenance-progeny testing program. The Sayward, Skutz<br />
Falls, and Powell River sites have been fenced and herbicide<br />
treatment will be applied later this summer.<br />
T R E E I M P R O V E M E N T P R O G R A M<br />
P R O J E C T R E P O R T 2 0 0 6 / 2 0 0 7<br />
.9 Inter or Douglas-fir <strong>Tree</strong><br />
Breed ng <strong>Program</strong><br />
Barry Jaqu sh, Val Ashley, G sele Ph ll ps and<br />
Bonn e Hooge<br />
The BC Interior Douglas-fir tree-breeding program began<br />
in 1982 and is based on phenotypic selection in wild<br />
stands, open-pollinated (o.p.) progeny testing, clonal seed<br />
orchards established through backward selection on the<br />
original parents, and controlled mating to produce pedigree<br />
material for second-generation selection. <strong>Tree</strong> height,<br />
diameter, and volume are the major traits considered for<br />
improvement. The first generation of breeding includes<br />
1,466 open-pollinated families in six seed planning units<br />
(SPU). Seed orchards were established in the early-mid<br />
1990s and are now coming into production.<br />
In <strong>2006</strong>, the flower crop was sparse, and only 67<br />
crosses were completed in all six SPUs. One hundred and<br />
sixty-five pollen lots were collected, extracted, and stored<br />
for future breeding. Controlled crossing for the highest<br />
priority Nelson SPUs is now about 75 percent complete.<br />
Four 15-year-old progeny tests in the East Kootenay SPU<br />
were maintained and measured. Breeding values (BV)<br />
for rotation-age volume were estimated by Best Linear<br />
Prediction (BLP) and ranged from -87.6 to 37.2 percent.<br />
The BV for the top 30 East Kootenay parents averaged 25.2<br />
percent. In the Nelson low-elevation SPU, four 20-year-old<br />
sites were maintained and two were measured.<br />
Data analyses for this zone are in progress. Several<br />
research plantings were maintained and measured,<br />
including the 20-year-old seedling/steckling study and five<br />
Submaritime Douglas-fir adaptation tests.<br />
The pilot Interior Douglas-fir Armillaria genetic<br />
resistance study was completed. This test included 1,566<br />
trees from 88 o.p. families and four SPUs. The artificial<br />
inoculation technique proved very effective because<br />
Armillaria was present in 1,408 of the 1,566 treated trees<br />
(Figure 9). After three years, 83 percent of the trees had<br />
been killed by Armillaria and six percent of the living trees<br />
were completely girdled and near death. Family mortality<br />
ranged from 44 to 100 percent. In general, families from<br />
warmer and drier environments were less susceptible to<br />
mortality than trees from colder and wetter environments.<br />
Analyses of the 30-year-old range-wide Interior<br />
Douglas-fir provenance test at Trinity Valley showed that<br />
provenances from the east slopes of the Coast and Cascade<br />
13
mountains demonstrated superior growth. On average,<br />
the Submaritime provenances were 14 percent taller than<br />
sources from the Interior Cedar Hemlock zone. Mean tree<br />
volume of the Skykomish provenance was 32 percent larger<br />
than Salmon Arm, the largest interior provenance. Sources<br />
from the south-western US survived poorly and grew<br />
1<br />
F gure 9. Armillaria fru t ng bod es<br />
on art fic ally noculated Inter or<br />
Douglas-fir test seedl ng. Fungus was<br />
transm tted to the root ng med um<br />
through the noculated paper b rch<br />
block seen n background.<br />
F gure 11. Forward select ons n the D’Arcy provenance<br />
n the Tr n ty Valley range-w de provenance test.<br />
T R E E I M P R O V E M E N T P R O G R A M<br />
P R O J E C T R E P O R T 2 0 0 6 / 2 0 0 7<br />
slowly (Figure 10), while trees from the two Mexican sources<br />
have all died. Forward selections were made with the best<br />
Submaritime provenances (Figure 11). Pollen was collected<br />
from these selections to include these trees in the secondgeneration<br />
Interior Douglas-fir crossing program (Figure 12).<br />
F gure10. Th rty-year-old Ar zona provenance show ng extreme<br />
maladaptat on to the Tr n ty Valley s te.<br />
F gure 12. P ck ng pollen from forward selected trees n the<br />
Tr n ty Valley range-w de provenance test. Pollen w ll be<br />
used n Inter or Douglas-fir second-generat on cross ng.
.10 Inter or Spruce <strong>Tree</strong><br />
Breed ng <strong>Program</strong><br />
Barry Jaqu sh, Val Ashley, G sele Ph ll ps and<br />
Bonn e Hooge<br />
The Interior spruce tree-breeding program in British<br />
Columbia is structured in two phases. Phase I began in<br />
the mid-1960s and focussed on three geographic regions:<br />
Prince George, Bulkley Valley, and the East Kootenay.<br />
Phase II began in the mid-1970s and focussed on other<br />
geographic regions where Interior spruce is commercially<br />
and ecologically important. The program has progressed to<br />
the point where much of the current planting stock (more<br />
than 80 million seedlings per year) comes from rogued firstgeneration<br />
seed orchards, and full-sib second-generation<br />
progeny tests are in place for three seed planning units. In<br />
<strong>2006</strong>, 65 trees in the 10-year-old Series I Prince George<br />
Selection Unit second-generation progeny tests (Figure<br />
13) were selected, grafted, and established in holding beds<br />
where they will be held for one to two years and then<br />
moved into seed orchards.<br />
In the mid-1990s Interior seed planning zone review,<br />
the Prince George Interior spruce SPU was realigned to<br />
include six small seed planning units from the Phase II<br />
program and the Prince George Selection Unit from the<br />
Phase I program. This realignment resulted in a composite<br />
breeding population of 1,140 tested parent trees for the<br />
T R E E I M P R O V E M E N T P R O G R A M<br />
P R O J E C T R E P O R T 2 0 0 6 / 2 0 0 7<br />
new Prince George SPU. The second-generation crossing<br />
plan for this new zone consisted of crossing the top 144<br />
parents in a six-tree incomplete partial diallel crossing plan<br />
where each parent was crossed with four other parents. This<br />
plan resulted in 24 partial diallel units and a maximum of<br />
288 crosses. Crossing was completed over four breeding<br />
seasons, and four progeny tests were planted in spring<br />
<strong>2006</strong>. These tests were established in an incomplete block<br />
Alpha design with ten replications per site, 13 blocks per<br />
replication, and 20 seedlots per block. Experimental units<br />
consisted of three-tree row plots with trees planted at 2 x 2<br />
m spacing (Figure 14).<br />
In spring <strong>2006</strong>, four realized gain tests were established<br />
in the Prince George SPU. These tests will compare the<br />
growth performance on an area basis of elite families, seed<br />
orchard seedlots, and a wild-stand seedlot comprised of a<br />
composite of ten wild-stand seedlots.<br />
Site maintenance and measurements were conducted<br />
on various research sites, including the 10-year-old East<br />
Kootenay second-generation progeny tests, the spruce<br />
seed orchard after-effects field tests near Prince George,<br />
12 spruce climate change study sites, and the Chilliwack<br />
Picetum.<br />
Controlled crossing to produce full-sib families for<br />
second-generation selection is ongoing in the Nelson<br />
and Thompson Okanagan SPUs (breeding for TO SPU<br />
conducted by Tolko Industries at the Eagle Rock seed<br />
orchard).<br />
F gure 13. Ten-year-old Ser es I<br />
Inter or spruce second-generat on<br />
progeny test near Pr nce George, BC.<br />
1
16<br />
.11 Western Larch <strong>Tree</strong><br />
Breed ng <strong>Program</strong><br />
Barry Jaqu sh, Val Ashley, G sele Ph ll ps and<br />
Bonn e Hooge<br />
Commercial planting of western larch continues to increase<br />
in British Columbia with over 6.6 million seedlings planted<br />
in <strong>2006</strong>. Sixty-eight percent (4.5 million) of these seedlings<br />
originated from seed orchards located in Vernon. Sixty-five<br />
second-generation crosses were completed, and 103 pollen<br />
lots were collected and stored for future crossing. Secondgeneration<br />
crossing in the East Kootenay and Nelson SPUs<br />
is over 70 percent complete, and we anticipate completion<br />
of the crossing program within three years. In spring <strong>2006</strong>,<br />
grafting was completed for the establishment of a new<br />
high-elevation seed orchard for high-elevation sites in the<br />
Nelson SPU. Realized gain genetic tests were established in<br />
the East Kootenay and Nelson Low SPU in 2005 and <strong>2006</strong>,<br />
respectively.<br />
Maintenance of the subalpine larch (Larix lyallii) ex-situ<br />
gene conservation archive in Vernon is on-going (Figures 15<br />
and 16).<br />
Analyses of the 10-year Series II Nelson SPU progeny<br />
tests were completed. Family mean ten-year height ranged<br />
from 316 to 564 cm, while breeding values for rotation-age<br />
mean tree volume estimated by BLP ranged from -48 to<br />
40.5 percent<br />
T R E E I M P R O V E M E N T P R O G R A M<br />
P R O J E C T R E P O R T 2 0 0 6 / 2 0 0 7<br />
F gure 1 . One-yearold<br />
Inter or spruce<br />
Ser es II progeny test<br />
at Pr nce George <strong>Tree</strong><br />
<strong>Improvement</strong> Stat on.<br />
F gure 1 . Subapl ne larch grow ng at Pedley Pass (elevat on 2,300<br />
m) near Invermere, BC.
.12 Lodgepole, Wh te and<br />
Ponderosa P nes and<br />
Inter or Broadleaved<br />
Spec es<br />
M chael Carlson, John Murphy and<br />
V cky Berger<br />
Winter scion collections were made for Pli; 1) a central<br />
interior western gall rust resistance seed orchard, 2) an NE<br />
low replacement seed orchard for the existing 307 orchard,<br />
and 3) for a new NE high seed orchard. Another scion<br />
collection was made for a new Py seed orchard drawing<br />
upon selection work in our 14 yr-old ponderosa pine<br />
provenance trial at the Skimikin seed orchards site.<br />
Scion from 35 selected/tested paper birch trees (Betula<br />
papyriferia) were collected and grafted at the Kalamalka<br />
Forestry Center with the grafts subsequently divided<br />
T R E E I M P R O V E M E N T P R O G R A M<br />
P R O J E C T R E P O R T 2 0 0 6 / 2 0 0 7<br />
F gure 16. Subalp ne<br />
larch ex-situ gene<br />
conservat on/breed ng<br />
arch ve at Kalamalka<br />
Forestry Centre,<br />
Vernon, BC.<br />
between the Vernon and Skimikin sites. Two small birch<br />
seed orchards will produce seed for the southern interior<br />
and the climatically milder portions of the central interior,<br />
transfer limits to be determined. Additionally, 21 silver<br />
birch (B. pendula) trees were selected from three separate<br />
long-term trial series at the Skimikin site. These will be<br />
scion collected and grafted in 2008 to replace our 16 yr-old<br />
seed production stand at Skimikin which is under attack<br />
from the Bronze birch borer. The Bronze birch borer is<br />
thought to be at least partially responsible for the relatively<br />
wide spread paper birch mortality occurring now in the<br />
southern interior of BC. Silver birch has been grown and<br />
seedling samples distributed to B.C. and Alberta private<br />
lands cooperators for several years with excellent results. We<br />
foresee a demand for silver birch seed/planting stock in the<br />
future.<br />
12 prospective trial sites for the <strong>2007</strong>/2008 FMOMSAT<br />
series were located and ready for layout in 2008 (see: Greg<br />
O’Neill’s et. al. ”Assisted Migration of Multiple Species<br />
Adaptation Trial” writeup).<br />
17
1<br />
.13 Ass sted M grat on<br />
Adaptat on Tr al<br />
Greg O’Ne ll<br />
Approximately 50 percent of all seed used in the province<br />
originates from seed orchards. By 2013, this amount is<br />
expected to be 75 percent. The majority of the progeny<br />
tests used to evaluate orchard seed were established when<br />
climate change was not perceived as a significant issue<br />
and transfers of seed over large geographic distances were<br />
not envisaged. Consequently, the vast majority of orchard<br />
parent trees have been tested only within a narrow climatic<br />
range and only within the breeding zone from which<br />
they originated. Without better understanding of their<br />
productivity and health responses across a wider climatic<br />
and latitudinal range, it is difficult to predict which orchard<br />
seedlots will be most productive under future climate<br />
projections, particularly when long-distance migration of<br />
seed becomes more frequent.<br />
Test site MAP (mm)<br />
2000<br />
1600<br />
1200<br />
800<br />
400<br />
Productivity Contours<br />
T R E E I M P R O V E M E N T P R O G R A M<br />
Orchard B seedlot<br />
Orchard A seedlot<br />
0<br />
-2 0 2 4 6 8 10 12<br />
Test site MAT (°C)<br />
P R O J E C T R E P O R T 2 0 0 6 / 2 0 0 7<br />
To ensure that the gains achieved through four decades<br />
of tree breeding in BC will be realized in a future seeddeployment<br />
system, an extensive set of Class A seedlot<br />
tests is required across a diverse array of climatic and<br />
latitudinal environments. By relating test-site climate to<br />
the productivity of each seedlot, those species and seedlots<br />
that will maximize the productivity of BC’s forests in future<br />
climates can be identified (Figure 17). Furthermore, by<br />
planting the seedlots in large block plots, and including<br />
wild-stand (Class B) seedlot controls, the tests will enable<br />
realized gains of the orchard seedlots to be measured.<br />
An experimental design for this project has been<br />
extensively reviewed by staff inside and outside the MFR,<br />
with input from a growth and yield consultant. To ensure<br />
that the test sites sample the breadth of climates within<br />
BC, staff from the MFR Research Branch have identified<br />
48 climatic regions in the province, with the aim of<br />
establishing a test site within each region. During summer<br />
<strong>2007</strong>, staff will begin examining candidate test sites and<br />
will also confirm test seedlots to be tested. Sowing will<br />
begin in April 2008.<br />
F gure 17. Example of poss ble genet c worth<br />
responses of seedlots from two seed orchards<br />
based on two cl mate var ables. Knowledge of<br />
such responses could alter seedlot select on<br />
dec s ons and mprove adaptat on and<br />
product v ty of plantat ons. In add t on, knowledge<br />
of responses would greatly mprove the ab l ty<br />
to make nformed dec s ons regard ng ass sted<br />
m grat on of spec es and seedlots.
.0 Operat onal <strong>Tree</strong><br />
<strong>Improvement</strong> –<br />
the Tenth Year<br />
n Rev ew<br />
Ke th Thomas<br />
With the end of our Tenth Year, Mountain Pine Beetle<br />
continues to attack our forests and our ability to regenerate<br />
them will largely depend on our capacity to have quality<br />
seed available for our reforestation efforts. After careful<br />
planning and analysis the Forest Genetics Council (FGC)<br />
approved a plan to expand our seed orchards to meet this<br />
expected increase in seed demand. This plan will take a<br />
number of years to implement but by the time these seed<br />
needs arise our new orchards will be in production.<br />
The <strong>Tree</strong> <strong>Improvement</strong> <strong>Program</strong> has the ability to meet<br />
future seed demands due to key investments in breeding,<br />
testing, seed pest management, OTIP, and SelectSeed.<br />
Over the years the Operational <strong>Tree</strong> <strong>Improvement</strong> Subprogram<br />
(OTIP) has provided the focus for investing in<br />
our orchards for the purposes of increasing genetic gain<br />
as well as seed yields. Seed requests in <strong>2006</strong>-07 equated<br />
to 285 Million seedlings, 49% of which were select with<br />
an average Genetic Worth of 12%. This sub-program<br />
continues to invest in existing orchards enabling them to<br />
realize their potential. This, coupled with the development<br />
of replacement stock from the breeding programs, ensures<br />
that the genetic worth of orchards continues to climb. In<br />
addition, our program utilises a system of performance<br />
management to monitor progress and set reasonable<br />
targets for project success. Orchardists and researchers have<br />
responded to these approaches, and in many instances have<br />
surpassed targets.<br />
Although <strong>2006</strong>-07 was a moderate year for most species<br />
crops, considerable work continues with stock replacement<br />
and studies on seed supply. There are still numerous insectrelated<br />
issues that reduce seed yields. However our strategic<br />
decision to develop the Seed Pest Management Technical<br />
Advisory Committee and its associated sub-program along<br />
with stronger mandate for research and the work being<br />
done through Professor von Aderkas at the University of<br />
Victoria has placed us in an enviable position to respond<br />
to these issues. This is another example of how leadership<br />
in the overall program allows us to effectively meet new<br />
challenges and focuses our efforts on the issues at hand,<br />
irrespective of fixed funding levels. As a result, the Forest<br />
T R E E I M P R O V E M E N T P R O G R A M<br />
P R O J E C T R E P O R T 2 0 0 6 / 2 0 0 7<br />
Investment Account continues to show strong support<br />
for our program and funding levels are expected to<br />
remain relatively constant for the foreseeable future.<br />
In <strong>2006</strong>-07, the two OTIP technical review<br />
committees reviewed a total of 84 proposals. The<br />
total amount of proposals received was approximately<br />
$872,000, of which the Coastal and Interior technical<br />
committees recommended approving $720,964 (Table<br />
2). The breakdown of investment by region for all of<br />
OTIP is as follows:<br />
Region <strong>Project</strong>s Funding<br />
Approved Approved<br />
Interior projects 52 $471,625<br />
Coastal projects 28 $249,338<br />
Overall Total 80 $720,964<br />
Table 2.<br />
Number of<br />
projects and<br />
fund ng by<br />
reg on.<br />
Numerous species committees support the FGC<br />
by reviewing and developing annual projects and<br />
priorities. Both the <strong>Tree</strong> Breeding and the Operational<br />
<strong>Tree</strong> <strong>Improvement</strong> <strong>Program</strong> receive their direction<br />
from these reviews. Similarly the Extension and Gene<br />
Conservation TACs have developed their own priority<br />
review procedures. <strong>Tree</strong> Breeding is a Ministry of Forests<br />
and Range responsibility and is not part of the OTIP<br />
“Call for Proposals” process. Priorities for the <strong>Tree</strong><br />
Breeding sub-program are still developed through the<br />
species sub-committees, but decisions on projects to be<br />
undertaken are reached through co-ordination with the<br />
<strong>Tree</strong> <strong>Improvement</strong> and Research Branches of the Ministry<br />
of Forests and Range and the FGC <strong>Program</strong> Manager.<br />
Considerable investment is needed in this sub-program,<br />
and it will continue to receive strong levels of support to<br />
ensure the development of new production stock for future<br />
orchards. New orchards focus on producing seed for Seed<br />
Planning zones where production capacity is low and/or<br />
where priorities for genetic quality seed are high. There<br />
will be a continued need for this as climate change forces<br />
us to re-think current seed planning zones. New orchards<br />
also help produce stock to replace older less advanced<br />
stock in existing orchards. Work in <strong>Tree</strong> Breeding has<br />
already provided much of the genetic material to establish<br />
a number of new orchards and to enhance existing ones.<br />
In addition, the development of a long-term investment<br />
19
program through SelectSeed Ltd. will eventually produce<br />
over 35,000 grafts to establish new orchards.<br />
Technical support within the OTIP sub-program is an<br />
integral part of tree improvement and provides an excellent<br />
venue for operational problem-solving. The lodgepole<br />
pine seed-set issue is an excellent example of a focussed<br />
investigation to solve a serious problem that affects tree<br />
improvement. In addition, this program area will also work<br />
on orchard issues related to mountain pine beetle. Table 3<br />
lists the project breakdown by areas of investment for<br />
<strong>2006</strong>-07.<br />
Area of Investment No. <strong>Project</strong>s<br />
<strong>Tree</strong> Breeding 28<br />
Gene Conservation 8<br />
Operational Production 61<br />
Technical Support 14<br />
Seed Pest Management 5<br />
Extension and Communication 6<br />
Seed Planning and Information Tools 4<br />
20<br />
T R E E I M P R O V E M E N T P R O G R A M<br />
Table 3.<br />
Number<br />
of project/<br />
area of<br />
nvestment<br />
The tree improvement industry represents a broad<br />
spectrum of partners that includes forest companies, the<br />
provincial government, the Canadian Forest Service,<br />
universities, private bio-technical companies, and<br />
individuals. In <strong>2006</strong>-07 the <strong>Tree</strong> <strong>Improvement</strong> <strong>Program</strong><br />
involved 37 separate contributors from all parts of our<br />
industry. The FGC continues to provide sound leadership<br />
and management through its technical committees and<br />
continuous improvement of its strategic direction, goals,<br />
and programs.<br />
P R O J E C T R E P O R T 2 0 0 6 / 2 0 0 7<br />
.1 Orchard <strong>Project</strong>s<br />
.1.1 Saan ch Forestry Centre<br />
(WFP)<br />
Annette van N ejenhu s<br />
The Saanich Forestry Centre, wholly owned and operated<br />
by Western Forest Products Inc., manages production tree<br />
seed orchards for low-elevation Douglas-fir, low-elevation<br />
western redcedar, low- and high-elevation western hemlock,<br />
and low-elevation Sitka spruce seed planning units, together<br />
with hedge orchards for the yellow cypress seed planning<br />
unit, all in the Maritime Zone. As a co-operator in the<br />
Forest Genetics Council programs aimed at delivering<br />
quality seed in quantity to the coastal forest regeneration<br />
programs, WFP employs incremental management<br />
techniques using funds from OTIP.<br />
Coastal Douglas-fir Crop and Orchard<br />
Enhancement<br />
Orchard upgrading included removing 22 ramets and<br />
planting 80 ramets. The rogued ramets represented<br />
clones with a consistent history of cone abortion. Ramet<br />
replacement has raised the breeding value of this orchard to<br />
15.5.<br />
The <strong>2006</strong> cone crop was of low volume, coming in at 9<br />
hl with a genetic worth of 11. High levels of insect damage<br />
resulted in seed recoveries far below average. Just over 1 kg<br />
of seed was registered on SPAR from this crop.<br />
Western Redcedar Orchard and Crop<br />
Enhancement<br />
Supplemental mass pollination in the previous year<br />
resulted in a western redcedar crop of 4.6 hl of cones. Seed<br />
recoveries were near average, resulting in 2 kg of seed from<br />
this crop with a genetic worth of 6.<br />
Induction using GA 3 applications in the second<br />
quarter resulted in good flower set for the <strong>2007</strong> crop.<br />
Controlled pollinations of 1,500 bags are underway using<br />
fresh pollen. Additionally, 54 controlled pollinations are<br />
testing the viability of stored pollen from the <strong>2006</strong> crop<br />
year as compared to fresh pollen. Seed set as determined<br />
by germination tests will be used to measure the success of<br />
western redcedar pollen storage at Saanich Forestry Centre.<br />
Monitoring for western redcedar cone midge indicates low<br />
incidence in the <strong>2007</strong> crop to date.
Low-elevat on Western Hemlock Crop<br />
Enhancement<br />
Supplemental mass pollination was applied to the<br />
<strong>2006</strong> western hemlock crop, focussing on clones with<br />
a propensity to self. A small crop of 2.8 hl of cones was<br />
harvested. Extraction of the crop netted 2.7 kg of seed,<br />
reflecting good seed set. The genetic worth of this seedlot,<br />
as registered on SPAR, is 14.<br />
To determine if the pollen cloud in this orchard of<br />
mid-size trees is adequate or whether supplemental mass<br />
pollination for seed set is still required, two replicates of<br />
10 clones were selected for a comparison of seed set. Each<br />
selected ramet was a “crop tree” showing good female<br />
flower abundance. One of the two replicates of each clone<br />
received supplemental mass pollination, and the second<br />
did not. At harvest, a sample of 10 cones from each ramet<br />
was evaluated for seed set. No significant differences in the<br />
F gure 1 . A controlled poll nat on crop s managed n<br />
the western redcedar seed orchard at Saan ch Forestry<br />
Centre to address the effects of selfing and to ass st n<br />
m dge control.<br />
T R E E I M P R O V E M E N T P R O G R A M<br />
P R O J E C T R E P O R T 2 0 0 6 / 2 0 0 7<br />
number of filled seed per cone were detected between those<br />
cones that received supplemental mass pollination and<br />
those that did not, with an average of 13.8 and 11.3 filled<br />
seeds per cone respectively.<br />
H gh-elevat on Western Hemlock Orchard and<br />
Future Crop Enhancement<br />
Ramet replacement continued with the planting of 185<br />
ramets. Extensive site preparation was undertaken to<br />
improve the survival of hemlock. The orchard now has a<br />
breeding value of 11 and includes 28 parents.<br />
All ramets with a crop were treated with supplemental<br />
mass pollination in the first quarter. Pollen was harvested,<br />
extracted, and stored for application to future crops. A<br />
small crop of 0.3 hl of cones was harvested from the highelevation<br />
hemlock orchard. Only a portion of the crop was<br />
F gure 19. The <strong>2007</strong> low elevat on western hemlock crop<br />
at the Saan ch Forestry Centre demonstrated good seed<br />
set, del ver ng seed w th a genet c worth of 1 .<br />
21
egistered to maintain the genetic worth of 5; the remainder<br />
is banked for inclusion in a future seedlot because scores of<br />
these remaining clones were not available at the time the<br />
seedlot was registered.<br />
S tka Spruce Orchard and Crop Enhancement<br />
A small crop was managed in the weevil-resistant Sitka<br />
spruce orchard at Saanich Forestry Centre. Supplemental<br />
mass pollination was applied. Cone yield was only 0.4 hl,<br />
and the seed yield amounted to183 grams of seed with a<br />
resistance score of 88.<br />
Treatments for foliar pests were applied. These<br />
treatments included applying pesticide for green spruce<br />
aphids in April, removing galls caused by spruce gall aphids<br />
in June, and applying pesticide for giant conifer bugs in<br />
June. The June application of pesticide is implicated in<br />
foliar damage. In future, we will not apply pesticide to soft<br />
foliage.<br />
Yellow Cypress Product on Hedges<br />
Enhancement<br />
Enhanced management of the yellow cypress hedges<br />
resulted in delivery of cuttings material for 335,000<br />
plantables to the <strong>2007</strong> nursery crop. The average genetic<br />
worth of this A-class material is 20.<br />
22<br />
T R E E I M P R O V E M E N T P R O G R A M<br />
P R O J E C T R E P O R T 2 0 0 6 / 2 0 0 7<br />
Clone recoveries from the field trials continued with<br />
transplanting 508 grafts in the holding bed. Additionally,<br />
stock awaiting scores from the phase 8 and 9 trials were<br />
maintained. Fertilizer treatments were applied to enhance<br />
hedge production.<br />
Yellow Cypress Clonal Rootab l ty Study<br />
Studies continued in the rootability of clones, with two<br />
nurseries receiving material for the <strong>2007</strong> nursery crop.<br />
To date, trials are complete for 15 clones that have been<br />
tested three times in two crop years in a minimum of two<br />
nurseries. Of these, eight clones show high rootability,<br />
but one will be rogued because a subsequent score has<br />
lowered its rank, and plagiotropism displayed by a second<br />
clone has placed it for further testing. Six clones have<br />
shown consistently poor rootability and will be rogued<br />
from the production hedges for future vegetation lots.<br />
One clone has shown inconsistent rooting and will be<br />
further tested. Improving the rootability of the cuttings by<br />
improving the mixes to include only high-rooting clones<br />
will significantly reduce over-sows at the nursery and<br />
will thereby improve the price of delivery of this highgain<br />
material to planting programs. If this is successful,<br />
the current deployment of 50% wild seed in this seed<br />
planning unit will be dramatically reduced.<br />
F gure 20. The Saan ch Forestry<br />
Centre h gh elevat on western<br />
hemlock orchard was reestabl<br />
shed after subsurface<br />
dra nage was nstalled.
.1.2 Sechelt Seed<br />
Orchard<br />
Patt Brown<br />
Douglas-fir<br />
Due to a lack of induction response and a very wet, cold<br />
pollination period in <strong>2006</strong>, only 75 of the original 380<br />
induced trees had any cones left on them. Those trees had<br />
been SMP’d and were subsequently part of a trial to test<br />
new systemic insecticides.<br />
In the high-elevation Douglas-fir orchard, 150 trees<br />
from orchard 116 were induced with GA 4/7 in late spring<br />
of <strong>2006</strong>. This, together with the dry weather in late spring<br />
<strong>2006</strong>, has resulted in a heavy crop year for this orchard in<br />
<strong>2007</strong>.<br />
Western redcedar<br />
This project continues to maintain the redcedar ramets<br />
from test series 1 through 6 in the holding beds at Sechelt.<br />
In addition, 60 of the original age 20 Series 2 grafts were<br />
induced in the summer of <strong>2006</strong> with GA 3 .<br />
Pollen was collected from the top 20 percent of parents<br />
from Series 2 and reapplied to 100 crop trees in orchard<br />
186 in February/March of <strong>2007</strong>.<br />
Western wh te p ne<br />
MGR pollen was collected from the MGR-identified trees<br />
in the Robert’s Creek test site and reapplied to all female<br />
cones produced in <strong>2006</strong> in orchard 174.<br />
The 600 cone-producing ramets were monitored and<br />
spot treated for Leptoglossus control on a regular basis<br />
throughout the seed production season. Undeveloped cones<br />
attacked by Conopthorus were collected and burned before<br />
the cone collection season for future control purposes.<br />
T R E E I M P R O V E M E N T P R O G R A M<br />
P R O J E C T R E P O R T 2 0 0 6 / 2 0 0 7<br />
.1.3 Mt Newton Seed<br />
Orchard<br />
(T mberWest)<br />
T m Crowder<br />
Douglas-fir<br />
SPU 0106 covers activities in four Fdc M Low orchards:<br />
134, 154, 183, and 197. Orchards 134 and 154 are mature<br />
orchards that are rogued and upgraded as new ramets are<br />
available. Orchard 183 is a younger orchard that is in full<br />
production, while orchard 197 is in the establishment<br />
phase.<br />
In <strong>2006</strong>, because there was a small crop and the pollen<br />
cloud was light, SMP was applied to all crop trees in all<br />
orchards, particularly early- and late-flowering clones.<br />
Cones were monitored for Contarinia midge and other<br />
pests, and because infestation levels were high, all crop trees<br />
were treated with dimethoate using an air-blast sprayer.<br />
Nearly 1,400 ramets were induced by stem injection<br />
of GA 4/7 to produce a crop in <strong>2007</strong>. All four orchards<br />
were fertilized by injection through the irrigation system,<br />
and newly planted trees were top-dressed with a granular<br />
fertilizer and hand-watered as necessary.<br />
In the fall, 390 young grafted ramets were transplanted<br />
into empty spots in the orchards.<br />
In our grafting program we use large (PSB 1015)<br />
containerized root stock, which allows us to produce ramets<br />
that are ready for transplanting into the orchard within<br />
one year. Over 1,000 new ramets of high BV clones are<br />
being grafted in the fourth quarter of this project for future<br />
upgrading of the Douglas-fir orchards.<br />
Western Redcedar<br />
SPU 0205 covers activities in two Cw M Low orchards: 140<br />
and 152. These two orchards are similar in composition<br />
and are typically induced in alternating years to provide a<br />
steady seed supply. In <strong>2006</strong>, orchard 140 yielded over 2.4<br />
kg of seed with a GW of +7%.<br />
Both of the cedar orchards contain large original ramets<br />
as well as small high-gain ramets from test series 1 and 2.<br />
One hundred of these younger ramets were induced by<br />
spraying with GA 3 for a crop in <strong>2007</strong>.<br />
Grafted ramets from test series 3 were maintained in<br />
a holding bed. Grafts from test series 4 through 6 were<br />
maintained in a potted holding area, then transplanted to<br />
a holding bed in the fall of <strong>2006</strong>. A total of 2,100 grafts<br />
23
were maintained. All grafts were staked, irrigated, fertilized,<br />
weeded, pruned and labeled as required.<br />
Western Hemlock<br />
SPU 0310 covers activities in Hw M Low orchard 182.<br />
This orchard has been producing small crops since 2002<br />
but has not yet reached full production capacity. Because<br />
of the small size of the ramets, SMP was employed again<br />
in <strong>2006</strong> to supplement the insufficient pollen cloud. This<br />
orchard yielded nearly 700 grams of seed in <strong>2006</strong>.<br />
All orchard ramets that did not have a crop, and that<br />
were large enough, were induced by stem injection of GA 4/7<br />
to produce a crop in <strong>2007</strong>.<br />
2<br />
T R E E I M P R O V E M E N T P R O G R A M<br />
P R O J E C T R E P O R T 2 0 0 6 / 2 0 0 7<br />
All ramets were fertilized by injection through the<br />
irrigation system and were pruned to increase the surface<br />
area for cone production.<br />
Western Wh te P ne<br />
SPU 0808 covers activities in Pw orchard 403. In <strong>2006</strong>,<br />
rust-resistant MGR pollen was collected from the<br />
Ladysmith test site and was applied to the developing cones<br />
for the <strong>2007</strong> seed crop.<br />
The <strong>2006</strong> crop was monitored for Leptoglossus and was<br />
spot treated frequently for control of this tenacious pest.<br />
The <strong>2006</strong> harvest yielded over 1.6 kg of seed.<br />
<strong>Tree</strong>s were top-pruned, irrigated, and fertilized to create<br />
vigorous shoots with large numbers of flowering sites.<br />
F gure 21. Douglas-fir<br />
and western redcedar<br />
potted grafts.
.1. Bowser Seed Orchard<br />
Dav d Re d and Carolyn Lohr<br />
Upgrad ng<br />
The initial rogueing of advance generation orchards 149<br />
and 162 has been completed. Thirty-five ramets of 3 clones<br />
with an average BV of 23 were available for transplanting<br />
from orchard 168 into orchard 162. These trees are 13<br />
years old and already at the production stage so should<br />
contribute to orchard seedlots immediately. Thirty-three of<br />
the 35 trees were vigorous enough to be transplanted.<br />
Enhanc ng seed y eld and genet c worth<br />
Controlled pollination: Pollination bags were placed on 286<br />
branches of 21 high BV ramets in orchards 149, 162 and<br />
168. High GW pollen was applied at least twice to each<br />
tree. Seedlot 60588 yielded a collection of 1.25 hectolitres<br />
(approximately 3000 cones). Seed yield per hectolitre was<br />
not finalized at the time of writing. Estimated GW of this<br />
seedlot is 20.<br />
Induct on<br />
Suitable candidates (negligible current years’ crop; no<br />
crop last year; not induced last year; sufficient vigour and<br />
adequate number of cone-bearing sites) were identified.<br />
An induction treatment of a double overlapping girdle was<br />
applied. Irrigation was withheld until mid-July. 236 ramets<br />
from orchard 162 were induced. Bud surveys for crop<br />
year <strong>2007</strong> indicate an excellent crop in the orchards, with<br />
significantly increased production in the induced areas of<br />
orchard 162.<br />
Orchard management<br />
All orchard trees were maintained through appropriate<br />
cultural practices. Foliar nutrient samples were taken;<br />
fertilizer was applied for both growing stock and crop<br />
maintenance; irrigation was applied when required and<br />
trees transplanted into orchard 149 were staked, mulched,<br />
had irrigation lines and emitters installed, and were crownpruned<br />
to lessen transplant shock.<br />
Insect mon tor ng and control<br />
Surveys were conducted for Contarinia, Dioryctria and<br />
Leptoglossus. Due to the extremely light crop no control<br />
measures were undertaken for Contarina or Leptoglossus.<br />
T R E E I M P R O V E M E N T P R O G R A M<br />
P R O J E C T R E P O R T 2 0 0 6 / 2 0 0 7<br />
The Dioryctria trapping program was continued<br />
throughout the year, and population levels did not require<br />
control measures.<br />
.1. Kalamalka Seed<br />
Orchards<br />
Chr s Walsh<br />
In <strong>2006</strong>/<strong>2007</strong>, Kalamalka Seed Orchards received OTIP<br />
approval for 10 projects under the operational production<br />
sub-program. We received approval for a further two<br />
projects under the incremental program. The funding<br />
allowed for a significant enhancement of the effectiveness<br />
of our orchards in delivering improved seed. Activities<br />
included:<br />
• Improving orchard composition through grafting<br />
higher-breeding-value ramets, maintaining recently<br />
grafted high-value ramets destined for orchards, planting<br />
rootstock for future grafting, transplanting the older<br />
higher-value ramets to the orchards, and roguing lowervalue<br />
ramets from the orchards;<br />
• Improving orchard seed quantity and quality through<br />
pollen management, including collecting highbreeding-value<br />
pollen from clone banks and applying<br />
Supplemental Mass Pollination; and<br />
• Improving orchard productivity through pest<br />
management and other management activities.<br />
Pest management activities included:<br />
• using Safer’s Soap sprays to control galling adelgids,<br />
• removing weevil-infested spruce leaders to reduce weevil<br />
populations,<br />
• removing pine pitch moths damaging orchard tree<br />
stems,<br />
• baiting for control of rodents feeding on tree roots,<br />
• sanitation picking of cones in orchards with noncollectible<br />
crops to reduce pest populations,<br />
• applying dormant oil to control larch adelgids,<br />
• spraying to control Dioryctria in Lw cones,<br />
• spraying to control Leptoglossus, and<br />
2
• spraying to control spittle bugs and Zelleria in lodgepole<br />
pine orchards.<br />
Other funded management activities to boost<br />
productivity and gain included foliar analysis to determine<br />
the nutrient status of orchard trees and crown management<br />
of orchard trees.<br />
Orchard Composition Activities by <strong>Project</strong><br />
26<br />
T R E E I M P R O V E M E N T P R O G R A M<br />
P R O J E C T R E P O R T 2 0 0 6 / 2 0 0 7<br />
The OTIP funding was instrumental in increasing both<br />
the quantity and quality of seed produced. At Kalamalka<br />
in <strong>2006</strong> we produced approximately 221 kg of western<br />
larch, lodgepole pine, interior spruce, interior Douglas-fir,<br />
and western white pine seed equivalent to over 35 million<br />
seedlings with an average GW of +18. Large areas of the<br />
interior of the province are using Kalamalka seed.<br />
<strong>Project</strong> Species SPZ Orchard Roguing Grafts Made Maintained Rootstock Transplants<br />
SPU0401 Sx NE 305 100 152 100 131<br />
SPU0502 Sx NE 306 100 248 100 176<br />
SPU1302 Lw NE 332 25 90 367 100 79<br />
SPU1501 Pw KQ 335 72 224 60 19<br />
SPU2201 Fdi NE 324 25 4 100 21<br />
SPU3201 Pli EK 340 302 240 103<br />
SPU3401 Lw EK 333 40 65 169 75 36<br />
SPU3501 Sx BV 620 59 30 103 25 77<br />
SPUE11 Pli NE 307 70 2000<br />
SPUE12 Pli BV 230 173<br />
Totals 367 784 1507 2560 642<br />
Table . Orchard compos t on act v t es by project.<br />
Pollen Management Activities by <strong>Project</strong><br />
<strong>Project</strong> Species SPZ Orchard Pollen Collected <strong>Tree</strong>s<br />
(litres, dry) Pollinated<br />
SPU0401 Sx NE 305 3.0 495<br />
SPU0502 Sx NE 306 3.0 449<br />
SPU0701 Pli NE 307 5.0 1,665<br />
SPU1302 Lw NE 332 0.5 1,109<br />
SPU1501 Pw KQ 335 5.0 1,945<br />
SPU2201 Fdi NE 324 2.0 923<br />
SPU3201 Pli EK 340 2.0 300<br />
SPU3501 Sx BV 620 2.0 498<br />
SPUE12 Pli BV 230 5.0 500<br />
Totals 27.5 7,384<br />
Table . Pollen management act v t es by project.
.1.6 Vernon Seed Orchard<br />
Company (VSOC)<br />
T a Wagner and Dan Gaudet<br />
The Operational <strong>Tree</strong> <strong>Improvement</strong> <strong>Program</strong> (OTIP)<br />
funded fourteen projects at Vernon Seed Orchard in<br />
<strong>2006</strong>/<strong>2007</strong> (Table 6).<br />
Pollen collect on and Supplemental Mass<br />
Poll nat on (SMP)<br />
To ensure optimal ovule fertilization and ultimately seed<br />
yield, it is necessary to apply pollen to early and late flowers<br />
when pollen cloud densities are low. In addition, young<br />
orchards, such as SelectSeed expansion orchards, require<br />
supplemental pollination because they are beginning to<br />
produce female strobili but not an adequate amount of<br />
pollen. Collecting, processing, and storing pollen is a<br />
fundamental activity in improving the quality and quantity<br />
of seed.<br />
Induct on<br />
All three mature fir orchards, as well as a small trial of 30<br />
lodgepole pine ramets, were administered GA 4/7 . Results<br />
in Douglas-fir continue to be positive. We’ve collected<br />
and compiled four years of data that allow for clone based<br />
GA 4/7 injection prescriptions. This makes the process more<br />
efficient while maximizing its efficacy.<br />
Figure 1. Summary of VSOC <strong>2006</strong> OTIP activities<br />
Table 6. Summary of VSOC <strong>2006</strong> OTIP act v t es.<br />
T R E E I M P R O V E M E N T P R O G R A M<br />
Pest Monitoring and<br />
Control Induction<br />
Nutrient Analysis<br />
P R O J E C T R E P O R T 2 0 0 6 / 2 0 0 7<br />
To gain more experience and knowledge of the effects<br />
of GA 4/7 on lodgepole pine, a small trial was initiated to<br />
determine appropriate timing and dosage of applications.<br />
Last year’s results indicate no significant increase in cone<br />
production due to induction. von Aderkas et al. (OTIP<br />
500757AF1060) suggest that female buds differentiate a<br />
month earlier than indicated by Owens (<strong>2006</strong>). It appears<br />
that in 2005 induction was completed too late to achieve<br />
positive results. In <strong>2006</strong> application dates were altered to<br />
coincide with the new conclusions.<br />
Owens, JN. <strong>2006</strong>. The reproductive biology of lodgepole<br />
pine. FGC Extension Note 07. Available from http://<br />
www.fgcouncil.bc.ca<br />
Orchard health<br />
Each spring we launch a crusade against pests in an attempt<br />
to save valuable seed. We’ve provided a tasty buffet for<br />
“bugs” with a “No Entry” sign on the door that, to our<br />
dismay, the bugs often ignore. The appearance of mountain<br />
pine beetle in Interior seed orchards in <strong>2006</strong> heightens<br />
the necessity for sound pest management plans. To ensure<br />
the continued health and high vigour of ramets, pest and<br />
disease management have become routine practices at<br />
VSOC. Weekly monitoring allows for early detection of<br />
pests and implementation of control strategies if necessary.<br />
Upgrad ng<br />
Second generation white spruce (2600) were grafted on<br />
planted rootstock in the spring and maintained throughout<br />
the season.<br />
SMP - Ramets<br />
Treated<br />
Pollen<br />
Collected (L)<br />
Seedlings<br />
Produced (million)<br />
SPU <strong>Project</strong> Species SPZ Orchard<br />
1201 all site<br />
1208 Pli PG 236 5 na<br />
1706 Pli BV 234 2927 na<br />
1801 Pli CP 218 4142 12 12 0.85<br />
1701 Pli BV 219 5455 30 12 2.4<br />
1202 Pli PG 222 3746 30 15 0.45<br />
4102 Fdi PG 225 510 114 300 2 na<br />
3702 Fdi QL 226 351 236 300 6 0.40<br />
4301 Fdi CT 231 1050 569 600 5 0.12<br />
1403 Sx PG 211/214 8000 7.4<br />
1421 Sx PG Grafting and maintenance of 2.0 generation holdbed (2600)<br />
4057E18 all site<br />
Battery powered pruners<br />
4057E19 Fdi PG 233<br />
Improve water drainage<br />
4057E20 Pli PG 219<br />
Weather station<br />
27
Act v t es<br />
• The purchase of battery-powered pruners resulted in<br />
an increase in pruning efficiency and less strain on<br />
technicians’ wrists and arms.<br />
• Drainage installed at the top of Prince George orchard<br />
233 will increase the health of ramets in the upper<br />
portion of the orchard.<br />
• A weather station with updated software was installed<br />
in the Prince George lodgepole pine orchard. New<br />
software automatically calculates and plots degree day<br />
2<br />
T R E E I M P R O V E M E N T P R O G R A M<br />
P R O J E C T R E P O R T 2 0 0 6 / 2 0 0 7<br />
accumulation during the season. Data collected can<br />
assist in determining the effect of temperature on seed<br />
set, the timing of insect control, and trends over time.<br />
• Foliar sampling and analysis were completed in all<br />
orchards. Sample results aid in determining nutrient<br />
application levels in the following seasons.<br />
Available funding has a positive effect on the ability to<br />
achieve the Forest Genetics Council’s goals of 12% gain and<br />
75% use of Class A seed.<br />
Figure 2. Summary of the main pest and disease management initiatives undertaken at Vernon Seed Orchard in <strong>2006</strong><br />
Species Pest or Disease Monitoring Control Strategy<br />
Pli Leptoglossus occidentalis 30-min. visual survey once a week One application of Sevin<br />
Synanthedon sequoiae Pheromone traps and visual damage survey Manual removal on young trees<br />
Dendroctonus ponderosae Pheromone traps and visual survey’s twice weekly One to two applications of Sevin<br />
Needle cast Twice a season Cultural and chemical<br />
Fdi Dioryctria abietivorella Weekly cone survey Two to three applications of dimethoate<br />
Adelges cooleyi Spring survey One application of Safer’s Soap<br />
Sx Dioryctria abietivorella Weekly cone survey Two to three applications of dimethoate<br />
Adelges cooleyi Spring survey One application of Safer’s Soap<br />
Cydia strobilella, Megastigmus sp. Spring cone samples Controlled with first application of<br />
and Strobilomyia neantharacina dimethoate for Dioryctria<br />
Oligonuchus ununguis Spring and fall surveys Safer’s Soap and Kelthane application<br />
Pissodes strobi Visual survey Manual removal<br />
Table 7. Summary of the ma n pest and d sease management n t at ves undertaken at Vernon Seed Orchard n <strong>2006</strong>.<br />
F gure 22. Install ng<br />
dra nage n orchard 233.
.1.7 Grandv ew Seed<br />
Orchards<br />
(PRT Armstrong)<br />
by H lary Graham<br />
PRT Grandview manages five Lodgepole pine orchards and<br />
one Douglas-fir orchard, producing seed for the Thompson<br />
Okanagan (TO) low elevation and the Nelson (NE) low<br />
elevation seed planning units.<br />
In <strong>2006</strong>, all of the orchards received OTIP funding<br />
for activities to increase the yield and genetic gain<br />
of seed produced. These activities included grafting,<br />
holding bed maintenance, planting of grafts, insect and<br />
disease monitoring and control, rodent control, crown<br />
management, foliar analyses, pollen monitoring, pollen<br />
collection, flower induction, phenological surveys, and<br />
supplemental mass pollination (SMP).<br />
Pl orchards<br />
To improve the quality of orchards Pli 308 (OTIP 1002),<br />
Pli 311 (OTIP 1001), and Pli 313 (OTIP 0702), 308 grafts<br />
were made and maintained in holding beds. In the spring<br />
of <strong>2007</strong>, we will plant out 185 grafts for orchard 308, 23<br />
grafts for orchard 311, and 100 grafts for orchard 313.<br />
Fifty-six unproductive ramets were rogued from orchard<br />
308. This provides for long-term increase in GW for all<br />
three orchards because the vacant positions are filled with<br />
higher gain material.<br />
Pollen management activities began in early May with<br />
pollen collection, monitoring, and distribution using<br />
an orchard air-blast sprayer. Phenological surveys were<br />
conducted in the young orchards 337 (OTIP 0721) and<br />
338 (OTIP 1007). These orchards, as well as the early- and<br />
late-flowering clones in orchards 311 and 313, received<br />
SMP applications. Pollen was collected from orchards<br />
311, 313, and at the Kalamalka Forestry Centre. Whole<br />
pollen buds were collected both manually and by backpack<br />
vacuum by clone. Thanks to Michael Carlson and Chris<br />
Walsh for providing access to the Kalamalka clone banks.<br />
We collected five litres of pollen for the TO low orchards<br />
and three litres of pollen for the NE low orchards.<br />
Foliar tissue samples were taken to determine the<br />
appropriate fertilizer mix for spring and fall applications.<br />
Throughout the season, we monitored all Pli orchards for<br />
insect, rodent, and disease problems. This ensured that<br />
measures were taken to protect ramet health and developing<br />
T R E E I M P R O V E M E N T P R O G R A M<br />
P R O J E C T R E P O R T 2 0 0 6 / 2 0 0 7<br />
cones. Insecticide sprays were applied to control Leptoglossus<br />
seed bug. Fungicide sprays were required in the older<br />
orchards 308, 311, and 313. Poison baits were deployed to<br />
control rodents feeding on tree roots, and Pitch moths were<br />
removed by hand.<br />
Fd orchard<br />
Pollen monitoring began at the first flight of pollen in the<br />
orchard. Pollen shed and female receptivity were monitored<br />
throughout the pollination period (phenological surveys)<br />
to determine the timing for SMP applications. The survey<br />
information also allowed us to identify and pollinate early-<br />
and late-flowering clones.<br />
We applied stored pollen to receptive flowers three<br />
times (SMP). Pollen for future use was collected at the<br />
Kalamalka Forestry Centre. Thanks to Barry Jaquish and<br />
Valerie Ashley for providing access to the clone bank.<br />
Approximately 1.5 litres of pollen were collected, processed,<br />
and put into freezer storage.<br />
Throughout the season, we monitored the Fdi orchard<br />
for insect damage to the developing cone crop. Insecticide<br />
sprays were applied to protect the crop from Dioryctria<br />
(fir coneworm), which has caused substantial damage to<br />
previous cone crops.<br />
We applied gibberellic acid (GA) to 675 ramets by stem<br />
injection. With the appearance of numerous developing<br />
female and male buds, we are very optimistic about the<br />
<strong>2007</strong> crop.<br />
All projects were completed as planned in <strong>2006</strong>. In the<br />
Pli Thompson Okanagan Low, we collected 12.13 kg of<br />
seed with the potential to produce 2.26 million seedlings.<br />
In the Pli Nelson Low, we collected 9.69 kg of seed with<br />
the potential to produce 1.81 million seedlings. The Fdi<br />
Nelson Low orchard produced 0.94 kg of seed with the<br />
potential to produce 42,188 seedlings.<br />
The activities conducted in <strong>2006</strong> with the assistance of<br />
OTIP funding ultimately move us towards our goal of<br />
increasing the amount and quality of A-class seed for the Pli<br />
NE low, Pli TO low, and Fdi NE low seed planning units.<br />
GRANDVIEW SEED ORCHARDS (PRT<br />
ARMSTRONG) INCREMENTAL PROJECTS<br />
Crown management<br />
With the purchase of highly effective pruning equipment,<br />
we carried out extensive crown management in orchards<br />
308, 311, and 313 and removed unproductive central<br />
branches and long laterals that were encroaching on the<br />
aisleways. We also removed some lower branches to expose<br />
29
the boles for more effective MPB control. This pruning is<br />
expected to improve overall ramet vigour and encourage<br />
more cone-bearing sites. Only a portion of each orchard<br />
will be pruned each year to minimize the immediate loss of<br />
cone production.<br />
Pollen management<br />
To improve the ongoing pollen work in our Pli and Fdi<br />
orchards, the pollen laboratory at PRT required some<br />
upgrading. The purchase of a moisture analyser scale now<br />
allows us to complete pollen processing on site and get the<br />
pollen into freezer storage much more quickly.<br />
Crop stat st cs<br />
This project supported OTIP 0722, the “Collection of<br />
Crop Statistics for Interior Lodgepole Pine Orchards.”<br />
Data was collected as outlined by project 0722 and cone<br />
30<br />
T R E E I M P R O V E M E N T P R O G R A M<br />
P R O J E C T R E P O R T 2 0 0 6 / 2 0 0 7<br />
samples were collected and delivered for analysis. We<br />
submitted standardized and summarized data related<br />
to cone production and seed yields from three of PRT’s<br />
producing Pli orchards. The work will result in a better<br />
understanding of Pli seed production issues and will<br />
provide recommendations for improving orchard efficiency.<br />
Gamete contr but on<br />
This is a companion study to support/complement the Pli<br />
seed orchard DNA fingerprinting project approved by the<br />
FGC. We collected pollen data during the <strong>2006</strong> pollination<br />
season according to the seedlot rating protocols used in<br />
all BC orchards (Woods 2005). In <strong>2007</strong> we will collect<br />
seed-cone data and ramet tissue samples for DNA analysis.<br />
Completion of this project will complement the FGCfunded<br />
DNA fingerprinting study and provide baseline<br />
data for comparing male and female gametic contribution<br />
protocols.<br />
F gure 23. Crew appl es pollen to Pl orchard 33 . F gure 2 . PRT seed orchard staff n Fd orchard 321.
.1. Eagle Rock Seed Orchards<br />
(Tolko Industr es)<br />
Greg P eper<br />
The <strong>Tree</strong> <strong>Improvement</strong> <strong>Program</strong> supplied funding for work<br />
in our orchards. The goal this year was to fund activities to<br />
boost the quantity and quality of seed produced. We also<br />
collected pollen for future use.<br />
SPU 16 Thompson Okanagan h gh-elevat on Pl<br />
• We were able to collect about 12 hectolitres of cones<br />
from this orchard this year.<br />
• Because seed set continues to be a challenge, we used<br />
a helicopter and an airblast sprayer to distribute pollen<br />
and enhance pollen uptake for next year’s crop.<br />
• We collected 10 litres of pollen from orchard 310. Using<br />
Spritzers, we applied two litres of previously stored<br />
pollen and four litres from this year’s collection.<br />
• We expect approximately five hectolitres of cones from<br />
the new Pli orchard next year.<br />
• Because height is a problem for picking, we did some<br />
top pruning on the old large ramets in orchard 310.<br />
T R E E I M P R O V E M E N T P R O G R A M<br />
P R O J E C T R E P O R T 2 0 0 6 / 2 0 0 7<br />
We also did basal pruning to make it easier to operate<br />
equipment in the orchard and to increase light and air<br />
movement in the orchard.<br />
• Leptoglossus was again a concern, and we used four sprays<br />
of Sevin to control them in <strong>2006</strong>.<br />
• We purchased battery operated Electrocoup shears for<br />
pruning.<br />
SPU 2 to 30 Thompson Okanagan low and<br />
h gh -elevat on Sx<br />
• We selectively collected a good crop out of orchard 303<br />
this year. We collected 48 hectolitres of cones containing<br />
39,000 grams of seed with a maximum elevation of<br />
1,650 meters. We rogued 83 ramets of poor genetic<br />
worth out of the orchard.<br />
• Spraying was required for crop protection from<br />
Leptoglossus.<br />
• We collected and stored 16 litres of pollen from orchard<br />
303 for use in future years in the new 342 TO Low and<br />
343 TO High orchards located at our site.<br />
• We also topped trees in the new orchards to maintain<br />
low picking height.<br />
• Adelgids were not a problem this year.<br />
F gure 2 . Collect ng<br />
Pl us ng G rette.<br />
31
32<br />
.1.9 Pr nce George <strong>Tree</strong><br />
<strong>Improvement</strong> Stat on<br />
R ta Wagner<br />
SPU 1203, 1 02, 1702, 0 7E22, 0 7E21<br />
Activities are aimed at increasing the quantity and quality<br />
of lodgepole pine seed from Orchard 220 (Prince George<br />
low planning zone), Orchard 223 (Central Figureau low<br />
planning zone) and Orchard 228 (Bulkley Valley low<br />
planning zone).<br />
Five Operational <strong>Tree</strong> <strong>Improvement</strong> <strong>Project</strong>s were<br />
conducted at the Prince George <strong>Tree</strong> <strong>Improvement</strong> Station<br />
in <strong>2006</strong>-<strong>2007</strong>.<br />
Phenology surveys were completed to identify early/late<br />
flowering clones. Pollen density was monitored both inside<br />
and outside the orchards.<br />
Foliar samples were taken and analyses of nutrient status<br />
were completed in the fall.<br />
<strong>Tree</strong>s in all orchards were surveyed for western gall<br />
rust, lophodermella needle cast and root collar weevil.<br />
Extensive surveys were carried out due to a major mountain<br />
pine beetle attack in July <strong>2006</strong> and all three orchards were<br />
treated with Sevin to ensure survival of crop trees. As well,<br />
secondary bark beetles started to cause problems prior to<br />
MPB attacks (Ips, Pityogenes, Pityophthorus) and required<br />
some tree removal in orchards 223 and 228<br />
The fall <strong>2006</strong> cone harvest from the three provenance<br />
orchards yielded 34.74 kg of seed and 6.95 million<br />
potential seedlings with a genetic worth of 6%.<br />
SPU 1 12<br />
Management of interior spruce clone banks at the Prince<br />
George <strong>Tree</strong> <strong>Improvement</strong> Station is designed to ensure the<br />
availability of scion to replace existing orchard ramets or<br />
develop new orchards to boost productivity and gain.<br />
The Interior Spruce Clone Banks at the Prince George<br />
<strong>Tree</strong> <strong>Improvement</strong> Station provide vital support to the<br />
orchard and tree breeding programs in B.C. The clone<br />
banks are a centralized source of scion material for the<br />
grafting of new and improved seed orchards. They contain<br />
the only copy of many of the interior spruce parent tree<br />
selections found in seed orchards and breed arboreta.<br />
Clonebank fill planting was carried out to replace dead<br />
ramets and/or add new clones or increase number of live<br />
ramets per clone.<br />
A total of 353 scion were collected at the Prince<br />
George clonebanks and grafted at Kalamalka seed<br />
T R E E I M P R O V E M E N T P R O G R A M<br />
P R O J E C T R E P O R T 2 0 0 6 / 2 0 0 7<br />
orchard. 137 of these grafts were shipped to PGTIS and<br />
planted in our holding area in summer <strong>2006</strong>. Kalamalka<br />
seed orchard is maintaining the remaining grafts until<br />
the grafts are a suitable size for transplanting into the<br />
clonebanks. Transplanting from our holding area into<br />
the various clonebanks was carried out. Remaining grafts<br />
in holding area were weeded, watered, fertilized, pruned<br />
and monitored and treated for insects and disease. Due to<br />
severe weather — thawing/freezing cycles plus strong winds<br />
— many grafts in the holding area and clonebanks died<br />
over the winter.<br />
Similar management activities were carried out in<br />
the 12,000-tree clonebanks. Irrigation maintenance,<br />
fertilization, mowing and weeding will be required to<br />
ensure ramet survival. Foliar sampling was carried out.<br />
Insect (root collar weevil and spruce leader weevil) and<br />
disease monitoring was carried out to ensure ramet health.<br />
Ramet labelling was continued, replacing old, damaged tags<br />
and label newly planted trees with more permanent tags.<br />
.1.10 Sk m k n Seed Orchards<br />
(<strong>Project</strong>s 0 , 11, 01,<br />
1 03, 3 02, 002,<br />
0 7E13, and 201)<br />
Ke th Cox<br />
In <strong>2006</strong> we received funding for work in the research<br />
plantations, eight of the seed orchards, and to help deal<br />
with the Mountain Pine Beetle infestation at Skimikin.<br />
In the West Kootenay (Nelson mid and high) spruce<br />
orchards, we planted 262 replacement grafts in the spring<br />
and made another 259 grafts in the holding area. We<br />
surveyed orchards for insects and disease, removed rust<br />
brooms (Chrysomyxa arctostaphyli), and baited rodents.<br />
Based on ten-year breeding values, we removed another 16<br />
trees from orchard 301 and 31 from orchard 302, thereby<br />
increasing their average breeding values to ten and nine<br />
respectively. The trees will be hauled to the nearby Salmon<br />
River for stream-bank restoration.<br />
We monitored the white pine orchard (609) extensively<br />
because of the mountain pine beetle, the conifer seed bug,<br />
and the pine cone moth. This monitoring activity resulted<br />
in a season total of 54 surveys. Pollen bud collection
yielded a total of 69 litres of pollen buds for supplemental<br />
pollination in orchard 335 at Bailey Road.<br />
In the three spruce orchards for the Bulkley Valley<br />
Low, we sprayed the crop for spruce cone maggot and<br />
Leptoglossus. In orchard 208, we injected 305 trees with the<br />
flowering hormone GA in May and drought stressed them<br />
until the end of June. We repaired the ground where it had<br />
settled from previous roguing, and in April, we planted<br />
529 replacement grafts in orchard 208 and made another<br />
180 grafts. The crop was 4.6 hectolitres and yielded 3.8<br />
kilograms of seed.<br />
We monitored the 2,730 trees in the spruce orchard<br />
for the Peace River mid-elevation zone (212) for insects,<br />
disease, and rodents. We removed a total of 111 weevildamaged<br />
tops and baited the young orchard extensively<br />
for rodents. In the spring, we planted 47 more trees in the<br />
F gure 26. Squ rrel act v ty n the<br />
unmanaged wh te p ne orchard (607),<br />
<strong>Project</strong> 1 03.<br />
F gure 2 . Burn ng to reduce<br />
the fire r sk at Sk m k n. <strong>Project</strong><br />
0 7 E13.<br />
T R E E I M P R O V E M E N T P R O G R A M<br />
P R O J E C T R E P O R T 2 0 0 6 / 2 0 0 7<br />
orchard and maintained replacement grafts in the holding<br />
area.<br />
In orchard 206, we did the final levelling where we<br />
had rogued 630 trees in 2005. We monitored the trees<br />
for insects and disease and sprayed them for spruce cone<br />
maggots and spruce cone rust. We removed rust brooms<br />
and baited rodents.<br />
We monitored the on-site research plantations for<br />
insects and disease, baited them for rodents, and planted<br />
a second-generation spruce progeny test. We also planted<br />
approximately 3,000 white pine seedlings as part of a rustresistance<br />
screening trial and prepared a site for more to<br />
be planted in <strong>2007</strong>. We maintained the Ribes garden and<br />
inoculated white pine seedlings in September.<br />
We monitored extensively for the mountain pine beetle,<br />
and to reduce the fire hazard, we cleaned up two areas by<br />
hand-piling and burning or mulching.<br />
F gure 27.<br />
Temporary<br />
rr gat on n the<br />
Ribes garden<br />
dur ng wh te<br />
p ne seedl ng<br />
noculat on,<br />
<strong>Project</strong> 11.<br />
33
3<br />
.1.11 Kettle R ver Seed Orchard<br />
R ck Hans nger<br />
POLLEN COLLECTION FROM KALAMALKA<br />
FORESTRY CENTRE FOR SMP IN YOUNG PG AND<br />
CP LODGEPOLE PINE ORCHARDS<br />
Pl CP low – orchard s ze: 3,100 ramets<br />
As part of this project, we collected, extracted, mixed, and<br />
moisture-tested 470 ml of pollen from KFS and completed<br />
BV calculation. We used 13 clones in the collection, with<br />
a weighted average BV of 10.89, and completed SMP<br />
on approximately 1,200 ramets with receptive female<br />
cones. Three complete passes were completed from May<br />
20 through May 31. All pollen was used during SMP.<br />
A subsequent conelet survey in July has revealed that<br />
approximately 13,000 cones will be available for harvest in<br />
Aug. <strong>2007</strong>.<br />
Pl PG low – orchard s ze: ,900 ramets<br />
As part of this project, we collected, extracted, mixed, and<br />
moisture-tested 500 ml of pollen from KFS and completed<br />
BV calculation. We used 11 clones in the collection, with<br />
a weighted average BV of 9.78, and completed SMP on<br />
approximately 1,500 ramets with receptive female conelets.<br />
Three complete passes were completed from May 20 to<br />
31 in order to ensure fertilization of early and late flowers.<br />
All pollen was used during SMP. A subsequent conelet<br />
survey has revealed that approximately 7,200 cones will be<br />
available for harvest in Aug. <strong>2007</strong>.<br />
Construct on of Pollen Dryer<br />
As part of this project, we constructed three pollen<br />
dryers, one for Kettle River and two for others (PRT and<br />
Sorrento).<br />
The pollen dryers were constructed of marine-grade<br />
plywood, and all joints were glued and nailed to prevent<br />
airflow other than through the drying trays. The base was<br />
fabricated from steel-frame box tubing with lockable castor<br />
wheels for ease of movement. A variable-speed furnace<br />
motor draws outside air through selected vents and down<br />
through drying trays and exhausts out through a rear pipe<br />
vent.<br />
Each dryer has nine drying bins with an approximate<br />
minimum capacity of 15 l of pollen. Sifting trays were<br />
constructed of stainless steel with 40, 80, and 100-mesh<br />
screens respectively. Each drying tray is supported with a<br />
T R E E I M P R O V E M E N T P R O G R A M<br />
P R O J E C T R E P O R T 2 0 0 6 / 2 0 0 7<br />
plastic liner and silk-screen to prevent pollen loss during the<br />
drying process.<br />
Summary<br />
Pollen dryers have been used on an operational basis for<br />
Fd and Pl pollen at PRT and have operated effectively. No<br />
further design modifications are necessary. Tolko Industries<br />
purchased a pollen dryer from Kettle River in <strong>2007</strong>.<br />
.1.12 Saan ch Seed Orchard<br />
Carolyn Lohr<br />
Establ shment and mon tor ng of reg onal pollen<br />
mon tors on the Saan ch Pen nsula (SPU 0109)<br />
We set up five seven-day recorders at locations throughout<br />
the Saanich Peninsula. The objective of this project was to<br />
provide consistent estimates of local pollen contamination<br />
to Joe Webber (ProSeed Consulting) for further analysis<br />
and ultimately to coastal Douglas-fir seed producers on the<br />
Saanich Peninsula in order for them to determine the effect<br />
on the genetic worth of Fdc seedlots. We monitored pollen<br />
flight from March 21 to May 1 (six weeks). We changed<br />
the charts weekly and counted, averaged, and forwarded<br />
the counts for two fields per day per chart to Joe Webber at<br />
ProSeed Consulting.<br />
Orchard management operat ons to ma nta n<br />
product v ty and ncrease ga n n orchard 1 1<br />
SM FDC (SPU 1902)<br />
Orchard 181 is a 95-clone, 1037-ramet, first-generation<br />
SM, mid-elevation Fdc orchard. Fdc breeders planted<br />
progeny test plots in spring of 2005, and the initial rogue of<br />
the orchard will occur in 2008 (three-year data). The final<br />
composition of orchard 181 will consist of 25 to 30 clones<br />
from both forward and backward selections.<br />
Management operations included surveying the health<br />
and vigour of the ramets as well as maintaining grafts,<br />
pruning rootstock, replacing mortality, applying fertilizer<br />
and irrigation, sampling foliar nutrients, surveying foliage<br />
and cones for pests, and applying dimethoate to control<br />
Contarinia.<br />
Crop management included phenological and bud<br />
surveys, pollen collection, and SMP. Production for <strong>2006</strong><br />
was 5 hl of cones and 2.34 kg of seed.
Pest management n h gh-elevat on western<br />
hemlock orchard 196 (SPU 2 03)<br />
Orchard 196 consists of 24 clones and 251 ramets. The<br />
mean BV of this orchard is 11.<br />
SPU 2403 covers pest management activities for cone<br />
and foliar insects in Hw orchards to retain the health<br />
and vigour of ramets. Orchard staff conducted weekly<br />
insect surveys and, in consultation with MFR seed pest<br />
management officer, determined that chemical pesticide<br />
applications were unnecessary. Active populations of<br />
Syrphid fly larvae kept hemlock adelgid populations under<br />
control for the <strong>2006</strong> growing season.<br />
.1.13 Sorrento Seed Orchards<br />
H lary Graham<br />
Sorrento Seed Orchard manages two large Lodgepole pine<br />
orchards established in 2003 in partnership with SelectSeed<br />
Company. These orchards will supply seed for the Central<br />
Figureau (CP) low elevation and the Bulkley Valley (BV)<br />
low elevation seed planning units.<br />
To initiate early seed production in these orchards,<br />
pollen management activities were conducted with OTIP<br />
funding in <strong>2006</strong>. Pollen was collected at the Kalamalka<br />
Forestry Centre clone banks and used for supplemental<br />
mass pollination in both orchards in <strong>2006</strong>. All conelets<br />
received up to three applications of pollen during their<br />
receptivity period.<br />
As a result of this work, these orchards will produce seed<br />
in <strong>2007</strong>. We will collect up to 1.26 kg of seed (250,000<br />
plantables) with an expected genetic worth of 15% from<br />
the BV orchard. Approximately 760 grams of seed (150,000<br />
plantables) with an expected genetic worth of 20% will be<br />
collected from the CP orchard.<br />
Early seed production in these young orchards directly<br />
supports the FGC’s goals by making more genetically<br />
improved seed available for use in BC’s forests.<br />
T R E E I M P R O V E M E N T P R O G R A M<br />
P R O J E C T R E P O R T 2 0 0 6 / 2 0 0 7<br />
.2 Techn cal Support <strong>Program</strong>s<br />
.2.1 Cone and Seed Pest<br />
Management – Inter or<br />
Operat ons<br />
Robb Bennett<br />
This project covers operational expenses for the interior<br />
seed pest management biologist’s activities, including<br />
all expenses associated with lab, field, and office work.<br />
Included in this project are wages for one co-op student<br />
(one term) and auxiliary technical support (as needed)<br />
to assist with operational pest management trials, data<br />
analysis, and development of new operational techniques.<br />
The pest management biologist position was vacant from<br />
January until the end of May <strong>2006</strong>, when Jim Corrigan<br />
took over the position.<br />
Between May 23, <strong>2006</strong> and 31 March <strong>2007</strong> the interior<br />
seed pest management biologist provided the following<br />
services.<br />
1. Performed 90 site visits, pest surveys and identifications,<br />
and damage predictions and assessments.<br />
2. Delivered 13 written pest status reports, position papers,<br />
and/or backgrounders for colleagues and superiors inside<br />
the Ministry of Forests and Range and for partners<br />
outside the Ministry of Forests and Range.<br />
3. Prepared ~55 other extension recommendations, pest<br />
identifications, responses to requests for information,<br />
and other transfers of technology.<br />
4. Dealt with ~40 requests for information from members<br />
of the public.<br />
Work continued on in-house and collaborative<br />
development of protocols for seed bugs, seed wasps,<br />
cone worms, mountain pine beetle, and other insects<br />
of importance to interior cone and seed production. In<br />
summary, the interior pest management biologist:<br />
1. Initiated, or collaborated with university, government,<br />
and other research personnel on, nine pest management<br />
projects in the field.<br />
2. Assisted in the preparation of the <strong>2006</strong> mountain pine<br />
beetle risk assessment for PGTIS and Skimikin Seed<br />
Orchards.<br />
3
3. Developed protocols for management of mountain pine<br />
beetle in interior BC seed orchards<br />
As well as providing training for orchard technicians, the<br />
interior pest management biologist provided the following<br />
training and educational experiences:<br />
1. Delivered five professional presentations for colleagues<br />
and was an invited speaker in a scientific symposium<br />
(Entomological Society of BC).<br />
2. Delivered requested presentations to the Forest Genetics<br />
Council of BC, the Interior Technical Advisory<br />
Committee of the FGC, and BC Timber Sales.<br />
3. Was featured in two newspaper articles and two radio<br />
interviews regarding <strong>2006</strong> mountain pine beetle<br />
infestations in the Okanagan Valley and participated in<br />
related educational activities at the Vernon Home Show<br />
and the Allan Brooks Nature Centre.<br />
4. Made numerous “tail-gate” extension presentations to<br />
operational personnel.<br />
The following publication resulted from this project.<br />
Corrigan, J., M. Carlson, G. Giampa, V. Berger, C. Walsh,<br />
and W. Strong. <strong>2006</strong>. They’re heeeere! – observations<br />
of the first mountain pine beetle attacks recorded at the<br />
Kalamalka Forestry Centre. TicTalk 7(1):4-8.<br />
36<br />
.2.2 Western Redcedar Pollen<br />
Mon tor ng, Saan ch Pen nsula<br />
Joe Webber, ProSeed Consult ng<br />
SPU 0212 Introduct on<br />
The Chief Forester (CF) Standards for Seed Use in British<br />
Columbia has established the legal requirements for the<br />
use of tree seed on Crown land. For orchard seed lots, this<br />
includes effective population size (Ne) and genetic worth<br />
(GW). As well, where the risk of contamination exists,<br />
then the orchard managers must also include estimates of<br />
contamination. Calculations for estimating a seed lot’s GW<br />
are provided by Woods et al. (1996), Stoehr et al. (2004),<br />
and Woods 2005. This includes both female and male<br />
gamete contribution (including non-orchard sources of<br />
pollen and SMP).<br />
T R E E I M P R O V E M E N T P R O G R A M<br />
P R O J E C T R E P O R T 2 0 0 6 / 2 0 0 7<br />
Currently, Woods (2005) lists only coastal Douglasfir<br />
and lodgepole pine (Prince George) seed orchards as<br />
species for which managers must report contamination<br />
levels. However, the CF Standards also require managers to<br />
report levels of pollen contamination if an orchard is at risk.<br />
On the coast, this may include western redcedar, western<br />
hemlock, and Sitka spruce. This report covers the third<br />
year of monitoring western redcedar pollen flight on the<br />
Saanich peninsula and includes monitoring in two Saanich<br />
peninsula orchards (Western Forest Products and Timber<br />
West).<br />
Methods<br />
Seven-day pollen monitors (see Webber and Painter<br />
1996) were used at each of five locations on the Saanich<br />
peninsula. The Ministry of Forests and Range, <strong>Tree</strong><br />
<strong>Improvement</strong> Branch (Puckle Road) erected the monitors<br />
and changes the charts weekly. We also monitored western<br />
redcedar pollen in Western Forest Products (WFP) orchard<br />
189 and Timber West orchard 140 at Mount Newton.<br />
We counted two replicates on each chart and averaged<br />
the total number of pollen grains for the two replicates. We<br />
then divided by 44 mm 2 (the area of the chart counted) to<br />
represent the number of pollen grains per mm 2 for a 24hour<br />
period. We then summed the daily pollen catch over<br />
the monitoring period to determine pollen load for <strong>2007</strong>.<br />
Results<br />
Figure 29 shows the mean western redcedar pollen catch<br />
for five stations on the Saanich peninsula (figures for all<br />
five stations are available in the final report for SPU 0212<br />
<strong>2007</strong>). Figure 30 and Figure 31 show the mean daily pollen<br />
catch for two monitoring locations at WFP, the lower<br />
reservoir site adjacent to slide monitor 4 (Figure 30), and<br />
orchard 189 adjacent to slide monitor 8 (Figure 31).<br />
The monitoring period for the Saanich peninsula was<br />
February 13 to March 19, <strong>2007</strong>. However, western redcedar<br />
pollen flight effectively stopped March 8, and from there<br />
on we counted only red alder pollen (data not shown).<br />
Compared to the two previous years, the <strong>2007</strong> pollen load<br />
was about 107 (pollen grains/mm 2 /day summed over the<br />
monitoring period) compared to 33 last year and 118 in<br />
2005 (Table 8). Daily pollen catch varied between orchard<br />
sites (Table 8), with the Agriculture Canada site producing<br />
the highest values and the Mount Newton site the lowest<br />
values for the three monitoring periods.<br />
Figure 30 shows the daily pollen catch at the WFP<br />
lower reservoir site. This monitor was adjacent to WFP
slide monitor 4. Figure 31 shows the daily pollen catch in<br />
the WFP orchard 189. The monitor was adjacent to WFP<br />
slide monitor 8.<br />
The monitoring period was February 13 to March 13<br />
(note the monitor clock stopped for five days in orchard<br />
189) at WFP and February 11 to March 13 at TW. The<br />
receptivity period for WFP orchard 189 was February 20 to<br />
March 8, and at TW it was February 16 to March 5. Table<br />
9 shows the pollen load values for each of the three orchard<br />
sites, including the pollen load values calculated for WFP<br />
monitoring data for the two slide monitors (4 and 8). The<br />
7-day monitor was adjacent to each of the slide monitors,<br />
and pollen load values for the 7-day was 38 compared to<br />
160 at the reservoir site and 55 compared to 137 in the<br />
orchard. There are two important differences between these<br />
monitors. First the slides were located at 2 meters height<br />
whereas the 7-day monitors were placed at 3 meters height.<br />
Also the 7-day monitors are protected from the weather<br />
(capped), whereas the slides are exposed to the weather.<br />
Because this was the first time we compared side-by-side<br />
monitoring efficiencies, it is too early to suggest that one is<br />
better than the other.<br />
Figure 32 shows the daily pollen catch at the TW<br />
orchard 140. The pollen catch values were similar to those<br />
observed at WFP, but we do not have comparable data for<br />
TW western redcedar pollen monitoring.<br />
Conclus ons<br />
The magnitude and extent of western redcedar pollen<br />
on the Saanich peninsula was as great as for any coastal<br />
species monitored. However, since western redcedar pollen<br />
is among the smallest (30µ) of all local conifers, the error<br />
in counts will also be considerably higher than those for<br />
Douglas-fir, which is among the largest pollen grain of our<br />
local conifers (95µ).<br />
A second difficulty in counting western redcedar<br />
pollen is its size and form. It is very similar to red alder<br />
pollen. Western redcedar pollen is about 20 to 30 µ in<br />
diameter with some warty structures (orbicules) on the<br />
excine. At x100 magnification, it is possible to identify<br />
redcedar pollen, but it is very difficult to separate it from<br />
red alder pollen. Red alder is slightly smaller (20 to 25 µ<br />
in diameter) with pores. It looks very similar to redcedar at<br />
x100 magnification but with smaller orbicules. Positively<br />
distinguishing the two species at x400 is possible (glass<br />
slide and cover slip). However, distinguishing the two<br />
species at x400 on the Vaseline-coated charts (no cover slip)<br />
is very difficult. In general, the two are separated on the<br />
T R E E I M P R O V E M E N T P R O G R A M<br />
P R O J E C T R E P O R T 2 0 0 6 / 2 0 0 7<br />
basis of shape and phenology. When dry, redcedar pollen<br />
is irregularly shaped, and at X100, the orbicules appear<br />
as bright spots on the excine. Red alder is, in general,<br />
pentagonal and the orbicules do not appear as bright spots.<br />
However, when the two mix, it is not possible to determine<br />
the extent of either.<br />
Separation of redcedar pollen from red alder was<br />
particularly difficult in 2005 and <strong>2006</strong> because there<br />
was considerable overlap of shedding periods. However,<br />
in <strong>2007</strong> there was a clear separation between the end of<br />
redcedar pollen shed (March 6 to 10) and the start of red<br />
alder pollen shed. All data shown in Figures 29-32 are for<br />
redcedar pollen only.<br />
With the magnitude of pollen counts for western<br />
redcedar at both the monitoring sites, it is likely that<br />
significant contamination exists. This is certainly true<br />
for <strong>2007</strong> and 2005 when pollen capture levels were 3 to<br />
4 times that observed in <strong>2006</strong>. Whether this is a serious<br />
problem is not known. Certainly, any orchard clone sired<br />
with contaminated pollen should have a small positive<br />
effect over selfing. However, because the breeding value<br />
of contaminated pollen would be at best neutral, any<br />
contamination will have a negative effect on higherbreeding-value<br />
clones.<br />
This is the third year for monitoring western redcedar<br />
pollen shed from indigenous stands on the Saanich<br />
peninsula. However, the pollen monitoring technique used<br />
for Douglas-fir may not be applicable for western redcedar.<br />
The actual monitors do an excellent job of capturing the<br />
pollen, but the charts coated with Vaseline make positive<br />
identification difficult even with compound microscopes<br />
using x100 magnification. Data collected for <strong>2007</strong> also<br />
shows that there are considerable differences between<br />
the total pollen catch for slides and the catch for 7-day<br />
monitors. This will contribute to substantial error when<br />
calculating contamination values for redcedar orchards on<br />
the Saanich peninsula.<br />
L terature C ted<br />
Webber, J.E. and Painter, R.A. 1996. Douglas-fir pollen<br />
management manual. 2nd Edn. Ministry of Forests and<br />
Range, Research Branch. Work. Pap. 02/1996. 91pp.<br />
Woods, J.H., Stoehr, M.U., and Webber, J.E. 1996.<br />
Protocols for rating seed orchard seed lots in British<br />
Columbia. Ministry of Forests and Range, Research<br />
<strong>Program</strong>, Res. <strong>Report</strong> 06. 26pp.<br />
37
Pollen Grains per mm 2<br />
Pollen Grains per mm 2<br />
3<br />
20<br />
16<br />
12<br />
8<br />
4<br />
0<br />
Feb-13<br />
Feb-16<br />
Feb-19<br />
Feb-22<br />
Feb-25<br />
T R E E I M P R O V E M E N T P R O G R A M<br />
Figure 1: Mean daily western red cedar pollen catch (pollen grains/mm 2 )<br />
for five regional Saanich peninsula sites.<br />
20<br />
15<br />
10<br />
5<br />
0<br />
Mean Regional Pollen Catch <strong>2007</strong><br />
Mar-01<br />
Feb-26<br />
Feb-23<br />
Feb-20<br />
Feb-17<br />
Feb-14<br />
Feb-11<br />
Feb-08<br />
Feb-28<br />
Mar-03<br />
Mar-06<br />
Mar-09<br />
Mar-12<br />
Mar-19<br />
Mar-16<br />
Mar-13<br />
Mar-10<br />
Mar-07<br />
Mar-04<br />
Mar-15<br />
F gure 29. Mean da ly western red cedar pollen catch (pollen gra ns/<br />
mm 2 ) for five reg onal Saan ch pen nsula s tes.<br />
Pollen Grains per mm 2<br />
Mar-18<br />
Figure 2: Mean daily western red cedar pollen catch (pollen grains/mm 2 )<br />
at WFP lower reservoir site (adjacent to slide monitor 4).<br />
20<br />
15<br />
10<br />
5<br />
0<br />
Mar-04<br />
Mar-01<br />
Feb-26<br />
Feb-23<br />
Feb-20<br />
Feb-17<br />
Feb-14<br />
Feb-11<br />
Feb-08<br />
WFP Reservoir<br />
F gure 30. Mean da ly western red cedar pollen catch (pollen gra ns/<br />
mm2 ) at WFP lower reservo r s te (adjacent to sl de mon tor ).<br />
Figure 3: Mean daily western red cedar pollen catch (pollen grains/mm 2 )<br />
in WFP orchard 189 (adjacent to slide monitor 8).<br />
WFP Orchard 189<br />
Mar-19<br />
Mar-16<br />
Mar-13<br />
Mar-10<br />
Mar-07<br />
F gure 31. Mean da ly western red cedar pollen catch (pollen gra ns/<br />
mm 2 ) n WFP orchard 1 9 (adjacent to sl de mon tor ).<br />
P R O J E C T R E P O R T 2 0 0 6 / 2 0 0 7<br />
Table 1: Total pollen load (sum of daily pollen<br />
capture-grains/mm2 over the monitoring period on<br />
the Saanich peninsula) for 2005, <strong>2006</strong> and <strong>2007</strong>.<br />
Pollen Load<br />
Saanich Peninsula<br />
Monitoring Location 2005 <strong>2006</strong> <strong>2007</strong><br />
Puckle Road 148.1 54.8 118.0<br />
Saanich Pen Hosp 113.3 18.9 107.6<br />
Agriculture Canada 155.4 65.4 189.9<br />
Stelly’s X Road 99.2 15.4 70.9<br />
Mount Newton 75.8 12.1 47.8<br />
Mean All Stations 118.5 33.3 106.8<br />
Table 2: Total pollen load (sum of daily pollen<br />
capture-grains/mm2 Table . Total pollen load (sum of da ly pollen<br />
capture-gra ns/mm<br />
over the monitoring period in WFP<br />
and TW orchards) <strong>2007</strong>.<br />
2 over the mon tor ng<br />
per od on the Saan ch pen nsula) for 200 ,<br />
<strong>2006</strong> and <strong>2007</strong>.<br />
<strong>2007</strong> Pollen Load<br />
Orchard Site Slides 7-day<br />
WFP Reservoir (monitor 4) 38 160<br />
WFP Orchard 189 (monitor 8) 55 137<br />
TW orchard 140 na 123<br />
Table 9. Total pollen load (sum of da ly pollen<br />
capture-gra ns/mm 2 over the mon tor ng<br />
per od n WFP and TW orchards) for <strong>2007</strong>.
T R E E I M P R O V E M E N T P R O G R A M<br />
in the TW Mount Newton orchard site 140.<br />
20<br />
15<br />
10<br />
5<br />
0<br />
Mount Newton<br />
Mar-04<br />
Mar-01<br />
Feb-26<br />
Feb-23<br />
Feb-20<br />
Feb-17<br />
Feb-14<br />
Feb-11<br />
Feb-08<br />
Mar-19<br />
Mar-16<br />
Mar-13<br />
Mar-10<br />
Mar-07<br />
Pollen Grains per mm 2 Figure 4: Mean daily western red cedar pollen catch (pollen grains/mm2)<br />
F gure 32. Mean da ly western red cedar pollen catch (pollen gra ns/<br />
mm 2 ) n the TW Mount Newton orchard s te 1 0.<br />
.2.3 Development of Pollen<br />
Management Gu del nes for<br />
Yellow-cedar.<br />
Oldr ch Hak<br />
SPU 1106<br />
Poor pollen quality at pollination time may be one of the<br />
principal factors responsible for the failure of low-elevation<br />
orchards to produce sufficient quantities of viable seed. To<br />
date, all assessments of pollen quality were based entirely on<br />
vitro testing using pollen germination. These assessments<br />
should be interpreted as only an indication of pollen<br />
fertility. In this project, the actual fertility of low-elevation<br />
males is being confirmed through control pollinations of<br />
females in natural stands. Similarly, the level of fertility of<br />
low-elevation females is not known and is being examined<br />
through control pollinations using high-quality pollen<br />
collected from natural stands.<br />
Trials at a low-elevation seed orchard (Mount Newton)<br />
and in natural stands at high elevation (Mount Washington<br />
and Jordan River high elevation) have been completed and<br />
the results published in the 2004/2005 <strong>Project</strong> <strong>Report</strong>.<br />
The results indicate that low-elevation yellow-cedar seed<br />
orchards are capable of producing viable seed. This is<br />
contrary to earlier reports that low-elevation seed orchards<br />
established on Vancouver Island are not capable of doing so.<br />
Given the importance of the location and management of<br />
yellow-cedar breeding and seed orchards, recommendations<br />
for their establishment should be based on more than oneyear<br />
data. Furthermore, difficulties encountered during<br />
the first project with environmental conditions and bears<br />
P R O J E C T R E P O R T 2 0 0 6 / 2 0 0 7<br />
introduced several factors that may influence the results of<br />
the trial to a certain degree.<br />
A follow-up project at Mt. Newton seed orchard<br />
(low elevation) and Mt. Washington (high elevation)<br />
was therefore established in 2004 to deal with the above<br />
problems and to confirm the results of the first project<br />
through re-testing. An additional site at Jordan River low<br />
elevation was included in the new project because it has<br />
produced good quality pollen in past trials and has a good<br />
potential to produce viable seed. Control pollinations at all<br />
the above sites were completed in spring 2005. Cones were<br />
collected and seed was extracted in fall <strong>2006</strong>. Data will be<br />
analyzed, and the final results will be reported in spring<br />
<strong>2007</strong>.<br />
.2. Operat onal Crown<br />
Management Tr als n Var ous<br />
Orchards: Inter or Spruce H ghdens<br />
ty Seed Orchard 620 and<br />
Inter or Douglas-fir Orchard 32<br />
(SPU 2202)<br />
Gary G ampa<br />
Object ves<br />
One objective of this project is to determine which crown<br />
management techniques are most effective in controlling<br />
vegetative growth to allow for safe crop collection and<br />
efficient orchard management. In addition, we are trying<br />
39
to determine the effects of various treatments on crop<br />
production.<br />
Results<br />
OTIP will not be supporting this project in <strong>2007</strong>. This<br />
report contains the final recommendations for crown<br />
management of an interior spruce high-density seed<br />
orchard.<br />
We are not able to provide final crown management<br />
recommendations for interior Douglas-fir. We began<br />
pruning this orchard in the fall of 2004. The trial has not<br />
been in place long enough to provide enough data to draw<br />
conclusions.<br />
Crown management n the spruce m cro orchard<br />
Currently we are applying four different treatments to<br />
ramets in our interior spruce micro orchard.<br />
0<br />
T R E E I M P R O V E M E N T P R O G R A M<br />
Figure xx. Treatments applied to ramets in the interior spruce micro orchard <strong>2007</strong><br />
P R O J E C T R E P O R T 2 0 0 6 / 2 0 0 7<br />
Output and del verables: recommendat ons for<br />
crown management of the spruce m cro orchard<br />
We discovered that the control group always yielded a<br />
much greater cone and pollen crop than the other methods.<br />
However, leaving the trees unmanaged is definitely not an<br />
option in a micro-orchard setting. Because space is limited,<br />
it is essential to manage the growth of each ramet so that it<br />
does not expand out of its allotted area.<br />
Operational-style pruning is the most effective crown<br />
management technique to apply to an interior spruce<br />
high-density seed orchard. This technique delivers the most<br />
consistent flower crop. It is also the easiest technique to<br />
implement because it requires no labour-intensive branch<br />
training.<br />
Trtmt # Description Prune Leader? Prune Branches? Train?<br />
1 Height Control, Branch Train To 3m. if unable to train Only if extending past 0.5<br />
m. into row<br />
2 Freestyle As seen fit As seen fit As seen fit<br />
3 Operational Style Pruning Prune 75% current leader<br />
growth. Not to exceed 3 m.<br />
Remove 75% current<br />
growth to promote hedge<br />
effect<br />
4 Control None None None<br />
Table 10. Treatments appl ed to ramets n the nter or spruce m cro orchard <strong>2007</strong>.<br />
.2. Test ng the Effects of Upgraded<br />
Irr gat on Del very Systems<br />
n an Inter or Spruce Seed<br />
Orchard, an Inter or Lodgepole<br />
P ne Seed Orchard, and a<br />
Western Larch Seed Orchard<br />
(SPU 0 12).<br />
Gary G ampa<br />
Object ves<br />
• To determine how the broadcast-delivery irrigation<br />
system affects orchard performance.<br />
To other branches on same<br />
tree.<br />
Prune or remove branches<br />
extending >0.5 m. into rows<br />
• To compare the portion of each orchard treated with<br />
the upgraded system to the portion of each orchard that<br />
continues to be watered by the old drip-style system.<br />
• To extend the trial to orchard 332 in order to determine<br />
how the larch responds to broadcast irrigation.<br />
• To make the results of this study available to other seed<br />
orchard managers.<br />
Act v t es<br />
In the summer of 2004, we selected permanent sample trees<br />
in each orchard (82 trees in orchard 305 and 80 trees in<br />
orchard 307). The sample trees were chosen in pairs, based<br />
on establishment date: one tree in the area irrigated with<br />
the micro sprinklers and the other in the drip-irrigated area.
Three major branches on each sample tree were chosen<br />
at random and marked with metal tags. We measure shoot<br />
elongation annually on each sample branch. We measure<br />
stem diameter below all branches annually on each sample<br />
tree.<br />
In the summer of <strong>2006</strong>, we repeated these<br />
measurements. We also observed flower production<br />
annually. We surveyed flower production and collected<br />
cone samples from Pli orchard 307 and Sx orchard 305.<br />
We have extracted seed from these cones and compared<br />
seed production. We also collected foliar samples in both<br />
orchards and analysed nutrient uptake.<br />
Five rows in Lw orchard 332 were upgraded to<br />
the micro-sprinkler irrigation system. We selected<br />
80 permanent sample trees and recorded baseline<br />
measurements.<br />
Results<br />
The new irrigation regime has been in effect for three<br />
growing seasons in orchards 305 and 307, and we are<br />
noticing an impact on ramet performance. Table 11.<br />
illustrates the differences in annual shoot growth.<br />
We extracted and X-rayed seed from the orchard 307<br />
and orchard 305 cone samples. In <strong>2006</strong> the Sx trees in the<br />
T R E E I M P R O V E M E N T P R O G R A M<br />
average<br />
shoot<br />
growth<br />
2004<br />
average<br />
shoot<br />
growth<br />
2005<br />
P R O J E C T R E P O R T 2 0 0 6 / 2 0 0 7<br />
area irrigated with micro sprinklers had better seed set than<br />
samples collected from the drip-irrigated area. There was<br />
not much difference in cone weight or seed set (Table 12.)<br />
between irrigation treatments in the Pli in <strong>2006</strong>.<br />
Nutrient uptake is another area where broadcast<br />
irrigation seemed to have an effect. When the foliar samples<br />
were processed, we observed higher levels of aluminium,<br />
boron, calcium, manganese, nitrogen, and phosphorus in<br />
the samples collected from the portions of the orchards<br />
watered with the broadcast delivery system.<br />
Output and Del verables<br />
Although this trial is only in its third season, it is starting to<br />
appear that the different irrigation delivery systems do have<br />
an impact on ramet performance.<br />
We need to continue monitoring the permanent sample<br />
trees on an annual basis to confirm our data. Hopefully<br />
these orchards will produce good cone crops in <strong>2007</strong> so<br />
that we can collect more flowering data. We will collect a<br />
set of comprehensive baseline observations over the course<br />
of several growing seasons. Comparing these results will<br />
allow us to determine the effectiveness of broadcast delivery<br />
and make recommendations to other orchard managers<br />
considering irrigation system upgrades.<br />
average<br />
shoot<br />
growth<br />
<strong>2006</strong><br />
#307 micro-sprinklers 16 18.8 18.1<br />
#307 drip 17 15.1 15.9<br />
difference -1 3.7 2.2<br />
#305 micro-sprinklers 14 16 16<br />
#305 drip 13 13.4 12.3<br />
difference 1 2.6 3.7<br />
Irrigation Treatment average<br />
cone dry<br />
weight<br />
grams<br />
2005<br />
average #<br />
filled seed<br />
per cone<br />
2005<br />
average<br />
cone dry<br />
weight<br />
grams<br />
<strong>2006</strong><br />
average #<br />
filled seed<br />
per cone<br />
<strong>2006</strong><br />
307 drip 4.59 11.2 5.9 13.8<br />
307 micro sprinklers 5.38 13.7 5.96 13.4<br />
305 drip No<br />
Record<br />
305 micro sprinklers No<br />
Record<br />
No crop No<br />
Record<br />
No crop No<br />
Record<br />
56.8<br />
65.8<br />
Table 11. Average Shoot<br />
Growth Over Three Years.<br />
Table 12. Results of<br />
Irr gat on Treatments.<br />
1
.2.6 Enhanc ng Seed Product on n<br />
North Okanagan Lodgepole<br />
P ne Seed Orchards<br />
(SPU 0719)<br />
Chr s Walsh and Joe Webber<br />
The OTIP SPU 0719 final report for 2005 provided a<br />
complete summary of the lodgepole pine seed set study for<br />
the period of 2000 to 2005. Over that period, the improved<br />
irrigation system did not result in substantial increases<br />
in seed yields, although cone mass and seed weights have<br />
improved. Temperature and drought conditions during<br />
the pre-pollination, pollination, fertilization, and embryo<br />
development periods have not been severe, and soil<br />
moisture content has been adequate. Crown misting has<br />
also not been necessary. Again weather conditions during<br />
the sensitive periods of reproductive development have not<br />
limited either pollen uptake or fertilization and embryo<br />
development.<br />
There is growing concern that both seed yields and<br />
cone numbers are declining over the last three years. This<br />
downward trend is observed across the orchard in general<br />
and is not associated with culture (over-watering) although<br />
over-watering may exaggerate this trend. Lower cone<br />
numbers may be the result of decreasing tree vigour caused<br />
by crown shading that comes from increased tree size. Also,<br />
cone numbers may be dropping because the sampling<br />
points have become increasingly lower in the crown.<br />
Although sampling now considers crown position (high and<br />
low), cone numbers are still declining.<br />
We have no reason to suspect pollen supply (uptake)<br />
as the cause of the decline, especially in the upper crown<br />
seed cones, although pollen supply in the lower crown (in<br />
large trees) may be limiting. Since this orchard is nearing<br />
20 years old, we must suspect the vigour of the trees as a<br />
cause of lower cone and seed production. We also need to<br />
consider whether insect damage to first-year cones after<br />
harvesting can adversely affect yields the following year.<br />
Because the pre- and post-pollination season was not<br />
hot and dry, we abandoned monitoring cultural effects on<br />
seed set. However, we monitored insect damage, pollen<br />
supply to lower crown cones, and weather. Increasing lower<br />
crown pollen supply (control crosses and SMP) did not<br />
improve seed set, and insect losses were in the range of 10<br />
filled seed per cone in upper crown cones. We have noted<br />
that insect seed losses increase with heat. The year <strong>2006</strong> was<br />
2<br />
T R E E I M P R O V E M E N T P R O G R A M<br />
P R O J E C T R E P O R T 2 0 0 6 / 2 0 0 7<br />
relatively cool during the pre- and post-pollination period<br />
but was unusually hot and dry during June and September.<br />
RESULTS<br />
Lower crown pollen supply<br />
We used both control cross pollination and SMP to<br />
determine if pollen supply to lower crown cones was<br />
limiting seed yields. We treated lower crown cones with<br />
SMP in 2005 and then compared them with openpollinated<br />
cones in upper crowns, both with and without<br />
insect protection (bagging). We compared cones treated<br />
with control crossing in the lower crown with OP cones in<br />
both the lower and upper crowns.<br />
Figures 33 and 34 show the effect of SMP on lower<br />
crown cones for both total seed per cone (TSPC) and filled<br />
seed per cone (FSPC). Figures 33 and 34 also show the<br />
effect of insect protection on lower (SMP) and upper crown<br />
cones (OP only). Increasing pollen supply (SMP) to lower<br />
crown cones did not improve either TSPC or FSPC, but<br />
the effect of insect protection is apparent. About 10 FSPC<br />
were lost in the upper crown from insect predation, but the<br />
loss was less than two for lower crown cones.<br />
Figures 35 and 36 show the effect of control cross<br />
pollination on lower crown cones compared to OP<br />
cones in both the upper and lower crowns. There was a<br />
slight decrease in FSPC (about four) from OP cones in<br />
lower compared to upper crown cones, and control cross<br />
pollination did not improve the number of FSPC in the<br />
lower crown.<br />
Meteorolog cal data<br />
Temperature (Tsum) and vapour pressure deficit (VPDsum)<br />
sums are shown for the irrigation block only. Tables 13 to<br />
16 show the meteorological data for four important periods<br />
of reproductive development in lodgepole pine. April to<br />
mid-May represents the period of rapid second-year cone<br />
development and pre-pollination development of the firstyear<br />
cones. The last two weeks of May represent the period<br />
of flowering, pollination, pollen uptake, and early pollen<br />
development (penetration of the nucellus). June represents<br />
the period of fertilization and early embryo development<br />
of the second-year cones, and September is the period of<br />
differentiation of first-year cones (although recent data on<br />
describing the period of seed cone differentiation suggest<br />
that it occurs much earlier).<br />
Heat sums, vapour pressure deficits, and precipitation<br />
vary by year and period of reproductive development.<br />
During pre-pollination, <strong>2006</strong> was an average year with
TSPC<br />
FSPC<br />
TSPC<br />
FSPC<br />
40<br />
30<br />
20<br />
10<br />
0<br />
30<br />
25<br />
20<br />
15<br />
10<br />
5<br />
0<br />
30<br />
25<br />
20<br />
15<br />
10<br />
5<br />
0<br />
25<br />
20<br />
15<br />
10<br />
5<br />
0<br />
T R E E I M P R O V E M E N T P R O G R A M<br />
Figure 1. SMP on Lower Crown Cones<br />
Effect on Total Seed per Cone (TSPC)<br />
high bag high no bag low bag low no bag<br />
Figure 2. SMP on Lower Crown Cones<br />
Effect on Filled Seed per Cone (FSPC)<br />
high bag high no bag low bag low no bag<br />
Figure 3. Control Cross Pollination on Lower Crown Cones<br />
Effect on Total Seed per Cone (TSPC)<br />
OPhi OPlow CClow<br />
Figure 4. Control Cross Pollination on Lower Crown Cones<br />
Effect on Filled Seed per Cone (FSPC)<br />
OPhi OPlow CClow<br />
moderate heat and rain. This continued through the<br />
pollination period (Table 14), but the weather became<br />
very hot and dry in June (Table 15), and these conditions<br />
continued through to September (Table 16). September<br />
had the highest heat sums and VPD sums and the lowest<br />
rainfall recorded during the monitoring period of 2000 to<br />
<strong>2006</strong>.<br />
CONCLUSIONS<br />
Increasing pollen supply, either by SMP or control cross<br />
pollination, did not affect seed yields (TSPC and FSPC)<br />
in lower crown cones. This suggests that pollen is not<br />
limiting in the lower crown. It is also possible that either<br />
pollen quality was poor or the pollination technique was<br />
not effective. Seed yields are typically lower in the lower<br />
crown, which may indicate a lower number of potential<br />
P R O J E C T R E P O R T 2 0 0 6 / 2 0 0 7<br />
F gure 33. SMP on Lower Crown Cones Effect<br />
on Total Seed per Cone (TSPC).<br />
F gure 3 . SMP on Lower Crown Cones Effect<br />
on F lled Seed per Cone (FSPC).<br />
F gure 3 . Control Cross Poll nat on on Lower<br />
Crown Cones Effect on Total Seed per Cone<br />
(TSPC).<br />
F gure 36. Control Cross Poll nat on on Lower<br />
Crown Cones Effect on F lled Seed per Cone<br />
(FSPC).<br />
ovules. This may be a direct result of lower crown vigour,<br />
although crown position did not affect dry cone mass (data<br />
not shown).<br />
Losses to insect damage were as great as ever observed.<br />
Weather conditions may explain the magnitude of seed<br />
loss to insects in <strong>2006</strong>. Tables 15 and 16 clearly show that<br />
June and September <strong>2006</strong> were among the hottest and<br />
driest months since this data has been compiled (2000).<br />
About seven total and 10 filled seed per cone were lost in<br />
unprotected upper crown cones, whereas in the lower crown,<br />
less than two total and filled seed per cone were lost. These<br />
are important observations. In orchard 307 insect damage<br />
in the lower crown seems to be not a problem whereas in<br />
the upper crown, it is. If we are to improve seed set in this<br />
orchard, we must determine where losses in TSPC cones<br />
occur, and we must reconsider insect control technique.<br />
3
T R E E I M P R O V E M E N T P R O G R A M<br />
2000 2001 2002 2003 2004 2005 <strong>2006</strong><br />
Tsum na 4740 3673 4400 5365 6480 4205<br />
Tsum>24 na 299 74 48 456 1009 186<br />
T>24 (hrs) na 12 3 2 18 39 7<br />
VPDsum na 518 503 414 547 629 559<br />
VPDsum2 na 39 45 28 67 130 49<br />
VPD>2 (hrs) na 17 20 13 29 55 21<br />
precipitation na 16.9 13.9 73.4 60.4 47.8 49.0<br />
Table 13. Prepoll nat on (Apr l 1 to May 1 ).<br />
Table 1: Prepollination(April 15 to May 15)<br />
Table 2: Pollination (May 15 to May 31)<br />
2000 2001 2002 2003 2004 2005 <strong>2006</strong><br />
Tsum 3466 4100 3603 3771 3631 4156 3905<br />
Tsum>24 104 1515 304 48 578 1480 1148<br />
T>24 (hrs) 4 54 12 2 18 51 41<br />
VPDsum 313 424 283 414 283 407 349<br />
VPDsum>2 23 163 50 54 67 178 146<br />
VPD>2 (hrs) 10 56 22 22 29 58 49<br />
precipitation na 20.1 38.5 38.6 143.8 25.6 45.0<br />
Table 1 . Poll nat on (May 1 to May 31).<br />
Table 3: Fertilization and early embryo development (June)<br />
2000 2001 2002 2003 2004 2005 <strong>2006</strong><br />
Tsum 8257 7591 10061 9896 9895 7906 9612<br />
Tsum>24 2128 1495 5013 4443 4861 1116 3318<br />
T>24 (hrs) 79 56 179 161 172 42 116<br />
VPDsum 701 630 1056 887 882 509 963<br />
VPDsum>2 209 161 595 443 444 84 459<br />
VPD>2 (hrs) 78 63 202 161 154 35 143<br />
precipitation na 60.9 15.4 83.6 48.0 164.8 7.4<br />
Table 1 . Fert l zat on and early embryo development (June).<br />
Table 4: Seed cone differentiation (September)<br />
2000 2001 2002 2003 2004 2005 <strong>2006</strong><br />
Tsum 5240 7617 7102 7773 5811 6092 9612<br />
Tsum>24 328 1528 5014 1896 322 323 3318<br />
T>24 (hrs) 13 58 179 68 231 13 116<br />
VPDsum 345 672 660 681 297 437 963<br />
VPDsum>2 22 178 123 211 11 28 459<br />
VPD>2 (hrs) 10 72 47 75 5 13 143<br />
precipitation na 40.6 20.6 63.2 100.3 55.6 7.4<br />
Table 16. Seed cone d fferent at on (September).<br />
P R O J E C T R E P O R T 2 0 0 6 / 2 0 0 7
.2.7 Increas ng Qual ty, Genet c Ga n<br />
and Quant ty of Yellow Cedar<br />
Cutt ngs<br />
Mark Gr ffin, John Ogg, Cra g Ferguson,<br />
John Russell<br />
SPU 1113<br />
Introduct on<br />
This project involves increasing the quantity and quality of<br />
high-value yellow cedar cuttings for the coastal program.<br />
Objectives include:<br />
1. provide the cultural treatments required to improve<br />
hedge production<br />
2. enhance hedge composition by replacing lower-geneticvalue<br />
families and clones with newly tested, improved<br />
clones<br />
<strong>2006</strong>/<strong>2007</strong> H ghl ghts<br />
Pruning of hedges occurred in early <strong>2006</strong>, and fertilizing<br />
of both the soil-based and field-based containerplanted<br />
hedges with 34-0-0, 19-18-18, and 12-51-0<br />
continued throughout the growing season. The media<br />
for the greenhouse-grown container-planted donor<br />
plants contained APEX 16-5-11, augmented by weekly<br />
applications of hi-sol.<br />
Approximately 5,400 genetically improved cuttings<br />
from series 1 and 2 with an estimated genetic worth of<br />
between 10 and 15% were potted up into one-gallon pots,<br />
pruned, and placed in a greenhouse to produce donors.<br />
These joined an existing inventory of some 4,200 donor<br />
plants. To create space for the newer, genetically improved<br />
material, 1,390 older series one selections were either<br />
rogued or moved out into the field. Some 1,560 genetically<br />
improved cuttings from SSM and QCI were also potted<br />
and placed into a greenhouse for production.<br />
This year Cowichan Lake Research Station supplied<br />
BC Timber Sales with enough cutting material to set<br />
approximately 230,000 cuttings. Approximately 140,000<br />
cuttings came from high-gain material from the greenhouse.<br />
The goal eventually is to produce 300,000 cuttings from<br />
the 8,000 high-gain greenhouse-grown donors.<br />
T R E E I M P R O V E M E N T P R O G R A M<br />
P R O J E C T R E P O R T 2 0 0 6 / 2 0 0 7<br />
F gure 37. Inventory of yellow cedar donor stock.<br />
F gure 3 . Older yellow cedar stock weeks after m d-season prun ng.
F gure 39. Younger yellow cedar donor stock weeks after<br />
m d-season prun ng.<br />
.2. Effect of Selfing and Flower ng<br />
Phenology on Seed Product on<br />
n Yellow-cedar Seed Orchards.<br />
(SPU 1112)<br />
Oldr ch Hak<br />
Results from a current study indicate that low-elevation<br />
yellow-cedar seed orchards are capable of producing viable<br />
seed (see <strong>Project</strong> <strong>Report</strong> 2004/2005). The study further<br />
shows that both low-elevation males and low-elevation<br />
females can produce viable seed. This is contrary to earlier<br />
reports that low-elevation seed orchards established on<br />
Vancouver Island are not able to do so. One possible<br />
answer to this discrepancy lies in the pollination method<br />
employed in each case. Open pollination was practiced in<br />
the early seed orchards at low elevation. Similarly, when<br />
open-pollinated cones were collected in the current study,<br />
they also produced empty seed. However, when control<br />
6<br />
T R E E I M P R O V E M E N T P R O G R A M<br />
P R O J E C T R E P O R T 2 0 0 6 / 2 0 0 7<br />
F gure 0. Younger yellow cedar donor stock.<br />
pollination was used, the cones produced viable seed.<br />
There was an abundance of pollen on the tested trees and<br />
on surrounding trees for open pollination. This suggests<br />
that there may be several unknown and untested factors<br />
responsible for this failure.<br />
The objective of this project is to test three possible<br />
causes for empty seed production in open-pollinated seed<br />
orchards: selfing, flowering phenology (timing of natural<br />
pollen shed vs. timing of the receptivity of female flowers)<br />
and insect damage.<br />
The study is being carried out at two locations at two<br />
different time periods. The first trial was initiated at the<br />
Mount Newton seed orchard in spring 2005, and the<br />
second trial was initiated at the Western Forest Products<br />
seed orchard in spring <strong>2006</strong>. Pollinations were completed<br />
at Mt. Newton in winter <strong>2006</strong>, and at Western Forest<br />
Products the pollinations will be done in winter <strong>2007</strong>.<br />
Cones will be collected and seed will be extracted one<br />
year after pollination; the percentage of full seed for each<br />
treatment will be determined.
.2.9 Crown Prun ng Techn que for<br />
North Okanagan Lodgepole<br />
P ne Seed Orchards.<br />
SPU 0720<br />
Chr s Walsh and Joe Webber<br />
As orchards mature, crown form eventually becomes either<br />
too high or too bushy to manage effectively. In general,<br />
trees taller than 5 to 6 m require some form of topping<br />
and also pruning of lateral branches that extend into the<br />
rows to allow access for tractors and pickers. Experience<br />
from applying other pruning treatments to lodgepole pine<br />
suggests that cone production (both seed and pollen cones)<br />
will drop immediately after pruning but can return to pretreatment<br />
levels within three to five years.<br />
Most north Okanagan lodgepole pine seed orchards<br />
are now at the age where they require crown management<br />
activities. Lodgepole pine seed orchard 230 at Kalamalka<br />
was chosen for a pruning trial starting in 2004 because the<br />
trees were then at an age (12 to 15 years) and height (4 to<br />
6 m) at which crown management must be considered.<br />
This project is testing three levels of height control: control<br />
(no topping), moderate (3.5 to 4.0 m) and severe (2.5 to<br />
3.0 m), in addition to two levels of lateral pruning: tractor<br />
(remove only laterals extending into the row) and picker<br />
(remove extending and upper-crown laterals to improve<br />
crown access). We measured tree response to crownpruning<br />
treatments initially in 2004 and subsequently in<br />
2005 and <strong>2006</strong>.<br />
Seed Cone Number<br />
Seed Cone Number<br />
250<br />
200<br />
150<br />
100<br />
50<br />
0<br />
250<br />
200<br />
150<br />
100<br />
50<br />
0<br />
T R E E I M P R O V E M E N T P R O G R A M<br />
2004 2005 <strong>2006</strong><br />
P R O J E C T R E P O R T 2 0 0 6 / 2 0 0 7<br />
Results<br />
A complete analysis of all data is available in the final report<br />
for OTIP SPU 0720, distributed to all Pli orchardists. This<br />
report summarizes the data from 2004 to <strong>2006</strong> for cone<br />
counts (whole tree and branch counts) and seed yields (high<br />
and low crown, with and without insect protection).<br />
Cone counts<br />
Figures 41 and 42 show the mean whole-tree seed-cone<br />
counts for each of the three pruning blocks and for the<br />
levels of treatment in the three pruning blocks and two<br />
lateral-pruning sub-blocks. Cone counts dropped (Figure<br />
41) the first year after pruning (existing first-year cones<br />
removed in 2004) and substantially increased in <strong>2006</strong>.<br />
Note that because the <strong>2006</strong> cones were already formed<br />
in the remaining branches after pruning in the late fall of<br />
2004, we do not expect pruning regimes to affect these<br />
counts dramatically until <strong>2007</strong>. However, it is interesting<br />
to observe that cone counts for the moderate pruning level<br />
are the same as for the control block, and, as expected, cone<br />
counts in the severe block are substantially lower.<br />
Seed-cone counts also varied by levels of topping and<br />
lateral pruning (Figure 42). There were substantially more<br />
cones in the picker-access sub-blocks of both the control<br />
and moderate top-pruning blocks, but not in the severely<br />
pruned block. We observed this trend in 2004 and again in<br />
<strong>2006</strong>.<br />
Figure 43 shows the mean seed-cone counts for a major<br />
whorl branch in the upper and lower crown. As expected,<br />
there were two to three times more cones in the upper<br />
Con<br />
Mod<br />
Sev<br />
2004 2005 <strong>2006</strong><br />
F gure 1. Mean whole-tree seed-cone<br />
counts for each of the three prun ng blocks.<br />
Con Pick<br />
Con Tract<br />
Mod Pick<br />
Mod Tract<br />
Sev Pick<br />
Sev Tract<br />
F gure 2. Mean<br />
whole-tree seed-cone<br />
counts for treatments<br />
n prun ng blocks.<br />
7
crown. If crown pruning helps to re-invigorate the lower<br />
crown, then we may expect lower-crown cones to increase<br />
relative to the control block.<br />
Seed y elds<br />
Figures 44 and 45 show the mean total seed per cone<br />
(TSPC) and filled seed per cone (FSPC) for the three<br />
top-pruned blocks. TSPC and FSPC both declined in the<br />
year following pruning (2005) and increased slightly in<br />
<strong>2006</strong>. Although we would not expect pruning treatments<br />
to produce substantial differences in cone yields, there is a<br />
small, positive indication that yields in the moderate and<br />
severe pruning blocks were higher in <strong>2006</strong>. This result may<br />
indicate that re-invigorating the crowns by top-pruning<br />
improved seed set. We will closely follow this result in the<br />
next few years.<br />
Figures 46 and 47 show the FSPC data from the three<br />
top-pruned blocks by lateral-pruning (Figure 46) and by<br />
Seed Cone Number<br />
Total seed per Cone<br />
Filled Seed per Cone<br />
10<br />
8<br />
6<br />
4<br />
2<br />
0<br />
60<br />
50<br />
40<br />
30<br />
20<br />
10<br />
0<br />
50<br />
40<br />
30<br />
20<br />
10<br />
0<br />
T R E E I M P R O V E M E N T P R O G R A M<br />
2004 2005 <strong>2006</strong><br />
2004 2005 <strong>2006</strong><br />
2004 2005 <strong>2006</strong><br />
P R O J E C T R E P O R T 2 0 0 6 / 2 0 0 7<br />
crown height (Figure 47). Again, FSPC values were slightly<br />
better in the top-pruned blocks, but they were unaffected<br />
by lateral pruning. It is too early to determine if this is a<br />
trend or just a yearly variation. Again, subsequent years’<br />
observations will determine if this is a trend.<br />
Figure 47 shows the difference in seed yields by crown<br />
position. Yields were higher for upper-crown cones, but the<br />
magnitude of the difference was smaller for the moderate<br />
and severely pruned bocks. Again, this may indicate that<br />
lower crowns of top-pruned blocks are more vigorous.<br />
Finally, Figure 48 shows the differences in seed cone<br />
yields by insect protection for each of the three topping<br />
blocks. Although seed loss to insect predation is not<br />
necessarily associated with top-pruning treatments, this<br />
data clearly shows that seed losses in <strong>2006</strong> were in the order<br />
of 10 FSPC. In the two Kalamalka lodgepole pine seed<br />
orchards, insect damage in <strong>2006</strong> was among the highest<br />
ever recorded.<br />
Con<br />
Mod<br />
Sev<br />
Con High<br />
Con Low<br />
Mod High<br />
Mod Low<br />
Sev High<br />
Sev Low<br />
F gure 3. Mean seedcone<br />
counts for a<br />
major whorl branch n<br />
the upper and lower<br />
crown.<br />
F gure . Mean total seed per cone (TSPC).<br />
Con<br />
Mod F gure . F lled seed per cone (FSPC)<br />
Sev for the three top-pruned blocks.
Filled Seed per Cone<br />
Filled Seed per Cone<br />
Filled Seed per Cone<br />
60<br />
50<br />
40<br />
30<br />
20<br />
10<br />
0<br />
60<br />
50<br />
40<br />
30<br />
20<br />
10<br />
0<br />
50<br />
45<br />
40<br />
35<br />
30<br />
25<br />
20<br />
15<br />
10<br />
5<br />
0<br />
2004 2005 <strong>2006</strong><br />
2004 2005 <strong>2006</strong><br />
2004 2005 <strong>2006</strong><br />
.2.10 Western Hemlock/S tka Spruce<br />
Pollen Mon tor ng, Saan ch<br />
Pen nsula<br />
Joe Webber, ProSeed Consult ng<br />
Introduct on<br />
The Chief Forester (CF) Standards for Seed Use in British<br />
Columbia (<strong>2006</strong>) has established the legal requirements<br />
for the use of tree seed on Crown land. For orchard seed<br />
lots, this includes effective population size (Ne) and<br />
genetic worth (GW). Calculations for estimating a seed<br />
lot’s GW include female and male gamete contributions,<br />
including non-orchard sources of pollen (contamination).<br />
The CF Standard defines pollen contamination as “pollen,<br />
originating from a natural stand outside a seed orchard<br />
that contributes to the pollination of female cones on<br />
T R E E I M P R O V E M E N T P R O G R A M<br />
Con Pick<br />
Con Tract<br />
Mod Pick<br />
Mod Tract<br />
Sev Pick<br />
Sev Tract<br />
Con High<br />
Con Low<br />
Mod High<br />
Mod Low<br />
Sev High<br />
Sev Low<br />
Con Bag<br />
Con noBag<br />
Mod Bag<br />
Mod noBag<br />
Sev Bag<br />
Sev noBag<br />
P R O J E C T R E P O R T 2 0 0 6 / 2 0 0 7<br />
F gure 6. F lled seed per cone<br />
data from the three top-pruned<br />
blocks by lateral-prun ng.<br />
F gure 7. D fference n seed<br />
y elds by crown pos t on.<br />
F gure . D fferences n seed cone<br />
y elds by nsect protect on for<br />
each of the three topp ng blocks.<br />
parent trees in the orchard.” Appendix 4.2 (item 6) of the<br />
CF standard requires that the question of whether pollen<br />
contamination is present or not (Yes or No) be asked. If Yes,<br />
then item 7 requires that the proportion of contaminate<br />
pollen and the methodology used to calculate percent<br />
contamination be reported.<br />
Currently Woods (2005) lists only coastal Douglas-fir<br />
and lodgepole pine (Prince George) as orchard locations<br />
at risk from contamination. Woods (2005) suggests that<br />
other coastal species such as western hemlock, western<br />
redcedar, and Sitka spruce may also be at risk, and as data<br />
are provided, one or more of these species may be added to<br />
the list of coastal species at significant risk.<br />
This report summarizes the extent (duration of pollen<br />
flight) and magnitude (pollen cloud density) of western<br />
hemlock and Sitka spruce pollen flight on the Saanich<br />
peninsula for the pollination period of <strong>2006</strong> and compares<br />
this data to the pollen flight data collected in 2005. A<br />
9
complete report on pollen capture at all five stations for Hw<br />
and Ss for <strong>2006</strong> is available for project SPU 0313 (<strong>2006</strong>)<br />
from the OTIP coordinator.<br />
Methods<br />
The ministry standard for monitoring pollen cloud<br />
density uses seven-day recorders (see Webber and Painter<br />
1996) mounted on rotating platforms at 3 m height.<br />
Daily pollen catch was expressed as the number of pollen<br />
grains per mm 2 . Five pollen monitoring stations were<br />
used in the Saanich peninsula, which correspond to the<br />
same stations used by the Ministry of Forests and Range,<br />
<strong>Tree</strong> <strong>Improvement</strong> Branch, for their annual regional<br />
pollen monitoring of coastal Douglas-fir pollen. Bruce<br />
MacPherson (MoF Coastal Seed Orchards) was responsible<br />
for maintaining the five Saanich peninsula monitoring<br />
stations (erecting monitors, changing charts).<br />
We counted two replicates on each chart for a 24-hour<br />
period and averaged the total number of pollen grains for<br />
the two replicates. To determine the pollen cloud density,<br />
we then divided the average daily counts by 44 mm 2<br />
to represent the number of pollen grains per mm 2 for a<br />
24-hour period. We also compared results for regional<br />
monitoring of western hemlock and Sitka spruce pollen<br />
flight with the receptivity periods and pollen cloud density<br />
values monitored at the Western Forest Products (WFP)<br />
Saanich seed orchard site (Hw orchard 170 and Ss<br />
orchard 172).<br />
Results<br />
Figure 49 shows the daily western hemlock pollen cloud<br />
density values averaged over the five Saanich peninsula<br />
stations. Figure 50 shows the daily Sitka spruce pollen<br />
cloud density values averaged over the same five stations.<br />
In <strong>2006</strong>, the mean western hemlock pollen shed on the<br />
Saanich peninsula ranged from March 24 to April 30. The<br />
period of Sitka spruce pollen shed was April 14 to April 30<br />
(the end of regional monitoring, although WFP orchard<br />
172 continued to shed for one more week). Table 17 shows<br />
the total pollen load for western hemlock and Sitka spruce<br />
in years 2005 and <strong>2006</strong>. Pollen load represents the daily<br />
pollen cloud density summed over the monitoring period.<br />
Compared to 2005, pollen capture for the western hemlock<br />
and Sitka spruce was about 20 percent and 50 percent<br />
lower, respectively, than in 2005.<br />
The total regional pollen load (mean for all five stations)<br />
for western hemlock and Sitka spruce for the six-week<br />
monitoring period was 9.2 and 1.9 and 1.6 and 0.8 pollen<br />
0<br />
T R E E I M P R O V E M E N T P R O G R A M<br />
P R O J E C T R E P O R T 2 0 0 6 / 2 0 0 7<br />
grains/mm 2 for each of 2005 and <strong>2006</strong>, respectively.<br />
Although the corresponding values for pollen load<br />
for the receptivity period of WFP orchards 170 and 172<br />
are not strictly comparable (slide counts versus seven-day<br />
recorder counts), we can still estimate potential western<br />
hemlock pollen contamination from slide counts taken<br />
within the orchard and regional counts from the Saanich<br />
peninsula. Table 18 shows the pollen load (mean for all five<br />
stations) from regional counts during the receptivity period<br />
2005 and <strong>2006</strong>.<br />
The corresponding pollen load values (regional) for<br />
western hemlock and Sitka spruce were 1.3 and 1.0 and<br />
0.3 and 0.7 grains/mm 2 , respectively. Table 19 shows the<br />
corresponding values for pollen load (orchard) summed<br />
over the receptivity period of western hemlock orchard 170<br />
and Sitka spruce orchard 172 (slides).<br />
According to Woods et al (1996), regional pollen<br />
capture for the receptivity period of the orchard is adjusted<br />
for the differences in capture efficiency between the regional<br />
monitors (seven-day) and the orchard monitors (slides).<br />
The orchard adjustment factor (OAF) is determined by<br />
averaging the ratio of daily pollen capture of the orchard<br />
slides to the regional seven-day monitors. Thus, by<br />
averaging the early orchard pollen capture (EOA) to the<br />
early regional average (ERA) for a period of seven to ten<br />
days (prior to orchard pollen flight), a factor is calculated<br />
that can be applied to the regional counts for the orchard<br />
receptivity period. However, in practice the calculation of<br />
the OAF has been inconsistent. Often there are not enough<br />
days prior to orchard shed to give a reliable result (regional<br />
shed and orchard receptivity period overlap). Because<br />
of this, the OAF was not considered in the following<br />
calculations of percent contamination. Table 20 shows<br />
the estimate of percent contamination for both western<br />
hemlock and Sitka spruce using only the regional pollen<br />
counts and orchard counts.<br />
Conclus on<br />
For both 2005 and <strong>2006</strong>, the pollen counts for western<br />
hemlock were lower than those observed for Douglasfir<br />
and significantly lower for Sitka spruce. For example,<br />
regional pollen loads for the six-week monitoring period<br />
for Douglas-fir in 2005 and <strong>2006</strong> was 18.3 and 15.0<br />
grains/mm 2 , respectively. This corresponded to an estimate<br />
of percent contamination (no OAF) of 4.8 and 12.3,<br />
respectively. The estimates of contamination based on<br />
pollen monitoring have also been confirmed in Douglasfir<br />
with DNA paternity analyses. For the two years of
2005 and <strong>2006</strong>, the corresponding values for percent<br />
contamination were 9.7 and 11.7. These are in close<br />
agreement with pollen monitoring data.<br />
Since pollen monitoring data can give a good estimate<br />
of contamination, we can infer that contamination in<br />
western hemlock orchards on the Saanich peninsula does<br />
occur and that the value of contamination for 2005 and<br />
<strong>2006</strong> could be in the 10 to 20 percent range. With this<br />
limited data, we cannot predict if future contaminate pollen<br />
clouds will be greater. Certainly we can expect that orchard<br />
pollen clouds will be greater as the orchard trees mature.<br />
It is more difficult to infer the same for Sitka spruce.<br />
Because the number of pollen grains captured is so small,<br />
the error in the estimate is much higher. Furthermore, we<br />
do not anticipate that the regional pollen cloud density for<br />
Sitka spruce will be any greater than what we have observed<br />
in 2005 and <strong>2006</strong> (local population is so small), but we can<br />
anticipate that the orchard pollen cloud for Sitka spruce<br />
will increase as the orchard matures. Because of this, we<br />
may consider that contamination is not an issue for Sitka<br />
spruce orchards on the Saanich peninsula.<br />
pollen grains/mm<br />
0.5<br />
0.4<br />
0.3<br />
0.2<br />
0.1<br />
0.0<br />
T R E E I M P R O V E M E N T P R O G R A M<br />
Figure 1: Mean daily western hemlock pollen cloud density values (pollen grains/mm 2/24hours)<br />
for five Saanich peninsula monitoring stations (<strong>2006</strong>). Black data points represents the receptivity<br />
period of WFP Hw orchard 170.<br />
Hw Mean All Stations <strong>2006</strong><br />
Apr-12<br />
Apr-10<br />
Apr-08<br />
Apr-06<br />
Apr-04<br />
Apr-02<br />
Mar-31<br />
Mar-29<br />
Mar-27<br />
Mar-25<br />
Mar-23<br />
Mar-21<br />
P R O J E C T R E P O R T 2 0 0 6 / 2 0 0 7<br />
L terature C ted<br />
Snetsinger, J. <strong>2006</strong>. Chief Forester’s Standards for Seed Use.<br />
BC Ministry of Forests and Range, Victoria, BC.<br />
Stoehr, M., Webber, J., and Woods, J. 2004. Protocol<br />
for rating seed orchard seed lots in British Columbia:<br />
quantifying genetic gain and diversity. For. 77:297-303.<br />
Webber, J.E., and Painter, R.A. 1996. Douglas-fir pollen<br />
management manual. 2nd Edn. Ministry of Forests and<br />
Range, Research Branch. Work. Pap. 02/1996. 91pp.<br />
Woods, J.H., Stoehr, M.U., and Webber, J.E. 1996.<br />
Protocols for rating seed orchard seed lots in British<br />
Columbia. Ministry of Forests and Range, Research<br />
<strong>Program</strong>, Res. <strong>Report</strong> 06. 26pp.<br />
Woods, J. 2005. Methods for estimating gamete<br />
contributions to orchard seed crops and vegetative lots<br />
in British Columbia. BC Min. For. Range, Res. Br.,<br />
Victoria, B.C. Tech. Rep. 025. 17pp.<br />
Apr-30<br />
Apr-28<br />
Apr-26<br />
Apr-24<br />
Apr-22<br />
Apr-20<br />
Apr-18<br />
Apr-16<br />
Apr-14<br />
F gure 9. Mean da ly western hemlock pollen cloud dens ty values (pollen<br />
gra ns/mm 2 /2 hours) for five Saan ch pen nsula mon tor ng stat ons (<strong>2006</strong>).<br />
Black data po nts represents the recept v ty per od of WFP Hw orchard 170.<br />
pollen grains/mm<br />
0.40<br />
0.30<br />
0.20<br />
0.10<br />
0.00<br />
Figure 2: Mean daily Sitka spruce pollen cloud density values (pollen grains/mm 2 /24hours)<br />
for five Saanich peninsula monitoring stations (<strong>2006</strong>). Black data points the receptivity<br />
period of WFP Ss orchard 172.<br />
Ss Mean All Stations <strong>2006</strong><br />
Apr-12<br />
Apr-10<br />
Apr-08<br />
Apr-06<br />
Apr-04<br />
Apr-02<br />
Mar-31<br />
Mar-29<br />
Mar-27<br />
Mar-25<br />
Mar-23<br />
Mar-21<br />
Apr-30<br />
Apr-28<br />
Apr-26<br />
Apr-24<br />
Apr-22<br />
Apr-20<br />
Apr-18<br />
Apr-16<br />
Apr-14<br />
F gure 0. Mean da ly S tka spruce pollen cloud dens ty values (pollen gra ns/<br />
mm 2 /2 hours) for five Saan ch pen nsula mon tor ng stat ons (<strong>2006</strong>). Black data<br />
po nts represents the recept v ty per od of WFP Ss orchard 172.<br />
1
2<br />
Table 1: Mean pollen load (regional) T R E E I M P R O V E M E N T P R O G R A M<br />
for western hemlock and Sitka spruce,<br />
expressed as grains/mm2 Table 2: Mean pollen load (regional)<br />
for western hemlock and Sitka spruce,<br />
expressed as grains/mm<br />
, for a 6 week<br />
monitoring period (2005 and <strong>2006</strong>).<br />
2 Table 3: Mean pollen load (orchard)<br />
for western hemlock and Sitka spruce,<br />
, for the expressed as grains/mm<br />
receptivity period of orchards 170 and<br />
172, respectively (2005 and <strong>2006</strong>).<br />
2 , for the<br />
receptivity period of orchards 170 and<br />
172, respectively (2005 and <strong>2006</strong>).<br />
6 Week Pollen Capture<br />
Pollen Load (grains/mm 2 )<br />
2005 <strong>2006</strong><br />
Hw 9.2 1.9<br />
Ss 1.6 0.8<br />
Table 17. Mean pollen load<br />
(reg onal) for western hemlock<br />
and S tka spruce, expressed<br />
as gra ns/mm 2 , for a 6 week<br />
mon tor ng per od (220 and<br />
<strong>2006</strong>).<br />
Pollen Load (grains/mm 2 )<br />
2005 <strong>2006</strong><br />
Hw 1.3 1.0<br />
Ss 0.3 0.7<br />
Table 1 . Mean pollen load<br />
(reg onal) for western hemlock<br />
Table and S4: tka Estimates spruce, expressed of % contamination as<br />
for Western Forest Products western<br />
gra ns/mm<br />
hemlock orchard (170) and Sitka spruce<br />
orchard (172) based on the ratio of<br />
regional counts to orchard counts for<br />
the receptivity periods in each of 2005<br />
and <strong>2006</strong>.<br />
2 , for the recept v ty<br />
per od of orchards 170 and 172,<br />
respect vely (200 and <strong>2006</strong>).<br />
Estimated Level of % Contamination<br />
2005 <strong>2006</strong><br />
Hw 18.6 16.7<br />
Ss 30.0 38.9<br />
.2.11 Enhanc ng Lower Crown V gour<br />
and Cone Product on n Mature<br />
Lodgepole P ne Seed Orchards<br />
Joe Webber and M chael Stoehr<br />
Introduct on<br />
Over the past few years, cone production in larger<br />
lodgepole pine seed orchard trees has dropped. This is<br />
largely due to fewer cones being produced in the mid to<br />
lower crown where we suspect lower shoot vigour is not<br />
supporting seed cone production. Furthermore, the growth<br />
demands of lower crown shoots (especially where shaded)<br />
may also be drawing valuable resources for optimal cone<br />
development in the upper crown as well. One opportunity<br />
to increase coning response is by topping (see OTIP 0720),<br />
which brings more light and nutrients to the lower crown.<br />
However, associated with topping is lower cone production<br />
for three to five years. It may also be possible to reinvigorate<br />
lower crowns by fertilizer treatments.<br />
Table 20. Est mates of %<br />
contam nat on of Western Forest<br />
Products western hemlock orchard<br />
(170) and S tka spruce orchard (172)<br />
based on the rat o of reg onal counts<br />
to orchard counts for the recept v ty<br />
per ods n each of 200 and <strong>2006</strong>).<br />
P R O J E C T R E P O R T 2 0 0 6 / 2 0 0 7<br />
WFP Receptivity Period (Orchard 1)<br />
Pollen Load (grains/mm 2 )<br />
2005 <strong>2006</strong><br />
Hw 7.0 6.0<br />
Ss 1.0 1.8<br />
Table 19. Mean pollen load<br />
(orchard) for western hemlock and<br />
S tka spruce, expressed as gra ns/<br />
mm 2 , for the recept v ty per od of<br />
orchards 170 and 172, respect vely<br />
(200 and <strong>2006</strong>).<br />
The objective of this project is to apply larger amounts<br />
of fertilizer (than annual maintenance applications) in an<br />
attempt to increase the lower crown shoot/foliar levels of<br />
nutrients. Fertilizer will be applied one to two months<br />
before the period of cone differentiation (September), and<br />
response will be measured by shoot/foliar analysis in the<br />
fall (October). Response will also be measured on first-year<br />
cone numbers and seed yields sampled in the fall of <strong>2007</strong>.<br />
Procedures<br />
Fertilizer as a flower induction technique in lodgepole pine<br />
seed orchards has principally been studied under the cooler<br />
climate of Prince George. Results from trials established<br />
by Ebell (1990, MFR, Branch Working Plan EP 1071.03)<br />
show that flowering response to heavy doses (200-400<br />
ka/ha) of NH 4 NO 3 can lead to increased flowering, but the<br />
response is not consistent. In general, the trees treated in<br />
Prince George were smaller and more open grown. For our<br />
north Okanagan seed orchards, mature trees are densely<br />
spaced, and lower crown shading may limit nutrient status<br />
and, therefore, shoot vigour if, as Ebell suggests, coning
esponse to NH 4 NO 3 acts through nutritional effects rather<br />
than directly affecting cone induction.<br />
Assuming that fertilizer does lead to improved coning<br />
response by improving the nutritional status of shoots, then<br />
it seems reasonable to assume that heavier doses of fertilizer<br />
could also improve the nutritional status of lower crown<br />
shoots in mature seed orchard trees. Under the natural<br />
inductive environment of the north Okanagan, this effect<br />
will lead to a higher coning response.<br />
To test this hypothesis, we completed the following:<br />
1. solicited the advice of Dr. Bob van den Driessche<br />
(retired research scientist and tree nutritional expert) to<br />
review the problem and make recommendations for the<br />
best fertilizer regime, the amount to apply, and the time<br />
to apply it.<br />
2. established two fertilizer trials in the MFR, Kalamalka<br />
Seed orchard 307 and the Tolko Industry Ltd, Eagle<br />
Rock Seed orchard 310 (see maps Appendix I). In June<br />
<strong>2006</strong>, two reps of each of three five-tree blocks for each<br />
of two application times (12 blocks) were selected in<br />
each of the two orchards. The three fertilizer treatments<br />
were control; NO 3 NH 4 , and a combination of fertilizers<br />
(NPK+sulphur+micros) formulated for the objectives of<br />
this experiment.<br />
3. applied fertilizer on June 28 (early) and August 31<br />
(late). The specific fertilizer formulation is shown in<br />
Table 21.<br />
4. in October, collected lower crown shoots from each<br />
of the two row sides. Shoot samples from each of 60<br />
trees and two orchards (120 in total) were shipped to<br />
the Kalamalka Seed orchards for washing and drying.<br />
Table 1<br />
T R E E I M P R O V E M E N T P R O G R A M<br />
Rate Amount per tree* per plot<br />
Fertilizer Kg/Ha Kg/Ha Kg Kg<br />
Nitrogen (NH 4NO 3) alone 100 303 0.7575 3.7875<br />
Combination<br />
N 100 303 0.7575 3.7875<br />
P 50 255 0.6375 3.1875<br />
K 50 122 0.305 1.525<br />
Ca 20 50 0.125 0.625<br />
Mg/S 10/13 50 0.125 0.625<br />
Micronutrients added to combination at 1%<br />
*note: amount per tree based on a tree spacing of 5x5m=25m<br />
P R O J E C T R E P O R T 2 0 0 6 / 2 0 0 7<br />
Dry shoot material was shipped to the Research Branch<br />
Laboratory, where nutrient analyses were completed on<br />
each of the shoot and foliage tissues.<br />
Results<br />
A summary of the mean nutrient analysis and details of<br />
fertilizer effects are available in the final report for OTIP<br />
project 4057E23 on file with the OTIP coordinator. The<br />
following is a summary of a report by Dr. R. van den<br />
Driessche (New Dendrology Inc.).<br />
Fertilizer types and time of application were both<br />
shown to affect N and S concentrations in needles at<br />
Kalamalka seed orchards. Needle concentrations of N, were<br />
higher than stem concentration at Eagle Rock, but both<br />
N and S were similar in stems and needles at Kalamalka.<br />
Potassium, Ca, and Mg did not differ much between<br />
needles and stems, but P concentration was higher in<br />
stems than in needles. Fertilization reduced needle N and<br />
S concentrations compared with control at Kalamalka, but<br />
had no effect on needle N at Eagle Rock. At Eagle Rock,<br />
needle P concentration was increased by fertilization,<br />
although only the complete fertilizer increased stem P%.<br />
The NH 4 NO 3 fertilizer may have increased the<br />
concentration of stem S (measured by combustion) at<br />
Kalamalka. Fertilizer interacted with time of application for<br />
stem N and S at Eagle Rock. Stem S showed an interaction<br />
between fertilizer and application time at Eagle Rock, in<br />
which values were higher in control at time 1 and NH 4 NO 3<br />
at time 2 (both values about 0.13), but all other treatments<br />
were about 0.11.<br />
Stem P concentrations were lower (about 0.17)<br />
at Eagle Rock than at Kalamalka (about 0.19), and<br />
although NH 4 NO 3 fertilization had no effect on stem P<br />
Total 1.95 9.75<br />
Table 21.<br />
Fert l zer<br />
formulat on.<br />
3
concentration, the complete fertilizer increased stem P at<br />
Eagle Rock.<br />
Slight to moderate N deficiency in lodgepole pine is<br />
shown by needle N concentrations of 1.15-1.35. Hence<br />
the control N concentrations at Kalamalka (1.65%) and<br />
Eagle Rock (1.42%) do not indicate N deficiency. Needle P<br />
was a little lower at Eagle Rock than at Kalamalka and was<br />
increased by fertilization, but the values do not indicate a<br />
serious deficiency.<br />
Leaf S values ranged from 0.088 to 0.098%. At<br />
Kalamalka the control averaged 0.120 but dropped with<br />
fertilization to as low as 0.099. At Eagle Rock the value<br />
averaged 0.130, so neither Kalamalka or Eagle Rock<br />
showed S deficiency. However, the ratio of N:S is thought<br />
to be about 15 under optimal nutrition. While the N:S<br />
ratio at Kalamalka was about 15, it was driven down by<br />
the complete fertilizer. At Eagle Rock the N:S ratio was<br />
uniformly below the optimum (15), which suggests that<br />
there is insufficient S uptake to balance N and that remedial<br />
treatment should be considered.<br />
The present experiment was designed to compare the<br />
effect of N alone with a complete fertilizer. The N source<br />
(NH 4 NO 3 ) was the same in both fertilizers. The rate of N<br />
application was 150 kg ha 1 and will be re-applied in the<br />
second year of treatment (<strong>2007</strong>). The quantity of S in the<br />
complete fertilizer will be increased so that 50 kg S will<br />
be applied. This will be done by increasing the amounts<br />
of potassium sulphate (0-0-50) and magnesium sulphate<br />
(MgSO 4 anhyd.).<br />
.2.12 The Effect of Seed Orchard<br />
Locat on on Progeny<br />
Performance: Seed Orchard<br />
After-effects (SPU 1 22)<br />
Joe Webber and Barry Jaqu sh<br />
Introduct on<br />
Over the past 10 years, research results have shown that<br />
the parental environment can affect progeny performance.<br />
In a seed orchard context, after-effects is the term used to<br />
describe the differential response of progeny derived from<br />
parent trees selected in the north (or high elevation), and<br />
propagated and cultured in the south (or low elevation).<br />
T R E E I M P R O V E M E N T P R O G R A M<br />
P R O J E C T R E P O R T 2 0 0 6 / 2 0 0 7<br />
When compared with their northern counterparts, progeny<br />
produced from southern seed orchards showed delayed<br />
de-hardening and bud flush in the spring, delayed growth<br />
cessation during the summer, and delayed frost hardiness<br />
development in the fall (see Stoehr et al. 1998 and Webber<br />
et al. 2005 for reviews 1 ).<br />
The effect appears to act only through maternal, and<br />
not paternal, reproductive development. Seed orchard<br />
after-effects may have an important biological significance,<br />
but are they operationally significant? The Prince George<br />
plantation was established to assess the operational<br />
significance of after-effects and answer the question: does<br />
progeny derived from seed produced in Vernon meet<br />
expected performance for growth and adaptive response in<br />
Prince George?<br />
In British Columbia, interior spruce orchards are<br />
established in more southerly, drier, and warmer locations<br />
(Vernon), but progeny from these orchards can be deployed<br />
considerably further north (Prince George). Temperature<br />
differences between Vernon and Prince George may affect<br />
frost tolerance (Webber et al 2005) and growth traits<br />
(height growth; bud burst).<br />
Since photoperiod during reproductive development<br />
in Vernon is shorter (neutral) than in Prince George (long<br />
day), experience with seed after-effects in Norway spruce<br />
suggest that progeny from Kalamalka may flush later and<br />
set buds later than their northern counterparts. The two<br />
plantations at Prince George offer an extensively designed<br />
experiment to determine if photoperiod after-effects occur<br />
in progeny from two distinctly different seed production<br />
areas (Prince George and Vernon). Plantation survival and<br />
height growth were determined after the first year (2001).<br />
This report summarizes data collected in <strong>2006</strong> for bud<br />
burst and height growth at two Prince George plantations.<br />
Procedures<br />
The experimental design, crossing scheme, and nursery<br />
aspects of this project were completed over a period of 1996<br />
1 Stoehr, M.U., L’Hirondelle, S.J., Binder, W.D. and<br />
Webber, J.E. 1998. Parental environment after-effects<br />
on germination, growth, and adaptive traits in selected<br />
white spruce families. Can. J. For. Res. 28:418-426.<br />
Webber, J., Ott, P., Owens, J., and Binder, W. 2005.<br />
Elevated temperature during reproductive development<br />
affects cone traits and progeny performance in Picea<br />
glauca x engelmannii complex. <strong>Tree</strong> Phys. 25:1219-1227.
to 2000. Crosses were completed at Kalamalka breeding<br />
arboretum (KAL) in 1996 and at the Prince George<br />
arboretum in 1999. Sowing was done in March 2000 at<br />
the Skimikin Nursery, and seedlings were lifted by family<br />
and pre-designated planting design in November 2000.<br />
Plantations in Prince George(PG), one at the Prince George<br />
<strong>Tree</strong> <strong>Improvement</strong> Station (PGTIS), and the other one 30<br />
km east of PG (Wansa Creek), were established in 2001.<br />
Because we wanted to assess both male and female<br />
effects (20 each) but could not deal with a full factorial<br />
(400 crosses), we grouped the crosses into sets (five) in<br />
which four females were completely crossed with four<br />
males. All KAL crosses were completed (80 in total), but we<br />
missed two clones at PG (78). The crosses included north<br />
pollen on north females, south pollen on south females, and<br />
the two reciprocals (south on north and north on south). In<br />
setting out the field design, we used six row-tree plots and<br />
arranged the specific male x female crosses into small subblocks.<br />
We also arranged the S/S, N/N, S/N, N/S crosses<br />
for the same parents in the same place in each of four rows.<br />
Because the PG crosses were made three years after the KAL<br />
crosses (1996), we also collected OP cones from both PG<br />
and KAL in the year the crosses were made at PG (1999).<br />
Each block at Wansa creek and PGTIS are exactly the<br />
same design. Each site has five sets of identical female<br />
x male crosses completely crossed with each other (four<br />
females x four males for a total of 16 crosses/set or a total<br />
of 80 crosses per site). Each of the 16 crosses also had four<br />
parent sources (i.e., north mother x north father, south<br />
mother x south father, and the two reciprocals) for a total<br />
of 320 families per site. We planted 30 seedlings for each<br />
family as six tree-row plots in each of five blocks per site.<br />
As a result, each block had a total of 1,920 seedlings. We<br />
also planted out six OP seedlings for each of the 20 female<br />
parent trees per site (20 N/N and 20 S/S) for a total of 240<br />
seedlings per site. Thus, there are a total of 2,160 seedlings<br />
per block and a total of 10,800 seedlings per site.<br />
In the fall of 2001, we measured both first- (2000) and<br />
second-year heights (2001). Because the winter of 00/01<br />
was harsher than normal, especially at the more exposed<br />
PGTIS plantation, we also assessed winter damage.<br />
The PGTIS and WANSA plantations completed their<br />
seven-year growth in <strong>2006</strong>. The stock is about one meter<br />
tall. To determine if photoperiod differences between<br />
Prince George and Vernon affect bud flush and growth, we<br />
randomly selected four specific female x male crosses per<br />
set (a total of 20 crosses per site) including the four parent<br />
sources combination for a total of 80 crosses (80 crosses<br />
T R E E I M P R O V E M E N T P R O G R A M<br />
P R O J E C T R E P O R T 2 0 0 6 / 2 0 0 7<br />
x 6 seedlings/cross or 480 seedlings per block). Bud flush<br />
was scored categorically on each of four days. Bud flush<br />
was defined as the date when the terminal bud on any of<br />
the first-order lateral shoots burst its scales. The same 20<br />
families and 80 crosses were surveyed in each of the five<br />
blocks (2,400 seedlings) on each of the two Prince George<br />
plantation sites (a total of 4,800 seedlings). At the end of<br />
the growing season, we recorded height growth for all the<br />
stock in both the WANSA and PGTIS plantations (about<br />
20,000 seedlings).<br />
RESULTS<br />
F rst-year performance (2001)<br />
Height growth<br />
Stock was grown at (Skimikin) in 2000 and plantations<br />
were established in the spring of 2000. Fall height<br />
measurements were recorded for the first- and second-year<br />
heights. Figures 51 and 52 show the mean height growth<br />
(cm) for each of the four female x male sources. Note<br />
standard error bars are so small (+/-0.1 cm) that they do not<br />
show up in the figures).<br />
Damage assessment (2001)<br />
As we took height measurements, we assessed winter<br />
(00/01) damage. Table 22 shows the coding and number<br />
of seedlings for each class of damage for the combined<br />
assessment of both the PGTIS and WANSA plantations.<br />
Figure 53 (WANSA) and Figure 54 (PGTIS) summarize<br />
the same data graphically. In general, seedling damage to<br />
progeny from PG (PG x PG) was about 10 percent less<br />
than that from progeny from Vernon (KAL x KAL), with<br />
the damage scores for the reciprocals falling between the<br />
two.<br />
Seventh-year he ght and phenology<br />
Bud burst (PGTIS Plantation)<br />
Delayed bud flush is one of the physiological traits observed<br />
for progeny from southern seed orchards compared to their<br />
northern counterparts. Because a delay in bud flush could<br />
explain differences in growth and frost hardiness, bud flush<br />
(Julian Date) was scored for a sample of identical progeny<br />
from each of the four parent sources (i.e., KAL x KAL, KAL<br />
x PG, PG x KAL and PG x PG). Figures 55 and 56 show<br />
the Julian Date for bud burst of subtending lateral shoots.<br />
There was no difference in bud flush for progeny from<br />
each of the four parent sources.
Height growth<br />
Figures 57 and 58 show the mean height growth (cm) for<br />
all progeny from each of the four parent sources. At the<br />
WANSA site (Figure 57), the PG x PG source grew tallest:<br />
the difference was less than 1 cm compared to the KAL x<br />
KAL source. Growth at PGTIS was significantly less (111<br />
cm compared to 85) with the PG x PG source also growing<br />
tallest, but again the difference compared to the KAL x<br />
KAL source was about 1 cm.<br />
The reciprocals were slightly shorter. PG females<br />
crossed with KAL males grew the shortest at WANSA,<br />
while at PGTIS, the KAL females crossed with PG males<br />
grew the least. While these differences may have biological<br />
significance, they are not sufficient to change our current<br />
deployment Figure strategy. 1: First- and second-year heights for the seed orchard<br />
aftereffects plantation (PGTIS)<br />
Height (cm)<br />
Height (cm)<br />
Percent<br />
6<br />
45<br />
40<br />
35<br />
30<br />
25<br />
20<br />
15<br />
45<br />
40<br />
35<br />
30<br />
25<br />
20<br />
15<br />
40<br />
35<br />
30<br />
25<br />
20<br />
15<br />
10<br />
5<br />
0<br />
KALxKAL K ALxPG PGxKA L PGxPG<br />
Figure 2: First- and second-year Female x heights Male Source for the seed orchard<br />
aftereffects plantation (WANSA)<br />
T R E E I M P R O V E M E N T P R O G R A M<br />
KALxKAL KALxPG PGxKAL PGxPG<br />
Figure 3: Percent seedling Female damage x Male at Source the WANSA plantation after<br />
the first winter by damage class and female x male parent source<br />
KALxKA L KALxPG PGxKAL PGxPG<br />
Female x Male Source<br />
2000<br />
2001<br />
2000<br />
2001<br />
none<br />
50%<br />
dead<br />
P R O J E C T R E P O R T 2 0 0 6 / 2 0 0 7<br />
Conclus on<br />
While the progeny from Vernon suffered more damage the<br />
first year after planting, parent source had little effect six<br />
years later on height. Our objective for this project was to<br />
determine if parent source affected bud burst and/or height<br />
growth. Data collected in <strong>2006</strong> suggest that growth may<br />
be slightly different depending on parent source. While<br />
this may have biological significance, it does not have any<br />
operational significance. This data also suggest that orchard<br />
seed from the north Okanagan is as well adapted to Prince<br />
George planting sites as seed from Prince George.<br />
F gure 1. F rst- and second- year he ghts for the<br />
seed orchard aftereffects plantat on (PGTIS).<br />
F gure 2. F rst- and second- year he ghts for the<br />
seed orchard aftereffects plantat on (WANSA).<br />
F gure 3. Percent seedl ng damage at the WANSA<br />
plantat on after the first w nter by damage class and<br />
female x male parent source.
Percent<br />
Julian Date<br />
Julian Date<br />
Height (cm)<br />
Height (cm)<br />
40<br />
35<br />
30<br />
25<br />
20<br />
15<br />
10<br />
5<br />
0<br />
150<br />
148<br />
146<br />
144<br />
142<br />
140<br />
148<br />
146<br />
144<br />
142<br />
140<br />
138<br />
115<br />
113<br />
111<br />
109<br />
107<br />
105<br />
88<br />
86<br />
84<br />
82<br />
80<br />
78<br />
T R E E I M P R O V E M E N T P R O G R A M<br />
Figure 4: Percent seedling damage at the PGTIS plantation after the<br />
first winter by damage class and female x male parent source<br />
KALxKAL K ALxPG PGxKAL PGxPG<br />
none<br />
50%<br />
dead<br />
Figure 5: Mean (±standard Female errors) x Male Julian Source date of bud burst for the WANSA<br />
plantation for each of the four female x male parent sources.<br />
KALxKA L KALxPG PGxKAL PGxPG<br />
Figure 6: Mean (±standard<br />
Female<br />
errors) Julian<br />
x Male<br />
date<br />
Source<br />
of bud burst for the PGTIS<br />
plantation for each of the four female x male parent sources.<br />
KALxKA L KALxPG P GxK AL P GxP G<br />
Female x Male Source<br />
Figure 7: Mean (±standard errors) height growth (cm) for the WANSA plantation<br />
for each of the four female x male parent sources.<br />
Mean Seven Year Heights (WANSA Plantation)<br />
KALxKA L KALxPG P GxK AL P GxP G<br />
Female x Male Source<br />
Figure 8: Mean (±standard errors) height growth (cm) for the PGTIS plantation<br />
for each of the four female x male parent sources.<br />
Mean Seven Year Heights (PGTIS Plantation)<br />
KALxKAL KALxPG PGxK AL PGxPG<br />
Female x Male Source<br />
P R O J E C T R E P O R T 2 0 0 6 / 2 0 0 7<br />
F gure . Percent seedl ng damage at the PGTIS<br />
plantat on after the first w nter by damage class and<br />
female x male parent source.<br />
F gure . Mean (± standard errors) Jul an date of<br />
bud burst for the WANSA plantat on for each of the<br />
four female x male parent sources.<br />
F gure 6. Mean (± standard errors) Jul an date of<br />
bud burst for the PGTIS plantat on for each of the<br />
four female x male parent sources.<br />
F gure 7. Mean (± standard errors) he ght growth<br />
(cm) for the WANSA plantat on for each of the four<br />
female x male parent sources.<br />
F gure . Mean (± standard errors) he ght growth<br />
(cm) for the WANSA plantat on for each of the four<br />
female x male parent sources.<br />
7
T R E E I M P R O V E M E N T P R O G R A M<br />
Table 1: Percent seedling damage after the first winter by damage class and female<br />
x male parent source.<br />
Number of Seedlings and % Damage by Class and Parent Source<br />
Damage Number of Female/Male Parent Source<br />
WANSA Class Seedlings KAL/KAL KAL/PG PG/KAL PG/PG<br />
none 8400 29.1 24.3 25.8 20.9<br />
50% 180 36.1 24.4 16.7 22.8<br />
dead 232 30.6 19.4 28.9 21.1<br />
PGTIS KAL/KAL KAL/PG PG/KAL PG/PG<br />
none 1086 29.1 24.5 25.2 21.2<br />
50% 2803 31.0 24.2 22.9 22.0<br />
dead 43 25.6 20.9 34.8 18.6<br />
.2.13 Development of Pollen Qual ty<br />
Gu del nes for Poll nat ons n<br />
Western Redcedar<br />
Seed Orchards. (SPU 0213)<br />
Oldr ch Hak<br />
The objective of this project is to develop pollen quality<br />
guidelines based on the relationship between pollen quality<br />
(viability) and the percentage of filled seed produced.<br />
Pollen collection, processing, and storage are required<br />
for control and supplemental mass pollinations in western<br />
redcedar seed orchards. Because of its small size and limited<br />
food reserves, western redcedar pollen is exceptionally<br />
susceptible to damage from premature pollen collection,<br />
adverse temperature, and humidity conditions during<br />
processing, and adverse storage conditions. As a result, there<br />
is a wide range in pollen quality among various collections<br />
used for pollination.<br />
Establishing a relationship between pollen viability<br />
and the percentage of viable seed produced will resolve the<br />
question of the levels of pollen quality (i.e., % of pollen<br />
viability) at which unacceptable numbers of filled seed is<br />
produced (i.e., when the percentage of filled seed is zero or<br />
very low).<br />
The study was established at the Cowichan Lake<br />
Research Station and at the Mount Newton Seed Orchard<br />
P R O J E C T R E P O R T 2 0 0 6 / 2 0 0 7<br />
Table 22. Percent seedl ng damage after<br />
the first w nter by damage class and<br />
female x male parent source.<br />
in Saanichton (Timber West). Stored and freshly collected<br />
pollen will be tested for viability using solid media<br />
germination technique.<br />
In the first year, approximately 50 pollen lots with<br />
various levels of viability, ranging from 0% to 90%, will be<br />
used to control pollinate female flowers. Each pollen lot will<br />
be tested on two different clones with two control crosses<br />
per clone to a total of 200 control crosses. Approximately<br />
40 trees (clones) will be needed for the control pollinations<br />
because several different crosses can be done on each<br />
tree. Male cones will be picked away from females on<br />
selected branches, and each branch will be isolated with a<br />
pollination bag. Each tree will be monitored frequently for<br />
female receptivity (i.e., pollination drops). There will be<br />
two pollinations per cross. Pollination bags will be replaced<br />
later with insect bags.<br />
Cones will be monitored for development and collected<br />
in the fall. Collected cones will be dried, and seed will<br />
be extracted and cleaned. Three samples of 100 seed per<br />
sample will be taken from each cross, and cutting and<br />
examining each seed will determine the number of filled<br />
and empty seed. The percentage of filled seed per cross will<br />
be calculated.<br />
Collected data will be used to show in graph form the<br />
relationship between percent of pollen germination and<br />
percent of filled seed.
.2.1 Conduct ng a Ser es of So l<br />
Tests n the Kalamalka Larch<br />
Seed Orchards to obta n a<br />
Basel ne Ind cat on of the Levels<br />
of Pythium and Fusarium<br />
(SPU 1303)<br />
Gary G ampa<br />
Object ves<br />
In 2005 Kalamalka lost almost five percent of the ramets<br />
in our larch seed orchards. The trees were either very<br />
productive mature ramets or new transplants with a high<br />
breeding value. An investigation by Michael Peterson<br />
of Applied Forest Sciences indicated the possibility that<br />
pathogen levels in the soil were high enough to cause<br />
a disease threat. If we can determine levels of Pythium<br />
and Fusarium present in the orchards, our management<br />
techniques can be modified to maximise ramet survival and<br />
maintain seed production levels.<br />
Act v t es<br />
In order to obtain a baseline indication of the levels of<br />
Pythium and Fusarium, we made a series of soil tests in<br />
transects across the seed orchards. The samples were then<br />
analysed for pathogens. The samples were collected in the<br />
spring, summer, and fall of <strong>2006</strong>.<br />
Results<br />
These tests indicated that levels of soil-borne Pythium and<br />
Fusarium fungi in both Kalamalka larch seed orchards were<br />
significantly higher than levels that are commonly believed<br />
to lead to disease conditions.<br />
spring summer fall<br />
Pythium<br />
propagules<br />
per gram<br />
average 1834 5545 2271<br />
Fusarium<br />
propagules<br />
per gram<br />
average 3458 9033 3047<br />
Table 23.<br />
T R E E I M P R O V E M E N T P R O G R A M<br />
P R O J E C T R E P O R T 2 0 0 6 / 2 0 0 7<br />
Output and del verables<br />
It is impossible to state conclusively that these high<br />
pathogen levels are causing the mortality in the Kalamalka<br />
larch orchards, but the levels are a concern. In <strong>2007</strong> we<br />
intend to test several different irrigation regimes in our<br />
larch orchards in an effort to reduce these high levels of<br />
harmful pathogens. We will collect and analyse soil samples<br />
to determine the response of the Pythium and Fusarium<br />
fungi to various watering treatments.<br />
.2.1 Collect on of Crop Stat st cs<br />
for Inter or Lodgepole P ne<br />
Orchards<br />
Prepared for M chael Carlson by Joe Webber,<br />
ProSeed Consult ng<br />
The Lodgepole Pine Task Force met on January 25, <strong>2006</strong><br />
(VSOC) and determined the need to develop methodology<br />
for making comparisons among producing lodgepole<br />
pine seed orchards. The underlying concern is that seed<br />
production from north Okanagan orchards is significantly<br />
less than expected. To determine the source of these losses<br />
and make recommendations for orchard management<br />
practices to improve seed production, the task force<br />
required standardized collection of data for all producing<br />
orchards. This project developed standard methods for<br />
estimating the number of cones per tree based on cone<br />
weight, and for estimating cone yields (filled seed per cone,<br />
total seed per cone, seed weight), pollen cloud density,<br />
and seed losses from insect predation. As these data are<br />
collected over several years, trends in yearly variation in<br />
cone numbers and seed yields will help determine why seed<br />
set in the north Okanagan lodgepole pine seed orchards is<br />
chronically low. A summary of the methodology and results<br />
for OTIP project 0722 follows. A detailed final report for<br />
SPU 0722 (<strong>2006</strong>) is available from the OTIP coordinator.<br />
In the spring of <strong>2006</strong>, 15 trees (clones) were selected<br />
to include both early, mid- and late-flowering clones. The<br />
number of cones per tree was estimated by weighing a<br />
known number of cones and the total number of cones<br />
per tree. This method removed a source of error that<br />
resulted from estimating cone numbers per tree by volume.<br />
Figure 59 shows the data for the 15 selected trees (+/-<br />
9
standard errors) for each of the 12 lodgepole pine orchards<br />
monitored in <strong>2006</strong>.<br />
Kalamalka produced the highest number of cones (both<br />
orchards) and Prince George, as expected, produced the<br />
fewest. However, any further comparison would be difficult<br />
because we do not have data for crown volume and tree age.<br />
Collecting this data for <strong>2007</strong> may be very helpful.<br />
All data represent one ramet of each of 15 producing<br />
clones. The method may not capture the variation in per<br />
tree seed production among ramets of a clone, nor does<br />
it include typically unproductive clones. However, the 15<br />
trees do allow relative comparisons between orchards for<br />
total seed produced per tree. Data shown in Figure 60 were<br />
calculated using the number of cones per tree (Figure 59)<br />
multiplied by the number of filled seed per cone (Figure<br />
62) determined for the 30-cone sample. Averaged over all<br />
12 orchards, the mean seed production per tree was about<br />
3,200 and the range was 1,057 (ER 310) to 7,155 (KAL<br />
230).<br />
Cone mass varied among orchards, but there was<br />
no relationship between dry cone mass and seed yields.<br />
Further, there was very little variation among orchards (data<br />
not shown).<br />
Cone yields varied considerably, however. Figures 61<br />
and 62 show the total seed per cone (TSPC) and filled seed<br />
per cone (FSPC) respectively for the 30-cone sample from<br />
the 12 selected orchards. Figure 63 shows the percent filled<br />
seed per cone (FSPC/TSPC*100).<br />
Figure 61 shows the total seed per cone (TSPC) for<br />
all 12 orchards. Prince Gorge consistently produced the<br />
highest values (all above 30), but KAL 230 and PRT 313<br />
also produced above the 30 value. All the rest were 20 or<br />
fewer. Since lodgepole pine should have between 30 to 40<br />
potential seed per cone, we must try to explain where the<br />
10 or more TSPC are lost. Since insect bagging occurred<br />
between the second and third week of April, we may infer<br />
that insect predation on unprotected cones may have<br />
affected ovules development (leading to fewer TSPC) as<br />
well as lower filled seed per cone later in June. Inefficiencies<br />
in extraction (tumbling) may account for a few TSPC<br />
losses, but this should be reasonably consistent across all<br />
orchards.<br />
For example, only 10 TSPC were extracted from ER<br />
310 cones. Were there fewer ovules producing fewer<br />
potential seed? Was the pollen cloud limiting (not<br />
according to data shown in the final report)? Was insect<br />
damage a cause (about 10 TSPC were lost when insectbagged<br />
cones were compared to unbagged cones: see<br />
60<br />
T R E E I M P R O V E M E N T P R O G R A M<br />
P R O J E C T R E P O R T 2 0 0 6 / 2 0 0 7<br />
Figure 64). We certainly understand how insect<br />
(Leptoglossus) damage can lower FSPC, but it is not obvious<br />
how insect-protected cones produce about 10 more TSPC.<br />
Filled seed per cone (Figure 62) follows a similar trend<br />
to TSPC. Again Prince George produced the highest FSPC<br />
(all above 20 FSPC), and Kalamalka 230 produced the<br />
highest values (19.4) for the north Okanagan orchards.<br />
Excluding Kalamalka 230, PRT 313 produced the highest<br />
(16.1 FSPC) yields of the north Okanagan orchards, with<br />
FSPC for the remaining orchards ranging between 4.8 and<br />
12.2.<br />
Figure 63 shows the percent filled seed per cone (FSPC/<br />
TSPC*100). All Prince George orchards are near or greater<br />
than 70 percent. Since we assume that cone development<br />
at Prince George is normal, our target for north Okanagan<br />
orchards should be similar. Average percent FSPC for all the<br />
north Okanagan orchards was less than 50 percent (47.1).<br />
However, this statistic is somewhat misleading because both<br />
TSPC (Figure 61) and FSPC (Figure 62) are lower than<br />
expected. If mean TSPC (Figure 61) were about 10 higher,<br />
then percent FSPC would be considerably lower.<br />
One of the principal causes of the loss of seed in the<br />
north Okanagan lodgepole pine seed orchards is insect<br />
predation (Leptoglossus). However, it has been difficult<br />
to quantify these losses across all orchards because both<br />
monitoring of the damage (insect bagging) and control<br />
measures varied considerably. This year, all orchards<br />
followed standardized procedures for monitoring insect<br />
damage.<br />
Figures 64 and 65 show the cone yields (TSPC and<br />
FSPC, respectively) for insect-protected cones (bagged) and<br />
unprotected cones (unbagged). Figures 66 and 67 show<br />
the differences between FSPC and TSPC for bagged and<br />
unbagged cones respectively.<br />
Data (TSPC and FSPC) for unprotected cones shown<br />
in Figures 64 and 65 are similar to the data shown in<br />
Figures 61 and 62, which are based on the 30-cone sample.<br />
To determine the magnitude of the differences in TSPC<br />
and FSPC between bagged and unbagged cones, Figures 66<br />
and 67 show the mean difference for each of the 15 trees in<br />
each of the 12 orchards. The heaviest loss of TSPC occurred<br />
at Kalamalka. Greater than 15 TSPC were lost at Kalamalka<br />
from unprotected cones compared to insect-protected<br />
cones. Eagle Rock lost about 12 TSPC, and the remaining<br />
orchards lost between 5 and 10 TSPC.<br />
Loss of filled seed in unprotected cones also followed the<br />
same trend observed for TSPC. No significant differences<br />
were found for the Prince George orchards (no Leptoglossus
Cone Number<br />
Filled Seed Number<br />
TSPC<br />
FSPC<br />
500<br />
400<br />
300<br />
200<br />
100<br />
0<br />
10000<br />
8000<br />
6000<br />
4000<br />
2000<br />
50<br />
40<br />
30<br />
20<br />
10<br />
40<br />
30<br />
20<br />
10<br />
0<br />
0<br />
ER 310<br />
KAL 230<br />
KAL 307<br />
PGTIS 220<br />
PGTIS 223<br />
T R E E I M P R O V E M E N T P R O G R A M<br />
Figure 1: Mean cone numbers per tree (+/-standard errors) derived by estimating whole tree and<br />
a 30-cone sub sample for 12 lodgepole pine seed orchards (<strong>2006</strong> orchard statistics).<br />
0<br />
Mean Cone Number per <strong>Tree</strong><br />
Figure 2: Mean filled seed production per tree (+/-standard error) for each of the<br />
12 lodgepole pine seed orchards (<strong>2006</strong> orchard statistics).<br />
ER 310<br />
KAL 230<br />
KAL 307<br />
PGTIS 220<br />
PGTIS 228<br />
PRT 308<br />
PRT 311<br />
Mean Filled Seed per <strong>Tree</strong><br />
Figure 3: Mean total seed per cone (TSPC +/-standard errors) for each of the 12 lodgepole<br />
pine seed orchards (<strong>2006</strong> orchard statistics).<br />
ER 310<br />
KAL 230<br />
KAL 307<br />
PGTIS 220<br />
PGTIS 223<br />
PGTIS 228<br />
PRT 308<br />
PRT 311<br />
Mean TSPC - 30 Cone Sample<br />
PGTIS 223<br />
PGTIS 228<br />
Figure 4: Mean filled seed per cone (FSPC +/-standard errors) for each of the 12 lodgepole pine<br />
seed orchards (<strong>2006</strong> orchard statistics).<br />
ER 310<br />
KAL 230<br />
KAL 307<br />
PGTIS 220<br />
PRT 308<br />
PRT 311<br />
Mean FSPC - 30 Cone Sample<br />
PGTIS 223<br />
PGTIS 228<br />
PRT 308<br />
PRT 311<br />
PRT 313<br />
PRT 313<br />
PRT 313<br />
PRT 313<br />
VSOC 218<br />
VSOC 218<br />
VSOC 218<br />
VSOC 218<br />
VSOC 219<br />
VSOC 219<br />
VSOC 219<br />
VSOC 219<br />
VSOC 222<br />
VSOC 222<br />
VSOC 222<br />
VSOC 222<br />
P R O J E C T R E P O R T 2 0 0 6 / 2 0 0 7<br />
F gure 9. Mean cone numbers per tree<br />
(± standard errors) der ved by est mat ng<br />
whole tree and a 30-cone sub sample for 12<br />
lodgepole p ne seed orchards (<strong>2006</strong> orchard<br />
stat st cs).<br />
F gure 60. Mean filled seed product on per<br />
tree (± standard error) for each of the 12<br />
lodgepole p ne seed orchards (<strong>2006</strong> orchard<br />
stat st cs).<br />
F gure 61. Mean total seed per cone<br />
(TSCP ± standard errors) for each of the<br />
12 lodgepole p ne seed orchards (<strong>2006</strong><br />
orchard stat st cs).<br />
F gure 62. Mean filled seed per cone (FSPC ±<br />
standard errors) for each of the 12 lodgepole<br />
p ne seed orchards (<strong>2006</strong> orchard stat st cs).<br />
61
Percent<br />
TSPC<br />
FSPC<br />
TSPC<br />
62<br />
100<br />
80<br />
60<br />
40<br />
20<br />
0<br />
100<br />
40<br />
30<br />
20<br />
10<br />
25<br />
20<br />
15<br />
10<br />
80<br />
60<br />
40<br />
20<br />
0<br />
5<br />
0<br />
0<br />
T R E E I M P R O V E M E N T P R O G R A M<br />
Figure 5: Mean percent filled seed per cone (%FSPC +/-standard errors) for<br />
each of the 12 lodgepole pine seed orchards (<strong>2006</strong> orchard statistics).<br />
ER 310<br />
KAL 230<br />
KAL 307<br />
PGTIS 220<br />
Percent Filled Seed per Cone<br />
Figure 6: Mean total seed per cone (TSPC +/-standard errors)<br />
for insect protected cones (Bagged) and unprotected cones (unBagged)<br />
for each of the 12 lodgepole pine seed orchards (<strong>2006</strong> orchard statistics).<br />
ER 310<br />
KAL 230<br />
KAL 307<br />
PGTIS 223<br />
PGTIS 228<br />
PRT 308<br />
PRT 311<br />
Mean TSPC Bagged and unBagged<br />
PGTIS 220<br />
PGTIS 223<br />
PGTIS 228<br />
PRT 308<br />
PRT 311<br />
PRT 313<br />
VSOC 218<br />
PRT 313<br />
VSOC 219<br />
VSOC 222<br />
VSOC 218<br />
VSOC 219<br />
VSOC 222<br />
Bagged<br />
unBagged<br />
Figure 7: Mean filled seed per cone (FSPC +/-standard errors) for insect<br />
protected cones (Bagged) and unprotected cones (unBagged) from each<br />
of the 12 lodgepole pine seed orchards (<strong>2006</strong> orchard statistics).<br />
ER 310<br />
KAL 230<br />
KAL 307<br />
Mean FSPC Bagged and unBagged<br />
PGTIS 220<br />
PGTIS 223<br />
PGTIS 228<br />
PRT 308<br />
PRT 311<br />
PRT 313<br />
VSOC 218<br />
VSOC 219<br />
VSOC 222<br />
Figure 8: Mean difference (+/- standard errors) between TSPC from insect<br />
bagged cones and unbagged cones from each of the 12 lodgepole pine<br />
seed orchards (<strong>2006</strong> orchard statistics).<br />
ER 310<br />
KAL 230<br />
KAL 307<br />
Difference Bagged-UnBagged TSPC<br />
PGTIS 220<br />
PGTIS 223<br />
PGTIS 228<br />
F gure 66. Mean d fference (+/- standard errors) between TSPC<br />
from nsect bagged cones and unbagged cones from each of the<br />
12 lodgepole p ne seed orchards (<strong>2006</strong> orchard stat st cs).<br />
PRT 308<br />
PRT 311<br />
PRT 313<br />
VSOC 218<br />
VSOC 219<br />
VSOC 222<br />
Bagged<br />
unBagged<br />
FSPC<br />
14<br />
12<br />
10<br />
8<br />
6<br />
4<br />
2<br />
0<br />
P R O J E C T R E P O R T 2 0 0 6 / 2 0 0 7<br />
F gure 63. Mean percent filled seed per cone<br />
(%FSPC +/-standard errors) for each of the 12<br />
lodgepole p ne seed orchards (<strong>2006</strong> orchard<br />
stat st cs).<br />
F gure 6 . Mean total seed per cone (TSPC +/-standard<br />
errors) for nsect protected cones (Bagged) and<br />
unprotected cones (unBagged) for each of the 12<br />
lodgepole p ne seed orchards (<strong>2006</strong> orchard stat st cs).<br />
F gure 6 . Mean filled seed per cone (FSPC +/-standard<br />
errors) for nsect protected cones (Bagged) and<br />
unprotected cones (unBagged) from eachof the 12<br />
lodgepole p ne seed orchards (<strong>2006</strong> orchard stat st cs).<br />
Figure 9: Mean difference (+/- standard errors) between FSPC from insect<br />
bagged cones and unbagged cones from each of the 12 lodgepole pine seed<br />
orchards (<strong>2006</strong> orchard statistics).<br />
ER 310<br />
KAL 230<br />
KAL 307<br />
Difference Bagged-UnBagged FSPC<br />
PGTIS 220<br />
PGTIS 223<br />
PGTIS 228<br />
F gure 67. Mean d fference (+/- standard errors) between FSPC<br />
from nsect bagged cones and unbagged cones from each of the<br />
12 lodgepole p ne seed orchards (<strong>2006</strong> orchard stat st cs).<br />
PRT 308<br />
PRT 311<br />
PRT 313<br />
VSOC 218<br />
VSOC 219<br />
VSOC 222
effect) compared to the north Okanagan orchards,<br />
Kalamalka showed the biggest effect, with losses of over 10<br />
and 8 FSPC for orchards 230 and 307 respectively. Eagle<br />
Rock showed losses in the order of 6 FSPC and PRT, and<br />
VSOC each had fewer than 4 FSPC losses.<br />
Conclus ons<br />
The purpose of this orchard statistics project was to<br />
standardize the methods for estimating cone and seed<br />
production in all producing lodgepole pine seed orchards.<br />
The method of estimating cones per tree based on cone<br />
weight made comparisons between orchard sites and<br />
individual orchards more meaningful. This is also true for<br />
estimates of cone analyses (FSPC, TSPC, and seed weight),<br />
for general orchard production (30-cone sample), and<br />
insect effects.<br />
Although the Prince George orchards produced the<br />
highest seed yields (FSPC), they also produced the fewest<br />
cones per tree. This made production from the north<br />
Okanagan orchards and Prince George orchards more<br />
equitable. Mean filled seed per tree ranged from about<br />
1,100 to 7,200, with a grand mean of about 3,200.<br />
However, we are relying on the naturally inductive effect<br />
of the north Okanagan to produce more cones per tree. In<br />
general, the yields per cone from these orchards range from<br />
10 to 15 fewer FSPC than we would expect. Certainly the<br />
losses due to insect predation are an important factor, but<br />
we cannot attribute all the losses to insect predation alone.<br />
Because this is the first year of sampling, we cannot<br />
speculate on trends and the causes of losses in either cone<br />
numbers, FSPC, or TSPC. However, for most of the<br />
producing north Okanagan orchards, TSPC is critically<br />
lower than we would expect. Since insect bagging occurred<br />
around mid-April, we may infer that insect predation from<br />
mid-April also affected ovule development and resulted in<br />
fewer potential seed (TSPC).<br />
The methodology used in this sampling project allowed<br />
direct comparisons of orchard yields from the 12 selected<br />
orchards. Next year, we may want to consider adding<br />
an estimate of crown size and tree age to further refine<br />
comparisons when orchard age and crown management<br />
practices are sufficiently different.<br />
T R E E I M P R O V E M E N T P R O G R A M<br />
P R O J E C T R E P O R T 2 0 0 6 / 2 0 0 7<br />
.2.16 Female D fferent at on T m ng<br />
n Lodgepole P ne n Support of<br />
Operat onal Cone Induct on<br />
Patr ck von Aderkas, Genoa Barchet,<br />
Sébast en Bonthoux, Sam r Demdoum,<br />
L sheng Kong and Rebecca Wagner,<br />
Centre for Forest B ology,<br />
Un vers ty of V ctor a<br />
Or g nal object ve<br />
The objective of the project was to assess genotypic<br />
variation in female differentiation of lodgepole pine. The<br />
approach taken was a histological investigation of five<br />
clones. The originally submitted description and context<br />
follow.<br />
Or g nal project descr pt on<br />
To increase production from Pli orchards, we are<br />
proposing to study differentiation of female buds with a<br />
view to improving the timing of induction treatments.<br />
Current knowledge, according to all orchardists and<br />
breeders surveyed, is that lodgepole pine phenology in the<br />
Okanagan is difficult to gauge. In addition, the literature<br />
does not provide specific information in support of clear<br />
identification of female differentiation.<br />
The problem with the published phenology of Owens<br />
(<strong>2006</strong>) is that it is so general as to be of little operational<br />
use. Because seasonality, genotypic variation, and<br />
phenological variation have not been established, from<br />
an operational standpoint every female cone induction<br />
treatment that is applied in the hope of increasing bud<br />
numbers and therefore cone numbers is applied without<br />
precise knowledge of when the optimal opportunities exist.<br />
Abstract<br />
Interior lodgepole pine is an important timber producing<br />
tree species in the interior of British Columbia. There is<br />
a high demand for improved seed that originates from<br />
seed orchards. A number of different methods are used to<br />
improve seed cone induction including controlled watering<br />
regimes, root pruning, and hormone induction. To time<br />
induction strategies effectively, a baseline knowledge of<br />
female strobili initiation and differentiation is needed.<br />
This study undertook histological analysis of long-shoot<br />
buds to identify female strobilus differentiation for five<br />
63
genotypes of interior lodgepole pine. Genotypes were<br />
selected on the basis of established seed cone production<br />
and pollination receptivity. Biweekly collections were made<br />
from genotypes located at Kalamalka Research Station from<br />
July to October, <strong>2006</strong>. Substantial inter-clone variation in<br />
the timing of female strobilus differentiation was found<br />
for the five clones analyzed. Female differentiation began<br />
in a period from late July to late August, depending on<br />
genotype. Lateral bud initiation and female bud initiation<br />
occur during the same period. In genotypes that showed<br />
male cone differentiation, sectioning revealed male cone<br />
buds had formed prior to our period of sample collection.<br />
These results suggest that cone induction may vary<br />
from two to three weeks between genotypes. Female<br />
differentiation in <strong>2006</strong> was earlier than previously reported<br />
in the literature.<br />
Introduct on<br />
Interior lodgepole pine, Pinus contorta Dougl. ex Loud. var.<br />
latifolia Englem, is an important timber-producing tree<br />
species of Canada (Rehfeldt 1999). Due to the defoliation<br />
of many lodgepole pine forests in British Columbia by<br />
the mountain pine beetle (Dendroctonus ponderosae), seeds<br />
are in great demand to mitigate the devastation of this<br />
pest (Anon. <strong>2006</strong>). Two options are possible to increase<br />
seed production: increase seed yield per cone or increase<br />
cone yield. Seed yield per cone is generally optimized<br />
by adequate pollination and reduction of seed losses. To<br />
increase cone yields, conifer seed orchards have historically<br />
utilized many different cone induction strategies such<br />
as root pruning, stem girdling, crown pruning, and<br />
application of fertilizers and plant growth regulators (PGRs)<br />
(Bonnet-Masimbert and Webber 1995). Although many of<br />
these practices have proven practical, interpretation of the<br />
responses can be unclear. In particular, questions about the<br />
timing of applications still abound. This is due to a specific<br />
lack of precise knowledge of phenological variability of<br />
individual genotypes. Without this knowledge, accuracy in<br />
method application could not be achieved.<br />
The legacy of a few generations of conifer morphologists<br />
has been a literature that describes various types of bud<br />
phenologies. Because the overall goal of such publications<br />
was to provide general outlines of bud formation, they were<br />
useful starting points for operational managers interested in<br />
studying bud development in their orchards. Operational<br />
improvements in induction treatments could be realized<br />
only if genotype-specific phenologies could be devised.<br />
These require close monitoring and an investment in<br />
6<br />
T R E E I M P R O V E M E N T P R O G R A M<br />
P R O J E C T R E P O R T 2 0 0 6 / 2 0 0 7<br />
studies of anatomy and morphology.<br />
Interior lodgepole pine has a reproductive cycle of<br />
three years. It has compound buds, in which both female<br />
and male strobili, short shoots, and lateral shoots are<br />
preformed and protected under sterile, lignified scales.<br />
In years of vigorous growth, interior lodgepole pine can<br />
display polycyclic growth (Greenwood 1980, O’Reilly<br />
1986). Buds that differentiate in the first year include male,<br />
female, short-shoot, and lateral-shoot buds. Each one is<br />
separately initiated in the axils of cataphylls along the axis<br />
of the long-shoot bud. Generally, males are located at the<br />
bottom or proximal portion of the axis and females and<br />
lateral-shoot buds are located at the top or distal portion of<br />
the axis. Development of these buds continues until winter<br />
dormancy. In the second year, development continues. Male<br />
buds mature and anthesis (pollen release) occurs. Female<br />
cones are receptive, but ovule development takes another<br />
year. Germinated pollen must wait in the nucellus until the<br />
female reproductive tissue matures. During the third year<br />
of development, fertilization finally takes place, followed by<br />
embryogenesis and seed maturation (Owens <strong>2006</strong>).<br />
Understanding the timing of female strobilus<br />
differentiation is an important factor in ensuring that the<br />
full potential of cone induction activities is realized. In this<br />
study, we performed histological analysis of long-shoot buds<br />
in the first year of development from five clones of interior<br />
lodgepole pine.<br />
Mater als and methods<br />
Plant material: Long-shoot buds of interior lodgepole<br />
pine (Pinus contorta var. latifolia) were collected from the<br />
Kalamalka Research Station near Vernon, BC. Ten buds<br />
were selected from a single ramet from each of five different<br />
clones: 1506, 1524, 1540, 1531, and 1539. <strong>Tree</strong>s were<br />
selected which were in from the periphery of the orchard<br />
by at least four trees; this was done to avoid edge effects.<br />
Collections were obtained from all areas of the crown of<br />
the tree. Serial collections were carried out at approximately<br />
two-week intervals from the beginning of July to the middle<br />
of October.<br />
Fixation: The long-shoot buds were cut transversely<br />
and radially using a scalpel to allow a rough separation of<br />
male and female axillary buds. This also allowed superior<br />
infiltration of fixative and subsequent solutions. The<br />
fixative was composed of 2.5% glutaraldehyde in 0.05 M<br />
Sorenson’s phosphate buffer (pH 7.2). Air bubbles were<br />
removed under vacuum at room temperature. Vials were<br />
stored in 4°C until further processing.
Dehydration: Long-shoot bud samples were<br />
preprocessed for the stepwise dehydration series by a<br />
series of four washes in a solution of 0.05 M Sorenson’s<br />
phosphate buffer (pH 7.2) at room temperature. After<br />
either the second or third wash, the buds were descaled<br />
using tweezers and fine scissors.<br />
Plant material was dehydrated by stepwise exposure to<br />
an increased concentration of ethanol in water (30%, 50%,<br />
70%, 95%, 100%). Distilled de-ionized water (ddH2O)<br />
and anhydrous ethanol were used. Each step of the series<br />
was left for a period of 1 h, with the exception of the final<br />
step, which was left for 1.5 h.<br />
Pre-infiltration: Pre-infiltration was carried out<br />
according to the Technovit 7100 instructions. Preinfiltration<br />
solution was made using a 1:1 ratio of Technovit<br />
base to 100% ethanol. Dehydrated buds were immersed<br />
in approximately 5 times their volume and left at room<br />
temperature overnight.<br />
Infiltration: Infiltration solution was made up<br />
according to the Technovit 7100 instructions. One gram<br />
of Hardener I was mixed into 100 mL Technovit base.<br />
Buds were immersed in at least five times their volume of<br />
infiltration solution. The solution was changed twice over<br />
the period of infiltration: once to replace the pre-infiltration<br />
solution and again on the third day of infiltration. After<br />
the last infiltration solution change, the vials were stored in<br />
refrigeration (4°C) until required.<br />
Embedding: Embedding solution was made up<br />
according to the Technovit 7100 instructions. Using a<br />
ratio of 1 mL Hardener II to 15 mL infiltration solution,<br />
the embedding solution was placed in embedding wells (3<br />
cm diameter) using a Pasteur pipette. Bud specimens were<br />
placed in the wells and covered with plastic film to allow<br />
the solution to polymerize. This step took place at room<br />
temperature.<br />
Sectioning and staining: Sections (5 µm) were<br />
obtained using a Leica SM2400 sledge microtome<br />
equipped with a tungsten carbide knife. Each section<br />
was manually flattened in distilled water on clean glass<br />
slides (Technologist Choice), then stained with one of<br />
the following stains: i) Toluidine blue O with sodium<br />
hypochlorite pre-treatment, ii) Safranin O, or iii) Ponceau<br />
2R with Azure II post-treatment (Gutmann et.al. 1996).<br />
Slides were dried at 50°C on a slide warmer, then mounted<br />
in Permount (Fisher Scientific) with clean glass cover slips<br />
(VWR Scientific).<br />
Sectioning strategy and avoidance of bias: To prevent<br />
any bias occurring in the sectioning strategy, information<br />
T R E E I M P R O V E M E N T P R O G R A M<br />
P R O J E C T R E P O R T 2 0 0 6 / 2 0 0 7<br />
concerning the properties of the original clones was<br />
withheld from the investigators until the end. In addition,<br />
the personnel who were trained to do the sectioning used<br />
an initial practice set of a dozen samples, the results of<br />
which are not included. In this way, sample processing<br />
(fixation, dehydration, infiltration, and embedding) was<br />
optimized and staff gained experience on appropriate<br />
material without loss of critical samples. The total number<br />
of samples sectioned was 109 (see Table 24). This represents<br />
the labour of two individuals processing and sectioning<br />
from September to mid-December. More samples were<br />
sectioned from the 18 July to 15 August, <strong>2006</strong> collections<br />
because this period proved to be the most critical.<br />
Results<br />
Female strobili appeared as large axillary buds with an apex<br />
resembling that of a half dome. They were more easily<br />
distinguishable in their later stages of development (Figure<br />
68 and addendum). Bract primordia could be observed<br />
along the proximal margin of the hemispherical apex. Scales<br />
covering the developing strobilus originated at the base of<br />
the bud.<br />
The timing of female strobilus differentiation<br />
varied between the different clones (Table 25). Female<br />
differentiation was easiest to verify in genotypes that were<br />
also high productive cone producers (Table 26). The best<br />
example is 1540, in which only a few samples needed to be<br />
sectioned to find female buds, largely because female buds<br />
were abundantly available. In other samples, particularly<br />
low-producing clones (1524, 1539), it was more difficult<br />
to establish female differentiation, in spite of substantial<br />
sample sectioning effort (Table 24).<br />
Over the course of the summer, long-shoot buds<br />
continued to expand, with the various cones differentiating<br />
along their axes. There were clonal differences in longshoot<br />
bud elongation over the course of the growing season<br />
(Figure 69). The ones with the greatest elongation (1524<br />
and 1539) appeared to have the most delayed female<br />
development. The obverse was found with clones that had<br />
the least elongation (1531 and 1540). One clone — 1506<br />
— had slow elongation initially but increased its rate of<br />
elongation, eventually matching the consistently faster<br />
elongated clones. 1506 had early female development,<br />
which may be linked to the slower initial elongation.<br />
Those clones with the longest long-shoot buds were<br />
from clones that historically had the least number of cones<br />
per tree (Table 26). Assuming the long-shoot bud length is<br />
consistent from year to year and that the cone production<br />
6
66<br />
T R E E I M P R O V E M E N T P R O G R A M<br />
Clone ID 5-Jul 18-Jul 1-Aug 15-Aug 31-Aug 15-Sep 3-Oct totals<br />
1506 3 5 4 3 4 4 1 24<br />
1524 2 3 5 5 4 4 1 24<br />
1531 - 6 5 6 1 1 2 21<br />
1539 2 3 3 5 5 4 3 25<br />
1540 - 6 3 2 1 1 2 15<br />
totals 7 23 20 21 15 14 9 109<br />
Dates of Collection<br />
Clone ID 5-Jul 18-Jul 1-Aug 15-Aug 31-Aug 15-Sep 3-Oct<br />
Clone ID<br />
1506 F<br />
F F<br />
1524 ? F<br />
1531 ? ?<br />
F<br />
1539 ? F<br />
1540 ? F<br />
F F F<br />
Pollen<br />
receptivity<br />
stage<br />
Number<br />
cones/tree<br />
1506 late 226<br />
1524 late 68<br />
1531 mid 455<br />
1539 early 25<br />
1540 early 620<br />
Dates of Collection<br />
Table 26. Pollen recept v ty<br />
and cone product on of the<br />
five clones selected at KRS.<br />
Clone ID 5-Jul 18-Jul 1-Aug 15-Aug 31-Aug 15-Sep 3-Oct<br />
1506 LSB LSB<br />
1524 LSB LSB<br />
1531 ? ? LSB LSB<br />
1539 LSB<br />
1540 ? LSB<br />
Table 27. Table show ng the d str but on of lateral shoot buds found n<br />
the five clones collected at KRS. Quest on marks represent buds that<br />
were e ther develop ng lateral-shoot buds or female strob l .<br />
results would be similar, we can surmise that long-shoot<br />
bud length, in particular long long-shoot bud length<br />
early in the season, is characteristic of low cone producers<br />
(Figure 69). Although this relationship would appear to be<br />
significant, this is only really apparent towards the end of<br />
P R O J E C T R E P O R T 2 0 0 6 / 2 0 0 7<br />
Table 2 . Number of<br />
samples sect oned of<br />
the five clones from<br />
each collect on date.<br />
Table 2 . Develop ng female strob l found n the five<br />
clones collected from the Kalamalka Research Stat on (KRS).<br />
Quest on marks represent buds that were e ther develop ng<br />
lateral-shoot buds or female strob l .<br />
the summer, far after such a trait would be operationally<br />
useful (Figure 70).<br />
Female development is earliest in 1506, 1531, and 1540<br />
and latest in 1524 and 1539. This does not correlate with<br />
another historical measure of development in these clones,
pollen receptivity (Table 26). It would appear that the rate<br />
of female bud differentiation is not linked to female bud<br />
opening in the following year. In this case, the data were<br />
taken from a previous year’s study and may be of limited<br />
applicability.<br />
The study also provided other information supporting<br />
a general observation that all buds — male buds, lateralshoot<br />
buds, female buds, and short-shoot buds — showed<br />
earlier differentiation than previously reported.<br />
Male buds were easily identifiable from the proximal<br />
portions of the axis, both when hand cutting the longshoot<br />
buds (results not shown), as well as from histological<br />
sections (Figure 71). Male strobili were already clearly<br />
recognizable for all clones at the time of the earliest<br />
collection date (July 5, <strong>2006</strong>). Differences in sizes and<br />
maturation of male strobili between different clones were<br />
observed. Even at the earliest date, some were already quite<br />
large, showing well-developed microsporophylls. In male<br />
strobili that were particularly large or at an advanced stage<br />
of development, developing microsporangia could be seen<br />
as circular areas of lightly staining cells with large diffused<br />
nuclei at the abaxial surface of the microsporophyll. They<br />
formed a slight protrusion from the lower portion of the<br />
microsporophyll. Male strobili were found along the axis of<br />
the long-shoot bud from the base to approximately twothirds<br />
to three-quarters up the length of the bud.<br />
Lateral-shoot buds (LSB) were initiated in the same<br />
region of the long-shoot bud as female strobili. At the<br />
early stages of development, lateral-shoot buds and female<br />
strobili were difficult to distinguish from one other. This<br />
is reflected in Table 25 and Table 27 by question marks.<br />
As development progressed, lateral-shoot buds appeared<br />
more conical than female strobili. LSBs also lacked bract<br />
primordia (Figure 72). Both bud types are initiated at the<br />
same time, as would appear to be the case if Table 25 and<br />
Table 27 are compared. The order of the earliest to latest<br />
clones is the same for both bud types, but this may be an<br />
artifact of both uniform initial stages and sampling error.<br />
An important observation is that lateral-shoot buds and<br />
female buds become obvious at about the same time, which<br />
we interpret to mean that initiation of the bud types is also<br />
likely to be synchronous. If the two tables were combined,<br />
it would further emphasize that initiation is earlier than<br />
previously thought.<br />
Short-shoot buds were initiated in the axils of cataphylls<br />
along the entirety of the long-shoot bud axis. These<br />
buds differentiated into needles. At advanced stages of<br />
differentiation, short-shoot buds showed primordia on<br />
either side (Figure 73).<br />
T R E E I M P R O V E M E N T P R O G R A M<br />
P R O J E C T R E P O R T 2 0 0 6 / 2 0 0 7<br />
F gure 6 . Long tud nal<br />
sect on of female bud<br />
of lodgepole p ne from<br />
clone 1 2 , 3 October,<br />
<strong>2006</strong>.<br />
F gure 69. Collect on date<br />
(<strong>2006</strong>) versus long-shoot<br />
bud length.<br />
F gure 70.<br />
Compar son of<br />
clones 1 31 and<br />
1 39 on October 3,<br />
<strong>2006</strong>. Bar=1 cm.<br />
67
6<br />
T R E E I M P R O V E M E N T P R O G R A M<br />
F gure 71. Whole male strob lus<br />
sect on show ng the format on<br />
of m crosporophylls. Th s<br />
p cture s of clone 1 39 at<br />
the earl est date of collect on,<br />
July , <strong>2006</strong>. Note the<br />
m crosporophylls along the<br />
edge of the male strob lus bud.<br />
F gure 72. F gure of a lateral<br />
shoot bud. Th s sample was<br />
taken from the clone 1 06 on<br />
August 1, <strong>2006</strong>.<br />
F gure 73. Short-shoot bud<br />
show ng two oppos te<br />
pr mord a. Th s photograph s<br />
of clone 1 39 collected on 3<br />
October, <strong>2006</strong>.<br />
P R O J E C T R E P O R T 2 0 0 6 / 2 0 0 7<br />
D scuss on and conclus on<br />
Female differentiation showed genotypic variation.<br />
Two of the lines — 1531 and 1540 — were early<br />
initiators of female cone buds, and two of the lines<br />
were late initiators (1524 and 1539). Within-clone<br />
variation could not really be well established, as<br />
the sample design was not sufficiently accurate<br />
to allow detailed investigation. Overall female<br />
development was earlier by two to three weeks<br />
than previously reported by Owens (<strong>2006</strong>).<br />
There were other measures that could be<br />
operationally useful. One that we encountered<br />
by accident was the usefulness of halving longshoot<br />
buds and inspecting the buds in the field.<br />
The historically high-cone-producing genotypes<br />
were easily discernible because they had smaller<br />
long-shoot buds: female buds and lateral-shoot<br />
buds were quite obvious to the naked eye by early<br />
September. In contrast, the historically lowest<br />
cone producers had quite elongated long-shoot<br />
buds by the first of August. This implied that<br />
the investment in vegetative growth was much<br />
heavier in these genotypes. This observation fits<br />
with the “vegetative vigour hypothesis” set out<br />
by Meehan (cited in Ross and Pharis, 1987) that<br />
stated that a continuum in physiological fitness<br />
exists in conifers, and the level of fitness will affect<br />
the reproductive structures produced. At varying<br />
nutrient levels, the tree will produce short-shoot<br />
buds, male strobili, female strobili, and lateralshoot<br />
buds in an increasing order of fitness.<br />
This is an interesting result, and it will be left to<br />
future studies to explain its importance to the<br />
reproductive biology of lodgepole pine.<br />
The date of 1 August is important because<br />
initiation is well underway then in most clones.<br />
This would appear to be a general conclusion, but<br />
F gure 7 . Schemat c<br />
of bud development n<br />
long-shoot buds.
it must be noted that the genotypes that form females late<br />
may also be induced much later. In other words, there is a<br />
delay in differentiation in some of the clones, which should<br />
be reflected in the management of induction treatments,<br />
such as pruning or hormone induction. It is likely that<br />
the timing difference in the initiation of female strobili<br />
varies between the five clones. Overall, they differ from<br />
each other from two to four weeks. Initiation of female<br />
(and lateral-shoot) buds would appear to be in mid-July.<br />
Female strobilus differentiation likely begins in late July for<br />
some genotypes because female buds could be observed by<br />
August 1, <strong>2006</strong>. Based on this observation, female strobilus<br />
initiation is more highly variable than was previously<br />
suspected. This means that induction treatments should be<br />
implemented in early July if they are to maximize female<br />
bud formation. We suggest that female strobilus induction<br />
treatments need to be carried out in a genotype-specific<br />
manner.<br />
The pattern of male differentiation among the clones<br />
selected for histological analysis showed that male initiation<br />
and differentiation occurred before the first date of longshoot<br />
bud collection, namely July 5, <strong>2006</strong> (Table 25). Male<br />
strobilus initiation occurred at some time in June <strong>2006</strong>.<br />
Due to the advanced stage of development of male<br />
strobili observed for some of the clones, it is likely<br />
that initiation occurred even earlier. Male strobilus<br />
differentiation is also thought to occur earlier than<br />
previously published (Owens <strong>2006</strong>).<br />
Induction strategies of female buds of lodgepole pine<br />
should take into account the information summarized<br />
in Figure 74. Within long-shoot buds there is a marked<br />
apical-basal gradient: typically, the bottom half developed<br />
male and short-shoot buds, whereas the top half has either<br />
short-shoot buds and later female buds and lateral-shoot<br />
buds. Within each half there are also gradients, with males<br />
mostly formed at the bottom of the bottom half. In the<br />
upper portion, female buds and lateral-shoot buds are the<br />
latest to form, but female buds are almost always higher up<br />
the distal portion than lateral-shoot buds. A time factor also<br />
comes into play because buds form in an obvious order:<br />
males precede short-shoot buds and lateral-shoot buds,<br />
and female buds are last. This means that induction of<br />
female buds can occur after male buds have visibly formed<br />
(as observed under a dissecting scope), but not long after<br />
because the period from short-shoot bud initiation to<br />
female bud initiation is no longer than three weeks.<br />
A practical conclusion of this work is that when<br />
males are readily apparent in halved long-shoot buds<br />
T R E E I M P R O V E M E N T P R O G R A M<br />
P R O J E C T R E P O R T 2 0 0 6 / 2 0 0 7<br />
(longitudinally bisected leader shoot tips), it is time<br />
to apply induction treatments to optimize female bud<br />
initiation.<br />
Acknowledgments<br />
We gratefully acknowledge the assistance of Dr. Mike<br />
Carlson and Chris Walsh of KRS in providing us with plant<br />
material and much advice. We also appreciate the work of<br />
Heather Anholt, who collected samples for us.<br />
References<br />
Anonymous. Ministry of Forests and Range. Available from<br />
www.for.gov.bc.ca/hfp/mountain_pine_beetle/ [accessed<br />
November 15, <strong>2006</strong>]<br />
Bonnet-Masimbert, M and Webber, JE. 1995. From flower<br />
induction to seed production in forest tree orchards. <strong>Tree</strong><br />
Physiol. 15(7-8): 419-426.<br />
Greenwood, M. 1980. Reproductive development in<br />
loblolly pine. 1. The early development of male and<br />
female strobili in relation to the long shoot growth<br />
behavior. Am. J. Bot. 67(10): 1414-1422.<br />
Gutmann, M. 1995. Improved staining procedures for<br />
photographic documentation of phenolic deposits in<br />
semi thin sections of plant tissue. Journal of Microscopy<br />
179: 277-281.<br />
Gutmann, M, von Aderkas, P, Label, P, and Lelu, M. 1996.<br />
Effects of abscisic acid on somatic embryo maturation of<br />
hybrid larch. J. Exp. Bot. 47(305): 1905-1917.<br />
O’Reilly, C. J. 1986. Phenology and development of<br />
vegetative and reproductive structures in provenances of<br />
lodgepole pine. PhD thesis, Department of Biology, The<br />
University of Victoria, Victoria, BC.<br />
Owens, J. N. <strong>2006</strong>. The reproductive biology of Lodgepole<br />
Pine. FGC Extension Note 07. Available from http://<br />
www.fgcouncil.bc.ca.<br />
Rehfeldt, G. 1999. Genetic responses to climate in<br />
Pinus contorta: Niche breadth, climate change, and<br />
reforestation. Ecol. Monogr. 69(3): 375-407.<br />
Ross, S and Pharis, R. 1987. Control of sex expression in<br />
conifers. Plant Growth Regulation. 6(1-2): 37-60.<br />
69
Addendum<br />
70<br />
T R E E I M P R O V E M E N T P R O G R A M<br />
Female buds<br />
July 18, <strong>2006</strong><br />
P R O J E C T R E P O R T 2 0 0 6 / 2 0 0 7<br />
Long shoot bud meristem<br />
August 31, <strong>2006</strong><br />
Female bud<br />
August 16, <strong>2006</strong>
.2.17 Development of Yellow-Cedar<br />
Stock Plant Nutr t on Gu del nes<br />
to Enhance Operat onal<br />
Root ng of El te Clones<br />
(SPU 111 )<br />
Robert van den Dr essche<br />
Yellow-cedar reforestation in BC is almost entirely through<br />
clonal forestry using rooted cuttings. For example, the<br />
Ministry of Forests and Range Cowichan Lake Research<br />
Station grows stock plants chosen from selected yellowcedar.<br />
These yellow-cedar plants have been selected because<br />
they have shown superior growth in the forest and also<br />
good ability to root from cuttings. The stock plants are<br />
grown outdoors, either in pots or field-planted, and are<br />
kept small by pruning because pruning, or “hedging,” tends<br />
to slow the aging process. Slowing aging and maintaining<br />
juvenility is important for producing cuttings that grow like<br />
seedlings. That is, they root easily and have vigorous shoot<br />
growth. Research studies at CLRS have shown that serial<br />
propagation by using a proportion of each generation of<br />
rooted cuttings as hedges for the next generation conserves<br />
juvenility for about 15 years.<br />
Recent operational experience indicates the potential<br />
benefit of growing stock plants in greenhouses for<br />
increasing the rooting of cuttings. This benefit may, in part,<br />
be attributed to a more optimal nutrient status for rooting<br />
ability among stock plants. Little is known about the effect<br />
of yellow-cedar stock plant nutrition on the rooting ability<br />
of cuttings, although nutrition is relatively easy to control<br />
and stock plant nutrition has been shown to influence the<br />
performance of cuttings in plants.<br />
In particular, the balance between concentrations of<br />
total non-structural carbohydrates and nitrogen has been<br />
thought important for rooting, although the relationship of<br />
cutting performance to several nutrients has been reported.<br />
Additionally, production by the WFP Saanich nursery of<br />
yellow-cedar cuttings that rooted and grew vigorously was<br />
attributed to adding fertilizer to the stock plants during the<br />
fall. Consequently, we decided to study the importance of<br />
nitrogen and phosphorus, and the time of their application,<br />
to potted stock plants of different clones and ages at<br />
the CLRS. The objective is to relate different levels of<br />
nutrient status in stock plants, achieved with the fertilizer<br />
treatments, to subsequent rooting and growth vigour of<br />
cuttings. It should then be possible to recommend levels<br />
T R E E I M P R O V E M E N T P R O G R A M<br />
P R O J E C T R E P O R T 2 0 0 6 / 2 0 0 7<br />
of stock plant nutrient status for the successful production<br />
of cuttings. So far, a small-scale experiment has produced<br />
cuttings that have been struck this winter, and samples<br />
of these cuttings are undergoing chemical analysis. Also<br />
plant material has been potted and prepared for a larger<br />
experiment that will be conducted during <strong>2007</strong> and 2008.<br />
.2.1 Fert l ty Var at on n a Douglasfir<br />
Seed Orchard as Determ ned<br />
by DNA F ngerpr nt ng: an<br />
Update<br />
Ben La , Annette Van N ejenhu s, and<br />
Yousry A. El-Kassaby<br />
Because seed orchards represent the main sources of<br />
genetically improved seed for most artificially regenerated<br />
forests, they play an important interface role between tree<br />
breeding and silvicultural activities. The production of seed<br />
crops with high genetic quality (gain and diversity) in all<br />
BC orchards is critical to the success of tree improvement<br />
programs and to meeting the genetic quality required under<br />
the Chief Forester’s Standards for Seed (2005).<br />
This project is part of a larger initiative started by the<br />
BC Ministry of Forests and Range, the forest industry,<br />
and academia aimed at obtaining accurate estimates of the<br />
genetic quality of seedlots. Genetic quality is defined as the<br />
level of genetic gain combined with the degree of genetic<br />
diversity. Orchard managers routinely assess these estimates,<br />
and estimates such as genetic worth (GW) and effective<br />
population size (N e ) are an integral part of the evaluation of<br />
seed-orchard crops.<br />
DNA fingerprinting technology coupled with methods<br />
of pedigree reconstruction will be used to obtain accurate<br />
estimates of the genetic contribution to a specific seedlot<br />
of each parent in Western Forest Products’ Douglas-fir seed<br />
orchard. These estimates will be compared with survey<br />
assessment methods that are based on visual inspection<br />
of trees’ reproductive output. Additionally, the use of<br />
DNA technology will permit the estimation of pollen<br />
contamination from outside sources and the effectiveness of<br />
orchard management practices such as supplemental mass<br />
pollination (SMP) and over-head cooling (bloom delay).<br />
71
During this first year, the seed orchard parental<br />
population (53 clones) and the SMP parents were<br />
fingerprinted. Additionally, DNA samples from 1,300 pairs<br />
of megagametopytes (haploid) and their corresponding<br />
embryos (diploid) were extracted from a random sample of<br />
the orchard’s bulk seed, and their fingerprinting is expected<br />
to be completed during the second year.<br />
Two data analyses approaches will be attempted,<br />
one utilizing a computer program that was developed<br />
specifically to handle bulk seed, and the second utilizing a<br />
program developed by Slavov et al., 2005. These analyses<br />
are expected to allow the determination of every clone’s<br />
gametic contribution.<br />
The results will aid in the accurate estimation of the<br />
genetic worth and diversity of the orchard’s seedlot by<br />
relating the DNA results to the visual assessments of<br />
reproductive output. The resulting correlations will be used<br />
to assess the various survey methods and to calibrate survey<br />
methodologies as appropriate.<br />
72<br />
.3 Mounta n P ne Beetle<br />
Incremental <strong>Project</strong>s<br />
.3.1 Pollen Management n<br />
Lodgepole P ne Orchards:<br />
<strong>Project</strong> 0 72 E<br />
George N cholson<br />
Young lodgepole pine orchards produce very little pollen in<br />
the early years. This project was designed to collect pollen<br />
from the older Thompson Okanagan 310 orchard and<br />
reapply it to the young ramets in orchard 339.<br />
The pollen was vacuum collected, and this allowed us to<br />
reapply the pollen in the same season. We collected a total<br />
of 10 litres of pollen and applied three litres to the orchard.<br />
The balance of the pollen was put into freezer storage for<br />
future use.<br />
T R E E I M P R O V E M E N T P R O G R A M<br />
P R O J E C T R E P O R T 2 0 0 6 / 2 0 0 7<br />
.3.2 Effect ve Crown Prun ng<br />
n Lodgepole P ne: <strong>Project</strong><br />
0 7E2<br />
George N cholson<br />
This is a multi-year project designed to stimulate cone<br />
production in the top third of the crown. Both top and<br />
upper lateral branches were pruned.<br />
We used mechanical shears to prune in most cases or a<br />
small chain saw if stem diameter was too large. The level of<br />
pruning in the orchards may reduce the cone production in<br />
the year following, but this effect will not be long lasting.<br />
During the fall of <strong>2006</strong>, a total of 580 ramets were<br />
top and lateral-branch pruned in the mature Thompson<br />
Okanagan 310 orchard. We will top prune a further 1,000<br />
ramets in orchard 339 in <strong>2007</strong> and 1,500 ramets in 2008.<br />
The top pruning in the younger orchard will help control the<br />
ramet height and increase the number of potential cone sites.<br />
.3.3 Upgrad ng of Lodgepole P ne<br />
Super or Provenance Seed:<br />
<strong>Project</strong> 0 7E26<br />
Dave Kolotelo<br />
This project attempted to upgrade the germination of a<br />
lodgepole pine superior provenance (Rocky Mountain<br />
Trench) seed lot (2612 – collected 1972). In the past this<br />
seed lot was approved for disposal for reasons associated<br />
with poor germination (64 percent). It is an atypical seed<br />
lot because its dry (D1) test has consistently performed<br />
better than a stratified (G20) test. An inventory of 96 kg<br />
of seed (equivalent to approximately 5.5 million seedlings)<br />
exists, and we attempted to upgrade the seed lot because of<br />
its size and its expanded range (BSH; EK; MRB; SA; TOD<br />
and WK seed planning zones).<br />
Seed-lot evaluations indicated the presence of<br />
mechanical seed-coat damage, seed-coat chitting, and<br />
heat damage. We used liquid separation of a partially<br />
imbibed product and pre-vac to try and remove this<br />
fraction (referred to as poor). The table following provides<br />
an overview of the processing results. Germination of the<br />
upgraded fraction increased only slightly (67 to 70 percent),
ut there was a substantial decrease in potential seedlings.<br />
We found no fungal contamination (Fusarium spp.) or<br />
infection (Caloscypha fulgens) in any of the seed fractions.<br />
The liquid separation was not very efficient because the<br />
poor fraction still germinated at 43 percent, although with<br />
the attempt to remove the chitted seed, we expected that<br />
some germination would occur in the poor fraction. We<br />
don’t consider this effort a success, and future upgrading<br />
efforts with seed lots of similar seed characteristics and<br />
quality are likely to produce similar results.<br />
Portion Volume Pot. <strong>Tree</strong>s D1 GC W1 GC G20 GC<br />
CONTROL 96.0 Kg 6.36 M 67% 50% 39%<br />
Upgraded 80.3 Kg 5.48 M 70% 42% 40%<br />
Poor 15.5 Kg 0.62 M 43% 29% 18%<br />
Table 2 .<br />
.3. Eng neer ng Consultat on<br />
for K ln and/or Controller<br />
Upgrades: <strong>Project</strong> 0 7E27<br />
Dave Kolotelo<br />
The funds for to this project were allocated to two separate<br />
kiln projects:<br />
a) training and upgrades to our ARGUS Control System<br />
b) engineering evaluation of our kiln<br />
With regard to our ARGUS system, we had a meeting<br />
with one of the manufacturer’s technicians/programmers<br />
to better understand the operational complexities of our<br />
kiln programming. We also invested in an upgrade to our<br />
ARGUS software, including some application engineering<br />
time.<br />
To obtain an engineering evaluation of our kiln,<br />
we extended an invitation to quote, and the successful<br />
company was Custom Air Conditioning Ltd. The primary<br />
issues addressed were the inability to maintain humidity<br />
levels and the inability to keep temperatures within the kiln<br />
at the desired set points. A thorough investigation of the<br />
mechanical system determined that:<br />
a) all components were operating properly<br />
T R E E I M P R O V E M E N T P R O G R A M<br />
P R O J E C T R E P O R T 2 0 0 6 / 2 0 0 7<br />
b) the temperature variation was within acceptable<br />
parameters (± 2°F)<br />
c) the burner completely shuts down after reaching set point<br />
d) high temperature overshoot is attempted to be overcome<br />
by venting<br />
e) humidity set points are not achievable over the duration<br />
of the kiln<br />
f) the burner system is antiquated and not energy efficient<br />
by today’s standards<br />
The engineering recommendation is that even with<br />
significant modifications to our existing kiln, we will not<br />
be able to maintain both temperature and humidity set<br />
points. At 21 years of age and without any modifications,<br />
our existing kiln design is perhaps beyond its period of useful<br />
life. The recommendation is to remove the existing burner<br />
configuration and replace it with a packaged dehumidifier<br />
system (heat pump) with the ability to add steam to the kiln.<br />
This is a very energy efficient system and will reduce natural<br />
gas use.<br />
The total cost of this improvement is in the range<br />
of $75,000 to $100,000, and equipment delivery and<br />
installation would require approximately 17-22 weeks. No<br />
other minor changes were recommended, and that is why the<br />
project spent only about 60 percent of the allotted funding.<br />
6.0 Extens on and<br />
Commun cat ons<br />
6.1 ETAC Extens on and<br />
Commun cat ons<br />
D ane Douglas<br />
F eld Tours and Workshops<br />
• Prince George area field tour – Anna Monetta with the<br />
Northern Silviculture Committee (NSC) approached<br />
ETAC regarding a Forest Genetics field tour following<br />
the June NSC on June 22, <strong>2006</strong>. The tour was a<br />
resounding success, with registration logistics handled<br />
by Rob Bryce of UNBC and excellent presentations by<br />
Michael Carlson, Barry Jaquish, and Richard Reich.<br />
David Reid and Rita Wagner hosted the tour of PGTIS.<br />
73
7<br />
New picnic tables, planters, and some painting made the<br />
site look great despite all the destruction by MPB.<br />
There were young foresters, lots of interest, and lots of<br />
questions. The tour ran from 8:00 to 3:30. Attendees<br />
numbered approximately 45 – 50.<br />
• Interior Pollen Management Workshop – Dr. Joe<br />
Webber conducted the workshop on November 22 and<br />
23 at VSOC in Vernon with 27 people in attendance.<br />
Publ cat ons<br />
• “<strong>Tree</strong> <strong>Improvement</strong> in BC” posters are now available<br />
in three formats: 24” x 36” poster, 11” and 18” poster,<br />
and single-page handouts. They are also available on the<br />
Forest Genetics website. http://www.fgcouncil.bc.ca/<br />
<strong>Tree</strong>-Improv-8x11.pdf<br />
• The first draft of the “Spruce Manual for Seed<br />
Orchardists” was prepared by Jodie Krakowski and John<br />
King.<br />
F gure 7 . Pr nce George area forest genet cs field tour.<br />
T R E E I M P R O V E M E N T P R O G R A M<br />
P R O J E C T R E P O R T 2 0 0 6 / 2 0 0 7<br />
• “Conifer Reproductive Cycle” diagrams and illustrations<br />
were colorized and will be made available via the web.<br />
• “Extension Note 9, Increasing Quality Seed Production<br />
in Western Redcedar Orchards: A Synthesis of a multiyear<br />
folia applied gibberellin A3 study” by John Russell<br />
and Oldrich Hak was completed. Copies have been<br />
printed for distribution, and it is also available at on the<br />
web.<br />
• “TICtalk – Volume 7” was available in December <strong>2006</strong>.<br />
Initially, the newsletter was web based only. However,<br />
150 copies have also been printed for distribution at<br />
field days and workshops. http://www.fgcouncil.bc.ca/<br />
Tictalk_Dec<strong>2006</strong>-Final-Web.pdf<br />
• The publication “The Reproductive Biology of Western<br />
Larch”, in preparation by the the Inland Empire <strong>Tree</strong><br />
<strong>Improvement</strong> Community will be published and printed<br />
by ETAC.
7.0 Seed Orchard Pest<br />
Management<br />
Robb Bennett<br />
The Seed Orchard Pest Management Subprogram supports<br />
research, extension activities, and pest management<br />
operations to increase orchard yields of high quality seed.<br />
A Ministry of Forests and Range (MFR) Research Branch<br />
scientist (Dr. Ward Strong) leads the research component.<br />
MFR <strong>Tree</strong> <strong>Improvement</strong> Branch personnel (Jim Corrigan<br />
and Dr. Robb Bennett) deliver extension services. Seed<br />
orchard personnel handle operational activities. The Pest<br />
Management Technical Advisory Committee (PMTAC)<br />
guides investments and activities. The PMTAC is<br />
<strong>Project</strong><br />
Conifer seed bug (Leptoglossus<br />
occidentalis): damage control<br />
methods<br />
Fir coneworms (Dioryctria spp.):<br />
Identification of an effective sex<br />
pheromone lure and the<br />
demonstration of its efficacy in seed<br />
orchards<br />
Fusarium fungi: reducing<br />
infections in orchard seed<br />
-determining infection mechanisms<br />
Conifer adelgids (Adelges and Pineus<br />
spp.): species composition, biology,<br />
and density/damage relationships<br />
Systemic insecticides: tests for cone<br />
and seed insect control<br />
Table 29.<br />
T R E E I M P R O V E M E N T P R O G R A M<br />
Species primarily impacted<br />
All Pinaceae<br />
Fdi, Fdc, Sx<br />
All species<br />
Sx, Lw, Fdi, Fdc, Pw<br />
All species<br />
P R O J E C T R E P O R T 2 0 0 6 / 2 0 0 7<br />
comprised of members from MFR Research and <strong>Tree</strong><br />
<strong>Improvement</strong> Branches, the Canadian Forest Service,<br />
private seed orchards, universities, and the Forest Genetics<br />
Council.<br />
Research plans and budgets are established through an<br />
annual process of proposal development and discussions<br />
by the PMTAC. Priority issues not currently being<br />
addressed through this process are subject to a public<br />
call for proposals. Currently (<strong>2006</strong>/07) the PMTAC is<br />
administering projects on Leptoglossus seed bugs, Dioryctria<br />
cone worms, Fusarium fungi, adelgids, mountain pine<br />
beetle, systemic pesticides, a cone crop monitoring system,<br />
and a cone and seed insect field guide. <strong>Project</strong>s showing<br />
significant progress in <strong>2006</strong>/07 fiscal year are summarized<br />
below.<br />
Progress<br />
Demonstrated that Leptoglossus seedbugs find<br />
hosts through infrared detection and respond to<br />
vibrational stimuli when on hosts. Based on this a<br />
novel trap is being developed<br />
Pheromone characterization completed. Refinements<br />
to production methodology underway. Adult<br />
monitoring conducted throughout field season to<br />
determine flight period on coast and in interior<br />
Work completed. Summary report encapsulating<br />
results of several related projects has been drafted<br />
for publication.<br />
Initial species composition and population<br />
parameters analysis completed<br />
The second year of pesticide trials at coastal and<br />
interior sites produced inconclusive results. Based<br />
on this, the trials were restructured to look at new<br />
injectable formulations<br />
7
76<br />
T R E E I M P R O V E M E N T P R O G R A M<br />
Append x 1 FGC Seed Plann ng Un ts<br />
<br />
<br />
<br />
<br />
<br />
<br />
<br />
<br />
<br />
<br />
<br />
<br />
<br />
<br />
<br />
<br />
<br />
<br />
<br />
<br />
<br />
<br />
<br />
<br />
<br />
<br />
<br />
<br />
<br />
<br />
<br />
<br />
<br />
<br />
<br />
<br />
<br />
<br />
<br />
<br />
<br />
<br />
<br />
<br />
<br />
<br />
<br />
<br />
<br />
<br />
<br />
<br />
<br />
<br />
<br />
<br />
<br />
<br />
<br />
<br />
<br />
<br />
P R O J E C T R E P O R T 2 0 0 6 / 2 0 0 7
Append x 2 <strong>Tree</strong> Spec es<br />
T R E E I M P R O V E M E N T P R O G R A M<br />
CONIFERS LATIN NAME ABBREVIATIONS<br />
western redcedar Thuja plicata Cw<br />
yellow-cedar Chamaecyparis nootkatensis Yc<br />
Douglas-fir Pseudotsuga menziesii Fdc<br />
Interior Douglas-fir Pseudotsuga menziesii var. glauca Fdi<br />
amabilis fir Abies amabilis Ba<br />
grand fir Abies grandis Bg<br />
noble fir Abies procera Bp<br />
subalpine fir Abies lasiocarpa Bl<br />
mountain hemlock Tsuga mertensiana Hm<br />
western hemlock Tsuga heterophylla Hw<br />
Rocky Mtn. juniper Juniperus scopulorum Jr<br />
alpine (subalpine) larch Larix lyallii La<br />
western larch Larix occidentalis Lw<br />
limber pine Pinus flexilis Pf<br />
lodgepole pine Pinus contorta Pl<br />
lodgepole pine Pinus contorta var. latifolia Pli<br />
ponderosa pine Pinus ponderosa Py<br />
shore pine Pinus contorta var. contorta Plc<br />
western white pine Pinus monticola Pw<br />
whitebark pine Pinus albicaulis Pa<br />
Engelmann spruce Picea engelmannii Se<br />
Sitka spruce Picea sitchensis Ss<br />
white spruce Picea glauca Sw<br />
spruce hybrid (Interior spruce/s) Picea cross (Se and Sw mixtures) Sx<br />
Sitka x unknown hybrid Picea sitchensis x Sxs<br />
western (Pacific) yew Taxus brevifolia Tw<br />
HARDWOODS<br />
red alder Alnus rubra Dr<br />
black cottonwood Populus b. ssp. trichocarpa Act<br />
hybrid poplars Populus spp. Ax<br />
trembling aspen Populus tremuloides At<br />
paper birch Betula papyrifera Ep<br />
Garry oak Quercus garryana Qg<br />
P R O J E C T R E P O R T 2 0 0 6 / 2 0 0 7<br />
77
7<br />
T R E E I M P R O V E M E N T P R O G R A M<br />
Append x 3 D scuss ons by <strong>Tree</strong> Spec es<br />
CONIFERS ABBREVIATION PAGE LOCATIONS<br />
subalpine fir Bl 11<br />
western redcedar Cw 11, 20, 23, 36, 58<br />
coastal Douglas-fir Fdc 8-9, 20, 23, 34, 71<br />
interior Douglas-fir Fdi 13-14, 29, 40<br />
western hemlock Hw 10, 21, 24, 35, 49-52<br />
western larch Lw 16<br />
lodgepole pine Pli 5, 17, 29, 31, 32, 34, 42-44, 47-48, 52-53, 59-63, 63-69, 72<br />
ponderosa pine Py 17<br />
western whitepine Pw 6, 12, 17, 23, 24<br />
sitka spruce Ss 10, 22, 49-52<br />
spruce hybrid (interior spruce/s) Sx 15, 31, 32, 40, 54-58<br />
yellow cedar Yc 11, 22, 39, 45, 46, 71<br />
BROADLEAVES<br />
black cottonwood Act 13<br />
red alder Dr 13<br />
paper birch Ep 17<br />
bigleaf maple Mb 13<br />
PEST<br />
Adelgids 75<br />
Dioryctria spp. 75<br />
Fusarium 59, 75<br />
Leptoglossus occidentalis 75<br />
Pythium 59<br />
P R O J E C T R E P O R T 2 0 0 6 / 2 0 0 7
Append x Author Contact L st<br />
T R E E I M P R O V E M E N T P R O G R A M<br />
CONTRIBUTOR AFFILIATION TELEPHONE NUMBER<br />
Aitken, Sally UBC 604-822-6020<br />
Ashley, Valerie MFR 250-260-4753<br />
Barber, Brian MFR 250-356-0888<br />
Bennett, Robb MFR 250-652-6593<br />
Berger, Vicky MFR 250-260-4767<br />
Bird, Keith MFR 250-749-6811<br />
Brown, Patti CFP 604-885-5905<br />
Carlson, Michael MFR 250-260-4767<br />
Carson, Don MFR 250-749-6811<br />
Cartwright, Charlie MFR 250-387-6477<br />
Cox, Keith MFR 250-835-8626<br />
Crowder, Tim TimberWest 250-652-4211<br />
Douglas, Diane MFR 250-356-6721<br />
Draper, Dale MFR 250-387-3179<br />
El-Kassaby, Yousry UBC 604-822-1821<br />
Elmslie, John Winton Global 250-960-3933<br />
Ferguson, Craig MFR 250-749-6811<br />
Gaudet, Dan VSOC 250-542-0833<br />
Giampa, Gary MFR 250-549-5576<br />
Graham, Hilary PRT 250-546-6713<br />
Griffin, Mark MFR 250-749-6811<br />
Hak, Oldrich Contractor 250-727-3989<br />
Hansinger, Rick KRSO 250-493-6373<br />
Hayton, Lisa MFR 250-387-5443<br />
Hooge, Bonnie MFR 250-963-8416<br />
Hunt, Rich CFS 250-746-7259<br />
Jaquish, Barry MFR 250-260-4766<br />
King, John MFR 250-387-6476<br />
Kolotelo, Dave MFR 604-541-1683<br />
Lai, Ben UBC 604-822-1821<br />
Lohr, Carolyn MFR 250-652-5600<br />
McAuley, Leslie MFR 250-356-6208<br />
Murphy, John MFR 250-260-4767<br />
Nicholson, George Tolko 250 546-2296<br />
Ogg, John MFR 250-749-6811<br />
O’Neill, Greg MFR 250-260-4776<br />
Phillips, Giselle MFR 250 260 4756<br />
Pieper, Greg Tolko 250 546-2296<br />
Ponsford, Dave MFR 250 387-1058<br />
Reid, David MFR 250-652-5600<br />
Russell, John MFR 250-749-6811<br />
Stoehr, Michael MFR 250-356-6209<br />
Thomas, Keith MFR 25-356-1127<br />
Van Neijenhuis, Annette WFP 250-652-4023<br />
P R O J E C T R E P O R T 2 0 0 6 / 2 0 0 7<br />
79
0<br />
T R E E I M P R O V E M E N T P R O G R A M<br />
CONTRIBUTOR AFFILIATION TELEPHONE NUMBER<br />
Van den Driessche, Robert contractor not available<br />
Von Aderkas, Patrick UVic 250-721-8926<br />
Wagner, Rita MFR 250 963-8416<br />
Wagner, Tia VSOC 250-542-0833<br />
Walsh, Chris MFR 250-260-4777<br />
Webber, Joe MFR 250-537-8871<br />
Woods, Jack SelectSeed 250-748-9579<br />
Xie, Chang-Yie MFR 250-387-8911<br />
P R O J E C T R E P O R T 2 0 0 6 / 2 0 0 7
INSIDE COVER
<strong>2006</strong>/<strong>2007</strong> Forest Genetics Council of BC <strong>Tree</strong> <strong>Improvement</strong> <strong>Program</strong> <strong>Project</strong> <strong>Report</strong>