SMART GROWING CELLS - FH Wedel
SMART GROWING CELLS - FH Wedel
SMART GROWING CELLS - FH Wedel

Create successful ePaper yourself
Turn your PDF publications into a flip-book with our unique Google optimized e-Paper software.
<strong>SMART</strong> <strong>GROWING</strong> <strong>CELLS</strong><br />
Hendrik Annuth, Christian-A. Bohn<br />
Computer Graphics & Virtual Reality, <strong>Wedel</strong> University of Applied Sciences, Feldstr. 143, <strong>Wedel</strong>, FR Germany<br />
annuth@fh-wedel.de, bohn@fh-wedel.de<br />
Keywords: Neural networks, unsupervised learning, self-organization, growing cells structures, surface reconstruction.<br />
Abstract: General unsupervised learning or self-organization places n-dimensional reference vectors in order to match<br />
the distribution of samples in an n-dimensional vector space. Beside this abstract view on self-organization<br />
there are many applications where training — focused on the sample distribution only — does not lead to a<br />
satisfactory match between reference cells and samples.<br />
Kohonen’s self-organizing map, for example, overcomes pure unsupervised learning by augmenting an additional<br />
2D topology. And although pure unsupervised learning is restricted therewith, the result is valuable in<br />
applications where an additional 2D structure hidden in the sample distribution should be recognized.<br />
In this work, we generalize this idea of application-focused trimming of ideal, unsupervised learning and<br />
reinforce it through the application of surface reconstruction from 3D point samples. Our approach is based<br />
on Fritzke’s growing cells structures (GCS) (Fritzke, 1993) which we extend to the smart growing cells (SGC)<br />
by grafting cells by a higher-level intelligence beyond the classical distribution matching capabilities.<br />
Surface reconstruction with smart growing cells outperforms most neural network based approaches and it<br />
achieves several advantages compared to classical reconstruction methods.<br />
1 INTRODUCTION<br />
The idea of developing the smart growing cells approach<br />
is driven by the need for an algorithm for<br />
robust surface reconstruction from 3D point sample<br />
clouds.<br />
The demand for efficient high quality reconstruction<br />
algorithms has grown significantly in the last<br />
decade, since the usage of 3D point scans has widely<br />
been spread into new application areas. These include<br />
geometric modeling to supplement interactive<br />
creation of virtual scenes, registering landscapes for<br />
navigation devices, tracking of persons or objects in<br />
virtual reality applications, medicine, or reverse engineering.<br />
3D points, retrieved by laser scanners or stereo<br />
cameras, introduce two vital questions. First, how<br />
can one recognize a topology of the originating 2D<br />
surfaces just from independent 3D sample points and<br />
without any other information from the sampled objects?<br />
Second, for further processing, how is it pos-<br />
sible to project this topological information on a data<br />
structure like a triangle mesh — meeting given constraints<br />
concerning mesh quality and size?<br />
Although this issue has intensely been tackled<br />
since the early eighties (Boissonnat, 1984) a general<br />
concept that addresses all the problems of surface<br />
reconstruction has not been determined up to now.<br />
Noise contained in the sample data, anisotropic point<br />
densities, holes and discontinuities like edges, and finally,<br />
handling vast amounts of sampling data with<br />
adequate computing resources are still a big challenge.<br />
Previous work. The issue of surface reconstruction<br />
is a major field in computer graphics. There are numerous<br />
approaches with different algorithmic concepts.<br />
In (Hoppe et al., 1992) and (Hoppe, 2008) an<br />
implicit surface is created from point clouds which<br />
then is triangulated by the marching cubes approach.<br />
(Edelsbrunner and Mcke, 1994) and (Kolluri et al.,<br />
2004) reduce a delaunay tetrahedralization of a point
cloud until the model is carved out. Approaches like<br />
(Storvik, 1996) or (Huang et al., 2007) utilize techniques<br />
based on the Bayes’ theorem.<br />
In the area of artificial neural networks a famous<br />
work is (Kohonen, 1982). They propose the Self Organizing<br />
Map (SOM) which iteratively adapts its internal<br />
structure — a 2D mesh — to the distribution of<br />
a set of samples and enables clustering or dimensionality<br />
reduction of the sample data. While a SOM has<br />
a fixed topology, the growing cells structures concept<br />
(Fritzke, 1993; Fritzke, 1995) allows the network for<br />
dynamically fitting its size to the sample data complexity.<br />
SOM and GCS are suitable for processing<br />
and representing vector data like point samples on<br />
surfaces. (Hoffmann and Vrady, 1998) uses a SOM<br />
and (Vrady et al., 1999) and (Yu, 1999) a GCS for the<br />
purpose of surface reconstruction. Further improvements<br />
are made by (Ivrissimtzis et al., 2003b) where<br />
constant Laplacian smoothing (Taubin, 1995) of surfaces<br />
is introduced, and in (Ivrissimtzis et al., 2003a)<br />
the curvature described by the input sample distribution<br />
is taken to control mesh density. In (Ivrissimtzis<br />
et al., 2004a) the GCS reconstruction process is further<br />
enhanced in order to account for more complex<br />
topologies. (Ivrissimtzis et al., 2004b) use several<br />
meshes of the same model for a mesh optimization<br />
process, and (Yoon et al., 2007) present a concept for<br />
combining common deterministic approaches and the<br />
advantages of the GCS approach.<br />
Overview. In the following, we outline the basis of<br />
our approach — the growing cells structures — and<br />
then derive our idea of the smart growing cells, which<br />
matches the specific requirements of reconstruction.<br />
Afterwards, an analysis is compiled discussing mesh<br />
quality and performance of our approach, and finally,<br />
we close with a summary and a list of future options<br />
of this work.<br />
2 RECONSTRUCTION WITH<br />
<strong>SMART</strong> <strong>GROWING</strong> <strong>CELLS</strong><br />
Classical growing cells approaches for reconstruction<br />
tasks are based on using the internal structure of the<br />
network as a triangulation of the object described by a<br />
set of surface sample points. A 2D GCS with 3D cells<br />
is trained by 3D points. Finally, the cells lie on the<br />
object surface which the 3D points represent and the<br />
network structure — a set of 2D simplices (triangles)<br />
— is directly taken as triangulation of the underlying<br />
3D object.<br />
The reason for using a GCS scheme for reconstruction<br />
tasks are its obvious advantages compared<br />
to deterministic approaches.<br />
• They can robustly handle arbitrary sample set<br />
sizes and distributions which is important in case<br />
of billions of unstructured points.<br />
• They are capable of reducing noise and ply discontinuities<br />
in the input data.<br />
• They are capable of adaption — it is not required<br />
to regard all points of the sample set on the whole.<br />
Further, incrementally retrieved samples can be<br />
used to retrain the network without starting the triangulation<br />
process from scratch.<br />
• They guarantee to theoretically find the best solution<br />
possible. Thus, approximation accuracy and<br />
mesh quality are automatically maximized.<br />
Nevertheless, these advantages partly clash with the<br />
application of reconstruction. On the one hand, discontinuities<br />
are often desired (for example, in case of<br />
edges or very small structures on object surfaces). On<br />
the other hand, smoothing often destroys important<br />
aspects of the model under consideration (for example,<br />
if holes are patched, if separate parts of the underlying<br />
objects melt into one object, or if the object<br />
has a very complex, detailed structure). In such cases,<br />
GCS tend to generalize which may be advantageous<br />
from the physical point of view, but which mostly lets<br />
vanish visually important features which the human is<br />
quite sensitized to.<br />
The presented smart growing cells approach accounts<br />
for these application-focused issues and emphasizes<br />
that modification of the general learning task<br />
in the classical GCS is suitable for many novel application<br />
fields.<br />
2.1 Unsupervised Learning and<br />
Growing Cells Structures<br />
General unsupervised learning is very similar to kmeans<br />
clustering (MacQueen, 1967) which is capable<br />
of placing k n-dimensional reference vectors<br />
in a set of n-dimensional input samples such that<br />
they are means of those samples which lie in the ndimensional<br />
Voronoi volume of the reference vectors.<br />
Adaption of reference vectors is accomplished by<br />
randomly presenting single n-dimensional samples<br />
from the input sample set to the set of n-dimensional<br />
reference vectors and moving them in n-dimensional<br />
space, described as follows.
Place k reference vectors ci ∈ R n , i ∈ {0..k −<br />
1} randomly in nD space of input samples.<br />
repeat<br />
Chose sample s j ∈ R n randomly from the<br />
input set.<br />
Determine reference vector cb (best<br />
matching or winning unit) closest to s j.<br />
Move cb in the direction of s j according to<br />
a certain strength εbm, like cnew b = cold<br />
b (1 −<br />
εbm) + s j · εbm.<br />
Decrease εbm.<br />
until εbm ≤ certain threshold ε0.<br />
Surface reconstruction with pure unsupervised learning<br />
would place a set of reference vectors on object<br />
surfaces, but does not determine information about<br />
the underlying surface topology. This leads to the Kohonen<br />
Self Organizing Map.<br />
Kohonen self organizing map. The SOM is based<br />
on reference vectors which now are connected as a<br />
regular 2D mesh. The learning rule is extended to account<br />
for the direct neighborhood of a best matching<br />
unit as follows.<br />
for all cnb ∈ neigborhood of cb do<br />
Move cnb in the direction of s j accord-<br />
ing to a certain strength εnb, like c new<br />
nb =<br />
c old<br />
nb (1 − εnb) + s j · εnb.<br />
Decrease εnb.<br />
end for<br />
Insertion of this neighborhood loop into the general<br />
unsupervised learning algorithm (after moving of cb)<br />
leads to the phenomenon that the reference vertices<br />
now are moved by accounting for the regular 2D mesh<br />
topology of the SOM. Training a plane-like sample<br />
set leads to an adaption of the SOM grid to this implicit<br />
plane — the sample topology is recognized and<br />
finally represented by the SOM mesh.<br />
Nevertheless, the mesh size of a SOM is fixed<br />
and cannot adjust to the sample structure complexity.<br />
The growing cells structures approach overcomes this<br />
drawback.<br />
Growing cells structures. To a certain degree, GCS<br />
may be seen as SOM which additionally are capable<br />
of growing and shrinking according to the problem<br />
under consideration which is defined by the sample<br />
distribution. This mechanism is based on a so<br />
called resource term contained in every reference vector<br />
and which — in the original approach — is a sim-<br />
ple counter. It counts the reference vector being a best<br />
matching unit. A high counter value signalizes the requirement<br />
for insertion of new reference vectors.<br />
With a GCS we could train a sample set lying<br />
on a certain object surface and the network structure<br />
would fit the object surface at a certain approximation<br />
error. The problem is that in reconstruction tasks<br />
sample distributions are often not uniform. The represented<br />
surfaces usually contain discontinuities like<br />
sharp edges and holes, and the objects to be reconstructed<br />
are not that simple like a plane or a tetrahedron<br />
— which usually are chosen as initial network<br />
and which can hardly adapt to complex topologies.<br />
Only objects which are homeomorphic to the start object<br />
can be represented satisfactorily.<br />
Thus, general unsupervised learning should<br />
evolve to a kind of constrained unsupervised learning<br />
which detects and adapts to certain structures which<br />
the sample set implicitly contains.<br />
2.2 Smart Growing Cells<br />
Smart growing cells are an application-focused, sixway<br />
adaption of the general learning scheme of the<br />
classical growing cells structures approach. The SGC<br />
repeat<br />
for j = 1 to kdel do<br />
for i = 1 to kins do<br />
Choose sample s from point cloud randomly,<br />
find closest neural vertex and<br />
move it together with neighbor vertices<br />
towards s.<br />
Increase signal counter at s (the resource<br />
term mentioned above) and decrease<br />
the signal counters of all other<br />
vertices.<br />
end for<br />
Find best performing neural vertex (with<br />
highest signal counter value) and add<br />
new vertex at this position (see Fig. 2).<br />
end for<br />
Find worst performing neural vertices,<br />
delete them and collapse regarding edges<br />
(see Fig. 2).<br />
until certain limit like approximation error, or<br />
number of vertices is reached.<br />
Figure 1: Classical growing cells structures algorithm.
asic structure is identical to general GCS. There are<br />
n-dimensional cells which we now term neural vertices<br />
connected by links through an m-dimensional<br />
topology.<br />
We let n = 3 since neural vertices are directly<br />
taken as vertices of the triangulation mesh and m = 2<br />
since we aim at 2D surfaces to be reconstructed.<br />
The main training loop is outlined in Fig. 1. Here<br />
kdel and kins are simple counter parameters defined<br />
below (see section 2.3). Movements of vertices and<br />
their neighbors slightly differ from the classical SOM.<br />
Again, there are two parameters for the learning rates,<br />
εbm for the winner and εnb for its neighbors, but these<br />
are not decreased during learning since vertex connections<br />
automatically become smaller together with<br />
the learning rates. For drawing the neighboring vertices,<br />
a smoothing process like described in (Ivrissimtzis<br />
et al., 2003b) and (Taubin, 1995) is applied,<br />
which replaces the classical movement, and which<br />
makes the adaption of the topology more robust.<br />
As initial network, usually a tetrahedron or a plane<br />
with random vertices is suitable.<br />
Vertex split. A neural vertex split operation adds<br />
three edges, two faces, and a new neural vertex. The<br />
longest edge at the neural vertex with the highest resource<br />
term is split and a new vertex is added in the<br />
middle. The signal counter value is equally spread<br />
between the two vertices (see Fig. 2).<br />
Edge collapse. All neural vertices with resource<br />
terms below a certain threshold rmin are removed together<br />
with three edges and two connected faces (see<br />
Fig. 2). The determination of the edge to be removed<br />
is driven by connectivity irregularities as proposed in<br />
(Ivrissimtzis et al., 2003b).<br />
It follows our adaption of the mentioned learning<br />
cycle by six modifications driven by the application<br />
needs of surface reconstruction.<br />
2.2.1 Cell Weeding<br />
Aggressively deleting neural vertices which are not<br />
part of a sound underlying mesh structure is the most<br />
important new training rule of the SGC approach.<br />
It is essential for giving the network the chance of<br />
adapting to any topology despite of its initial topology<br />
(overcoming the homomorphic restriction). Before<br />
the edge collapse operation is applied at a vertex,<br />
it will be tested if the vertex is contained in a degenerated<br />
mesh region (definition follows below). If so,<br />
an aggressive cut out of the vertex and its surrounding<br />
vertices is started.<br />
Figure 2: Neural vertex split operation (from left to right) to<br />
increase mesh granularity locally, and edge collapse (from<br />
right to left) to shrink mesh locally.<br />
It has been shown that degeneration of a part of<br />
a mesh serves as perfect indicator for a mesh topology<br />
which does not fit the underlying sample structure<br />
correctly. For example, consider a region where<br />
sample densities equal zero. Although vertices are<br />
not directly drawn into it by training adjustment, their<br />
neighbors may be moved there through their mesh<br />
connections. Due to their resource terms, these vertices<br />
will be deleted by edge collapse operations, but<br />
their links remain and mistakenly represent the existence<br />
of some topology. In this case, the structure of<br />
the links is degenerated, i.e., it usually shows a surpassing<br />
number of edges with acute-angled 1 vertices<br />
(see Fig. 3).<br />
The reason for terming this deletion ”aggressive”<br />
are the triggering properties which are easy to match<br />
— suspicious neural vertices will be cut out early.<br />
Criterion for degenerated mesh regions. In (Ivrissimtzis<br />
et al., 2004a) a large area of a triangle is<br />
taken as sign for a degenerated mesh structure, but<br />
it has been shown that this criterion warns very late.<br />
1 A triangle is termed acute-angled if the ratio of its area<br />
and the area which is spanned by a second equilateral triangle<br />
built from the longest edge of the first lies below a<br />
certain threshold εacute.<br />
Figure 3: Statue’s bottom is not represented by samples. On<br />
the right, the acute-angled triangles expose a degenerated<br />
mesh region.
Figure 4: Curing a boundary with a spike.<br />
Also, anisotropic sample densities are mistakenly interpreted<br />
as degenerated mesh regions. Our proposal<br />
is a combination of vertex valence 2 , triangle quality,<br />
and quality of neighboring vertices. If all of the following<br />
conditions hold, a deleting of the mesh structure<br />
at that vertex is started.<br />
1. Vertex valence rises above a certain threshold<br />
ndegvalence.<br />
2. The vertex is connected to at least ndegacute acuteangled<br />
triangles.<br />
3. The vertex has more then ndegnb neighboring vertices<br />
for which condition (1) or (2) hold.<br />
The latter condition says that deletion is only started<br />
if at least one or two neighbors have the same inconsistencies<br />
in their local mesh structure. This is reasonable<br />
since single degenerated vertices do not necessarily<br />
expose a problem but may arise by accident.<br />
Curing boundaries after weeding. It is obvious,<br />
that after an aggressive extinction of a neural vertex<br />
and its surrounding faces, a boundary will be left behind<br />
which may consist of unfavorable mesh structure<br />
elements. Curing finds these structures along the<br />
boundary and patches them discriminating between<br />
four cases.<br />
Spike. A boundary vertex with a valence of 2 (see<br />
Fig. 4) is termed spike. Such a vertex is very unlikely<br />
to support a correct reconstruction process since it<br />
will be adjusted to an acute-angled triangle after few<br />
iteration steps. A spike must be deleted completely.<br />
2 Vertex valence is the number of connected vertices.<br />
Figure 5: Cut out process of a nasty vertex.<br />
Figure 6: Cut out process of a needle eye.<br />
Nasty vertex. A nasty vertex is a neural vertex with<br />
at least nnastyacute acute-angled triangles and/or triangles<br />
with a valence greater than nnastyval (see Fig. 5).<br />
These vertices are suspected to be part of a degenerated<br />
mesh region and are deleted.<br />
Needle eye. A needle eye is a neural vertex that is<br />
connected to at least two boundaries (see Fig. 6). At<br />
these locations the mesh does not have a valid mesh<br />
structure. To delete a needle eye, all groups of connected<br />
faces are determined. From these, the group<br />
with the most faces is kept and all others are deleted.<br />
Bridge. A bridge is very likely to be part of a degenerated<br />
mesh region. If a mesh has a hole that consist<br />
of three vertices, then it would soon be closed<br />
by a coalescing process (see section 2.2.2). This is<br />
not allowed if exactly one of the edges of this hole<br />
would additionally be connected to a face (which we<br />
term “bridge”, see Fig. 7) since an invalid edge with<br />
three faces would arise. The entire bridge structure is<br />
deleted and the hole will be closed with a new face.<br />
Multiple boundary search through. After the<br />
deletion of a neural vertex by the cell weeding process<br />
the curing mechanism will search for unfavorable<br />
structures along the boundary. There is more than one<br />
boundary to be considered, if the deletion destroys a<br />
coherent set of faces and multiple separate groups of<br />
faces arise.<br />
Four cases may appear. First, the usual case with<br />
no additional boundaries. Second, when a needle<br />
Figure 7: Curing a bridge.
Figure 8: Cut out of a needle eye with a row of faces. Here,<br />
each face is not necessarily connected to another face. In<br />
contrast, if a needle eye has several groups of connected<br />
faces then there are some omissions of faces around it.<br />
eye is destroyed, the boundaries of all groups of connected<br />
faces need to be tested. Third, when surrounding<br />
faces of a vertex are interrupted by boundaries.<br />
And fourth, when a needle eye is connected to the<br />
surrounding faces of a vertex (see Fig. 8). In other<br />
words, these cases happen since the faces that are<br />
deleted may not necessarily be connected to a further<br />
face due to another deletion process.<br />
2.2.2 Coalescing Cells<br />
Like the mesh can be split through deletion of vertices,<br />
it must also be possible to merge two mesh<br />
boundaries during training. For that, a coalescing test<br />
is accomplished each time a vertex at a mesh boundary<br />
is moved.<br />
Coalescing test. It determines if two boundaries are<br />
likely to be connected to one coherent area. For that,<br />
a sphere is created with the following parameters.<br />
Given the neigboring boundary vertices v1 and v2 of<br />
cb, then we define c = 1/2(v1 +v2). A boundary normal<br />
nc is calculated as the average of all vectors originating<br />
at c and ending at neighbors of cb, where v1<br />
and v2 are not taken into account. The boundary normal<br />
can be seen as a direction pointing to the opposite<br />
side of the boundary. We define a sphere with the center<br />
at c+ncr with radius r as the average length of the<br />
edges at cb.<br />
Figure 9: Coalescing process at a mesh corner. On the left,<br />
the search process of a coalescing candidate. In the middle,<br />
one edge is created, on the right, the only face capable of<br />
being added is the corner face.<br />
Figure 10: Coalescing of two separate boundaries. In the<br />
second picture, the edge is determined, in the third, the triangle<br />
with smallest variance of edge lengths is added, in the<br />
fourth, another triangle must be added to avoid a needle eye.<br />
The coalescing condition at two boundaries hold,<br />
i.e., merging of the boundaries containing cb and q on<br />
the opposite side happens, if<br />
• q is contained in the defined sphere, and<br />
• scalar product of the boundary normals at cb and<br />
q is negative.<br />
Coalescing process. After detecting the neural vertex<br />
q to be connected with cb, the according faces<br />
must be created starting with one edge from cb to q.<br />
There are two cases which have to be considered.<br />
Corner. A corner of the same boundary arises when<br />
cb an q have one neighboring vertex in common (see<br />
Fig. 9). A triangle of the three participating vertices<br />
is created.<br />
Long side. Here, two boundaries appear to be<br />
separated. After determining the new edge, there are<br />
four possibilities for insertion of a new face containing<br />
the edge (see second picture in Fig. 10). The triangle<br />
with edge lengths which vary fewest is taken in<br />
our approach (see third picture in Fig. 10) since it is<br />
the triangle with the best features concerning triangle<br />
quality. Finally, to avoid a needle eye, a further triangle<br />
must be added — again, we take the face with<br />
the greatest edge similarity (see fourth picture in Fig.<br />
10).<br />
2.2.3 Roughness Adaption<br />
Up to now, the SGC are able to approximate an arbitrary<br />
sample set by a 2D mesh. What remains is an
Figure 11: Roughness adaption correlates surface curvature<br />
with mesh density, details of the model are exposed.<br />
efficient local adaption of the mesh density in a way<br />
that areas with a strong curvature are modeled by a<br />
finer mesh resolution (see Fig. 11). This also relieves<br />
the influence of the sample density on the mesh granularity<br />
making the SGC less vulnerable to sampling<br />
artefacts like holes or regions which are not sampled<br />
with a uniform distribution.<br />
Each time a vertex is adapted by a new sample we<br />
calculate the estimated normal nk at a neural vertex<br />
vk by the average of the normals at the surrounding<br />
faces. The curvature ck ∈ R at a vertex is determined<br />
by<br />
ck = 1 − 1<br />
nk · n (1)<br />
Nk<br />
∑<br />
∀n∈Nk<br />
with the set Nk containing the normals of the neighboring<br />
neural vertices of vk. Each time a neural vertex<br />
is selected as winner, its curvature value is calculated<br />
and a global curvature value c is adjusted. Finally, the<br />
curvature dependent resource term rk at vk is adapted<br />
through rnew k = rold<br />
k + ∆rk, and<br />
∆rk =<br />
1, if (ck < c + σr k )<br />
ck/(c + σr k ) (1 − rmin) + rmin else,<br />
(2)<br />
with the deviation σr k of the resource term rk, and a<br />
constant resource rmin that guarantees that the mesh<br />
does not completely vanish at plane regions with a<br />
very small curvature.<br />
2.2.4 Curvature Cells<br />
Each time after a vertex vc has been moved we apply<br />
a smoothing mechanism like mentioned at the beginning<br />
of section 2.2.<br />
Roughness adaption (see section 2.2.3) leads to<br />
the fact that in regions of high curvature the density<br />
of neural vertices will increase. These vertices then<br />
will get fewer sample hits, since they have a smaller<br />
Voronoi region, and thus, Laplacian smoothing is applied<br />
fewer times.<br />
We found out, that this significantly reduces mesh<br />
quality in areas of high curvature. To avoid this, neural<br />
vertices in regions with high curvature are marked<br />
as such and smoothing these is strengthened by repeating<br />
it nL times where<br />
nL = ⌊(ck − c)/σc k ⌋ − 1 (3)<br />
with ck and c like defined in section 2.2.3 and σc k the<br />
deviation of the curvature at vertex vk. The value is<br />
limited to a maximum of NL to intercept looping at<br />
extraordinary curvature values.<br />
2.2.5 Discontinuity Cells<br />
A sampled model that exposes discontinuities like<br />
edges is difficult to be approximated by the neural network<br />
mesh. Discontinuities are smoothed out since<br />
the network tries to create a surface over them. This<br />
might be acceptable in many application areas since<br />
the approximation error is fairly small, but this effect<br />
is unfavorable in computer graphics since it is clearly<br />
visible. And even worse: edges are quite common in<br />
real world scenarios.<br />
Therefore, we propose discontinuity neural vertices<br />
which, first, are only capable of moving in the<br />
direction of an object edge to represent them more<br />
properly, and second, the smoothing process is not applied<br />
to them.<br />
Recognizing those vertices is accomplished as follows.<br />
We determine the curvature values of those<br />
neighbors which have a distance of two connections<br />
from the vertex (the “second ring” of neighbors).<br />
Then the average δring of the squared differences of<br />
consecutive curvature values on the ring is calculated.<br />
If a curvature value clearly deviates from the average<br />
curvature value, then we assume that it is a<br />
discontinuity vertex if the average of the neighbors’<br />
(second ring) curvature gradient differs to a certain<br />
amount. Thus, we define a vertex vk being a discontinuity<br />
vertex if<br />
(ck > 2σc k ) ∧ (∀c ∈ Ck : δring > 4σ 2 c k ) (4)<br />
with Ck the set of curvature values of the second ring<br />
of neighbors.<br />
For approximating the edge normal we take the<br />
average of the normals of two of the neighboring vertices<br />
of vk, either those with the highest curvature<br />
value, or those which are already marked as discontinuity<br />
vertex. Finally, the normal is mirrored if the
Figure 12: A dent (left picture) on a sharp edge is solved<br />
(right picture) by an edge swap operation. Finally, connections<br />
of discontinuity vertices model object edges.<br />
edge angle lies above 180 ◦ , which is indicated by the<br />
average of the surrounding vertex normals; in the first<br />
case it points in the direction of vk.<br />
Edge swap. If two connected discontinuity vertices<br />
grow into an edge, they nicely represent this edge by<br />
a triangle edge. But if the line is interrupted by a nondiscontinuity<br />
vertex, a dent arises since this vertex is<br />
not placed on the edge. Thus, we propose an edge<br />
swap process which minimizes this effect.<br />
Each time a discontinuity vertex is moved towards<br />
a sample, the need for an edge swap operation will be<br />
determined by collecting the three consecutive faces<br />
with the most differing face normals. In case of a<br />
dent, the face in the middle is assumed to be the one<br />
which is misplaced and an edge swap operation is applied<br />
(see Fig. 12). Then, if the difference of the normals<br />
is now lower than before, edge swap is accepted,<br />
if not, the former structure is held.<br />
Edge swap results in models where finally edges<br />
are represented by mesh boundaries (see Fig. 13).<br />
2.2.6 Boundary Cells<br />
Similar to discontinuity vertices which are capable of<br />
moving to object edges, boundary vertices are able to<br />
move to the outer border of a surface (see Fig. 14).<br />
They are recognized by being part of a triangle edge<br />
which is connected to one face only.<br />
Figure 13: Discontinuity vertices focus on edges. Edge<br />
swap operations let mesh edges map to object edges.<br />
Figure 14: Mesh boundary due to the missing bottom of the<br />
statue is represented exactly by boundary cells.<br />
Then, these vertices are moved only in the direction<br />
of the boundary normal like described in section<br />
2.2.2 in order to avoid vertices just lying in the average<br />
of the surrounding samples but directly match the<br />
surface boundaries at their locations.<br />
2.3 Results<br />
For the full algorithm of this approach see the pseudocode<br />
in Fig. 15. To keep it comprehensive, the<br />
outermost loop of the algorithm is neglected, and vertex<br />
split and edge collapse operations are triggered by<br />
counters.<br />
Parameters which have been proven to be reliable<br />
for almost all sample sets we took for reconstruction<br />
are εbm = 0.1, εnb = 0.08, rmin = 0.3, εacute =<br />
0.5, ndegacute = 4, kins = 100, kdel = 5, ndegnb = 1,<br />
nnastyacute = 4, nnastyval = 3.<br />
The following results have been produced on a<br />
Dell R○ Precision M6400 Notebook with Intel R○ Core 2<br />
Extreme Quad Core QX9300 (2.53GHz, 1066MHz,<br />
12MB) processor with 8MB 1066 MHz DDR3 Dual<br />
Channel RAM. The algorithm is not parallelized.<br />
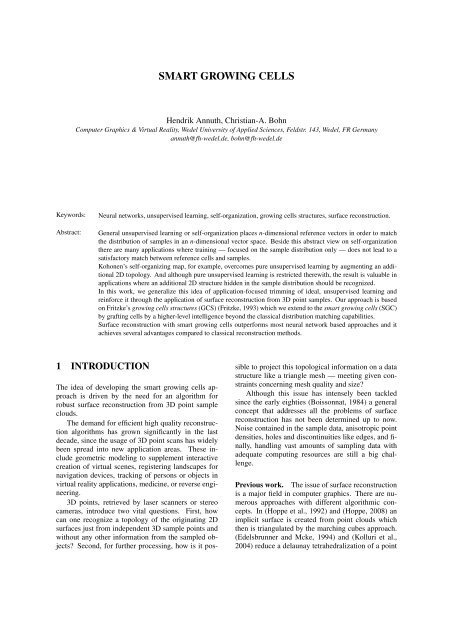
Some visual results are exposed in Fig. 16. All<br />
pictures are drawn from an SGC mesh. Most models<br />
stem from the Stanford 3D Scanning Repository.<br />
Besides visual results, reconstruction with SGC<br />
comes up with impressive numbers compared to classical<br />
approaches, listed in table 1.<br />
It can be seen that mesh quality, i.e. the percentage<br />
of perfect triangles in the mesh lies at 96% at<br />
average. This is an outstanding result, nevertheless<br />
this is usually expected when using an approach from<br />
the field of unsupervised learning, since this guarantees<br />
an ideal representation of the underlying training<br />
sample distribution.<br />
Further, the distance (RMS/object size) between<br />
samples and mesh surface is negligible low — far below<br />
1% of the object size at average. This is even
more pleasant, since usually, the problem at edges<br />
generate big error terms. Also the computing times<br />
needed are very short, few minutes in each case.<br />
All those measurements seem to be far better than<br />
those from classical approaches, as long as we could<br />
extract them from the regarding papers. Our algorithm<br />
works very robustly. There are nearly no outliers<br />
visible in the mesh.<br />
3 CONCLUSIONS<br />
We presented a new neural network approach, the<br />
smart growing cells, which is a modification of the<br />
classical growing cells structures approach.<br />
The modification type is new in a way that<br />
it changes the pure, general unsupervised learning<br />
scheme ad hoc to match training requirements of specific<br />
applications.<br />
Thus, drawbacks of using unsupervised learning<br />
approaches can be avoided while advantages be retained,<br />
and nevertheless, SGC training keeps its roots<br />
at general unsupervised learning.<br />
We encourage this idea by one specific application<br />
case — surface reconstruction from 3D point samples.<br />
Here, we add six topics to the classical unsupervised<br />
learning scheme, and finally the approach out-<br />
Adjust samples regarding roughness.<br />
Calculate average curvature and deviations.<br />
Recognize and sign discontinuity cells.<br />
Recognize and sign curvature cells.<br />
for all Boundary cells do<br />
if ∃ coalescing candidate then<br />
Melt boundary.<br />
for all Weeding candidates do<br />
Weeding process.<br />
end for<br />
end if<br />
end for<br />
if Edge collapse operation triggered then<br />
Collapse edge.<br />
for all Weeding candidates do<br />
Weeding process<br />
end for<br />
end if<br />
if Vertex split operation triggered then<br />
Split vertex.<br />
end if<br />
Figure 15: Outline of the complete SGC algorithm.<br />
Table 1: Results with sample sets from the Stanford<br />
3D Scanning Repository. “Quality” means percentage<br />
of triangles which hold the Delaunay criterion.<br />
RMS/Size is the root of the squared distances between<br />
original point samples and the triangle mesh, divided<br />
by the diameter of the sample set.<br />
Samples Vertices<br />
Time<br />
[m:s]<br />
Quality<br />
RMS/<br />
Size<br />
36K 30K 0:39 95.6% 4.7e-5<br />
438K 100K 2:47 95.5% 3.3e-5<br />
544K 260K 9:15 93.1% 1.7e-5<br />
14,028K 320K 12:17 98.5% 1.3e-5<br />
5,000K 500K 21:5 95.9% 2.7e-5<br />
511K 10K 0:11 99.8% 6.6e-5<br />
38K 5K 0:6 99.0% 15e-5<br />
346K 5K 0:6 98.3% 0.7e-5<br />
performs classical approaches concerning quality, efficiency,<br />
and robustness. Surface reconstruction with<br />
SGC is able to handle arbitrary topologies and millions<br />
of samples. It recognizes and solves discontinuities<br />
in the sample data and it is capable of adapting to<br />
varying sample distributions. Finally, the network is<br />
able to reorganize its topology to match arbitrary surface<br />
structures. Altogether these advantages can not<br />
be found in any of the classical approaches of surface<br />
reconstruction.<br />
The essential issue which transforms GCS to SGC<br />
is the mechanism of weeding cells as a network cleaning<br />
mechanism for ill-formed structures. Further, face<br />
normals are regarded and included in the neural network<br />
training loop to adapt to mesh roughness and<br />
to make the reconstruction process independent from<br />
the sample distribution. Additionally, we propose coalescing<br />
cells which can connect to others, curvature<br />
cells which recognize very small structures, and discontinuity<br />
cells which account for certain discontinuous<br />
structures like sharp edges.<br />
The proof of concept of our approach is enriched<br />
by the achieved quality and performance measures.<br />
For the tested geometries which each hold specific<br />
challenges of reconstruction, we got approximation
errors for comparable mesh resolutions that lie far below<br />
1% at average. Mesh quality, measured by the<br />
percentage of triangles which comply the Delaunay<br />
criterion, lies at 96% at average. And the time needed<br />
to compute meshes of several hundreds of thousands<br />
of polygons were just few minutes.<br />
Future work. This work shows that applicationfocused<br />
unsupervised learning is able to solve practical<br />
problems efficiently. Computation times are that<br />
small that we think of a real-time reconstruction approach<br />
through multithreaded sample adjustment.<br />
REFERENCES<br />
Boissonnat, J.-D. (1984). Geometric structures for<br />
three-dimensional shape representation. ACM<br />
Trans. Graph., 3(4):266–286.<br />
Edelsbrunner, H. and Mcke, E. P. (1994). Threedimensional<br />
alpha shapes.<br />
Fritzke, B. (1993). Growing cell structures - a selforganizing<br />
network for unsupervised and supervised<br />
learning. Neural Networks, 7:1441–1460.<br />
Fritzke, B. (1995). A growing neural gas network<br />
learns topologies. In Tesauro, G., Touretzky,<br />
D. S., and Leen, T. K., editors, Advances in<br />
Neural Information Processing Systems 7, pages<br />
625–632. MIT Press, Cambridge MA.<br />
Hoffmann, M. and Vrady, L. (1998). Free-form surfaces<br />
for scattered data by neural networks. Journal<br />
for Geometry and Graphics, 2:1–6.<br />
Hoppe, H. (2008). Poisson surface reconstruction and<br />
its applications. In SPM ’08: Proceedings of<br />
the 2008 ACM symposium on Solid and physical<br />
modeling, pages 10–10, New York, NY, USA.<br />
ACM.<br />
Hoppe, H., DeRose, T., Duchamp, T., McDonald,<br />
J. A., and Stuetzle, W. (1992). Surface reconstruction<br />
from unorganized points. In Thomas,<br />
J. J., editor, SIGGRAPH, pages 71–78. ACM.<br />
Huang, Q.-X., Adams, B., and Wand, M. (2007).<br />
Bayesian surface reconstruction via iterative<br />
scan alignment to an optimized prototype. In<br />
SGP ’07: Proceedings of the fifth Eurographics<br />
symposium on Geometry processing, pages<br />
213–223, Aire-la-Ville, Switzerland, Switzerland.<br />
Eurographics Association.<br />
Ivrissimtzis, I., Jeong, W.-K., Lee, S., Lee, Y., and<br />
Seidel, H.-P. (2004a). Neural meshes: surface<br />
reconstruction with a learning algorithm. Research<br />
Report MPI-I-2004-4-005, Max-Planck-<br />
Institut für Informatik, Stuhlsatzenhausweg 85,<br />
66123 Saarbrücken, Germany.<br />
Ivrissimtzis, I., Jeong, W.-K., and Seidel, H.-P.<br />
(2003a). Neural meshes: Statistical learning<br />
methods in surface reconstruction. Technical Report<br />
MPI-I-2003-4-007, Max-Planck-Institut fr<br />
Informatik, Saarbrücken.<br />
Ivrissimtzis, I., Lee, Y., Lee, S., Jeong, W.-K., and<br />
Seidel, H.-P. (2004b). Neural mesh ensembles.<br />
In 3DPVT ’04: Proceedings of the 3D<br />
Data Processing, Visualization, and Transmission,<br />
2nd International Symposium, pages 308–<br />
315, Washington, DC, USA. IEEE Computer<br />
Society.<br />
Ivrissimtzis, I. P., Jeong, W.-K., and Seidel, H.-P.<br />
(2003b). Using growing cell structures for surface<br />
reconstruction. In SMI ’03: Proceedings of<br />
the Shape Modeling International 2003, page 78,<br />
Washington, DC, USA. IEEE Computer Society.<br />
Kohonen, T. (1982). Self-Organized Formation of<br />
Topologically Correct Feature Maps. Biological<br />
Cybernetics, 43:59–69.<br />
Kolluri, R., Shewchuk, J. R., and O’Brien, J. F.<br />
(2004). Spectral surface reconstruction from<br />
noisy point clouds. In SGP ’04: Proceedings of<br />
the 2004 Eurographics/ACM SIGGRAPH symposium<br />
on Geometry processing, pages 11–21,<br />
New York, NY, USA. ACM.<br />
MacQueen, J. B. (1967). Some methods for classification<br />
and analysis of multivariate observations.<br />
pages 281 – 297.<br />
Storvik, G. (1996). Bayesian surface reconstruction<br />
from noisy images. In In Interface 96.<br />
Taubin, G. (1995). A signal processing approach to<br />
fair surface design. In SIGGRAPH, pages 351–<br />
358.<br />
Vrady, L., Hoffmann, M., and Kovcs, E. (1999). Improved<br />
free-form modelling of scattered data by<br />
dynamic neural networks. Journal for Geometry<br />
and Graphics, 3:177–183.<br />
Yoon, M., Lee, Y., Lee, S., Ivrissimtzis, I., and Seidel,<br />
H.-P. (2007). Surface and normal ensembles<br />
for surface reconstruction. Comput. Aided Des.,<br />
39(5):408–420.<br />
Yu, Y. (1999). Surface reconstruction from unorganized<br />
points using self-organizing neural networks.<br />
In In IEEE Visualization 99, Conference<br />
Proceedings, pages 61–64.
Figure 16: Upper lines: mesh training stages with number of vertices, lower lines, assorted pictures of reconstructed models.