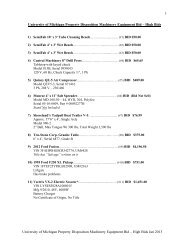
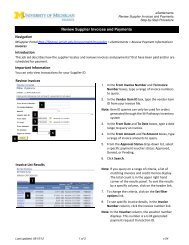
2010 A-133 Report - Finance - University of Michigan
2010 A-133 Report - Finance - University of Michigan
2010 A-133 Report - Finance - University of Michigan

Create successful ePaper yourself
Turn your PDF publications into a flip-book with our unique Google optimized e-Paper software.
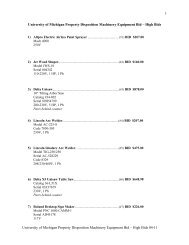
THE UNIVERSITY OF MICHIGAN<br />
Consolidated Statement <strong>of</strong> Revenues, Expenses<br />
and Changes in Net Assets<br />
Year Ended June 30,<br />
<strong>2010</strong> 2009<br />
(As Adjusted)<br />
(in thousands)<br />
Operating Revenues<br />
Student tuition and fees $ 1,097,450 $ 1,029,240<br />
Less scholarship allowances 233,598 202,946<br />
Net student tuition and fees 863,852 826,294<br />
Federal grants and contracts 844,026 741,487<br />
State and local grants and contracts 6,199 7,240<br />
Nongovernmental sponsored programs 140,087 148,578<br />
Sales and services <strong>of</strong> educational departments<br />
Auxiliary enterprises:<br />
139,992 117,690<br />
Patient care revenues<br />
Student residence fees (net <strong>of</strong> scholarship allowances<br />
2,372,017 2,220,551<br />
<strong>of</strong> $17,441,000 in <strong>2010</strong> and $16,542,000 in 2009) 85,725 81,391<br />
Other revenues 143,666 142,988<br />
Student loan interest income and fees 2,758 2,334<br />
Total Operating Revenues 4,598,322 4,288,553<br />
Operating Expenses<br />
Compensation and benefits 3,529,271 3,390,470<br />
Supplies and services 1,276,931 1,255,078<br />
Depreciation 360,089 341,462<br />
Scholarships and fellowships 113,753 107,127<br />
Total Operating Expenses 5,280,044 5,094,137<br />
Operating loss (681,722) (805,584)<br />
Nonoperating Revenues (Expenses)<br />
State educational appropriations 362,147 373,816<br />
State fiscal stabilization funds 10,136<br />
Federal Pell grants 39,905 24,929<br />
Private gifts for other than capital and endowment purposes 105,167 96,529<br />
Net investment income (loss) 796,399 (1,851,937)<br />
Interest expense, net (30,018) (25,136)<br />
Federal subsidies for Build America Bonds interest 3,303<br />
Total Nonoperating Revenues (Expenses), Net 1,287,039 (1,381,799)<br />
Income (loss) before other revenues (expenses) 605,317 (2,187,383)<br />
Other Revenues (Expenses)<br />
State capital appropriations 2,002 12,244<br />
Capital gifts and grants 29,143 27,791<br />
Private gifts for permanent endowment purposes 59,595 60,602<br />
Other 2,294 (1,656)<br />
Total Other Revenues, Net 93,034 98,981<br />
Increase (decrease) in net assets 698,351 (2,088,402)<br />
Net Assets, Beginning <strong>of</strong> Year 8,664,637 10,753,039<br />
Net Assets, End <strong>of</strong> Year $ 9,362,988 $ 8,664,637<br />
The accompanying notes are an integral part <strong>of</strong> the consolidated financial statements.<br />
30