FINANSBANK ANNOUNCES ITS 2004 YEAR-END ...
FINANSBANK ANNOUNCES ITS 2004 YEAR-END ...
FINANSBANK ANNOUNCES ITS 2004 YEAR-END ...

Create successful ePaper yourself
Turn your PDF publications into a flip-book with our unique Google optimized e-Paper software.
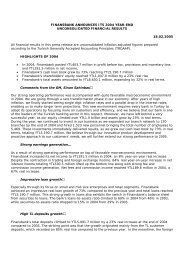
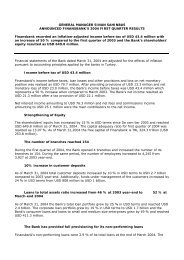
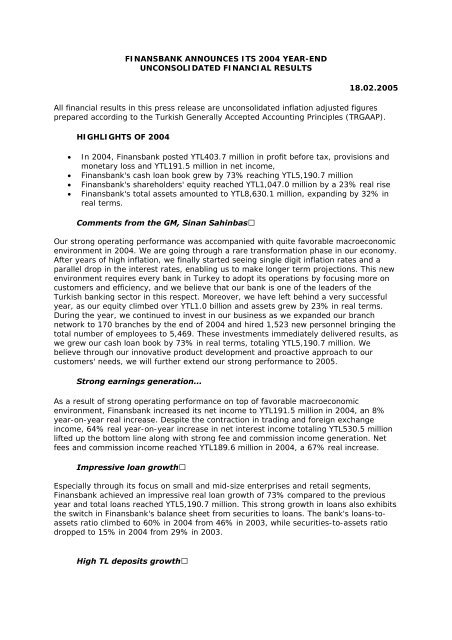
<strong>FINANSBANK</strong> <strong>ANNOUNCES</strong> <strong>ITS</strong> <strong>2004</strong> <strong>YEAR</strong>-<strong>END</strong><br />
UNCONSOLIDATED FINANCIAL RESULTS<br />
18.02.2005<br />
All financial results in this press release are unconsolidated inflation adjusted figures<br />
prepared according to the Turkish Generally Accepted Accounting Principles (TRGAAP).<br />
HIGHLIGHTS OF <strong>2004</strong><br />
• In <strong>2004</strong>, Finansbank posted YTL403.7 million in profit before tax, provisions and<br />
monetary loss and YTL191.5 million in net income,<br />
• Finansbank's cash loan book grew by 73% reaching YTL5,190.7 million<br />
• Finansbank's shareholders' equity reached YTL1,047.0 million by a 23% real rise<br />
• Finansbank's total assets amounted to YTL8,630.1 million, expanding by 32% in<br />
real terms.<br />
Comments from the GM, Sinan Sahinbas<br />
Our strong operating performance was accompanied with quite favorable macroeconomic<br />
environment in <strong>2004</strong>. We are going through a rare transformation phase in our economy.<br />
After years of high inflation, we finally started seeing single digit inflation rates and a<br />
parallel drop in the interest rates, enabling us to make longer term projections. This new<br />
environment requires every bank in Turkey to adopt its operations by focusing more on<br />
customers and efficiency, and we believe that our bank is one of the leaders of the<br />
Turkish banking sector in this respect. Moreover, we have left behind a very successful<br />
year, as our equity climbed over YTL1.0 billion and assets grew by 23% in real terms.<br />
During the year, we continued to invest in our business as we expanded our branch<br />
network to 170 branches by the end of <strong>2004</strong> and hired 1,523 new personnel bringing the<br />
total number of employees to 5,469. These investments immediately delivered results, as<br />
we grew our cash loan book by 73% in real terms, totaling YTL5,190.7 million. We<br />
believe through our innovative product development and proactive approach to our<br />
customers' needs, we will further extend our strong performance to 2005.<br />
Strong earnings generation...<br />
As a result of strong operating performance on top of favorable macroeconomic<br />
environment, Finansbank increased its net income to YTL191.5 million in <strong>2004</strong>, an 8%<br />
year-on-year real increase. Despite the contraction in trading and foreign exchange<br />
income, 64% real year-on-year increase in net interest income totaling YTL530.5 million<br />
lifted up the bottom line along with strong fee and commission income generation. Net<br />
fees and commission income reached YTL189.6 million in <strong>2004</strong>, a 67% real increase.<br />
Impressive loan growth<br />
Especially through its focus on small and mid-size enterprises and retail segments,<br />
Finansbank achieved an impressive real loan growth of 73% compared to the previous<br />
year and total loans reached YTL5,190.7 million. This strong growth in loans also exhibits<br />
the switch in Finansbank's balance sheet from securities to loans. The bank's loans-toassets<br />
ratio climbed to 60% in <strong>2004</strong> from 46% in 2003, while securities-to-assets ratio<br />
dropped to 15% in <strong>2004</strong> from 29% in 2003.<br />
High TL deposits growth
Finansbank's total deposits climbed to YTL5,091.7 million by a 23% real increase at the<br />
end of <strong>2004</strong> compared to 2003. The striking point was that the growth originated mainly<br />
from the TL customer deposits, which recorded an 85% real rise compared to the<br />
previous year. In the meantime, the foreign currency denominated customer deposits<br />
increased by 24% in US$ terms.<br />
This strong growth is mainly attributable to Finansbank's growing and efficient branch<br />
network and the increase in the number of its customers, not only in the retail segment<br />
but in the commercial segment as well. Finansbank expanded its branch network by 21<br />
branches in <strong>2004</strong>, which are mainly focused on the SME and retail segments, bringing<br />
the total to 170.<br />
Card Finans' success continues<br />
Finansbank's total number of credit cards reached 2 million at the end of <strong>2004</strong> with 300K<br />
new additions in the last quarter of <strong>2004</strong>. Accordingly, the annual increase in the number<br />
of credit cards amounted to an impressive 800K and Finansbank's market share in the<br />
number of credit cards reached 7.6% from 6.0% at the end of 2003. On top of the<br />
success of Card Finans brand promotion, strong relations with the merchants were<br />
another factor behind this successful performance.<br />
Solid equity...<br />
The strong earnings generation further strengthened Finansbank's shareholders' equity.<br />
The bank's equity expanded to YTL1,047.0 million by a 23% year-on-year real growth.<br />
The capital adequacy ratio ("CAR") stands at 14.07% at the end of <strong>2004</strong>. Please note<br />
that Finansbank obtained a ten-year subordinated debt of US$200 million from<br />
international markets in the last quarter of <strong>2004</strong>, reinforcing its CAR.<br />
For further information please contact:<br />
Murat Borekci, Investor<br />
Relations<br />
<strong>FINANSBANK</strong> A.S.<br />
BALANCE SHEET (Inflation<br />
adjusted)<br />
ASSETS<br />
www.finansbank.com.tr<br />
Tel E-mail<br />
+90 212 318 5983 investor.relations@finansbank.com.tr<br />
December<br />
31, <strong>2004</strong><br />
YTL in<br />
Thousands<br />
December<br />
31,<strong>2004</strong><br />
USD in<br />
Thousands<br />
December<br />
31, 2003<br />
YTL in<br />
Thousands<br />
December<br />
31, 2003<br />
USD in<br />
Thousands<br />
Cash and due from banks 131.892 100.793 128.172 97.950<br />
Short term placements 602.693 460.581 289.943 221.576<br />
Reserve deposits 567.682 433.826 374.889 286.492<br />
Portfolio available for sale 1.286.122 982.862 843.919 644.928<br />
Portfolio held to maturity 0 0 1.067.905 816.100
Loans, net 5.190.730 3.966.788 2.997.605 2.290.788<br />
Accrued interest income 146.229 111.749 228.506 174.626<br />
Equity participations 362.597 277.099 366.488 280.072<br />
Premises and equipment 207.617 158.662 154.447 118.029<br />
Other assets 134.535 102.813 73.481 56.156<br />
TOTAL ASSETS 8.630.097 6.595.173 6.525.355 4.986.717<br />
LIABILITIES AND<br />
SHAREHOLDERS' EQUITY<br />
Deposits 5.091.704 3.891.111 4.149.507 3.171.079<br />
Demand-TL 380.945 291.120 287.546 219.744<br />
Time-TL 1.696.613 1.296.562 833.195 636.733<br />
Foreign currency 2.751.372 2.102.615 2.617.197 2.000.078<br />
Interbank deposits 262.774 200.813 411.569 314.524<br />
Funds borrowed from banks 1.415.243 1.081.537 1.084.237 828.581<br />
Accrued interest expense 129.725 99.137 43.710 33.403<br />
Repo obligations 193.012 147.501 38.370 29.323<br />
Other liabilities 491.681 375.747 355.581 271.737<br />
Total liabilities 7.321.365 5.595.032 5.671.405 4.334.123<br />
Subordinated Loans 261.710 200.000 0 0<br />
Share capital 590.000 450.882 425.220 324.956<br />
Retained earnings 265.462 202.868 251.647 192.310<br />
Income for the year 191.560 146.391 177.083 135.328<br />
Total shareholders' equity 1.047.022 800.141 853.950 652.594<br />
TOTAL LIABILITIES AND 8.630.097 6.595.173 6.525.355 4.986.717<br />
SHAREHOLDERS' EQUITY<br />
Exchange Rate US $ / TL 1.308.548 1.308.548<br />
<strong>FINANSBANK</strong> A.S.<br />
INCOME STATEMENT<br />
(Inflation adjusted)<br />
December December December December
INTEREST INCOME<br />
31,<strong>2004</strong> 31,<strong>2004</strong> 31,2003 31,2003<br />
YTL in<br />
Thousands<br />
USD in<br />
Thousands<br />
YTL in<br />
Thousands<br />
USD in<br />
Thousands<br />
Interest on loans 775.549 592.679 458.979 350.755<br />
Interest on investment<br />
securities<br />
219.881 168.034 356.190 272.203<br />
Interest on deposits in banks 48.018 36.696 43.508 33.249<br />
Total interest income 1.043.448 797.409 858.677 656.207<br />
INTEREST EXPENSE<br />
Interest on deposits ( 467.436 ) ( 357.217 ) ( 493.073 ) ( 376.809 )<br />
Interest on funds borrowed<br />
from banks<br />
( 45.472 ) ( 34.750 ) ( 41.615 ) ( 31.802 )<br />
Total interest expense ( 512.908 ) ( 391.967 ) ( 534.688 ) ( 408.611 )<br />
Net interest income 530.540 405.442 323.989 247.596<br />
PROVISION FOR POSSIBLE<br />
LOAN LOSSES<br />
Net Interest Income after<br />
provision<br />
( 72.276 ) ( 55.234 ) ( 103.058 ) ( 78.758 )<br />
458.264 350.208 220.931 168.838<br />
NON-INTEREST INCOME<br />
Income from banking<br />
services,net<br />
189.640 144.924 113.876 87.025<br />
Capital market gain, net ( 12.244 ) ( 9.357 ) 62.032 47.405<br />
Income from equity<br />
participations<br />
21.021 16.064 32.300 24.684<br />
Foreign exchange gain/(loss),<br />
net<br />
( 3.929 ) ( 3.003 ) 69.594 53.184<br />
Other income, net 58.861 44.982 108.050 82.574<br />
Total non-interest income 253.349 193.610 385.852 294.872<br />
NON-INTEREST EXPENSE<br />
Salaries and employee benefits ( 156.781 ) ( 119.813 ) ( 114.130 ) ( 87.219 )<br />
General and administrative<br />
expenses<br />
( 166.059 ) ( 126.903 ) ( 122.442 ) ( 93.571 )<br />
Depreciation and amortization ( 42.707 ) ( 32.637 ) ( 43.362 ) ( 33.138 )<br />
Taxes other than on income ( 14.614 ) ( 11.168 ) ( 29.207 ) ( 22.320 )<br />
Total non-interest expense ( 380.161 ) ( 290.521 ) ( 309.141 ) ( 236.248 )<br />
Income before taxation 331.452 253.297 297.642 227.462
TAXATION CHARGE ( 63.366 ) ( 48.424 ) ( 87.713 ) ( 67.031 )<br />
Current ( 95.560 ) ( 73.027 ) ( 54.080 ) ( 41.329 )<br />
Deferred tax 32.194 24.603 ( 33.633 ) ( 25.702 )<br />
Net income before monetary<br />
loss<br />
Loss on net monetary<br />
position<br />
268.086 204.873 209.929 160.431<br />
( 76.526 ) ( 58.482 ) ( 32.846 ) ( 25.103 )<br />
NET INCOME 191.560 146.391 177.083 135.328<br />
0 0 0 0