Unit 1 - Goodheart-Willcox
Unit 1 - Goodheart-Willcox
Unit 1 - Goodheart-Willcox

You also want an ePaper? Increase the reach of your titles
YUMPU automatically turns print PDFs into web optimized ePapers that Google loves.
32 <strong>Unit</strong> 1 The Economic System<br />
Linking to...<br />
Graph Reading<br />
A candy company sells 5,000 candy bars a<br />
day when they are priced at $1 each. When the<br />
company raises the price to $1.25, it sells 4,500 a<br />
day at the higher price.<br />
amount of a product or service producers are willing to provide. Demand<br />
is the quantity of a product or service consumers are willing to buy. Both<br />
supply and demand are closely connected to price.<br />
For example, suppose you own a gym shoe company. When you price<br />
them at $80 a pair, you sell 1,000 pairs. At $40 each, you sell 3,000 pairs.<br />
When the chart’s coordinates are plotted on a graph and connected, they<br />
form a line called the demand curve. Price and demand move in opposite directions,<br />
so the curve has a negative slope. This illustrates the law of demand—the<br />
higher the price of a good or service, the less of it consumers will demand.<br />
As a producer, you want to sell your goods for the highest possible<br />
price. If you think you can get $80 for each pair of sneakers, you would<br />
want to produce more. If you think you can only get $20 a pair, you would<br />
want to produce less.<br />
When the chart’s coordinates are plotted on a graph and connected,<br />
they form a line called the supply curve. Price and supply tend to move<br />
in the same direction, so the curve has a positive slope. This illustrates<br />
the law of supply—the higher the price of a good or service, the higher the<br />
quantity supplied by producers.<br />
Equilibrium<br />
Math<br />
Draw a graph and plot the coordinates.<br />
Approximately how many candy bars would they<br />
sell per day if they were priced at $1.50 each?<br />
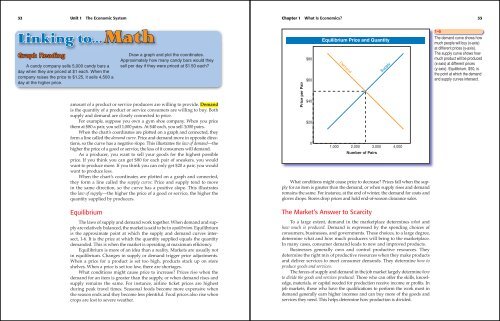
The laws of supply and demand work together. When demand and supply<br />
are relatively balanced, the market is said to be in equilibrium. Equilibrium<br />
is the approximate point at which the supply and demand curves intersect,<br />
1-6. It is the price at which the quantity supplied equals the quantity<br />
demanded. This is when the market is operating at maximum effi ciency.<br />
Equilibrium is more of an idea than a reality. Markets are usually not<br />
in equilibrium. Changes in supply or demand trigger price adjustments.<br />
When a price for a product is set too high, products stack up on store<br />
shelves. When a price is set too low, there are shortages.<br />
What conditions might cause price to increase? Prices rise when the<br />
demand for an item is greater than the supply, or when demand rises and<br />
supply remains the same. For instance, airline ticket prices are highest<br />
during peak travel times. Seasonal foods become more expensive when<br />
the season ends and they become less plentiful. Food prices also rise when<br />
crops are lost to severe weather.<br />
Chapter 1 What Is Economics? 33<br />
Price per Pair<br />
$80<br />
$60<br />
$40<br />
$20<br />
0<br />
Equilibrium Price and Quantity<br />
Demand<br />
1,000 2,000 3,000 4,000<br />
Number of Pairs<br />
What conditions might cause price to decrease? Prices fall when the supply<br />
for an item is greater than the demand, or when supply rises and demand<br />
remains the same. For instance, at the end of winter, the demand for coats and<br />
gloves drops. Stores drop prices and hold end-of-season clearance sales.<br />
The Market’s Answer to Scarcity<br />
Supply<br />
To a large extent, demand in the marketplace determines what and<br />
how much is produced. Demand is expressed by the spending choices of<br />
consumers, businesses, and governments. These choices, to a large degree,<br />
determine what and how much producers will bring to the marketplace.<br />
In many cases, consumer demand leads to new and improved products.<br />
Businesses generally own and control productive resources. They<br />
determine the right mix of productive resources when they make products<br />
and deliver services to meet consumer demands. They determine how to<br />
produce goods and services.<br />
The forces of supply and demand in the job market largely determine how<br />
to divide the goods and services produced. Those who can offer the skills, knowledge,<br />
materials, or capital needed for production receive income or profi ts. In<br />
job markets, those who have the qualifi cations to perform the work most in<br />
demand generally earn higher incomes and can buy more of the goods and<br />
services they need. This helps determine how production is divided.<br />
1-6<br />
The demand curve shows how<br />
much people will buy (x-axis)<br />
at different prices (y-axis).<br />
The supply curve shows how<br />
much product will be produced<br />
(x-axis) at different prices<br />
(y-axis). Equilibrium, $50, is<br />
the point at which the demand<br />
and supply curves intersect.