The Fractal's Edge Basic User's Guide
The Fractal's Edge Basic User's Guide
The Fractal's Edge Basic User's Guide

You also want an ePaper? Increase the reach of your titles
YUMPU automatically turns print PDFs into web optimized ePapers that Google loves.
<strong>The</strong> Quick And Easy Way To Consistently Profit from Stock And Futures Trading In 30 Days or less.<br />
In fact, as you devour the instructions contained within these pages and put this proprietary information into<br />
practice, you WILL make a BARE MINIMUM of AT LEAST 10x the price of our software within your first<br />
year or your money back.<br />
<strong>The</strong> Fractal’s <strong>Edge</strong><br />
<strong>Basic</strong> User’s <strong>Guide</strong><br />
Fundamental Methodology<br />
for Trading Stocks and Commodities<br />
with <strong>The</strong> Fractal’s <strong>Edge</strong><br />
by Ken Herbert Sr., developer of the Fractal’s <strong>Edge</strong> Trading System
<strong>The</strong> <strong>Fractal's</strong> <strong>Edge</strong> <strong>Basic</strong> User’s <strong>Guide</strong><br />
<strong>The</strong> only cutting-edge trading system that allows you to consistently profit<br />
from the underlying order beyond the chaos of the stock and futures markets.<br />
www.fractalsedge.com<br />
Congratulations on taking the next step in your trading education. Enjoy the course. When you’re ready to<br />
maximize the profit potential of the priceless information contained within these pages, then order <strong>The</strong> Fractal’s<br />
<strong>Edge</strong> Stock and Futures Trading Software at http://www.fractalsedge.com/order.html.<br />
Let's review exactly what you get with this TOTAL stock and futures trading solution:<br />
1. Proprietary Education. <strong>The</strong> <strong>Fractal's</strong> <strong>Edge</strong> Stock and Futures Trading Method. Also, on-going<br />
education in the form of an email newsletter, TFE In Action, highlighting the specific applications of TFE in<br />
various scenarios.<br />
2. <strong>The</strong> <strong>Fractal's</strong> <strong>Edge</strong> Stock and Futures Trading Software. This stand-alone application (illustrated<br />
throughout the course) automatically displays the key indicators used to read the current direction of the<br />
market and aids in the selection of precise entry and exit points. <strong>The</strong> program distinguishes between stocks<br />
and commodities.<br />
3. US and Canadian End of Day Stock and Futures Market Data. TFE software includes built-in, single<br />
click, stock data download capability from Primate Data, a premier data vendor.<br />
4. Quarterly TFE Stock and Futures Trading Watch Lists Delivered Directly through the Software. While<br />
there is nothing stopping you from creating your own stock watch list, every quarter (more often for futures) we<br />
will filter out thousands of stocks and futures contracts and deliver to you (via the software itself) the 100-150<br />
stocks and 10-20 futures contracts that we believe have the best potential for use with TFE in the coming<br />
months.<br />
5. Ability to create, manage and share (if you choose) your own portfolios and access those of<br />
other TFE users who are willing to share theirs.<br />
Visit www.fractalsedge.com/order.html to immediately access and download the Fractal’s <strong>Edge</strong> Trading<br />
Software and benefits described above.<br />
To your success!<br />
Ken Herbert<br />
Quantum Futures<br />
7456 SW Baseline Suite #333<br />
Hillsboro, OR 97123 USA<br />
503-985-3443<br />
service@quantumfutures.com<br />
2
IMPORTANT NOTICE<br />
This is not a get-rich-quick scheme. Effort is required to learn the system. Just as the potential for profit exists<br />
in trading stocks, so does the risk of loss. Past performance is not necessarily indicative of future results.<br />
Trading stocks has large potential rewards, but also large potential risk. You must be aware of the risks<br />
and be willing to accept them in order to place responsible, informed trading orders. Don't trade with money<br />
you can't afford to lose.<br />
<strong>The</strong> <strong>Fractal's</strong> <strong>Edge</strong> Stock and Futures Trading Method is a system that provides information to assist you in<br />
making informed trading decisions; you are free to disregard the information entirely or to act on it in any<br />
manner you see fit. No representation is being made that any trade based on use of the system's information<br />
will or is likely to achieve profits or losses similar to those discussed in this document or on our web site. While<br />
we have done our best to provide you with a quality product, we must caution you that the past performance of<br />
any trading system or methodology is not necessarily indicative of future results.<br />
WARNING<br />
All content provided on our website is protected by copyright law and international treaties. Unauthorized<br />
reproduction or distribution of this information, or any portion of it, including information in this <strong>User's</strong> Manual,<br />
may result in severe civil and criminal penalties, and will be prosecuted to the maximum extent possible under<br />
the law.<br />
© Copyright 2001-2006, ALL RIGHTS RESERVED<br />
NOTICE: This publication is designed to provide valuable information. It is sold with the understanding that the<br />
publisher or author is not engaged in rendering legal, accounting, or other professional service. If legal advice<br />
or other assistance is required, the service of a competent professional should be sought.<br />
ALL RIGHTS RESERVED. No Part of this publication may be reproduced, stored in a retrieval system, or<br />
transmitted, in any form or by any means, electronic, mechanical, photocopying, recording, or otherwise,<br />
without the prior written permission of the publishers.<br />
Acknowledgements<br />
This course would be incomplete without the work of various scholars, researchers, and technical analysts,<br />
among them R. N. Elliott, W. D. Gann, James Gleick, Edward Lorenz, Benoit Mandelbrot, Edgar Peters, Robert<br />
Prechter, and others, who lay the foundation for atypical approaches to analyzing data for trading the markets.<br />
Quantum Futures acknowledges particularly the work of Bill Williams, Ph. D., whose research and findings are<br />
shared in his book, New Trading Dimensions (J. Wiley and Sons, Inc., Publishers, 1998) http://www.wiley.com.<br />
Professor Williams' pioneering efforts led to the identity, definition, and development of the concept of fractals<br />
as they appear on price charts and as they apply to the analysis of market action. For more information about<br />
Bill Williams and the Profitunity Trading Group programs, go to http://www.profitunity.com.<br />
3
Fractal’s <strong>Edge</strong> <strong>Basic</strong> User’s <strong>Guide</strong> Table of Contents<br />
Module 1 Introduction to a Radically New Stock and Futures Trading Approach<br />
<strong>The</strong> perfect business<br />
How do you fit in?<br />
Purpose of the course<br />
Module 2 Visual Display and Descriptions of System Components<br />
Examples of system graphics<br />
Description of <strong>The</strong> Fractal’s <strong>Edge</strong> Indicators<br />
Module 3 <strong>The</strong> Gatekeeper- Staying Out of Trouble<br />
This module introduces you to the Gatekeeper, a tool to assist you in<br />
deciding when it is safe to enter the market and when it is time to exit.<br />
This tool will also help you to know how long to stay with a trend so that<br />
you can maximize the profit potential of your trade.<br />
Module 4 Screening stocks and futures for potential trades<br />
In this module, you will learn how to use the Gatekeeper to screen and<br />
select stocks and futures for potential trades. It answers the question,<br />
“How do I select stocks and futures for potential trades?”<br />
Module 5 Finding a wave to ride: <strong>The</strong> Momentum Oscillator, the Accelerometer, and the<br />
Gatekeeper<br />
In this module, you will learn how the Momentum Oscillator (MO) and the<br />
Accelerometer (ACC) work together with the Gatekeeper to provide entry<br />
signals, stop loss values, profit targets, and exit points.<br />
Module 6 Determining stop loss values – Making the ride smooth<br />
In this module, we will go through two long trades and two short trades to<br />
see how the ACC and the Gatekeeper show us where to set our daily stop<br />
loss points and when to exit a profitable trade.<br />
Module 7 Exiting when the market moves against your position.<br />
In this module, you’ll learn how to exit with minimal loss when the market<br />
moves against your position. It answers the question, “If the market<br />
moves against my position, where do I exit?”<br />
Module 8 Money Management<br />
<strong>The</strong> goal of this module is to present a strategy for preserving capital so<br />
that you can trade another day while building account equity.<br />
Module 9 Optional Indicators<br />
This module presents a brief introduction to the Gatekeeper Histogram,<br />
the E-wave Oscillator, and the Psychometric Evaluators<br />
Module 10 Quick-Reference Tables<br />
This module provides a recap of the entry signals, entry rules, stop loss<br />
rules, and exit rules<br />
4
Forward to User’s <strong>Basic</strong> <strong>Guide</strong><br />
<strong>The</strong> purpose of this User’s <strong>Basic</strong> <strong>Guide</strong> is to bring you up to speed with TFE’s (<strong>The</strong> Fractal’s <strong>Edge</strong>) basic<br />
trading methodology as quickly as possible. While the methodology taught in this <strong>Guide</strong> is based on certain<br />
principles or concepts found in Chaos <strong>The</strong>ory, Wavelet <strong>The</strong>ory, and Quantum Mechanics, it does not go into<br />
detail. If you are interested in the science behind the system, a separate manual containing all the fine points is<br />
available to our clients.<br />
This course answers the following basic questions:<br />
• How do I select a stock or futures contract to trade?<br />
• After I make my selection, is there a potential trade?<br />
• If so, where is my entry point?<br />
• What should my initial stop loss be?<br />
• How do I determine my daily stop loss value?<br />
• How do I know when to exit?<br />
• If the market moves against my position, where do I exit?<br />
In addition, since money management is one of the most important and often neglected aspect of trading, we<br />
have included a section that addresses money management strategies, with a section for stocks and a section<br />
for futures. It answers the questions:<br />
• What should my portfolio look like in terms of risk management?<br />
• How much can I safely risk on this trade?<br />
• What should my position size be?<br />
<strong>The</strong> <strong>Fractal's</strong> <strong>Edge</strong> is one of the finest trading tools anywhere. If you carefully study the course, follow the<br />
trading rules, and apply sound money management strategies, you will do well. I wish you every success with<br />
your trading.<br />
Ken Herbert, Sr.<br />
www.fractalsedge.com<br />
5
Module 1. Introduction to a Radically New Stock and Futures Trading Approach<br />
<strong>The</strong> Perfect Business<br />
You are about to get into a business that gives you everything you've ever wanted from a business of your<br />
own. It offers the potential for unlimited earnings and, in the course of time, real wealth. What's more, you can<br />
run it working your own hours while continuing to do whatever you're doing now. You operate this business<br />
entirely on your own, and can start with very little capital. You won't have any employees, so you don't need<br />
attorneys, accountants, or bookkeepers. In fact, you'll never have collection problems because you won't have<br />
any "customers," and since there is no competition, you won't have to pay the high cost of advertising. You<br />
also won't need office space, warehousing, or a distribution system. All you need is a personal computer and<br />
you can conduct business from anywhere in the world.<br />
How Do YOU Fit In?<br />
If you are in the business of trading stocks, you become a "silent financial partner" in companies, not<br />
because you know anything about, say, auto parts, pharmaceuticals, aircraft, or biotechnology, but because<br />
you expect to make a profit.<br />
If you are in the business of trading commodities, you become a "silent contractor" in the exchange of the<br />
basic staples of life, not because you know anything about, lumber, fuel, meats, coffee, metals, or currencies,<br />
but because you also expect to make a profit on the deal.<br />
In fact, most stock and futures traders have no use for the actual, products, services, or commodities they are<br />
dealing with; they never even see them. <strong>The</strong>y are just people like you and me; people with a certain amount of<br />
capital to invest getting started in their own business. <strong>The</strong>re are millions of them and they come from almost<br />
every profession: from clerks to executives, from janitors to doctors, from students to university presidents. It is<br />
the millions of traders controlling the millions and millions of shares and futures contracts that allow the<br />
exchanges to exist. But more than that, we provide farmers, suppliers, manufacturers, and dealers with the<br />
capital they need to reduce their own risk and expand their operations. For performing this service, we expect<br />
to make a profit.<br />
<strong>The</strong> great thing about all of this is that you don't need a college degree or even a high school education to do<br />
well trading stocks or futures. However, you do need some training, you need an objective system, and you<br />
need a plan. This manual provides everything you'll need to get started, to become successful, and to build<br />
real wealth. So if you're ready, let's get going.<br />
Purpose<br />
<strong>The</strong> purpose of this <strong>Basic</strong> Course Book is to help you understand and use <strong>The</strong> <strong>Fractal's</strong> <strong>Edge</strong>, an innovative<br />
trading system for the stock and futures markets. While the system is based on principles and concepts from<br />
Chaos <strong>The</strong>ory, Wavelet <strong>The</strong>ory, and Quantum Mechanics, the software performs most of the functions<br />
automatically. So, you won't need any special ability with math or computer programming. We will show you<br />
exactly how to enter the market data and interpret the results.<br />
Unique Approach<br />
<strong>The</strong> <strong>Fractal's</strong> <strong>Edge</strong> Stock and Futures Trading Method will show you that what happens in the market is not<br />
random. <strong>The</strong>re is an underlying order behind price movement. As the underlying structure of the market<br />
becomes clear to you through an understanding of the principles and methods taught in this course, you will<br />
begin to reap the financial rewards.<br />
<strong>The</strong> <strong>Fractal's</strong> <strong>Edge</strong> (TFE) is unique in that it does not attempt to predict the future. Rather it is a tool that helps<br />
you to recognize and go with the market's current flow. Mastering this system will give you greater peace of<br />
mind because you won't need to keep up with the Fed, pending legislation, interest rates or the opinions of<br />
experts.<br />
Unlike most other trading systems, TFE does not depend on past performance. Its formulas are not optimized<br />
or curved to fit statistical models. And it doesn't depend on pattern recognition algorithms. One key principle to<br />
always keep in mind is that the past does not equal the future. <strong>The</strong> future is always constantly replacing the<br />
past.<br />
6
<strong>The</strong> <strong>Fractal's</strong> <strong>Edge</strong> deals with the here and now, the thin line between the past and future.<br />
So, what does <strong>The</strong> <strong>Fractal's</strong> <strong>Edge</strong> Stock and Futures Trading System look like?<br />
Continue on to Module 2 to find out.<br />
7
Module 2. Visual Display and Descriptions of System Components<br />
<strong>The</strong> purpose of this module is to provide you with a visual bird's eye view of the <strong>The</strong> <strong>Fractal's</strong> <strong>Edge</strong> Trading<br />
System and to give you a quick description of each component. Illustration 2.1 below shows the indicators<br />
you'll be working with after you update the day's trading data. It includes the bar chart with Stability Lines, the<br />
Gatekeeper, the Momentum Oscillator, and the Accelerometer.<br />
By the way, don't let the technical sound of the system component names scare you. <strong>The</strong>y are based on easy<br />
to understand principles that you will quickly learn as you go through the remainder of this course. Each part of<br />
the system works in concert with the others to give you an accurate picture of current market conditions.<br />
<strong>The</strong> indicator display allows you to view all indicators simultaneously, one below the other. In addition, the<br />
software has a cross-hair cursor and contains a drawing component that allows you to draw straight lines in<br />
any direction. However, it does not draw arrows, circles, or other illustrative devices. We have added them<br />
simply for clarification. Below Illustration 2.1, you will see a brief description of the system indicators.<br />
Illustration 2.1. View of <strong>Fractal's</strong> <strong>Edge</strong> system graphics.<br />
8
<strong>The</strong> <strong>Fractal's</strong> <strong>Edge</strong> Stock and Futures Trading Software features a visually rich environment that converts<br />
market data into the following charts and graphics. <strong>The</strong> below is a description of the components:<br />
• Portfolio and Symbol tables: located on the left, allows you to quickly "thumb" through the stocks or<br />
futures you are interested in.<br />
• Data tables: located on the right, displays price data, values of the various indicators, and information<br />
about the stock or futures contract you are trading.<br />
• A standard price chart: depicts the high, the low, and the close. Can be set for either candlestick or<br />
OHLC bars.<br />
• Initiating Fractal Signals: fractal formations appearing on the price chart indicate entry points for<br />
trading and pyramiding. When combined with the Gatekeeper, these fractals show you where to place<br />
the initial order. On the chart, initiating buy fractals are marked with a green "B," and initiating sell<br />
fractals with a red "S."<br />
• <strong>The</strong> Gatekeeper: assists you in preventing unwise trades and provides entry and exit points for valid<br />
trades. It also helps you to know how long to stay with a trend so that you can maximize the profit<br />
potential of your trade. It is comprised of a series of three moving average Stability Lines (colored<br />
green, red, and blue on the chart in Illustration 2.1) and a Safety Line (colored white) superimposed<br />
over the individual price chart. Averages are based on ratios derived through the application of fractal<br />
geometry.<br />
• <strong>The</strong> Momentum Oscillator: shows the strength and direction of the market's underlying momentum.<br />
Based on concepts from fractal geometry and wavelet theory, it depicts the major price waves.<br />
• <strong>The</strong> Accelerometer: acts as an early warning signal, alerting you to future changes in a market's trend.<br />
It is extremely sensitive to changes in the acceleration or deceleration of market momentum and<br />
depicts minor waves. When coupled with the Momentum Oscillator, it aids in making inferences about<br />
how the "mass mind" has affected the day's trading. Formulas are derivatives of the formula for the<br />
Momentum Oscillator.<br />
<strong>The</strong>se components combine to provide you with all of the information you need to make sound trading<br />
decisions. <strong>The</strong> modules that follow contain detailed descriptions of the system's indicators.<br />
Other Indicators<br />
• <strong>The</strong> Gatekeeper Histogram: assists you in identifying range-bound channels.<br />
• E-wave Oscillator: confirms that the momentum of a current trend has turned and that it's time to exit<br />
the market. It is a precise indicator of overall market rhythm. Formulas for this histogram are based on<br />
fractal ratios.<br />
• <strong>The</strong> Psychometric Evaluators: a pair of histograms (Volume and Volume Range Ratio) that work with<br />
the current day's volume to give you a picture of the how the "mass mind" has affected the day's<br />
trading.<br />
Because of ongoing research findings, the last three indicators are now optional. <strong>The</strong>ir use will be summarized<br />
in Module 9.<br />
How do I trade with <strong>The</strong> Fractal’s <strong>Edge</strong>? Read the following instructional modules to find out.<br />
9
Module 3. <strong>The</strong> Gatekeeper- Staying Out of Trouble<br />
This module introduces you to the Gatekeeper, a tool to assist you in deciding when it is safe to enter<br />
the market and when it is time to exit. This tool will also help you to know how long to stay with a trend<br />
so that you can maximize the profit potential of your trade.<br />
<strong>The</strong> Gatekeeper is a series of three Stability Lines plus a Safety Line that combine with the Momentum<br />
Oscillator and Accelerometer to help us know when to get into the market, when to stay with the current trend,<br />
and when to exit. (See Illustration 3.1 below.)<br />
Illustration 3.1. <strong>The</strong> Gatekeeper<br />
In his system, Williams (1998) calls his combination of moving average lines the Alligator. Each of the<br />
Alligator's moving averages is based on Fibonacci ratios. For example, Williams' "Balance Lines" were<br />
constructed using time frames that are each approximately 62% of the next higher frame. However, we have<br />
chosen to use a derivative of the Fibonacci sequence that is obtained by applying an additional computation<br />
10
that also allows an iterative accretion of the Fibonacci sequence to occur. In addition, Williams' Balance Lines<br />
are offset 3, 5, and 8 bars into the future, while TFE's are not offset at all.<br />
So, while the Gatekeeper's three Stability Lines are based on time frames that are each about 62% of the next<br />
highest time frame, they were constructed using an alternative sequence of moving averages. We have also<br />
added a 3-period simple moving average to the original Gatekeeper. <strong>The</strong>se adjustments allow us to be more<br />
certain about where a trend is beginning or ending, and more precise in entering and exiting the market.<br />
<strong>The</strong> Wall<br />
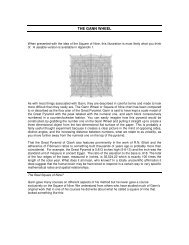
Illustration 3.2 below shows the interaction of the three Stability Lines with the bars on a daily chart. <strong>The</strong> blue<br />
moving average line (<strong>The</strong> Wall) provides information for setting the first day's stop loss and acts as a<br />
measure of the market's long-term direction. In fact, it marks the boundary between stability and chaos, and is<br />
like a high stone wall that the price must clear before it makes a major change in direction. That is why we call<br />
it "<strong>The</strong> Wall."<br />
<strong>The</strong> Tripwire<br />
<strong>The</strong> red moving average line, or Tripwire, provides information for setting stop loss points after the first day<br />
in the market. It also acts as a measure of the market's intermediate direction and provides an early warning<br />
that the trend may be changing. If the price closes between the Tripwire and the Wall (the red and blue<br />
Stability Lines), it is a warning to prepare to exit your trade. However, since all of the constituents of <strong>The</strong><br />
<strong>Fractal's</strong> <strong>Edge</strong> should be used together, the other components may indicate only that you tighten your stops.<br />
You'll learn more about this later.<br />
<strong>The</strong> Picket Fence<br />
<strong>The</strong> green moving average line, or Picket Fence, is a measure of the market's short-term direction. It carries<br />
information for tightening stop loss points. It's also like a little Picket Fence that is relatively easy for price to<br />
jump over. Particularly toward the end of a trend, price will cross the Fence and enter the area between the<br />
Fence and the Tripwire. This is still a "safe" area, but as more and more successive price bars collect there,<br />
the easier it will be for them to cross the Tripwire. When price crosses the Fence, it serves as a reminder to<br />
pay close attention to what the MO and ACC are telling us.<br />
<strong>The</strong> Safety Line<br />
<strong>The</strong> pink moving average line is the Safety Line. It's a 3-period simple moving average (3SMA) that<br />
provides information for a safe exit for profit as well as an exit point for safety when TFE's other indicators warn<br />
us to get out of the market quickly.<br />
Illustration 3.2. Interaction of the Stability Lines on a daily chart (Alcoa Inc—AA, 9/8/2005 – 12/7/2005)<br />
11
Review of the Gatekeeper<br />
<strong>The</strong> Gatekeeper is a series of three Stability Lines plus a Safety Line that combine to help us know when to<br />
enter the market, when to stay with the current trend and when to exit the market.<br />
<strong>The</strong> blue Stability Line, otherwise known as the Wall,<br />
• acts as a measure of long-term market direction<br />
• provides information for where to place an initial stop loss point.<br />
<strong>The</strong> red moving average line, or Tripwire,<br />
• provides information for setting stop loss points after the first day in the market<br />
• acts as a measure of the market's intermediate direction<br />
• provides an early warning that the trend may be changing.<br />
<strong>The</strong> green Stability line, or Picket Fence,<br />
• is a measure of the market's short-term direction.<br />
• reminds us to pay attention to the MO and ACC when price crosses it.<br />
<strong>The</strong> pink moving average line, or Safety Line,<br />
• is a 3-period simple moving average (3SMA)<br />
• provides information for a safe exit when TFE's other indicators warn us to get out of the market<br />
quickly.<br />
References<br />
Beltrami, E. Mathematics for dynamic modeling. Boston: Academic Press, 1987.<br />
Davis, R. E. and Thiel, C. C. A computer analysis of moving average applied to commodity futures trading.<br />
West Lafayette, IN: Ouiatenon Management Company, 1969.<br />
Kaufman, P. J. Trading systems and methods. Third edition. NY: John Wiley and Sons, 1998.<br />
Williams, B. New trading dimensions: how to profit from chaos in stocks, bonds, and commodities. New York:<br />
John Wiley and Sons, Inc., 1998. (http://www.wiley.com, http://www.profitunity.com).<br />
12
Module 4. Screening stocks and futures contracts for potential trades<br />
In this module, you will learn how to use the Gatekeeper to screen and select stocks for potential<br />
trades. It answers the question, “How do I select stocks for potential trades?”<br />
How do I select stocks or futures contracts to trade?<br />
<strong>The</strong>re are two ways to go about selecting stocks or futures contracts to trade:<br />
1) choose stocks from TFE’s Quarterly Watch List; choose contracts from TFE’s Bi-monthly Futures Watch<br />
List, or<br />
2) find a stock or contract of interest to you and “map” it to TFE.<br />
Rationale<br />
All stocks and futures contracts cycle through trending and non-trending periods. Moreover, even when they<br />
are trending, some will go through phases where the bars are inconsistent in length, and frequently cut through<br />
more than one of the Gatekeeper Stability Lines, and in some cases, all three.<br />
However, in any given quarter, approximately 10% of all the stocks listed on the American Stock Exchange<br />
and the New York Stock Exchange, and 15% to 20% of all futures contracts, exhibit properties that are in<br />
complete harmony with <strong>The</strong> Fractal’s <strong>Edge</strong>. That is, their price bars only infrequently cut through one or more<br />
of the Stability Lines, and bar length is fairly consistent. This section outlines the methodology we employ when<br />
building our watch lists. You can also use the same methodology to screen stocks or futures contracts you are<br />
interested in.<br />
Option 1) Choose Stocks/Futures from TFE’s Watch Lists<br />
TFE’s Quarterly Stock Watch Lists contain hundreds of stocks assembled into Low-Risk, Medium-Risk, and<br />
High-Risk portfolios, according to how well they match TFE’s strengths. TFE’s Bi-monthly Futures watch list<br />
contains 10 to 20 futures contracts that are highly compatible with TFE. However, even the High-Risk stocks<br />
stand a good chance of earning decent profits. Each portfolio is well-diversified, and contains stocks that have<br />
been mapped to TFE. <strong>The</strong>se stocks and futures contracts are stable in terms of volatility and the frequency at<br />
which TFE’s Stability Lines are breached.<br />
To access the pre-built Watch List portfolios, follow these steps:<br />
a. Click on the Download Prebuilt Portfolios icon located in the upper left corner of the screen<br />
(Illustration 4.1)<br />
b. <strong>The</strong> dialog box shown below will pop up (Illustration 4.2). Select QuarterlyStockLowRisk or<br />
FuturesWatchList (or any other portfolio of interest) and click OK. <strong>The</strong> portfolio will be imported into<br />
TFE.<br />
13
Illustration 4.1. Locating Pre-built Portfolios icon Illustration 4.2. Pre-Built Portfolios dialog box<br />
c. After TFE is finished downloading the portfolio, the choice box shown below will pop up<br />
(Illustration 4.3). If you want to import additional portfolios, click No. If you click Yes, TFE will update<br />
all portfolios including the one you just added. You will save time if you wait until you are finished<br />
importing portfolios.<br />
Illustration 4.3. Choice box for downloading data<br />
After clicking on the Yes button, TFE will automatically download and update data for all of your portfolios. You<br />
can also update your portfolios daily by clicking on the download icon located in the upper left corner of the<br />
screen (Illustration 4.4), or by pressing the F9 key on your keyboard.<br />
Illustration 4.4. Locating the download button<br />
Option 2) Or Map Your Own Stocks/Futures to TFE<br />
<strong>The</strong> methodology we will be discussing below is called “mapping.” It is a technique that effectively matches<br />
stocks and futures contracts to TFE’s strengths as a trend-following system. If the stock does not map, do not<br />
trade it.<br />
Step One: Create and populate your portfolio<br />
<strong>The</strong> first step in the process is to create a portfolio in TFE that will contain the symbols you are interested in<br />
mapping. Do so by clicking on the Add Portfolio icon in the upper left corner of the screen. <strong>The</strong> Add Portfolio<br />
dialog box shown below will pop up. Name the portfolio and set it to retrieve one year of data, then click OK.<br />
Your portfolio is now ready to accept symbols. (See Illustration 4.5.)<br />
14
Illustration 4.5. Add Portfolio icon and dialog box<br />
To add symbols to your portfolio, click on the Add Portfolio icon located in the upper left corner of the screen.<br />
<strong>The</strong> Add Symbols dialog box shown below will pop up. If you have typed a column of symbols in a text editor<br />
such as NotePad, you can select the “I want to import a list from a file” button. This feature is handy if you have<br />
a large list of symbols, because it will allow you to import the file without having to enter each individual<br />
symbol. If you have only a few symbols, click on the “I know the symbols and will type them” button. You can<br />
then type in each symbol. When you are finished, click OK and your symbols will load into the portfolio you<br />
created. (See Illustration 4.6).<br />
Illustration 4.6. Add Symbols icon and dialog box<br />
Finally, click on the Download icon to import the data. With that finished, you are now ready for the next step.<br />
Step Two: Visual mapping of individual stocks and futures contracts<br />
Start at the top of your portfolio’s list of stocks or futures contracts and examine each one for the following:<br />
• Concentrate on the actual trends a stock has made in the past 3 - 6 months<br />
• Determine if the price bars extend through the Fence, the Wall or the Tripwire frequently in the<br />
course of the trend. (For mapping, ignore the 3SMA Safety Line.)<br />
• Check to see whether the daily range for each bar is consistent, or whether there are large<br />
variations in bar length, or frequent gaps, or both.<br />
In Illustrations 4.7a- 4.10 below, notice that the price bars are inconsistent in length and cut regularly through<br />
the Stability lines. If any stock you are studying exhibits characteristics similar to those in Figures 1-4, it is not<br />
currently a good candidate for TFE even though it may be trending. Discard it and go on to the next one.<br />
15
Illustration 4.7a. Example of poor candidate for trading with TFE (FRO – 9/9/05-12/7/05)<br />
Illustration 4.7b. Example of poor candidate for trading with TFE (ASH – 9/8/05-12/7/05)<br />
16
Illustration 4.8a. Example of poor candidate for trading with TFE (TNH – 9/8/05-12/7/05)<br />
Illustration 4.8b. Example of poor candidate for trading with TFE (KEY – 7/28/05-10/25/05)<br />
17
Illustration 4.9. Example of poor trading candidate, March ’06 Cocoa—CCH6 (9/20/05-12/20/05)<br />
Illustration 4.10. Example of poor trading candidate, January ’06 Crude Light—CLF6 (9/20/05-12/20/05)<br />
Note that the bars in this chart are inconsistent in length. Also,<br />
quite a few bars cross all of the Stability Lines<br />
As you go through Illustrations 4.7a – 4.10 above, you will notice that in every case, bar length (which<br />
translates into volatility) is inconsistent. Furthermore the bars themselves frequently cross one or more of the<br />
stability lines. If a stock or futures contract you are examining exhibits similar traits, don’t include it in your<br />
watch list.<br />
18
Low-risk stocks and futures contracts<br />
We’re now going to take a look at examples of Low-Risk stocks and future contracts whose present cycles are<br />
in harmony with TFE. <strong>The</strong> first examples, Illustrations 4.11 and 4.12, will show Alcoa’s behavior prior to<br />
transition into a potentially tradable candidate. Notice in Illustration 4.11 that bar length is inconsistent and<br />
that there are quite a few longer bars. Price movement tends to be erratic. <strong>The</strong> chart doesn’t differ too much<br />
from the examples in Illustrations 4.7 – 4.10 above.<br />
Illustration 4.11. Low-Risk Alcoa Inc. prior to transition. (AA—1/21/05-4/25/05)<br />
In Illustration 4.12, we can see that as time goes forward, bar length is shortening and becoming more<br />
consistent. Chart behavior is somewhere between a poor candidate and a good candidate.<br />
19
Illustration 4.12. Low-Risk Alcoa Inc. beginning transition. (AA—6/7/05-9/7/05)<br />
Illustration 4.13 shows Alcoa’s behavior after transition into its present stable cycle. Notice that the bars are<br />
shorter and more uniform in length. Notice also, that only the Fence gets crossed occasionally, the Tripwire<br />
rarely, and the Wall only during a major change in direction. This stock is mapped and can be included in the<br />
watch list. It can be traded with confidence as signals are generated because it is in sync with TFE.<br />
Illustration 4.13. Low-Risk Alcoa Inc. after transition. (AA—9/8/05-12/7/05)<br />
20
Illustrations 4.14a through 4.17 show additional examples of Low-Risk stocks and futures that have been<br />
mapped for TFE.<br />
Illustration 4.14a. Low-Risk Agere Systems Inc. after transition. (AGR—9/8/05-12/7/05)<br />
Illustration 4.14b. Low-Risk Ishare DJ FN SRV CMP Inc. after transition. (IYG—9/8/05-12/7/05)<br />
21
Illustration 4.14c. Low-Risk Prudential Financial Inc. after transition. (PRU—9/8/05-12/7/05)<br />
Illustration 4.15. Low-Risk OM Group Inc. after transition. (OMG—9/8/05-12/7/05)<br />
22
Illustration 4.16. Low-risk Futures Contract March ’06 Sugar—SBH6 (9/21/05-12/20/05)<br />
Illustration 4.16. Low-risk Futures Contract March ’06 Sugar—SBH6 (9/21/05-12/20/05)<br />
23
Illustration 4.17. Low-risk futures contract, June ’06 EuroDollar—EDM6 (9/20/05-12/20/05)<br />
In summary, the Low-Risk category contains stocks and futures contracts with<br />
• bars of consistent length<br />
• and relatively low frequency of breaching of the Stability Lines.<br />
24
Medium-Risk stocks and futures contracts<br />
Illustrations 4.18a through 4.20 show examples of stocks and futures from the Medium-Risk watch list. Notice<br />
that while the bars are fairly consistent in length, they tend to occasionally breach the Tripwire, and once in a<br />
while, the Wall.<br />
Illustration 4.18a. Medium-Risk ABV after transition. (ABV—9/8/05-12/7/05)<br />
Illustration 4.18b. Medium-Risk HSBC Holdings PLC ADS after transition. (HBC—9/8/05-12/7/05)<br />
25
Illustration 4.18c. Medium-Risk Schering Plough CP after transition. (SGP—9/8/05-12/7/05)<br />
Illustration 4.19. Medium-risk futures contract, March ’06 Nasdaq E-Mini—NQH6 (9/21/05-12/20/05)<br />
26
Illustration 4.20. Medium-risk futures contract, January ’06 Unleaded Gas—HUH6 (9/21/05-12/20/05)<br />
In summary, although the bars in the Medium-Risk category are fairly consistent in length,<br />
• they tend to occasionally produce a few longer bars.<br />
• <strong>The</strong> bars are also more likely to breach the Tripwire, and once in a while, the Wall.<br />
27
Stocks on the High-Risk Watch List<br />
Illustrations 4.21a through 4.23 show examples of stocks and futures from the High-Risk watch list. Unlike the<br />
Medium-Risk charts, the bars in High-Risk charts are less consistent in length. However, like the Medium-Risk<br />
stocks, the bars often breach the Fence, and tend to occasionally breach the Tripwire, and once in a while, the<br />
Wall.<br />
Illustration 4.21a. High-Risk American Campus Comm after transition. (ACC—9/8/05-12/7/05)<br />
Illustration 4.21b. High-Risk Equus II Inc. after transition. (EQS—9/8/05-12/7/05)<br />
28
Illustration 4.22. High-Risk Limited Brands Inc. after transition. (LTD—9/8/05-12/7/05)<br />
Illustration 4.23. High-Risk Futures Contract, March ’06 Cotton—CTH6 (9/20/05-12/20/05)<br />
To summarize the characteristics of stocks and futures contracts in the High-Risk category,<br />
• the price bars are less consistent in length than those found in the Low- and Medium-Risk groups.<br />
• Also, breaches of the Stability Lines occur with greater frequency.<br />
29
Now that you have been introduced to the methodology of mapping as outlined above, you can perform your<br />
own screens on the thousands of stocks in the AMEX and NYSE, or the hundreds of futures contracts, if you<br />
desire, or you can simply look over the pre-screened stock and futures Watch lists.<br />
A word about volume<br />
<strong>The</strong> Watch Lists do not filter volume because every trader has a different idea of what constitutes acceptable<br />
volume levels. Thus, whether you choose to use TFE’s Watch Lists, or develop your own, be sure to apply<br />
whatever volume filter you deem necessary.<br />
<strong>The</strong> great thing with TFE, however, is that once you find a good group of stocks from the Watch Lists or from<br />
your own efforts at mapping, then all you need to do is follow the signals TFE generates and trade them over<br />
the next three to six months.<br />
Now that I’ve screened and mapped my portfolio, how do I know if there is a potential trade? Proceed<br />
to Module 5 to find out how the Gatekeeper, the Momentum Oscillator, and the Accelerometer work<br />
together to reveal potential trades.<br />
30
Module 5. Finding a wave to ride: <strong>The</strong> Momentum Oscillator, the Accelerometer, and the Gatekeeper<br />
In this module, you will learn how the Momentum Oscillator (MO) and the Accelerometer (ACC) work<br />
together with the Gatekeeper to provide entry signals, stop loss values, profit targets, and exit points.<br />
<strong>The</strong> basic trading rules for stocks and futures are exactly the same, so all instructional references to<br />
stocks apply to futures, and all instructional references to futures apply to stocks.<br />
In the markets, each stock or futures contract emits a signal that we recognize as a price chart. That signal<br />
carries a wealth of information and expresses itself in the form of price waves moving up and down through<br />
time. TFE breaks the chart's signal down into its component parts, two of which are the MO and the ACC.<br />
<strong>The</strong> MO shows us the strength and direction of market movement, including approximately where major waves<br />
begin and end, and how often they occur. It also generates buy and sell signals.<br />
<strong>The</strong> ACC measures the speed at which price is moving and provides an early warning of possible changes in<br />
market direction. As an indicator, the ACC also identifies minor waves, which carry information for stop loss<br />
values and exit points.<br />
Together, the MO, the ACC, and the Gatekeeper reveal the market’s underlying structure. <strong>The</strong> following<br />
instructional modules will show you how.<br />
Module 4 answered the question, “How do I select a stock or futures contract to trade?” This module answers<br />
these questions:<br />
A. After I make my selection, is there a potential trade?<br />
B. If so, where is my entry point?<br />
C. What should my initial stop loss be?<br />
D. How do I determine my daily stop loss value?<br />
E. How do I know when to exit?<br />
F. If the market moves against my position, where do I exit?<br />
A. Is there a potential trade?<br />
Set up for possible long trade<br />
Now that you have screened candidates for possible trades, let's get started! <strong>The</strong> upward or downward trends<br />
in many of the stocks and futures on the Watch Lists, and many of those you screened yourself, may be<br />
maturing. Ideally, we want to get aboard a trend (a major wave) as early as possible. <strong>The</strong> question is, how do<br />
we know a new trend is beginning? To get a better feel for the answer, we'll examine Illustration 5.1, where<br />
we'll be looking at how to identify a potential long trade using these three early warning criteria:<br />
• <strong>The</strong> first sign of change in a trend's direction from down to up comes from the ACC. We're looking for the<br />
ACC's histogram bars to turn green. <strong>The</strong> value of each successive bar will be greater than the last as they<br />
move toward, or cross, the zero line from negative to positive (Area 1 in Illustration 5.1).<br />
• <strong>The</strong> second indication of trend change occurs when the MO is below zero and the MO's histogram bars<br />
turn green. Also, the value of each successive green bar is greater than the last as the MO moves toward<br />
the zero line from negative to positive. And, most importantly, the value of the MO's Signal Line is less than<br />
the value of the MO. In other words, the Signal Line is separating from the MO’s histogram bars. (Area 2 in<br />
Illustration 5.1).<br />
• <strong>The</strong> third mark of a possible change in trend is when the 3SMA and the Fence cross. For an upward move<br />
the value of the 3SMA is greater than the value of the Fence (Area 3 in Illustration 5.1). In this case, the<br />
3SMA's value of 27.55 is larger than the Fence's value of 27.38.<br />
31
Illustration 5.1. Locating a potential long trade. (ABV.C – Comp De Bebi AM ADS 9/24/2005–10/27/2005)<br />
When all three criteria are met, we have confirmation that a change in direction from down to up could be in the<br />
making. Illustration 5.2 shows what happened over the next few weeks.<br />
Illustration 5.2. Change in trend. (ABV.C – Comp De Bebi AM ADS 9/24/2005–11/21/2005)<br />
32<br />
2<br />
3<br />
1<br />
1<br />
3<br />
2
Setup for possible short trade<br />
Let's move on to Illustration 5.3 for an example of the set up for a possible short trade using these three early<br />
warning criteria:<br />
1. <strong>The</strong> first sign of change in a trend's direction from up to down comes from the ACC. We're looking for the<br />
ACC's histogram bars to turn red. <strong>The</strong> value of each successive bar will be lower than the last as they<br />
move toward, or cross, the zero line from positive to negative (Area 1 in Illustration 5.3).<br />
2. <strong>The</strong> second indication of trend change occurs when the MO is above zero, the MO's histogram bars turn<br />
red. Also, the value of each successive red bar is less than the last as the MO moves toward the zero line<br />
from positive to negative. And, most importantly, the value of the MO's Signal Line is greater than the value<br />
of the MO (Area 2 in Illustration 5.3).<br />
3. <strong>The</strong> third mark of a changing trend is when the 3SMA and the Fence cross. For a downward move, the<br />
value of the 3SMA is lower than the value of the Fence (Area 3 in Illustration 5.3). In this case, the<br />
3SMA's value of 42.39 is lower than the Fence's value of 42.53.<br />
Illustration 5.3. Locating a potential short trade. (TI – Telecom ITL New, 8/16/2005-10/6/05)<br />
When all three criteria are met, we have confirmation that a change in direction from up to down is in the<br />
making.<br />
1<br />
33<br />
3<br />
2
When all three criteria are met, we have confirmation that a change in direction from up to down may be in the<br />
making. Illustration 5.4 shows what happened over the next few weeks.<br />
Illustration 5.4. Change in trend. (TI – Telecom ITL New, 8/16/2005-11/14/2005)<br />
B. If there is a potential trade, where is my entry point?<br />
<strong>Basic</strong> entry signals come from two sources: fractals and Momentum Crossovers (MOXO). In this section, we'll<br />
cover entering a trade with each type of signal. At this point, we're only interested in what the indicators tell us<br />
for entry. We'll get to stop loss and exit points later.<br />
FRACTALS<br />
Fractal formations in the price charts<br />
Williams (1998) [[http://www.wiley.com] was the first to identify, define, and develop the concept of fractals as<br />
they appear on price charts and as they apply to the analysis of market action. He observed that it is precisely<br />
those fractals that are the key to how the markets organize themselves. And it is those fractals that we will<br />
examine now, because we will work with them every day. This type of fractal is composed of at least five<br />
consecutive bars, the center bar of which has a higher high (or lower low) than the two (or more) bars<br />
preceding it and the two (or more) bars following it.<br />
1<br />
34<br />
2<br />
3
Illustration 5.5 illustrates this ideal fractal pattern (the two on the far left labeled "A") and depicts several<br />
variations as well. Notice that in every case, the fractal bar (the one with the arrow) is higher (lower) than the<br />
two (or more) bars preceding it and the two (or more) bars following it. Note: <strong>The</strong>re are times when two<br />
middle bars with the same high/low occur (see circled fractals in Illustration 5.5). In that case, the most<br />
recent of the two is the fractal bar.<br />
Illustration 5.5. Frequently-occurring fractal formations<br />
For stocks, the fractal bar is considered valid only if it is completely clear of all stability lines. For futures, the<br />
fractal bar is considered valid only if at least 62% of the bar extends beyond all stability lines. Don’t worry about<br />
this, though, because the TFE software distinguishes between stocks and futures, and automatically identifies<br />
valid buy and sell fractals for you. It marks valid buy fractals with a green "B" and valid sell fractals with a red<br />
"S."<br />
NOTE: Once generated, fractals remain valid until they are "hit." <strong>The</strong>oretically, a fractal is valid until<br />
price rises two ticks above a buy fractal bar's high, or falls two ticks below a sell fractal's low. In<br />
reality, most fractals over 21 trading days old will have already been superceded by other signals.<br />
Buy Fractals<br />
We'll use Illustration 5.6 to demonstrate how we enter the market using a fractal. Let's suppose we want to<br />
buy Abercrombie and Fitch (ANF).<br />
• Find the most recent valid buy fractal (marked with a green "B"). In this case, it's the 10/21/05 bar.<br />
• Add two ticks to the high of the buy fractal to get the entry point. In this case, the high 50.34 + .02 = 50.36.<br />
• Input 50.36 as a buy order electronically, or call you broker with instructions to buy x shares when the price<br />
reaches or exceeds 50.36.<br />
35
Illustration 5.6. Using a buy fractal to enter the market (ANF – Abercrombie & Fitch, 8/17/05-10/31/05).<br />
Sell Fractals<br />
We'll use Illustration 5.7 to demonstrate how we enter the market using a fractal. Let's suppose we want to<br />
take a short position in Ormat Technologies:<br />
• Find the most recent valid sell fractal (marked with a red "S"). In this case, it's the 9/30/05 bar.<br />
• Subtract two ticks from the low of the sell fractal to get the entry point. In this case, the low 21.97 - .02 =<br />
21.95.<br />
• Input 21.95 as a sell order electronically, or call you broker with instructions to sell x shares when the price<br />
reaches or falls below 21.95.<br />
Illustration 5.7. Using a sell fractal to enter the market (ORA – Ormat Technologies, 7/19/05-10/5/05).<br />
That's basically all there is to entering the market using fractals. Next, let's look at Momentum Crossover<br />
(MOXO) signals for entry.<br />
36<br />
1<br />
2<br />
3<br />
2<br />
1<br />
3
Momentum Crossover Buy Signals (MOXO Buy)<br />
<strong>The</strong> Momentum Oscillator generates a buy signal that consists of only two histogram bars and actually begins<br />
below the zero line. <strong>The</strong> zero line is the point at which the momentum has completely changed direction, but<br />
has not yet begun moving in the new direction. However, when the histogram bars cross the zero line,<br />
movement has begun, and we are moving with it.<br />
NOTE: A MOXO buy signal is valid until hit. We can use this signal to enter the market regardless of how near<br />
or far away a buy fractal is from the MOXO.<br />
For a MOXO buy signal to be valid, the criteria below must be met:<br />
1. <strong>The</strong> first MO histogram bar must be immediately below the zero line and the very next bar, the signal bar,<br />
must cross the zero line from negative to positive. Illustration 5.8 depicts this formation.<br />
2. <strong>The</strong> value of the 3SMA Safety Line must be greater than the value of the Fence.<br />
3. Set entry price at two ticks above high of signal bar.<br />
Illustration 5.8. <strong>The</strong> MOXO buy signal<br />
Zero Line<br />
Signal<br />
Bar<br />
Signal<br />
Bar<br />
Let's take a look at Illustration 5.9 for an example of how this comes together on a price chart. <strong>The</strong> numbers<br />
on the chart correspond to the criteria outlined above.<br />
37
Illustration 5.9. MOXO buy signal (PLL – Pall CP, 8/31/05-11/2/05).<br />
38
Momentum Crossover Sell Signal (MOXO Sell)<br />
<strong>The</strong> Momentum Oscillator generates a sell signal that consists of only two histogram bars and actually begins<br />
above the zero line. <strong>The</strong> zero line is the point at which the momentum has completely changed direction, but<br />
has not yet begun moving in the new direction. However, when the histogram bars cross the zero line,<br />
movement has begun, and we are moving with it.<br />
NOTE: A MOXO sell signal is valid until it is hit. We can use this signal to enter the market regardless<br />
of how near or far away a sell fractal is from the MOXO.<br />
For a MOXO sell signal to be valid, the following criteria must be met:<br />
1. <strong>The</strong> first MO histogram bar must be immediately above the zero line and the very next bar, the signal<br />
bar, must cross the zero line from positive to negative. Illustration 5.10 depicts this formation.<br />
2. <strong>The</strong> value of the 3SMA Safety Line must be less than the value of the Fence.<br />
3. Set entry price at two ticks below low of signal bar.<br />
Illustration 5.10. <strong>The</strong> MOXO sell signal<br />
Zero Line Signal<br />
Bar<br />
Signal<br />
Bar<br />
Let's take a look at Illustration 5.11 for an example of how this comes together on a price chart. <strong>The</strong> numbers<br />
on the chart correspond to the criteria outlined above.<br />
39
Illustration 5.11. MOXO sell signal (KEM – Kemet Corp, 7/27/05-10/10/05).<br />
40
That's all there is to entry using Momentum Crossover (MOXO) signals. Table 5.12 recaps Fractal and MOXO<br />
entry rules:<br />
Table 5.12. Summary of entry signals and rules.<br />
LONG ENTRY RULES SHORT ENTRY RULES<br />
Buy Fractals Sell Fractals<br />
1. Buy Fractals are marked with a green "B"<br />
above the high of the fractal bar.<br />
2. Enter market when price rises to an amount<br />
equal to or greater than two ticks above the<br />
fractal bar's high.<br />
3. A buy fractal is valid until it is hit.<br />
MOXO Buy MOXO Sell<br />
1. Signal bar is first MO bar that crosses zero line<br />
from negative to positive.<br />
2. 3SMA Safety line must be greater than Fence.<br />
3. Entry point is two ticks above high of<br />
corresponding price bar.<br />
4. A MOXO buy signal is valid until hit.<br />
41<br />
1. Sell Fractals are marked with a red "S" below<br />
the low of the fractal bar.<br />
2. Enter market when price falls to an amount<br />
equal to or less than two ticks below the fractal<br />
bar's low.<br />
3. A sell fractal is valid until it is hit.<br />
1. Signal bar is first MO bar that crosses zero line<br />
from positive to negative.<br />
2. 3SMA Safety line must be less than Fence.<br />
3. Entry point is two ticks below low of<br />
corresponding price bar.<br />
4. A MOXO sell signal is valid until hit.
C. What should my initial stop loss be?<br />
Long positions<br />
In determining the first-day stop loss for a long position, we will consider the lower of either<br />
• the lowest low of the last three price bars (including the signal bar)<br />
• or the lowest stability line below the low of the signal bar<br />
In Illustration 5.13, the lowest low of the last three price bars for this Fractal entry is 45.41. <strong>The</strong> lowest<br />
Stability line below the low of the signal bar is the Fence, at 48.65. Since the value of the Fence is not below<br />
the value of the lowest low of the last three price bars, we’ll set our first-day stop loss point at 45.41 (red “x”),<br />
the lowest of the three most recent bars. You may, of course, employ a different method of determining a stop<br />
loss that is in keeping with your risk tolerance and money management practices.<br />
Illustration 5.13. Setting the initial stop loss for a long trade with Fractal entry (ANF, 8/29/05-10/25/05).<br />
42
In Illustration 5.14, the lowest low of the last three price bars for this MOXO entry is 25.52. <strong>The</strong> lowest<br />
Stability Line below the low of the signal bar is the Fence, at 25.66. However, the value of the Fence is not<br />
below the lowest low of the most recent three price bars. So we’ll set our first-day stop loss point at 25.52 (red<br />
“x”), the lowest of the three most recent bars. You may, of course, employ a different method of determining a<br />
stop loss that is in keeping with your risk tolerance and money management practices.<br />
Illustration 5.14. Setting the initial stop loss for a long trade with MOXO entry (PLL – Pall CP, 8/31/05-<br />
11/2/05).<br />
Short positions<br />
MOXO Entry<br />
In determining the first-day stop loss for a short position, we will consider the higher of either<br />
• the highest high of the most recent three price bars (including the signal bar)<br />
• or the highest stability line above the high of the signal bar.<br />
43<br />
x<br />
Entry point set at high plus 2 ticks = 26.45<br />
Stop loss set at low of third bar back = 25.52
In Illustration 5.15, the highest high of the last three price bars for this Fractal entry is 23.46. <strong>The</strong> highest<br />
Stability line above the high of the signal bar is the Wall, at 22.94. Since the value of the Wall is not above the<br />
value of the highest of the last three price bars, we’ll set our first-day stop loss point at 23.46 (red “x”), the<br />
highest of the three most recent bars. You may, of course, employ a different method of determining a stop<br />
loss that is in keeping with your risk tolerance and money management practices.<br />
Illustration 5.15. Setting the initial stop loss for a short trade with Fractal entry (ORA, 7/19/05-10/5/05).<br />
44<br />
x<br />
Stop loss set at high of third bar back = 23.46<br />
Entry point set at low minus 2 ticks = 21.95
In Illustration 5.16, the highest high of the last three price bars for this MOXO entry is 8.65. <strong>The</strong> highest<br />
Stability line above the high of the signal bar is the Fence, at 8.33. Since the value of the Fence is not above<br />
the value of the highest of the last three price bars, we’ll set our first-day stop loss point at 8.65 (red “x”), the<br />
highest of the three most recent bars. You may, of course, employ a different method of determining a stop<br />
loss that is in keeping with your risk tolerance and money management practices.<br />
Illustration 5.16. Setting the initial stop loss for a short trade with MOXO entry (KEM, 7/27/05-10/10/05).<br />
Now that you have your entry point and your first-day stop loss point, you’re ready to give that information to<br />
your broker, or to enter into your online trading platform. In the next module, we answer these questions:<br />
• How do I determine my daily stop loss value?<br />
• How do I know when to exit?<br />
• If the market moves against my position, where do I exit?<br />
45<br />
x<br />
Stop loss set at high of third bar back= 8.65<br />
Entry point set at low minus 2 ticks = 7.84
Module 6. Determining stop loss values – Making the ride smooth<br />
In Module 5, we learned how to identify Fractal and MOXO entry signals and how to determine our initial stop<br />
loss point.<br />
In this module, we will go through two long and 2 short stock trades, and one long and one short<br />
futures trade to see how the ACC and the Gatekeeper show us where to set our daily stop loss points<br />
and when to exit a profitable trade.<br />
A Long Stock Fractal Entry Trade from Entry to Exit<br />
Fractal Entry<br />
We’ll begin this part of our instruction with the set up for a long trade using a Fractal entry. Let’s assume that<br />
the date is 10/28/05 and we’re looking at a chart of Abercrombie & Fitch (Illustration 6.1). Recall from Module<br />
5 that for a Fractal entry, we:<br />
• Find the most recent valid buy fractal (marked with a green "B"). In this case, it's the 10/21/05 bar.<br />
• Add two ticks to the high of the buy fractal bar to get the entry point. In this case, the high 50.34 + .02 =<br />
50.36.<br />
46
Illustration 6.1. Possible long trade with Fractal entry. (ANF, 8/29/2005 –<br />
10/28/2005)<br />
Initial Stop Loss<br />
Recall from Module 5 that for the first-day stop loss for a long position, we will consider the lower of either<br />
1. the lowest low of the last three price bars (including the signal bar)<br />
2. or the lowest stability line below the low of the signal bar<br />
In Illustration 6.1 above, the lowest low of the last three price bars (including the signal bar) for this Fractal<br />
entry is 45.41. <strong>The</strong> lowest Stability line below the low of the signal bar is the Fence, at 48.65. Since the value<br />
of the Fence is not below the value of the lowest low of the last three price bars, we’ll set our first-day stop loss<br />
point at 45.41 (red “x”), the lowest of the three most recent bars. You may, of course, employ a different<br />
method of determining a stop loss that is in keeping with your risk tolerance and money management<br />
practices.<br />
47
Now that we have determined our entry point and initial stop loss point, and have either given the information<br />
to our broker or entered it into our electronic trading platform, we are ready to trade. Our overall plan is to enter<br />
the market when the price equals or exceeds 50.36, and in accordance with the initial stop loss rule, we have<br />
set our initial stop loss at 45.41. To demonstrate the functionality of the stop loss algorithms, we’ll trade<br />
aggressively. Let’s see what occurs on the next day, 10/31/05.<br />
Day 1, 10/31/05 Illustration 6.2<br />
<strong>The</strong> 10/31/05 bar has exceeded our entry price, and we are in the market at 50.36.<br />
Illustration 6.2. Long trade with Fractal entry, Day 1 (ANF, 8/29/2005 – 10/31/2005)<br />
Now that we’ve entered the trade, we need to determine our daily stop loss values. So before we continue with<br />
the trade, we will go through the rules for setting trailing stop loss points and exiting with a profit.<br />
D. How do I determine my daily stop loss value?<br />
48
Rules for setting stop loss points for long positions<br />
TFE’s stop loss rules integrate the Accelerometer and the Gatekeeper.<br />
1. Set initial stop at the lower of either:<br />
a. the lowest low of last three price bars (including the signal bar), or<br />
b. or the value of the lowest stability line below the low of the signal bar.<br />
2. If the low of the entry-day bar is lower than the farthest Stability Line, stay with initial stop until the low of<br />
the current day’s bar is above the farthest Stability Line, then go to Rule #3.<br />
If the low of the entry-day bar is higher than the farthest Stability Line, go directly to Rule #3.<br />
3. Depending on your trading style, risk tolerance, and money management practices,<br />
a. For an aggressive approach, if the Wall (blue line) is the farthest Stability Line, follow the Wall;<br />
otherwise, follow the farthest Stability Line until it crosses the Wall, then follow the Wall.<br />
b. For a less aggressive approach, if the Tripwire (red line) is the farthest Stability Line, follow the<br />
Tripwire; otherwise follow the farthest Stability Line until it crosses the Tripwire, then follow the<br />
Tripwire.<br />
c. For a conservative approach, if the Fence (green line) is the farthest Stability Line, follow the Fence;<br />
otherwise, follow the farthest Stability Line until it crosses the Fence, then follow the Fence.<br />
4. If the ACC is greater than zero, follow rule #3 above.<br />
5. If the current ACC histogram bar is above zero and three consecutive red ACC bars (including the current<br />
bar) have occurred, move up one Stability Line for each set of three red ACC bars. For example, if you are<br />
currently following the Wall and there are three consecutive red ACC bars (including the current bar) then<br />
move up to the Tripwire. When the next set of three reds occurs, move up to the Fence, and so on until<br />
stopped out.<br />
6. If the current ACC histogram bar crosses the zero line from positive to negative, move immediately to the<br />
3SMA Safety Line and follow it.<br />
7. Other than on entry day, if the 3SMA Safety Line crosses the Fence so that the value of the Fence is<br />
greater than the value of the 3SMA Safety Line, move to and follow the 3SMA Safety Line as your stop loss<br />
until stopped out<br />
As we proceed through our trade, you’ll have a chance to see how easy it is to apply the stop loss rules. So<br />
let’s continue with Day 1, as viewed in Illustration 6.3 below.<br />
49
Day 1, 10/31/05 Illustration 6.3<br />
Our entry price has been hit and we are in the market. Since the low of the current bar is above the lowest<br />
Stability Line, we are now following stop loss rule #3. We are trading aggressively, so we’ll use the lowest<br />
Stability Line until the Wall becomes the lowest. In this case, the Tripwire, at 48.95, has the lowest value, so<br />
we will set that as our stop loss point (red “x”).<br />
Illustration 6.3. Long trade with Fractal entry, Day 1 (ANF, 8/29/2005 – 10/31/2005)<br />
50
Day 2, 11/1/05 Illustration 6.4<br />
As the trade continues, we are still following stop loss rule #3. <strong>The</strong> Wall, at 49.12, is now the Stability Line with<br />
the lowest value. In addition, the ACC is above zero and green, so we will use 49.12 as our trailing stop loss<br />
(red “x”).<br />
Illustration 6.4. Long trade with Fractal entry, Day 2 (ANF, 8/29/2005 – 11/1/2005)<br />
51
Day 3, 11/2/05 Illustration 6.5<br />
Moving along, we continue to follow stop loss rule #3. We are following the Wall, and since the ACC is above<br />
zero and green, we will use the Wall’s value of 49.34 as our trailing stop loss (red “x”).<br />
Illustration 6.5. Long trade with Fractal entry, Day 3 (ANF, 8/29/2005 – 11/2/2005)<br />
52
Day 4, 11/3/05 Illustration 6.6<br />
We are still following stop loss rule #3. We are following the Wall, and since the ACC remains above zero and<br />
green, we will use the Wall’s value of 49.84 as our trailing stop loss (red “x”).<br />
Illustration 6.6. Long trade with Fractal entry, Day 4 (ANF, 8/29/2005 – 11/3/2005)<br />
53
Day 5, 11/4/05 Illustration 6.7<br />
At the end of Day 5, we are still following stop loss rule #3. We are trailing the Wall, and since the ACC<br />
remains above zero and green, we will use the Wall’s value of 50.43 as our trailing stop loss (red “x”).<br />
Illustration 6.7. Long trade with Fractal entry, Day 5 (ANF, 8/29/2005 – 11/4/2005)<br />
54
Day 6, 11/7/05 Illustration 6.8<br />
At the end of Day 6, we are still following stop loss rule #3. We are trailing the Wall, and since the ACC<br />
remains above zero and green, we will use the Wall’s value of 51.06 as our trailing stop loss (red “x”).<br />
Illustration 6.8. Long trade with Fractal entry, Day 6 (ANF, 8/29/2005 – 11/7/2005)<br />
55
Day 7, 11/8/05 Illustration 6.9<br />
At the end of Day 7, we are still following stop loss rule #3. We are currently trailing the Wall. However,<br />
although the ACC remains above zero, it has turned red. This is an indication that the speed at which price is<br />
traveling may be slowing down. We will still use the Wall’s value of 51.67 as our trailing stop loss (red “x”), but<br />
we’ll watch the indicators closely.<br />
Illustration 6.9. Long trade with Fractal entry, Day 7 (ANF, 8/29/2005 – 11/8/2005)<br />
56
Day 8, 11/9/05 Illustration 6.10<br />
At the end of Day 8, we are still following stop loss rule #3, and are currently trailing the Wall. However,<br />
although the ACC remains above zero, it has now shown us a second consecutive red bar. This is an<br />
indication that the speed at which price is traveling is slowing down. We will still use the Wall’s value of 52.41<br />
as our trailing stop loss (red “x”), but we’ll watch the indicators closely.<br />
Illustration 6.10. Long trade with Fractal entry, Day 8 (ANF, 8/29/2005 – 11/9/2005)<br />
57
Day 9, 11/10/05 Illustration 6.11<br />
At the end of Day 9, in addition to a third consecutive red bar, the ACC crossed the zero line from positive to<br />
negative. This is a signal to follow rule #6, which has us move our stop loss point immediately to the Safety<br />
Line. We will use the Safety Line’s value of 58.73 as our trailing stop loss (red “x”), and follow the Safety Line<br />
until we are stopped out.<br />
Illustration 6.11. Long trade with Fractal entry, Day 9 (ANF, 8/29/2005 – 11/10/2005)<br />
58
Day 10, 11/11/05 Illustration 6.12<br />
On Day 10, we are stopped out at 58.73 for a gain of $8.37 per share.<br />
Illustration 6.12. Long trade with Fractal entry, Day 10 (ANF, 8/29/2005 – 11/15/2005)<br />
59
A Long Stock Momentum Crossover Entry Trade from Entry to Exit<br />
We will now examine another long trade, but this time using the Momentum Crossover (MOXO) buy signal.<br />
Let’s assume that the date is 11/2/05 and we’re looking at a chart of Pall CP—PLL (Illustration 6.13). Recall<br />
from Module 5 that for a MOXO buy signal to be valid:<br />
1. <strong>The</strong> first MO histogram bar must be immediately below the zero line and the very next bar, the signal bar,<br />
must cross the zero line from negative to positive.<br />
2. <strong>The</strong> value of the 3SMA Safety Line must be greater than the value of the Fence.<br />
3. If conditions 1 and 2 are met, set entry price at two ticks above high of signal bar.<br />
60
Setup Day, 11/2/05 Illustration 6.13<br />
In Illustration 6.13 below, we can see that the Momentum Oscillator has crossed the zero line, and that the<br />
value of 3SMA Safety Line, at 26.13, is higher than the value of the Fence, at 25.77. <strong>The</strong> high of the signal bar<br />
is 26.43. We will set our entry point at 2 ticks above that price, or 26.45.<br />
Also, the lowest low of the last three price bars (including the signal bar) for this MOXO entry is 25.52. <strong>The</strong><br />
lowest Stability line below the low of the signal bar is the Tripwire, at 25.74. Since the value of the Tripwire is<br />
not below the value of the lowest low of the last three price bars, we’ll set our first-day stop loss point at 25.52<br />
(red “x”), the lowest of the three most recent bars. You may, of course, employ a different method of<br />
determining a stop loss that is in keeping with your risk tolerance and money management practices.<br />
Illustration 6.13. Possible long trade with MOXO entry. (PLL – Pall CP, 8/31/05-11/2/05).<br />
61
Now that we have determined our entry point and initial stop loss point, and have either given the information<br />
to our broker or entered it into our electronic trading platform, we are ready to trade. Our overall plan is to enter<br />
the market when the price equals or exceeds 26.45, and in accordance with the initial stop loss rule, we have<br />
set our initial stop loss at 25.52. To demonstrate the functionality of the stop loss algorithms, we’ll trade<br />
aggressively. Let’s see what occurs on the next day,11/3/05.<br />
Day 1, 11/3/05 Illustration 6.14<br />
<strong>The</strong> 11/2/05 bar has exceeded our entry price, and we are in the market at 26.45. Since the low of the current<br />
bar is above the Stability Lines, we are now following stop loss rule #3. We are trading aggressively, so we’ll<br />
use the lowest Stability Line until the Wall becomes the lowest. In this case, the Tripwire, at 25.78, has the<br />
lowest value, so we will set that as our stop loss point (red “x”). We also note that the ACC is showing a red<br />
bar.<br />
Illustration 6.14. Long trade with MOXO entry, Day 1 (PLL – Pall CP, 8/31/05-11/3/05).<br />
62
Day 2, 11/4/05 Illustration 6.15<br />
As the trade continues, we are still following stop loss rule #3. <strong>The</strong> Wall, at 25.84, is now the Stability Line with<br />
the lowest value. We will use 25.84 as our trailing stop loss (red “x”). However, while the ACC is above zero it<br />
is showing its second consecutive red bar. This is an early warning of a slowdown in the speed at which price<br />
is moving. <strong>The</strong> MO is above zero, green, and the value of the MO signal line is lower than the value of the<br />
histogram bars. Thus, a change in overall direction is not indicated.<br />
Illustration 6.15. Long trade with MOXO entry, Day 2 (PLL – Pall CP, 8/31/05-11/4/05).<br />
63
Day 3, 11/7/05 Illustration 6.16<br />
At the end of Day 3, we find that while the ACC is above zero it is showing its third consecutive red bar. This is<br />
an early warning of a slowdown in the speed at which price is moving, and a signal to follow stop loss rule # 5,<br />
moving from following the Wall to following the Tripwire. We will use the Tripwire’s value of 25.93 as our trailing<br />
stop loss (red “x”). We will follow the Tripwire until the ACC shows us another three consecutive red bars, or it<br />
crosses the zero line into negative territory. However, since the MO is above zero, green, and the value of the<br />
MO signal line is lower than the value of the histogram bars, a change in overall direction is not yet indicated.<br />
Illustration 6.16. Long trade with MOXO entry, Day 3 (PLL – Pall CP, 8/31/05-11/7/05).<br />
64
Day 4, 11/8/05 Illustration 6.17<br />
At the end of Day 4, we find that the ACC is above zero and is showing a green bar. We’ll continue to observe<br />
stop loss rule # 5, and follow the Tripwire. Thus, we will use the Tripwire’s value of 26.04 as our trailing stop<br />
loss (red “x”). We will follow the Tripwire until the ACC either shows us another three consecutive red bars or<br />
crosses the zero line into negative territory. In addition, since the MO is above zero and green, and the value of<br />
the MO signal line is lower than the value of the histogram bars, a change in overall direction is not yet<br />
indicated.<br />
Illustration 6.17. Long trade with MOXO entry, Day 4 (PLL – Pall CP, 8/31/05-11/8/05).<br />
65
Day 5, 11/9/05 Illustration 6.18<br />
At the end of Day 5, we find that the ACC is above zero and still green. Also, since the MO is above zero,<br />
green, and the value of the MO signal line is lower than the value of the histogram bars, a change in overall<br />
direction is not yet indicated. We’ll continue to observe stop loss rule # 5, and follow the Tripwire. Thus, we will<br />
use the Tripwire’s value of 26.16 as our trailing stop loss (red “x”). We will follow the Tripwire until the ACC<br />
either shows us another three consecutive red bars or crosses the zero line into negative territory.<br />
Illustration 6.18. Long trade with MOXO entry, Day 5 (PLL – Pall CP, 8/31/05-11/9/05).<br />
66
Day 6, 11/10/05 Illustration 6.19<br />
At the end of Day 6, we find that the ACC is above zero but is now showing a red bar. However, since the MO<br />
is above zero, green, and the value of the MO signal line is lower than the value of the histogram bars, a<br />
change in overall direction is not yet indicated. We’ll continue to observe stop loss rule # 5, and follow the<br />
Tripwire. Thus, we will use the Tripwire’s value of 26.34 as our trailing stop loss (red “x”). We will follow the<br />
Tripwire until the ACC either shows us another three consecutive red bars or crosses the zero line into<br />
negative territory.<br />
Illustration 6.19. Long trade with MOXO entry, Day 6 (PLL – Pall CP, 8/31/05-11/10/05).<br />
67
Day 7, 11/11/05 Illustration 6.20<br />
At the end of Day 7, we find that the ACC is above zero but is now showing two consecutive red bars.<br />
However, since the MO is above zero, green, and the value of the MO signal line is lower than the value of the<br />
histogram bars, a change in overall direction is not yet indicated. We’ll continue to observe stop loss rule # 5,<br />
and follow the Tripwire. Thus, we will use the Tripwire’s value of 26.53 as our trailing stop loss (red “x”). We will<br />
follow the Tripwire until the ACC either shows us another three consecutive red bars or crosses the zero line<br />
into negative territory.<br />
Illustration 6.20. Long trade with MOXO entry, Day 7 (PLL – Pall CP, 8/31/05-11/11/05).<br />
68
Day 8, 11/14/05 Illustration 6.21<br />
At the end of Day 8, we find that the ACC is above zero but is now showing three consecutive red bars, a<br />
warning of a slow down in the speed at which price is moving. However, since the MO is above zero, green,<br />
and the value of the MO signal line is lower than the value of the histogram bars, a change in overall direction<br />
is not yet indicated. We’ll continue to observe stop loss rule # 5, which states that for each set of three<br />
consecutive red ACC bars, we move up one Stability Line.<br />
Up to this point we have been following the Tripwire, so now we will move to the Fence and use its value of<br />
26.97 as our trailing stop loss (red “x”). We will follow the Fence until the ACC either shows us another three<br />
consecutive red bars or crosses the zero line into negative territory.<br />
Illustration 6.21. Long trade with MOXO entry, Day 8 (PLL – Pall CP, 8/31/05-11/14/05).<br />
69
Day 9, 11/15/05 Illustration 6.22<br />
At the end of Day 9, we find that the ACC is above zero and has now returned to green. Moreover, since the<br />
MO is above zero and green, and the value of the MO signal line is lower than the value of the histogram bars,<br />
a change in overall direction is not yet indicated. We’ll continue to observe stop loss rule # 5 and follow the<br />
Fence, using its value of 27.12 as our trailing stop loss (red “x”). We will follow the Fence until the ACC either<br />
shows us another three consecutive red bars or crosses the zero line into negative territory.<br />
Illustration 6.22. Long trade with MOXO entry, Day 9 (PLL – Pall CP, 8/31/05-11/15/05).<br />
70
Day 10, 11/16/05 Illustration 6.23<br />
At the end of Day 10, we find that the ACC is above zero and green. Moreover, since the MO is above zero<br />
and green, and the value of the MO signal line is lower than the value of the histogram bars, a change in<br />
overall direction is not yet indicated. We’ll continue to observe stop loss rule # 5 and follow the Fence, using its<br />
value of 27.28 as our trailing stop loss (red “x”). We will follow the Fence until the ACC either shows us another<br />
three consecutive red bars or crosses the zero line into negative territory.<br />
Illustration 6.23. Long trade with MOXO entry, Day 10 (PLL – Pall CP, 8/31/05-11/16/05).<br />
71
Day 11, 11/17/05 Illustration 6.24<br />
At the end of Day 11, we find that the ACC is above zero and green. Moreover, since the MO is above zero<br />
and green, and the value of the MO signal line is lower than the value of the histogram bars, a change in<br />
overall direction is not yet indicated. We’ll continue to observe stop loss rule # 5 and follow the Fence, using its<br />
value of 27.47 as our trailing stop loss (red “x”). We will follow the Fence until the ACC either shows us another<br />
three consecutive red bars or crosses the zero line into negative territory.<br />
Illustration 6.24. Long trade with MOXO entry, Day 11 (PLL – Pall CP, 8/31/05-11/17/05).<br />
72
Day 12, 11/18/05 Illustration 6.25<br />
At the end of Day 12, we find that the ACC is above zero but has again turned red. However, since the MO is<br />
above zero and green, and the value of the MO signal line is lower than the value of the histogram bars, a<br />
change in overall direction is not yet indicated. We’ll continue to observe stop loss rule # 5 and follow the<br />
Fence, using its value of 27.62 as our trailing stop loss (red “x”). We will follow the Fence until the ACC either<br />
shows us another three consecutive red bars or crosses the zero line into negative territory.<br />
Illustration 6.25. Long trade with MOXO entry, Day 12 (PLL – Pall CP, 8/31/05-11/18/05).<br />
73
Day 13, 11/21/05 Illustration 6.26<br />
At the end of Day 13, we find that the ACC is above zero but is now showing two consecutive red bars, again<br />
warning us of a slow down in price movement. In addition, although the MO is above zero and the value of the<br />
MO signal line is lower than the value of the histogram bars, the current MO bar is red. This is a warning that a<br />
change in overall direction may occur. We’ll continue to observe stop loss rule # 5 and follow the Fence, using<br />
its value of 27.76 as our trailing stop loss (red “x”). We will follow the Fence until the ACC either shows us<br />
another three consecutive red bars or crosses the zero line into negative territory.<br />
Illustration 6.26. Long trade with MOXO entry, Day 13 (PLL – Pall CP, 8/31/05-11/21/05).<br />
74
Day 14, 11/22/05 Illustration 6.27<br />
At the end of Day 14, we find that the ACC has crossed the zero line, a strong warning that price movement is<br />
slowing down. In addition, although the MO is above zero, the value of the MO signal line is just barely lower<br />
than the value of the histogram bars. <strong>The</strong> fact that MO is showing two consecutive red bars adds to the<br />
probability of a change in direction. Since the ACC has moved below zero, we’ll now observe stop loss rule #6,<br />
and move to the 3SMA Safety Line, using its value of 28.10 as our trailing stop loss (red “x”). We will follow the<br />
Safety Line until we are stopped out.<br />
Illustration 6.27. Long trade with MOXO entry, Day 14 (PLL – Pall CP, 8/31/05-11/22/05).<br />
75
Day 15, 11/23/05 Illustration 6.28<br />
On Day 15 we are stopped out at 28.10. Our entry point was 26.45, so we experienced a gain of $1.65 per<br />
share.<br />
Illustration 6.28. Long trade with MOXO entry, Day 15 (PLL – Pall CP, 8/31/05-11/23/05).<br />
76
You have followed two successful long stock trades, one with a Fractal entry and one with a MOXO<br />
entry. Remember that futures are traded with the same set of rules as stocks. We’ll now turn our<br />
attention to short trades with Fractal and MOXO entries.<br />
A Short Stock Trade with Fractal Entry from Entry to Exit<br />
Fractal Entry<br />
We’ll begin this part of our instruction with the set up for a short trade using a Fractal entry. Let’s assume that<br />
the date is 10/4/05 and we’re looking at a chart of Ormat Technologies (Illustration 6.29). Recall from Module<br />
5 that for a Fractal entry, we:<br />
• Find the most recent valid sell fractal (marked with a red "S"). In this case, it's the 9/30/05 bar.<br />
• Subtract two ticks from the low of the sell fractal bar to get the entry point. In this case, the low 21.97 - .02<br />
= 21.95.<br />
Illustration 6.29. Possible short trade with Fractal entry. (ORA, 7/26/2005 – 10/4/2005)<br />
77
Initial Stop Loss<br />
Recall from Module 5 that for the first-day stop loss for a short position, we will consider the higher of either<br />
1. the highest high of the last three price bars (including the signal bar)<br />
2. or the highest stability line above the high of the signal bar<br />
In Illustration 6.29 above, the highest high of the last three price bars (including the signal bar) for this Fractal<br />
entry is 23.46. <strong>The</strong> highest Stability line above the high of the signal bar is the Wall, at 22.94. Since the value<br />
of the Wall is not above the value of the highest high of the last three price bars, we’ll set our first-day stop loss<br />
point at 23.46 (red “x”), the highest of the three most recent bars. You may, of course, employ a different<br />
method of determining a stop loss that is in keeping with your risk tolerance and money management<br />
practices.<br />
Now that we have determined our entry point and initial stop loss point, and have either given the information<br />
to our broker or entered it into our electronic trading platform, we are ready to trade. Our overall plan is to enter<br />
the market when the price equals or falls below 21.95, and in accordance with the initial stop loss rule, we have<br />
set our initial stop loss at 23.46. To demonstrate the functionality of the stop loss algorithms, we’ll trade<br />
aggressively. Let’s see what occurs on the next day, 10/5/05.<br />
78
Day 1, 10/5/05 Illustration 6.30<br />
<strong>The</strong> 10/5/05 bar has fallen below our entry price, and we are in the market at 21.95.<br />
Illustration 6.30. Short Trade with Fractal Entry, Day 1 (ORA, 7/26/200510/5/20057/26/200510/5/2005)<br />
Now that we’ve entered the trade, we need to determine our daily stop loss values. So before we continue with<br />
the trade, we will go through the rules for setting trailing stop loss points and exiting with a profit.<br />
D. How do I determine my daily stop loss value?<br />
79
Rules for setting stop loss points for short positions<br />
TFE’s stop loss rules integrate the Accelerometer and the Gatekeeper.<br />
1. Set initial stop at the higher of either<br />
a. the highest high of last three price bars (including the signal bar), or<br />
b. or the value of the highest stability line above the high of the signal bar.<br />
2. If the high of the entry-day bar is higher than the farthest Stability Line, stay with initial stop until the<br />
high is below the farthest Stability Line, then go to Rule #3. If the high of the entry-day bar is lower than<br />
the farthest Stability Line, go directly to Rule #3.<br />
3. Depending on your trading style, risk tolerance, and money management practices,<br />
a. For an aggressive approach, if the Wall (blue line) is the farthest Stability Line, follow the Wall;<br />
otherwise, follow the farthest Stability Line until it crosses the Wall, then follow the Wall.<br />
b. For a less aggressive approach, if the Tripwire (red line) is the farthest Stability Line, follow the<br />
Tripwire; otherwise follow the farthest Stability Line until it crosses the Tripwire, then follow the<br />
Tripwire.<br />
c. For a conservative approach, if the Fence (green line) is the farthest Stability Line, follow the Fence;<br />
otherwise, follow the farthest Stability Line until it crosses the Fence, then follow the Fence.<br />
4. If the ACC is less than zero, follow rule #3 above.<br />
5. If the current ACC histogram bar is below zero and three consecutive green ACC bars (including the<br />
current bar) have occurred, move down one Stability Line for each set of three green ACC bars. For<br />
example, if you are currently following the Wall and there are three consecutive green ACC bars<br />
(including the current bar) then move down to the Tripwire. When the next set of three greens occurs,<br />
move down to the Fence, and so on until stopped out.<br />
6. If the current ACC histogram bar crosses the zero line from negative to positive, move immediately to<br />
the 3SMA Safety Line and follow it.<br />
7. Other than on entry day, if the 3SMA Safety Line crosses the Fence so that the value of the Fence is<br />
less than the value of the 3SMA Safety Line, move to and follow the 3SMA Safety Line as your stop<br />
loss until stopped out.<br />
As we proceed through our trade, you’ll have a chance to see how easy it is to apply the stop loss rules. So<br />
let’s continue with Day 1, as viewed in Illustration 6.31 below.<br />
80
Day 1, 10/5/05 Illustration 6.31<br />
Our entry price has been hit and we are in the market. <strong>The</strong> ACC is showing three consecutive green bars, so<br />
since we are trading aggressively, we’ll use the Wall as our reference point. With three consecutive ACC bars,<br />
we observe rule #5, which moves us one Stability Line down. In this case, the Tripwire, at 22.38, becomes our<br />
trailing stop loss, so we will set that as our stop loss point (red “x”). We’ll follow the Tripwire until the ACC<br />
either shows three more consecutive green bars or crosses the zero line from negative to positive.<br />
Illustration 6.31. Short trade with Fractal entry, Day 1 (ORA, 7/26/2005 – 10/5/2005)<br />
81
Day 2, 10/6/05 Illustration 6.32<br />
At the end of Day 2, we find that the ACC is below zero and is showing a red bar. We’ll continue to observe<br />
stop loss rule # 5, and follow the Tripwire. Thus, we will use the Tripwire’s value of 22.21 as our trailing stop<br />
loss (red “x”). We will follow the Tripwire until the ACC either shows us another three consecutive green bars or<br />
crosses the zero line into positive territory. In addition, since the MO is below zero and red, and the value of<br />
the MO signal line is greater than the value of the histogram bars, a change in overall direction is not yet<br />
indicated.<br />
Illustration 6.32. Short trade with Fractal entry, Day 2 (ORA, 7/26/2005 – 10/6/2005)<br />
82
Day 3, 10/7/05 Illustration 6.33<br />
At the end of Day 3, we find that the ACC is below zero and red. In addition, since the MO is below zero and<br />
red, and the value of the MO signal line is greater than the value of the histogram bars, a change in overall<br />
direction is not yet indicated. We’ll continue to observe stop loss rule # 5, and follow the Tripwire. Thus, we will<br />
use the Tripwire’s value of 21.99 as our trailing stop loss (red “x”). We will follow the Tripwire until the ACC<br />
either shows us another three consecutive green bars or crosses the zero line into positive territory.<br />
Illustration 6.33. Short trade with Fractal entry, Day 3 (ORA, 7/26/2005 – 10/7/2005)<br />
83
Day 4, 10/10/05 Illustration 6.34<br />
At the end of Day 4, we find that the ACC is below zero with one green bar showing. However, since the MO is<br />
below zero and red, and the value of the MO signal line is greater than the value of the histogram bars, a<br />
change in overall direction is not yet indicated. We’ll continue to observe stop loss rule # 5, and follow the<br />
Tripwire. Thus, we will use the Tripwire’s value of 21.73 as our trailing stop loss (red “x”). We will follow the<br />
Tripwire until the ACC either shows us another three consecutive green bars or crosses the zero line into<br />
positive territory.<br />
Illustration 6.34. Short trade with Fractal entry, Day 4 (ORA, 7/26/2005 – 10/10/2005)<br />
84
Day 5, 10/11/05 Illustration 6.35<br />
At the end of Day 5, we find that the ACC is below zero with two consecutive green bars showing. This is an<br />
early warning of a slow-down in the speed at which price is changing. However, since the MO is below zero<br />
and red, and the value of the MO signal line is greater than the value of the histogram bars, a change in overall<br />
direction is not yet indicated. We’ll continue to observe stop loss rule # 5, and follow the Tripwire. Thus, we will<br />
use the Tripwire’s value of 21.44 as our trailing stop loss (red “x”). We will follow the Tripwire until the ACC<br />
either shows us another three consecutive green bars or crosses the zero line into positive territory.<br />
Illustration 6.35. Short trade with Fractal entry, Day 5 (ORA, 7/26/2005 – 10/11/2005)<br />
85
Day 6, 10/12/05 Illustration 6.36<br />
At the end of Day 6, we find that the ACC is below zero with three consecutive green bars showing. This is a<br />
strong early warning of a slow-down in the speed at which price is changing. However, since the MO is below<br />
zero and red, and the value of the MO signal line is greater than the value of the histogram bars, a change in<br />
overall direction is not yet indicated.<br />
We’ll continue to observe stop loss rule # 5, which requires us to move down one Stability Line with the<br />
appearance of three consecutive green ACC bars. <strong>The</strong>refore, we will move from the Tripwire to the Fence, and<br />
we will use the Fence’s value of 20.30 as our trailing stop loss (red “x”). We will follow the Fence until the ACC<br />
either shows us another three consecutive green bars or crosses the zero line into positive territory.<br />
Illustration 6.36. Short trade with Fractal entry, Day 6 (ORA, 7/26/2005 – 10/12/2005)<br />
86
Day 7, 10/13/05 Illustration 6.37<br />
At the end of Day 7, we find that the ACC is below zero and red, but the value of the current bar is very close<br />
to zero. This does little to change the strong early warning of a slow-down in the speed at which price is<br />
changing. However, since the MO is below zero and red, and the value of the MO signal line is greater than the<br />
value of the histogram bars, a change in overall direction is not yet indicated. We’ll continue to observe stop<br />
loss rule # 5, using the Fence’s value of 19.94 as our trailing stop loss (red “x”). We will follow the Fence until<br />
the ACC either shows us another three consecutive green bars or crosses the zero line into positive territory.<br />
Illustration 6.37. Short trade with Fractal entry, Day 7 (ORA, 7/26/2005 – 10/13/2005)<br />
87
Day 8, 10/14/05 Illustration 6.38<br />
Our stop loss was hit at 19.94, and we are out of this trade. Our entry point was 21.95, so we experienced a<br />
gain of $2.01 per share.<br />
Illustration 6.38. Short trade with Fractal entry, Day 8 (ORA, 7/26/2005 – 10/14/2005)<br />
88
A Short Stock Trade with Momentum Crossover (MOXO) Entry from Entry to Exit<br />
We will now examine another short trade, but this time using the Momentum Crossover (MOXO) sell signal.<br />
Let’s assume that the date is 9/21/05 and we’re looking at a chart International Paper—IP (Illustration 6.39).<br />
Recall from Module 5 that for a MOXO sell signal to be valid:<br />
1. <strong>The</strong> first MO histogram bar must be immediately above the zero line and the very next bar, the signal bar,<br />
must cross the zero line from positive to negative.<br />
2. <strong>The</strong> value of the 3SMA Safety Line must be less than the value of the Fence.<br />
3. If conditions 1 and 2 are met, set entry price at two ticks below the low of signal the bar.<br />
Setup Day, 9/21/05 Illustration 6.39<br />
In Illustration 6.39 below, we can see that the Momentum Oscillator has crossed the zero line in the negative<br />
direction, and that the value of 3SMA Safety Line, at 30.65, is lower than the value of the Fence, at 31.02.<br />
Thus, this is a valid MOXO signal. <strong>The</strong> low of the signal bar is 30.37. We will set our entry point at 2 ticks below<br />
that price, or 30.35.<br />
Also, the highest high of the last three price bars (including the signal bar) for this MOXO entry is 31.27. <strong>The</strong><br />
highest Stability line above the high of the signal bar is the Tripwire, at 31.15. Since the value of the Tripwire is<br />
not above the value of the highest high of the last three price bars, we’ll set our first-day stop loss point at<br />
31.27 (red “x”), the highest high of the three most recent bars. You may, of course, employ a different method<br />
of determining a stop loss that is in keeping with your risk tolerance and money management practices.<br />
89
Illustration 6.39. Possible short trade with MOXO entry. (IP, 7/27/05-9/21/05).<br />
Now that we have determined our entry point and initial stop loss point, and have either given the information<br />
to our broker or entered it into our electronic trading platform, we are ready to trade. Our overall plan is to enter<br />
the market when the price equals or falls below 30.35, and in accordance with the initial stop loss rule, we have<br />
set our initial stop loss at 31.27. To demonstrate the functionality of the stop loss algorithms, we’ll trade<br />
aggressively. Let’s see what occurs on the next day, 9/22/05.<br />
90
Day 1, 9/22/05 Illustration 6.40<br />
<strong>The</strong> 9/22/05 bar has opened at 30.24, below our entry price of 30.35, so we are in the market at 30.24. Since<br />
the high of the current bar is below the Stability Lines, we are now following stop loss rule #3. We are trading<br />
aggressively, so we’ll use the highest Stability Line until the Wall becomes the highest. In this case, the<br />
Tripwire, at 31.07, has the highest value, so we will set that as our stop loss point (red “x”). We also note that<br />
the ACC is showing a green bar. However, since the MO is below zero and red, and the value of the MO signal<br />
line is greater than the value of the histogram bars, a change in overall direction is not yet indicated.<br />
Illustration 6.40. Short trade with MOXO entry, Day 1. (IP, 7/27/05-9/22/05).<br />
91
Day 2, 9/23/05 Illustration 6.41<br />
At the end of Day 2, we find that the ACC is below zero and is red. In addition, since the MO is below zero and<br />
red, and the value of the MO signal line is greater than the value of the histogram bars, a change in overall<br />
direction is not yet indicated. Thus, we’ll continue to observe stop loss rule # 3. Up to now, Tripwire has been<br />
the highest Stability Line. Today, however, the Wall’s value, at 30.95 is the highest, so we will use that value as<br />
our trailing stop loss (red “x”).<br />
Illustration 6.41. Short trade with MOXO entry, Day 2. (IP, 7/27/05-9/23/05).<br />
92
Day 3, 9/26/05 Illustration 6.42<br />
At the end of Day 3, we find that the ACC is below zero and is showing a green bar, a warning that the speed<br />
of downward price movement is slowing. However, since the MO is below zero and red, and the value of the<br />
MO signal line is greater than the value of the histogram bars, a change in overall direction is not yet indicated.<br />
We’ll continue to observe stop loss rule # 3, and follow the Wall. Thus, we will use the Wall’s value of 30.90 as<br />
our trailing stop loss (red “x”).<br />
Illustration 6.42. Short trade with MOXO entry, Day 3. (IP, 7/27/05-9/26/05).<br />
93
Day 4, 9/27/05 Illustration 6.43<br />
At the end of Day 4, we find that the ACC is below zero and is showing a second consecutive green bar, a<br />
warning that the speed of downward price movement is continuing to slow. However, since the MO remains<br />
below zero and red, and the value of the MO signal line is greater than the value of the histogram bars, a<br />
change in overall direction is not yet indicated. We’ll continue to observe stop loss rule # 3, and follow the Wall.<br />
Thus, we will use the Wall’s value of 30.87 as our trailing stop loss (red “x”).<br />
Illustration 6.43. Short trade with MOXO entry, Day 4. (IP, 7/27/05-9/27/05).<br />
94
Day 5, 9/28/05 Illustration 6.44<br />
At the end of Day 5, we find that the ACC is below zero and is showing a third consecutive green bar, a<br />
warning that the speed of downward price movement is continuing to slow. However, since the MO remains<br />
below zero and red, and the value of the MO signal line is greater than the value of the histogram bars, a<br />
change in overall direction is not yet indicated.<br />
Since we are trading aggressively, we have been using the Wall as our stop loss point. With three consecutive<br />
ACC bars, we now observe rule #5, which moves us one Stability Line down. In this case, the Tripwire, at<br />
30.42, becomes our trailing stop loss, so we will set that as our stop loss point (red “x”). We’ll follow the<br />
Tripwire until the ACC either shows three more consecutive green bars or crosses the zero line from negative<br />
to positive.<br />
Illustration 6.44. Short trade with MOXO entry, Day 5. (IP, 7/27/05-9/28/05).<br />
95
Day 6, 9/29/05 Illustration 6.45<br />
At the end of Day 6, we find that the ACC is below zero and red. Moreover, since the MO remains below zero<br />
and red, and the value of the MO signal line is greater than the value of the histogram bars, a change in overall<br />
direction is not yet indicated. We continue to observe rule #5, using the Tripwire, at 30.25, as our trailing stop<br />
loss (red “x”). We’ll follow the Tripwire until the ACC either shows three more consecutive green bars or<br />
crosses the zero line from negative to positive.<br />
Illustration 6.45. Short trade with MOXO entry, Day 6. (IP, 7/27/05-9/29/05).<br />
96
Day 7, 9/30/05 Illustration 6.46<br />
At the end of Day 7, we find that the ACC is below zero and presenting a green bar. However, since the MO<br />
remains below zero and red, and the value of the MO signal line is greater than the value of the histogram<br />
bars, a change in overall direction is not yet indicated. We continue to observe rule #5, using the Tripwire, at<br />
30.08, as our trailing stop loss (red “x”). We’ll follow the Tripwire until the ACC either shows three more<br />
consecutive green bars or crosses the zero line from negative to positive.<br />
Illustration 6.46. Short trade with MOXO entry, Day 7. (IP, 7/27/05-9/30/05).<br />
97<br />
x<br />
x<br />
x x x<br />
x x x<br />
Stop loss at 30.08
Day 8, 10/3/05 Illustration 6.47<br />
At the end of Day 8, we find that the ACC is below zero and presenting two consecutive green bars. This is an<br />
indication that the speed of price change is slowing down, and an early warning of a potential change in shortterm<br />
direction. However, since the MO remains below zero and red, and the value of the MO signal line is<br />
greater than the value of the histogram bars, a change in overall direction is not yet indicated. We continue to<br />
observe rule #5, using the Tripwire, at 29.95, as our trailing stop loss (red “x”). We’ll follow the Tripwire until the<br />
ACC either shows three consecutive green bars or crosses the zero line from negative to positive.<br />
Illustration 6.47. Short trade with MOXO entry, Day 8. (IP, 7/27/05-10/3/05).<br />
98<br />
x<br />
x<br />
x x x<br />
x x x x<br />
Stop loss at 29.95
Day 9, 10/4/05 Illustration 6.48<br />
At the end of Day 9, we find that the ACC is below zero and red. In addition, since the MO remains below zero<br />
and red, and the value of the MO signal line is greater than the value of the histogram bars, no change in<br />
overall direction is indicated. We continue to observe rule #5, using the Tripwire, at 29.72, as our trailing stop<br />
loss (red “x”). We’ll follow the Tripwire until the ACC either shows three more consecutive green bars or<br />
crosses the zero line from negative to positive.<br />
Illustration 6.48. Short trade with MOXO entry, Day 9. (IP, 7/27/05-10/4/05).<br />
99<br />
x<br />
x<br />
x x x<br />
x<br />
x<br />
x<br />
x<br />
x<br />
Stop loss at 29.72
Day 10, 10/5/05 Illustration 6.49<br />
At the end of Day 10, we find that the ACC is below zero and red. In addition, since the MO remains below<br />
zero and red, and the value of the MO signal line is greater than the value of the histogram bars, no change in<br />
overall direction is indicated. We continue to observe rule #5, using the Tripwire, at 29.52, as our trailing stop<br />
loss (red “x”). We’ll follow the Tripwire until the ACC either shows three more consecutive green bars or<br />
crosses the zero line from negative to positive.<br />
Illustration 6.49. Short trade with MOXO entry, Day 10. (IP, 7/27/05-10/5/05).<br />
100<br />
x<br />
x<br />
x x x<br />
x x x x x<br />
x<br />
Stop loss at 29.52
Day 11, 10/6/05 Illustration 6.50<br />
At the end of Day 11, we find that the ACC is below zero and red. In addition, since the MO remains below<br />
zero and red, and the value of the MO signal line is greater than the value of the histogram bars, no change in<br />
overall direction is indicated. We continue to observe rule #5, using the Tripwire, at 29.29, as our trailing stop<br />
loss (red “x”). We’ll follow the Tripwire until the ACC either shows three more consecutive green bars or<br />
crosses the zero line from negative to positive.<br />
Illustration 6.50. Short trade with MOXO entry, Day 11. (IP, 7/27/05-10/6/05).<br />
101<br />
x<br />
x<br />
x x x<br />
x<br />
x<br />
x<br />
x<br />
x<br />
x<br />
x<br />
Stop loss at 29.29
Day 12, 10/7/05 Illustration 6.51<br />
At the end of Day 12, we find that the ACC is below zero and presenting a green bar. However, since the MO<br />
remains below zero and red, and the value of the MO signal line is greater than the value of the histogram<br />
bars, no change in overall direction is indicated. We continue to observe rule #5, using the Tripwire, at 29.10,<br />
as our trailing stop loss (red “x”). We’ll follow the Tripwire until the ACC either shows three more consecutive<br />
green bars or crosses the zero line from negative to positive.<br />
Illustration 6.51. Short trade with MOXO entry, Day 12. (IP, 7/27/05-10/7/05).<br />
102<br />
x<br />
x<br />
x x x<br />
x<br />
x<br />
x<br />
x<br />
x<br />
x<br />
x<br />
x<br />
Stop loss at 29.10
Day 13, 10/10/05 Illustration 6.52<br />
At the end of Day 13, we find that the ACC is below zero, but is showing two consecutive green bars. This is<br />
an indication that the downward speed of price movement is slowing. In addition, although the MO remains<br />
below zero, and the value of the MO signal line is greater than the value of the histogram bars, the MO is<br />
showing a green bar. This is a strong indication that change in overall direction may occur in the near future.<br />
We continue to observe rule #5, using the Tripwire, at 28.88, as our trailing stop loss (red “x”). We’ll follow the<br />
Tripwire until the ACC either shows three consecutive green bars or crosses the zero line from negative to<br />
positive.<br />
Illustration 6.52. Short trade with MOXO entry, Day 13. (IP, 7/27/05-10/10/05).<br />
103<br />
x<br />
x<br />
x x x<br />
x<br />
x<br />
x<br />
x<br />
x<br />
x<br />
x<br />
x<br />
x<br />
Stop loss at 28.88
Day 14, 10/11/05 Illustration 6.53<br />
At the end of Day 14, we find that the ACC has crossed the zero line. This is an indication that the downward<br />
speed of price movement is slowing. Also, although the value of the MO signal line is greater than the value of<br />
the histogram bars, the MO is showing two consecutive green bars. This is a very strong indication that price<br />
direction may be changing. We go to stop loss rule #6, which requires us to immediately move to the Safety<br />
Line. We will use the current value of the Safety Line, 27.93, as our trailing stop loss (red “x”). We will follow<br />
the Safety Line until we are stopped out.<br />
Illustration 6.53. Short trade with MOXO entry, Day 14. (IP, 7/27/05-10/11/05).<br />
104<br />
x<br />
x<br />
x x x<br />
x<br />
x<br />
x<br />
x<br />
x<br />
x<br />
x<br />
x<br />
x<br />
x<br />
Stop loss at 27.93
Day 15, 10/12/05 Illustration 6.54<br />
At the end of Day 15, we find that the ACC is above the zero line and red, but very close to zero. This is an<br />
indication that the downward speed of price movement has slowed. Also, the value of the MO signal line is now<br />
only slightly greater than the value of the histogram bars, even though the MO is below zero and showing a red<br />
bar. This is a very strong indication that price direction may be changing. We will continue to follow stop loss<br />
rule #6, and will use the current value of the Safety Line, 27.63, as our trailing stop loss (red “x”). We’ll follow<br />
the Safety Line until we are stopped out.<br />
Illustration 6.54. Short trade with MOXO entry, Day 15. (IP, 7/27/05-10/12/05).<br />
105<br />
x<br />
x<br />
x x x<br />
x<br />
x<br />
x<br />
x<br />
x<br />
x<br />
x<br />
x<br />
x<br />
x<br />
x<br />
Stop loss<br />
at 27.63
Day 16, 10/13/05 Illustration 6.55<br />
At the end of Day 16, we find that the ACC is below the zero line and red. Also, the value of the MO signal line<br />
is now only slightly greater than the value of the histogram bars, even though the MO is below zero and<br />
showing a red bar. This is an indication that price direction may be changing. We will continue to follow stop<br />
loss rule #6, and will use the current value of the Safety Line, 27.31, as our trailing stop loss (red “x”). We’ll<br />
follow the Safety Line until we are stopped out.<br />
Illustration 6.55. Short trade with MOXO entry, Day 16. (IP, 7/27/05-10/13/05).<br />
106<br />
x<br />
x<br />
x x x<br />
x<br />
x<br />
x<br />
x<br />
x<br />
x<br />
x<br />
x<br />
x<br />
x<br />
x<br />
x<br />
Stop loss<br />
at 27.31
Day 17, 10/14/05 Illustration 6.56<br />
At the end of Day 17, we find that the ACC is below the zero line and green. Also, the value of the MO signal<br />
line continues to be only slightly greater than the value of the histogram bars, even though the MO is below<br />
zero and showing a red bar. This is an indication that price direction may be changing. We will continue to<br />
follow stop loss rule #6, and will use the current value of the Safety Line, 27.03, as our trailing stop loss (red<br />
“x”). We’ll follow the Safety Line until we are stopped out.<br />
Illustration 6.56. Short trade with MOXO entry, Day 17. (IP, 7/27/05-10/14/05).<br />
107<br />
x<br />
x<br />
x x x<br />
x<br />
x<br />
x<br />
x<br />
x<br />
x<br />
x<br />
x<br />
x<br />
x<br />
x<br />
x<br />
x<br />
Stop loss<br />
at 27.03
Day 18, 10/17/05 Illustration 6.57<br />
At the end of Day 18, we find that the ACC is above the zero line and green. Also, the value of the MO signal<br />
line continues to be only slightly greater than the value of the histogram bars. Moreover, even though the MO<br />
is below zero, it is showing a green bar. This is an indication that price direction may soon be changing. We will<br />
continue to follow stop loss rule #6, and will use the current value of the Safety Line, 26.95, as our trailing stop<br />
loss (red “x”). We’ll follow the Safety Line until we are stopped out.<br />
Illustration 6.57. Short trade with MOXO entry, Day 18. (IP, 7/27/05-10/17/05).<br />
108<br />
x<br />
x<br />
x x x<br />
x<br />
x<br />
x<br />
x<br />
x<br />
x<br />
x<br />
x<br />
x<br />
x<br />
x<br />
x<br />
x<br />
x<br />
Stop loss at 26.95
Day 19, 10/18/05 Illustration 6.58<br />
<strong>The</strong> market opened at 27.43. Since that price is above our stop loss price of 26.95, we’ve been stopped out.<br />
We entered the market at 30.35, our gain is $2.92 per share.<br />
Illustration 6.58. Short trade with MOXO entry, Day 19. (IP, 7/27/05-10/18/05).<br />
<strong>The</strong> preceding examples have taken you step-by step through four stock trades (remember that futures trades<br />
use the same rules and methodology.) You have learned how to identify long and short fractal and MOXO<br />
entry signals and stop loss points. You have seen how TFE guides you into, through, and out of profitable<br />
trades.<br />
Let’s now examine two futures trades, one long fractal entry and one short MOXO entry.<br />
109<br />
x<br />
x<br />
x x x<br />
x<br />
x<br />
x<br />
x<br />
x<br />
x<br />
x<br />
x<br />
x<br />
x<br />
x<br />
Stopped out<br />
at 27.43<br />
x<br />
x<br />
x
Long Gold Futures Fractal Entry Trade<br />
Setup Day, 9/7/05 Illustration 6.59<br />
On 9/7/05, we can see that a buy fractal has formed and TFE has generated a buy signal based on the 9/2/05<br />
fractal bar. <strong>The</strong> high of the fractal bar is 453.70. Gold has a tick value of 0.10. That is, for every tick, price<br />
moves 0.10 on the price chart. So, we will set our entry point at 2 ticks (0.20) above that price, or 453.90.<br />
Also, the lowest low of the last three price bars (including the signal bar) for this Fractal entry is 439.1. <strong>The</strong><br />
lowest Stability line below the low of the signal bar is the Fence, at 445.20. Since the value of the Fence is not<br />
below the value of the lowest low of the last three price bars, we’ll set our first-day stop loss point at 439.10<br />
(red “x”), the lowest of the three most recent bars. You may, of course, employ a different method of<br />
determining a stop loss that is in keeping with your risk tolerance and money management practices.<br />
Illustration 6.59. Possible long trade with Fractal entry. (GCG6 – Feb ’06 Gold, 6/28/05-9/7/05).<br />
Now that we have determined our entry point and initial stop loss point, and have either given the information<br />
to our broker or entered it into our electronic trading platform, we are ready to trade. Our overall plan is to enter<br />
the market when the price equals or exceeds 453.90, and in accordance with the initial stop loss rule, we have<br />
set our initial stop loss at 439.10. To demonstrate the functionality of the stop loss algorithms, we’ll trade<br />
aggressively. Let’s see what occurs on the next day,9/8/05.<br />
110
Day 1, 9/8/05 Illustration 6.60<br />
<strong>The</strong> 9/8/05 bar has exceeded our entry price, and we are in the market at 453.90. Since the low of the current<br />
bar is above the Stability Lines, we are now following stop loss rule #3. We are trading aggressively, so we’ll<br />
use the lowest Stability Line. In this case, the Wall, at 447.30, has the lowest value, so we will set that as our<br />
stop loss point (red “x”). We also note that the ACC is showing two consecutive red bars. This is an early<br />
warning that the speed at which price is moving is slowing down. However, since the MO is above zero and<br />
green, and the MO Signal Line is less than the value of the MO histogram bars, an overall change in direction<br />
is not indicated.<br />
Illustration 6.60. Long futures trade with Fractal entry. (GCG6 – Feb ’06 Gold, 6/28/05-9/8/05).<br />
111
Day 2, 9/9/05 Illustration 6.61<br />
At the end of Day 2, we find that the ACC is now above zero and green. Moreover, the MO is above zero,<br />
green, and the value of the MO signal line is lower than the value of the histogram bars. Thus, a change in<br />
overall direction is not indicated. We are still observing stop loss rule #3 and are trailing the Wall, whose<br />
current value is 447.80. <strong>The</strong>refore, we will use 447.80 as our trailing stop loss (red “x”).<br />
Illustration 6.61. Long futures trade with Fractal entry. (GCG6 – Feb ’06 Gold, 6/28/05-9/9/05).<br />
112
Day 3, 9/12/05 Illustration 6.62<br />
At the end of Day 3, we find that the ACC is above zero and still green. Moreover, the MO remains above zero,<br />
green, and the value of the MO signal line is lower than the value of the histogram bars. Thus, a change in<br />
overall direction is not indicated. We are still observing stop loss rule #3 and are trailing the Wall, whose<br />
current value is 448.30. <strong>The</strong>refore, we will use 448.30 as our trailing stop loss (red “x”).<br />
Illustration 6.62. Long futures trade with Fractal entry. (GCG6 – Feb ’06 Gold, 6/28/05-9/12/05).<br />
113
Day 4, 9/13/05 Illustration 6.63<br />
At the end of Day 4, we find that the ACC is above zero and is showing a red bar, indicating that the speed of<br />
upward price movement is slowing. In addition, while the MO remains above zero, it is also showing a red bar,<br />
indicating a weakening of the momentum. However, the value of the MO signal line is lower than the value of<br />
the histogram bars. Thus, a change in overall direction is not yet indicated. We are still observing stop loss rule<br />
#3 and are trailing the Wall, whose current value is 448.80. <strong>The</strong>refore, we will use 448.80 as our trailing stop<br />
loss (red “x”).<br />
Illustration 6.63. Long futures trade with Fractal entry. (GCG6 – Feb ’06 Gold, 6/28/05-9/13/05).<br />
114
Day 5, 9/14/05 Illustration 6.64<br />
At the end of Day 4, we find that the ACC is now showing two consecutive red bars. It has also crossed the<br />
zero line from positive to negative, indicating that the speed of upward price movement is continuing to slow<br />
down. In addition, while the MO remains above zero, it is also showing a second consecutive red bar,<br />
indicating further weakening of the momentum. However, the value of the MO signal line is still lower than the<br />
value of the histogram bars. Thus, a change in overall direction is not yet indicated. However, the ACC has<br />
crossed the zero line, requiring us to observe stop loss rule #5, and move our stop loss point to the Safety<br />
Line. <strong>The</strong> Safety Line’s current value is 455.70. <strong>The</strong>refore, we will use 455.70 as our trailing stop loss (red “x”),<br />
and will follow the Safety Line until we are stopped out.<br />
Illustration 6.64. Long futures trade with Fractal entry. (GCG6 – Feb ’06 Gold, 6/28/05-9/14/05).<br />
115
Day 6, 9/15/05 Illustration 6.65<br />
At the end of Day 6, we find that the ACC is has crossed the zero line from negative to positive, and is now<br />
showing a green bar. In addition, the MO remains above zero and is also showing a green bar. Moreover, the<br />
value of the MO signal line is still lower than the value of the histogram bars. Thus, a change in overall<br />
direction from up to down is not yet indicated. We continue to observe stop loss rule #5, and are using the<br />
Safety Line, at 457.60, as our trailing stop loss (red “x”). We will follow the Safety Line until we are stopped out.<br />
Illustration 6.65. Long futures trade with Fractal entry. (GCG6 – Feb ’06 Gold, 6/28/05-9/15/05).<br />
116
Day 7, 9/16/05 Illustration 6.66<br />
At the end of Day 7, we find that the ACC is positive and green. In addition, the MO is above zero and green.<br />
Moreover, the value of the MO signal line is still lower than the value of the histogram bars. Given the<br />
foregoing information, it appears that the upward momentum is strengthening. We continue to observe stop<br />
loss rule #5, and are using the Safety Line, at 462.00, as our trailing stop loss (red “x”). We will follow the<br />
Safety Line until we are stopped out.<br />
Illustration 6.66. Long futures trade with Fractal entry. (GCG6 – Feb ’06 Gold, 6/28/05-9/16/05).<br />
117
Day 8, 9/19/05 Illustration 6.67<br />
At the end of Day 8, we find that the ACC is positive and green. In addition, the MO is above zero and green.<br />
Moreover, the value of the MO signal line is still lower than the value of the histogram bars. Given the<br />
foregoing information, it appears that the upward momentum remains strong. We continue to observe stop loss<br />
rule #5, and are using the Safety Line, at 467.60, as our trailing stop loss (red “x”). We will follow the Safety<br />
Line until we are stopped out.<br />
Illustration 6.67. Long futures trade with Fractal entry. (GCG6 – Feb ’06 Gold, 6/28/05-9/19/05).<br />
118
Day 9, 9/20/05 Illustration 6.68a<br />
At the end of Day 9, we find that the ACC is positive, but showing a red bar. This is an early warning of a<br />
possible slow down in the speed at which price is moving. However, the MO is above zero and green, and the<br />
value of the MO signal line is still lower than the value of the histogram bars. Given the foregoing information,<br />
no change in the overall upward direction is indicated. We continue to observe stop loss rule #5, and are using<br />
the Safety Line, at 471.20, as our trailing stop loss (red “x”). We will follow the Safety Line until we are stopped<br />
out.<br />
Illustration 6.68a. Long futures trade with Fractal entry. (GCG6 – Feb ’06 Gold, 6/28/05-9/20/05).<br />
119
Day 10, 9/21/05 Illustration 6.68b<br />
<strong>The</strong> market opened today at 471.20 which means our stop loss was hit today and we are out at 471.20. Each<br />
.10 of gain or loss in Gold is worth $10.00. We entered the market at 453.90 and exited at 471.20 for a gain of<br />
173 points which translates to about $1,730 in gains for this trade.<br />
Illustration 6.68b. Long futures trade with Fractal entry. (GCG6 – Feb ’06 Gold, 6/28/05-9/21/05).<br />
Next, let’s examine another future’s trade, this time using a short MOXO entry.<br />
120
A Short British Pound Futures Trade with Momentum Crossover (MOXO) Entry from Entry to Exit<br />
Setup Day, 9/16/05 Illustration 6.69<br />
In Illustration 6.69 below, we can see that the Momentum Oscillator has crossed the zero line, and that the<br />
value of 3SMA Safety Line, at 1.8088, is lower than the value of the Fence, at 1.8167. This satisfies the<br />
conditions for a valid MOXO entry.<br />
<strong>The</strong> low of the signal bar is 1.7991. We will set our entry point at 2 ticks below that price. Since British Pound’s<br />
tick value is .0001, our entry price would be 1.7991 minus .0002, or 1.7989.<br />
Also, the highest high of the last three price bars (including the signal bar) for this MOXO entry is 1.8274. <strong>The</strong><br />
highest Stability line above the high of the signal bar is the Tripwire, at 1.8245. Since the value of the Tripwire<br />
is not above the value of the highest high of the last three price bars, we’ll set our first-day stop loss point at<br />
1.8274 (red “x”), the highest high of the three most recent bars. You may, of course, employ a different method<br />
of determining a stop loss that is in keeping with your risk tolerance and money management practices.<br />
Illustration 6.69. Possible short trade with MOXO entry. (BPZ5, 7/15/05-9/16/05).<br />
121
Now that we have determined our entry point and initial stop loss point, and have either given the information<br />
to our broker or entered it into our electronic trading platform, we are ready to trade. Our overall plan is to enter<br />
the market when the price equals or falls below 1.7989, and in accordance with the initial stop loss rule, we<br />
have set our initial stop loss at 1.8274. To demonstrate the functionality of the stop loss algorithms, we’ll trade<br />
aggressively. Let’s see what occurs on the next day,9/19/05.<br />
Day 1, 9/19/05 Illustration 6.70<br />
<strong>The</strong> 9/19/05 bar has fallen below our entry price, and we are in the market at 1.7989. Since the high of the<br />
current bar is below the Stability Lines, we are now following stop loss rule #3. We are trading aggressively, so<br />
we’ll use the highest Stability Line until the Wall becomes the highest. In this case, the Tripwire, at 1.8207, has<br />
the highest value, so we will set that as our stop loss point (red “x”). We also note that the ACC is negative and<br />
red. Moreover, the MO is also below zero and red, and the MO Signal Line is greater than the value of the MO<br />
histogram bars. Thus, an overall change in direction is not indicated.<br />
Illustration 6.70. Possible short trade with MOXO entry. (BPZ5, 7/15/05-9/19/05).<br />
122<br />
Entered trade<br />
at 1.7989<br />
x<br />
x<br />
Stop loss at 1.8207
Day 2, 9/20/05 Illustration 6.71<br />
At the end of Day 2, we find that the ACC is below zero but showing one green bar. This is an early warning<br />
that the speed at which price is moving is slowing down. However, the MO is below zero, red, and the value of<br />
the MO signal line is greater than the value of the histogram bars. Thus, a change in overall direction is not<br />
indicated. We are still observing stop loss rule #3 and are trailing the Tripwire, whose current value is 1.8163,<br />
just above the Wall, which is at 1.8156. <strong>The</strong>refore, we will use 1.8163 as our trailing stop loss (red “x”).<br />
Illustration 6.71. Possible short trade with MOXO entry. (BPZ5, 7/15/05-9/20/05).<br />
123<br />
x<br />
x<br />
x<br />
Entered trade<br />
at 1.7989<br />
Stop loss at 1.8163
Day 3, 9/21/05 Illustration 6.72<br />
At the end of Day 3, we find that the ACC is below zero and showing two consecutive green bars. This is a<br />
strong early warning that the speed at which price is moving is slowing down. Also, although the MO is below<br />
zero, it is showing one green bar, an indication that the strength of the downward trend may be weakening.<br />
However the value of the MO signal line is greater than the value of the histogram bars. Thus, a change in<br />
overall direction is not indicated at this time. We are still observing stop loss rule #3 and are trailing the Wall,<br />
whose current value, at 1.8164, just above the Tripwire, which is at 1.8136. <strong>The</strong>refore, we will use 1.8164 as<br />
our trailing stop loss (red “x”).<br />
Illustration 6.72. Possible short trade with MOXO entry. (BPZ5, 7/15/05-9/21/05).<br />
124<br />
Entered trade<br />
at 1.7989<br />
x<br />
x<br />
x x<br />
Stop loss at 1.8164
Day 4, 9/22/05 Illustration 6.73<br />
At the end of Day 4, we find that the ACC is below zero and red. <strong>The</strong> MO is also below zero and red, and the<br />
value of the MO signal line is greater than the value of the histogram bars. Thus, a change in overall direction<br />
from down to up is not indicated at this time. We are still observing stop loss rule #3 and are trailing the Wall,<br />
whose current value, at 1.8168, is the highest of the three Stability Lines. <strong>The</strong>refore, we will use 1.8168 as our<br />
trailing stop loss (red “x”).<br />
Illustration 6.73. Possible short trade with MOXO entry. (BPZ5, 7/15/05-9/22/05).<br />
125<br />
x<br />
x<br />
x x x<br />
Entered trade<br />
at 1.7989<br />
Stop loss at 1.8168
Day 5, 9/23/05 Illustration 6.74<br />
At the end of Day 5, we find that the ACC is below zero and red. <strong>The</strong> MO is also below zero and red, and the<br />
value of the MO signal line is greater than the value of the histogram bars. Thus, a change in overall direction<br />
from down to up is not indicated at this time. <strong>The</strong> foregoing information indicates that the downward<br />
momentum is still strong. We are still observing stop loss rule #3 and are trailing the Wall, whose current value,<br />
at 1.8152, is the highest of the three Stability Lines. <strong>The</strong>refore, we will use 1.8152 as our trailing stop loss (red<br />
“x”).<br />
Illustration 6.74. Possible short trade with MOXO entry. (BPZ5, 7/15/05-9/23/05).<br />
126<br />
Entered trade<br />
at 1.7989<br />
x<br />
x<br />
x x x x<br />
Stop loss at 1.8152
Day 6, 9/26/05 Illustration 6.75<br />
At the end of Day 6, we find that the ACC is below zero and red. <strong>The</strong> MO is also below zero and red, and the<br />
value of the MO signal line is greater than the value of the histogram bars. Thus, a change in overall direction<br />
from down to up is not indicated at this time. <strong>The</strong> foregoing information indicates that the downward<br />
momentum is still strong. We are still observing stop loss rule #3 and are trailing the Wall, whose current value,<br />
at 1.8117, is the highest of the three Stability Lines. <strong>The</strong>refore, we will use 1.8117 as our trailing stop loss (red<br />
“x”).<br />
Illustration 6.75. Possible short trade with MOXO entry. (BPZ5, 7/15/05-9/26/05).<br />
127<br />
Entered trade<br />
at 1.7989<br />
x<br />
x<br />
x x x x<br />
x<br />
Stop loss at 1.8117
Day 7, 9/27/05 Illustration 6.76<br />
At the end of Day 7, we find that the ACC is below zero and showing one green bar. This is an early warning of<br />
a possible slowing up of the speed at which price is moving. <strong>The</strong> MO is also below zero and red, and the value<br />
of the MO signal line is greater than the value of the histogram bars. Thus, a change in overall direction from<br />
down to up is not indicated at this time. We are still observing stop loss rule #3 and are trailing the Wall, whose<br />
current value, at 1.8071, is the highest of the three Stability Lines. <strong>The</strong>refore, we will use 1.8071 as our trailing<br />
stop loss (red “x”).<br />
Illustration 6.76. Possible short trade with MOXO entry. (BPZ5, 7/15/05-9/27/05).<br />
Day 8, 9/28/05 Illustration 6.77<br />
128<br />
Entered trade<br />
at 1.7989<br />
x<br />
x<br />
x x x x<br />
x Stop loss at 1.8071<br />
x
At the end of Day 8, we find that the ACC is below zero and showing two consecutive green bars. This is an<br />
early warning of a possible slowing up of the speed at which price is moving. <strong>The</strong> MO is below zero and red,<br />
and the value of the MO signal line is greater than the value of the histogram bars. Thus, while price movement<br />
may be slowing, a change in overall direction from down to up is not indicated at this time. We are still<br />
observing stop loss rule #3 and are trailing the Wall, whose current value, at 1.8023, is the highest of the three<br />
Stability Lines. <strong>The</strong>refore, we will use 1.8023 as our trailing stop loss (red “x”).<br />
Illustration 6.77. Possible short trade with MOXO entry. (BPZ5, 7/15/05-9/28/05).<br />
129<br />
Entered trade<br />
at 1.7989<br />
x<br />
x<br />
x x x x<br />
x<br />
x<br />
x<br />
Stop loss<br />
at 1.8023
Day 9, 9/29/05 Illustration 6.78<br />
At the end of Day 9, we find that the ACC is below zero and showing three consecutive green bars. This is a<br />
very strong warning that the speed at which price is moving is slowing down. However, the MO is below zero<br />
and red, and the value of the MO signal line is greater than the value of the histogram bars. Thus, while price<br />
movement may be slowing a change in overall direction from down to up is not indicated at this time.<br />
Nevertheless, with three consecutive green ACC bars, stop loss rule #4 takes effect, requiring us to move<br />
down one Stability Line. Thus, we will move from trailing the Wall to trailing the Tripwire. <strong>The</strong>refore, we will use<br />
the Tripwire’s value of 1.7836 as our trailing stop loss (red “x”).<br />
Illustration 6.78. Possible short trade with MOXO entry. (BPZ5, 7/15/05-9/29/05).<br />
130<br />
Entered trade<br />
at 1.7989<br />
x<br />
x<br />
x x x x<br />
x<br />
x<br />
x<br />
x<br />
Stop loss<br />
at 1.7836
Day 10, 9/30/05 Illustration 6.79<br />
At the end of Day 10, we find that the ACC is below zero and showing four consecutive green bars (the fourth<br />
green bar has such a low value that it isn’t visible.) This is a very strong warning that the speed at which price<br />
is moving is slowing down. In addition, although the MO is below zero, it is now showing a green bar. However,<br />
the value of the MO signal line is greater than the value of the histogram bars. This information is an indication<br />
that momentum may be slowing and turning. Nevertheless, while price movement may be slowing a change in<br />
overall direction from down to is not indicated at this time. We are presently observing stop loss rule #4, and<br />
will use the Tripwire’s value of 1.7791 as our trailing stop loss (red “x”) until the ACC shows three more<br />
consecutive green bars, or until the ACC crosses from negative to positive or until we are stopped out.<br />
Illustration 6.79. Possible short trade with MOXO entry. (BPZ5, 7/15/05-9/30/05).<br />
131<br />
Entered trade<br />
at 1.7989<br />
x<br />
x<br />
x x x x<br />
x<br />
x<br />
x<br />
x<br />
x<br />
Stop loss<br />
at 1.7791
Day 11, 10/3/05 Illustration 6.80<br />
At the end of Day 11, we find that the ACC has crossed the zero line from negative to positive. This is very<br />
strong evidence that the speed at which price is moving has slowed down. In addition, although the MO is<br />
below zero, it is now showing two green bars. Moreover, although the value of the MO signal line is greater<br />
than the value of the histogram bars, it is only barely so. This information is an indication that momentum is in<br />
the process of slowing and turning.<br />
Since the ACC has crossed zero, we are required to observe rule #5, which calls for us to change our stop loss<br />
line to the Safety Line. Accordingly, we will use the Safety Line’s value of 1.7575 as our trailing stop loss (red<br />
“x”) until we are stopped out.<br />
Illustration 6.80. Possible short trade with MOXO entry. (BPZ5, 7/15/05-10/3/05).<br />
132<br />
Entered trade<br />
at 1.7989<br />
x<br />
x<br />
x x x x<br />
x<br />
x<br />
x<br />
x<br />
x<br />
Stop loss<br />
at 1.7575<br />
x
Day 12, 10/4/05 Illustration 6.81<br />
Our stop loss was hit today and we are out at 1.7575. Each .0001 of gain or loss in British Pound is worth<br />
$6.25. We entered the market at 1.7989 and exited at 1.7575 for a gain of 414 points. 414 points times $6.25<br />
comes to about $2,587 in gains for this trade.<br />
Illustration 6.81. Possible short trade with MOXO entry. (BPZ5, 7/15/05-10/4/05).<br />
<strong>The</strong> preceding examples have taken you step-by step through six trades with long and short fractal and MOXO<br />
entries for stocks and futures. You have learned how to identify entry signals and stop loss points. You have<br />
learned to use the Gatekeeper, the ACC, and the MO to help in your trading decisions. You have seen how<br />
TFE guides you into, through, and out of profitable trades. Finally, you have seen how powerful the system is.<br />
In the next module, you’ll learn how to exit with minimal loss when the market moves against your<br />
position. It answers the question, “If the market moves against my position, where do I exit?”<br />
133<br />
Entered trade<br />
at 1.7989<br />
x<br />
x<br />
x x x x<br />
x<br />
x<br />
x<br />
x<br />
x<br />
Stopped out<br />
at 1.7575<br />
x
Module 7. Exiting when the market moves against your position.<br />
In this module, you’ll learn how to exit with minimal loss when the market moves against your position.<br />
It answers the question, “If the market moves against my position, where do I exit?” Again, any<br />
reference to stocks in this section applies equally to futures.<br />
<strong>The</strong> Fractal’s <strong>Edge</strong> was designed to guide you into, through, and out of your trades. However, no system is<br />
perfect. From time to time, TFE will generate a signal, you’ll do your planning, and you’ll enter a trade.<br />
However, the market will, for whatever reason, move in the opposite direction. Fortunately, because of the<br />
interaction between the Gatekeeper, the Momentum Oscillator, and the Accelerometer, TFE will guide you out<br />
of those trades, usually with minimum loss.<br />
To demonstrate how this works, we’ll take you through two trades—one long, and one short.<br />
Exiting a long trade where the market has moved against your position<br />
<strong>The</strong> set up: Assume that today is 11/17/05. On 11/11/05, TFE generates a MOXO buy signal for BMY at<br />
22.16. Recall from Module 5 that a MOXO signal is valid until hit. Your initial stop loss is at 21.15, the low of<br />
the signal bar, which is also the lowest of the three most current bars as of 11/11/05. <strong>The</strong> ACC is positive and<br />
green. <strong>The</strong> MO is positive and green, and the value of the MO Signal Line is less than the value of the<br />
histogram bars. No change in direction is indicated. Your plan is to enter the trade when price equals or<br />
exceeds 22.16, and to exit when your daily stop loss is hit. Illustration 7.1 depicts the set up.<br />
Illustration 7.1. Set up for possible long MOXO entry (BMY, 9/1/05 11/17/05)<br />
134
Day 1, 11/18/05 Illustration 7.2<br />
<strong>The</strong> 11/18/05 bar has exceeded our entry price, and we are in the market at 22.16. Since the low of the current<br />
bar is above the Stability Lines, we are now following stop loss rule #3. We are trading aggressively, so we’ll<br />
use the lowest Stability Line. In this case, the Wall, at 21.54, has the lowest value, so we will set that as our<br />
stop loss point (red “x”). We note that the ACC is positive and green. In addition, since the MO is above zero<br />
and green, and the value of the MO signal line is lower than the value of the histogram bars, a change in<br />
overall direction is not yet indicated.<br />
Illustration 7.2. Long trade with MOXO entry, Day 1 (BMY, 9/1/05-11/18/05)<br />
135
Day 2, 11/21/05 Illustration 7.3<br />
At the end of Day 2, we find that the ACC is positive and green. In addition, since the MO is above zero and<br />
green, and the value of the MO signal line is lower than the value of the histogram bars, a change in overall<br />
direction is not yet indicated. We will continue to observe stop loss rule #3, using the Wall, at 21.61, as our<br />
stop loss point (red “x”).<br />
Illustration 7.3. Long trade with MOXO entry, Day 2 (BMY, 9/1/05-11/21/05)<br />
136
Day 3, 11/22/05 Illustration 7.4<br />
At the end of Day 3, we find that the ACC is positive, but showing one red bar. This is an early indication that<br />
the speed at which price is moving may be slowing down. However, since the MO is above zero and green,<br />
and the value of the MO signal line is lower than the value of the histogram bars, a change in overall direction<br />
is not yet indicated. We will continue to observe stop loss rule #3, using the Wall, at 21.68, as our stop loss<br />
point (red “x”).<br />
Illustration 7.4. Long trade with MOXO entry, Day 3 (BMY, 9/1/05-11/22/05)<br />
137
Day 4, 11/23/05 Illustration 7.5<br />
At the end of Day 4, we find that the ACC is positive, but showing two consecutive red bars. This is an early<br />
indication that the speed at which price is moving is beginning to slow. However, since the MO is above zero<br />
and green, and the value of the MO signal line is lower than the value of the histogram bars, a change in<br />
overall direction is not yet indicated. We will continue to observe stop loss rule #3, using the Wall, at 21.77, as<br />
our stop loss point (red “x”).<br />
Illustration 7.5. Long trade with MOXO entry, Day 4 (BMY, 9/1/05-11/23/05)<br />
138
Day 5, 11/25/05 Illustration 7.6<br />
At the end of Day 5, we find that the ACC is positive, but showing three consecutive red bars (the third bar’s<br />
value is so low that it’s very visible.) This is a strong early indication that the speed at which price is moving is<br />
beginning to slow. In addition, although the MO is above zero, it is showing a red bar. This is an indication that<br />
momentum is beginning to weaken. However, since the value of the MO signal line is lower than the value of<br />
the histogram bars, a change in overall direction is not yet indicated.<br />
Since the ACC had presented us with three consecutive red bars, it is time to observe stop loss rule #5. Thus,<br />
we will move from the Wall, to the Tripwire. At 22.09, we will use the Tripwire as our stop loss point (red “x”).<br />
Illustration 7.6. Long trade with MOXO entry, Day 5 (BMY, 9/1/05-11/25/05)<br />
139
Day 6, 11/28/05 Illustration 7.7<br />
TFE guided us out of this trade at 22.09 for a minimal loss of $0.07 per share.<br />
Illustration 7.7. Long trade with MOXO entry, Day 6 (BMY, 9/1/05-11/28/05)<br />
140
Let’s now take a look at how TFE guides us into, through, and out of a short trade when the market<br />
turns against our position.<br />
Exiting a short trade where the market has moved against your position<br />
<strong>The</strong> set up: Assume that today is 10/10/05, and we are following the 9/21/05 Fractal sell signal, at 30.85. Our<br />
initial stop loss is at 36.27, the value of the 9/19/05 Tripwire, which is the highest Stability Line above the<br />
highest high among the 9/21/05 Fractal bar and the two preceding bars. <strong>The</strong> ACC is negative but green. <strong>The</strong><br />
MO is negative and red, but the value of the MO Signal Line is less than the value of the histogram bars. This<br />
is strong evidence that a change in direction may occur in the near future. Nonetheless, our plan is to enter the<br />
trade when price equals or falls below 30.85, and to exit when our daily stop loss is hit. Illustration 7.8 depicts<br />
the set up.<br />
Illustration 7.8. Short trade with Fractal entry, Day 1 (LVS, 7/26/05-10/10/05)<br />
141
Day 1,10/11/05 Illustration 7.9<br />
<strong>The</strong> 10/11/05 bar has fallen just below our entry price, and we are in the market at 30.85. We note that the<br />
ACC is negative, but with two consecutive green bars (the second bar is not visible because the value is so<br />
low.) In addition, the MO is below zero and green, and the value of the MO signal line is slightly lower than the<br />
value of the histogram bars. All of these indications point to a change in overall direction. Nevertheless, since<br />
the high of the current bar is below the highest Stability Line, we are now following stop loss rule #3. We are<br />
trading aggressively, so we’ll use the highest Stability Line. In this case, the Tripwire, at 32.48, has the highest<br />
value, so we will set that as our stop loss point (red “x”).<br />
Illustration 7.9. Set up for possible short Fractal entry (LVS, 7/26/05-10/11/05)<br />
142
Day 2, 10/12/05 Illustration 7.10<br />
At the end of Day 2, we find that the ACC is negative and red. <strong>The</strong> MO is also below zero and red, and the<br />
value of the MO signal line is now greater than the value of the current histogram bar. At this time, an overall<br />
change in direction is not indicated. We continue to observe stop loss rule #3, using the Tripwire, at 32.23, as<br />
our stop loss point (red “x”).<br />
Illustration 7.10. Short trade with Fractal entry, Day 2 (LVS, 7/26/05-10/12/05)<br />
143
Day 3, 10/13/05 Illustration 7.11<br />
At the end of Day 3, we find that the ACC is still negative and red. <strong>The</strong> MO also remains below zero and red,<br />
and the value of the MO signal line is still greater than the value of the current histogram bar. At this time, an<br />
overall change in direction is not indicated. We continue to observe stop loss rule #3, moving from the Tripwire<br />
to the Wall, which is now the Stability Line with the highest value. We are now using the Wall, at 32.05, as our<br />
stop loss point (red “x”).<br />
Illustration 7.11. Short trade with Fractal entry, Day 3 (LVS, 7/26/05-10/13/05)<br />
144
Day 4, 10/14/05 Illustration 7.12<br />
At the end of Day 4, we find that the ACC is negative, but green. <strong>The</strong> MO also remains below zero, but is now<br />
green, and the value of the MO signal line is still greater than the value of the current histogram bar. This is an<br />
early warning of a possible change in overall direction. We continue to observe stop loss rule #3, using the<br />
Wall, at 31.99, as our stop loss point (red “x”).<br />
Illustration 7.12. Short trade with Fractal entry, Day 4 (LVS, 7/26/05-10/14/05)<br />
145
Day 5, 10/17/05 Illustration 7.13<br />
At the end of Day 5, we find that the ACC crossed the zero line from negative to positive. <strong>The</strong> MO also remains<br />
below zero, but is now showing two consecutive green bars. Since the value of the MO signal line is now less<br />
than the value of the current histogram bar, we have a strong warning of a possible change in overall direction.<br />
With the ACC crossing the zero line, it is time to observe stop loss rule #6, which requires us to immediately<br />
move to and follow the Safety Line. <strong>The</strong> value of the Safety Line is 30.74, so we will set that value as our stop<br />
loss point (red “x”).<br />
Illustration 7.13. Short trade with Fractal entry, Day 5 (LVS, 7/26/05-10/17/05)<br />
146
Day 6, 10/18/05 Illustration 7.14<br />
Our stop loss was filled at the open, and we are out of the trade at 30.98 for a small loss of $0.13 per share.<br />
Illustration 7.14. Short trade with Fractal entry, Day 6 (LVS, 7/26/05-10/18/05)<br />
147
<strong>The</strong> preceding modules have provided detailed instruction that answers the following questions:<br />
A. How do I select a stock to trade?<br />
B. After I make my selection, is there a potential trade?<br />
C. If so, where is my entry point?<br />
D. What should my initial stop loss be?<br />
E. How do I determine my daily stop loss value?<br />
F. How do I know when to exit?<br />
G. If the market moves against my position, where do I exit?<br />
You should now have a good basic understanding of how to trade with <strong>The</strong> Fractal’s <strong>Edge</strong>. However, trading<br />
without a good money management approach is doomed to failure. <strong>The</strong> next module, Module 8, presents a<br />
simple system for money management.<br />
148
Module 8, SECTION ONE: Money Management <strong>Guide</strong>lines for Trading Stocks with TFE<br />
(If you are trading only futures, skip ahead to SECTION TWO)<br />
Money management is the most important and most often neglected aspect of trading. It answers the<br />
questions, “How much can I safely risk on this trade?” and “What should my position size be?”<br />
According to the literature, most trading gurus recommend that a trader risk no more than 2% of total account<br />
equity on any one trade. Some place volatility into the mix, while others talk about the virtues of diversification.<br />
<strong>The</strong> goal of this module is to present a strategy for preserving capital so that you can trade another<br />
day while building account equity.<br />
In trading with TFE, we take a multifaceted approach to money management that can be broken down into<br />
these simple strategies:<br />
1. Allocate 75% of your total account size to available trading equity, and keep the remaining 25% in<br />
reserve.<br />
2. Screen stocks and allocate them to your portfolio according to the risk diversification matrix below:<br />
Low Risk — 50%<br />
Large, Mid, Small Cap:<br />
Share Price $20+<br />
Large, Mid, Small Cap:<br />
Share Price $5 to $20<br />
Find stocks that exhibit these<br />
traits:<br />
• <strong>The</strong> stock tends to trend<br />
• Bars are short and more<br />
uniform in length (low<br />
volatility).<br />
• Bars occasionally breach<br />
the Fence<br />
• Bars rarely breach the<br />
Tripwire<br />
• Bars breach the Wall only<br />
during a major change in<br />
direction<br />
Stocks from the Low-Risk prebuilt<br />
portfolio match these<br />
characteristics<br />
Medium Risk— 30%<br />
Large, Mid, Small Cap:<br />
Share Price $20+<br />
Large, Mid, Small Cap:<br />
Share Price $5 to $20<br />
Find stocks that exhibit these e<br />
traits:<br />
• <strong>The</strong> stock tends to trend<br />
• Bars are fairly consistent in<br />
length, with a few<br />
occasional longer bars<br />
(medium volatility).<br />
• Bars are also more likely to<br />
breach the Tripwire<br />
• Bars will once in a while<br />
breach the Wall<br />
Stocks from the Medium-Risk<br />
pre-built portfolio match these<br />
characteristics<br />
149<br />
Speculative — 20%<br />
Any Size Cap, Share Price $5+<br />
Find stocks that exhibit these<br />
traits:<br />
• <strong>The</strong> stock tends to trend<br />
• Bars are less consistent in<br />
length with a<br />
preponderance of longer<br />
bars (high volatility).<br />
• Bars regularly breach the<br />
Fence<br />
• Bars are also more likely to<br />
breach the Tripwire<br />
• Bars will once in a while<br />
breach the Wall<br />
Stocks from the High-Risk prebuilt<br />
portfolio match these<br />
characteristics<br />
To illustrate how the matrix works, we’ll assume a beginning account size of $30,000 and ability to buy on 50%<br />
margin.<br />
• We’ll use 75% of that amount, or $22,500 for available trading equity, and we’ll hold 25%, or $7,500, in<br />
reserve. <strong>The</strong> $22,500 represents $45,000 in buying power.<br />
• First, we’ll allocate 50% of the $22,500 available trading equity, or $11,250, to stocks in the lowrisk/value<br />
category<br />
• <strong>The</strong>n we’ll put 30% of the $22,500 available trading equity, or $6,750, into stocks in the mediumrisk/value<br />
category
• Finally, we’ll allocate 20% of the $22,500 available trading equity, or $4,500, to stocks in the<br />
speculative category<br />
Position Size<br />
3. We want to have the ability to maximize our ability to diversify (i.e., stocks from several sectors in odd<br />
lots to 100-share lots) or to trade with greater initial position size (lots of greater than 100 shares) as the<br />
opportunity arises. <strong>The</strong> following simple formula will help you with your position sizing and risk<br />
management goals. Assuming that we buy our shares on a 50% margin, and we want to diversify our<br />
trading across several sectors and with at least ten stocks (1000 total shares), then:<br />
• In the low-risk category, we can purchase 500 shares (five 100-share lots representing 50% of the 1000<br />
shares) at a price no greater than $45.00 per share ($11,250*2)/500.<br />
• In the medium-risk category, we can purchase 300 shares (three 100-share lots representing 30% of<br />
the 1000 shares) at a price no greater than $45.00 per share ($6,750*2)/300.<br />
• In the high-risk category, we can purchase 200 shares (two 100-share lots representing 20% of the<br />
1000 shares) at a price no greater than $45.00 per share ($4,500*2)/200.<br />
Let’s see what happens if one of the low-risk stocks we want to trade is at a price over $45.00 per share—<br />
say, at $65.00. Assuming the $30,000 account above and 50% margin, we would put up $3,250, leaving<br />
us with $8,000 of our initial $11,250. In keeping with our goal of five low-risk stocks, we could still enter four<br />
100-lot trades at a maximum of $40.00 per share ($8,000*2)/400.<br />
<strong>The</strong> idea here is that you can be flexible in position size and still meet your diversification goals.<br />
This answers the question, “What should my position size be?”<br />
Volatility Risk<br />
4. Because we are making short-term trades, we need to include a measure of short-term volatility in our stop<br />
loss. TFE takes volatility into account when computing stop loss points by using the highest high (or lowest<br />
low) of the three most recent bars (including the signal bar). This gives us a reliable measure of short-term<br />
volatility for short-term trading. We want this stop loss to represent no more than 3% of our total<br />
account equity. If your account equity is $30,000, then 3% of that amount would be $900. On the other<br />
hand, if your account equity is $10,000, then 3% of that amount would be $300.<br />
In our example of a long trade in Module 6, Illustration 6.1, we used the bar with the lowest low (45.41) of<br />
the most recent three bars to set the stop loss. When subtracted from the entry price (50.36), we had a<br />
range of 4.95, including the volatility factor. This 4.95 represented an initial risk of $495, or 1.7%<br />
($495/$30,000) of our total account equity. <strong>The</strong> minimum account size to make this trade using the volatility<br />
risk stop would be $16,500.<br />
If your account size were $10,000, then the most you would want to risk on this trade would be $300. On a<br />
100-lot trade, this would mean adjusting the stop loss in Module 6, Illustration 6.1, to 50.36 (entry price)<br />
minus 3.00 (maximum risk), or 50.36-3.00= 47.36.<br />
For stock traders, this answers the question, “How much am I willing to risk on this trade?”<br />
150
Module 8, SECTION TWO. Money Management <strong>Guide</strong>lines for Trading Commodities with TFE<br />
Money management is the most important and most often neglected aspect of trading. It answers the<br />
questions, “How much can I safely risk on this trade?” “What should my position size be?” and, “Will the reward<br />
be worth the risk?”<br />
According to the literature, most trading gurus recommend that a trader risk no more than 2% of total account<br />
equity on any one trade. Some place volatility into the mix, while others talk about the virtues of diversification.<br />
As with any system, occasional whipsaws will occur, usually, but not always, with a relatively small loss.<br />
However, since risk and loss are a fact of life in trading, money management is absolutely essential. What<br />
follows is an outline of money management practices we suggest you use when trading with TFE.<br />
In this module, you will learn how to diversify your own trading portfolio based on your account equity<br />
and the risk category for each futures contract. While you will find that the mix of contracts in your portfolio<br />
will vary according to your available trading equity, it is this diversity that helps preserve and build equity. With<br />
this in mind, we have designed portfolios for two modes of trading: Secure Growth and Accelerated Growth.<br />
Illustration 8.1 describes them.<br />
151
Illustration 8.1. Definition and Description of Trading Modes<br />
Mode<br />
Description<br />
Secure Growth<br />
Position size: 1 contract per<br />
market segment up to the<br />
maximum number of<br />
contracts allowed for the<br />
mode as determined by<br />
available trade equity.<br />
Portfolio Market Segments<br />
Grains<br />
Interest Rates/Financials<br />
Indices<br />
Softs<br />
Livestock<br />
Metals<br />
Currencies<br />
Aggressive Growth<br />
Position size: 1-3 contracts per<br />
market segment up to the<br />
maximum number of contracts<br />
allowed for the mode as<br />
determined by available trade<br />
equity.<br />
Portfolio Market Segments<br />
Grains<br />
Interest Rates/Financials<br />
Indices<br />
Softs<br />
Livestock<br />
Metals<br />
Currencies<br />
Energies<br />
For traders with between $2,500 and 50,000 in available trade equity.<br />
Traders in this mode are building equity toward the Aggressive Growth<br />
portfolio.<br />
This mode is divided into:<br />
• Level 1 ($2,500 to $12,000)<br />
• Level 2 ($12,500 to $29,500)<br />
• Level 3, ($30,000 to $50,000).<br />
Commodities falling within the parameters of the Secure Growth Mode<br />
Corn, Oats, Rough Rice, Wheat, Soybean Oil<br />
Eurodollar, 2-year Notes, 5-year Notes, Muni Bonds Index, 10-year Notes<br />
1-Month LIBOR, CRB Index<br />
Sugar, Cocoa, Cotton<br />
Lean Hogs, Live Cattle<br />
Gold, Silver<br />
Canadian Dollar, Australian Dollar, New Zealand Dollar, US Dollar Index<br />
Swiss Franc<br />
For traders with $51K or more in available trade equity.<br />
Traders in this mode are building toward increased wealth.<br />
This mode is divided into:<br />
• Level 4 ($51,000 to $100,000)<br />
• Level 5 (above $100,000)<br />
Commodities falling within the parameters of the Aggressive Growth<br />
Mode<br />
Corn, Oats, Rough Rice, Wheat, Soybean Oil, Soybean Meal, Soybeans<br />
Eurodollar, 2-year Notes, 5-year Notes, Muni Bonds Index, 10-year Notes,<br />
30-Year Bonds<br />
1-Month LIBOR, CRB Index, Nikkei 225, Dow E-mini, Nasdaq E-mini, S&P<br />
E-Mini, Value Line<br />
Sugar, Cocoa, Cotton, Orange Juice, Lumber, Coffee<br />
Lean Hogs, Live Cattle, Feeder Cattle, Pork Bellies<br />
Gold, Silver, Palladium, Platinum, Copper<br />
Canadian Dollar, Australian Dollar, New Zealand Dollar, US Dollar Index<br />
Swiss Franc, British Pound, Japanese Yen, Euro FX<br />
Crude Light, Heating Oil, Natural Gas, Unleaded Gas<br />
A word about volatility, reward, and risk<br />
Volatility is a statistical measure of the tendency of price to rise or fall sharply within a given time frame. In a<br />
way, it’s a barometer of reward and risk. High volatility generates enormous price swings within very short<br />
intervals. Highly volatile markets offer greater potential rewards, but also expose the trader to higher risk. Low<br />
volatility, on the other hand, produces steadier, more gradual increases and decreases in price. As a<br />
consequence, the rewards are usually less spectacular, but the risk of heavy losses is also much lower.<br />
Moreover, each market sector has its own volatility. For example, the livestock group has a higher collective<br />
152
volatility than the grains, but a lower collective volatility than the currencies. <strong>The</strong>refore, it is important to build a<br />
portfolio across and within all market sectors.<br />
Illustration 8.2 below shows how the Secure Growth Mode portfolio is broken down for risk and diversification.<br />
<strong>The</strong> commodities in the portfolio are categorized both horizontally and vertically according to their scaled<br />
volatilities. Volatility increases from left to right and from top to bottom. Consequently, commodities in the<br />
upper left cell have much lower volatilities than those in the lower right cell. Percentage amounts indicate the<br />
proportion of available trade equity to be invested in each market segment.<br />
Illustration 8.2 is only a guide. Whether you use the Watch Lists or do your own mapping, you may find that<br />
some of the higher risk commodities are currently showing characteristics of lower risk commodities. On the<br />
other hand, you may find some of the lower-risk contracts behaving like high-risk contracts. If this is the case,<br />
you can move them to the left or right, placing them in the cell that best corresponds to their actual risk level.<br />
Illustration 8.2. Secure Growth Portfolio--$2,500 to $50,000 (Combined Levels 1-3)<br />
Sector Lower Risk Moderate Risk Higher Risk<br />
50%<br />
35%<br />
15%<br />
Grains Corn<br />
Rough Rice<br />
Soybean Meal<br />
Oats<br />
Wheat<br />
Soybean Oil<br />
Soybeans<br />
Financials Euro Dollars Municipal Bond 30-year Bonds<br />
Two-year Notes Index<br />
Five-year Notes Ten-year Notes<br />
Indices 1-Month Libor CRB Index Nikkei 225<br />
Softs Sugar<br />
Cocoa<br />
Cotton Orange Juice<br />
Livestock Lean Hogs<br />
Live Cattle<br />
Feeder Cattle<br />
Metals Gold<br />
Palladium<br />
Silver<br />
Platinum<br />
Currencies Canadian Dollar US Dollar Index British Pound<br />
Australian Dollar<br />
New Zealand<br />
Dollar<br />
Swiss Franc Japanese Yen<br />
Energies Crude Light<br />
Heating Oil<br />
Determining Available Trade Equity in the Secure Growth Mode, Level 1 ($2,500 to $12,000)<br />
We’ll use two scenarios in this example: the $2,500 account and the $10,000 account.<br />
153<br />
Speculative<br />
0%<br />
We want to commit no more than 40% of total account equity to the pits at any one time. To arrive at the<br />
Maximum Available Trade Equity, multiply the total account equity by .4.<br />
$2,500*.4= $1,000 $10,000*.4 = $4,000<br />
Thus, the maximum Available Trade Equity for the $2,500 account is $1,000, while the maximum Available<br />
Trade Equity for the $10,000 account is $4,000.<br />
Determining Trading Mix from the Secure Growth Mode Level 1 Portfolio, $2,500 to $12,000<br />
Illustration 8.3 below contains sixteen commodities that can be traded within the parameters of Level 1.<br />
NOTE: <strong>The</strong> margins listed in this module have been compiled from sources believed to be reliable, and are<br />
provided here strictly for instructional purposes. However, since margin requirements are in constant flux and<br />
are subject to change without notice, it would be best to consult your broker prior to actual trading.
Illustration 8.3. Secure Growth Mode Level 1 Portfolio ($2,500 to $12,000)<br />
Sector Lower Risk Moderate Risk Higher Risk<br />
50%<br />
50%<br />
0%<br />
Grains Corn<br />
Rough Rice<br />
Oats<br />
Wheat<br />
Financials Euro Dollars<br />
Two-year Notes<br />
Indices 1-Month Libor<br />
Municipal Bond<br />
Index<br />
Softs Sugar<br />
Cocoa<br />
Cotton<br />
Livestock Lean Hogs<br />
Live Cattle<br />
Metals Gold<br />
Currencies Canadian Dollar<br />
Australian Dollar<br />
Energies<br />
For the $2,500 account<br />
154<br />
Speculative<br />
0%<br />
Select one or more Lower-Risk contracts whose margin requirement fall within the $1,000 Max Available Trade<br />
Equity. For a $2,500 account, any of the contracts below is viable.<br />
Grains: Corn $506, Oats $338<br />
Financials: Euro Dollars $700, Two-year Notes $540, Five-year Notes $675<br />
Indices: 1-Month LIBOR $405<br />
Softs: Sugar $700, Cocoa $980<br />
Depending on your Low-risk selection, any ONE of the Moderate-risk contracts below is viable.<br />
Grains: Rough Rice $513, Wheat $506<br />
OR: ANY COMBINATION of allowable contracts that does not exceed $1,000. For example, you could go with<br />
one Oats and one LIBOR, one Corn and one LIBOR, one LIBOR and one Wheat, one LIBOR and one Rice, or<br />
one of any contract over $500. As an example, let’s say you chose one LIBOR and one Wheat. Your<br />
allocations would be as follows:<br />
Total Contracts = 2 Total equity committed = $911 Total reserves = $2,500 - $911 = $1,589<br />
For the $10,000 portfolio, it would go something like this:<br />
1) Compute Max Available Trade Equity<br />
Max Available Trade Equity = $10,000*.4 = $4,000
2) Select Secure Growth contracts whose margin requirement falls within the $4,000 Max Available<br />
Trade Equity<br />
a) Allocate about 50% of the $4,000 ($2,500) to Lower-risk markets<br />
In this case, we could go with any combination of these that comes to about $2,000. As an example,<br />
One Oats $338, one Two-yr. Notes $540, one LIBOR $405, one Sugar $700. TOTAL MARGIN = $1,983.<br />
b) Allocate the remaining $2,000 to the Moderate-risk markets. In this case, you could go with one of the<br />
currencies, or you could select one Live Cattle $945 and one Cocoa $980. TOTAL MARGIN = $1,925.<br />
At this point, your trading would be spread across Grains, Financials, Indices, Softs, and Livestock as<br />
follows:<br />
Total Contracts = 6 Total equity committed = $3,908 Total reserves = $10,000 - $3,908 = $6,092<br />
Determining Trading Mix from the Secure Growth Mode Level 2 Portfolio, $12,500 to $29,000<br />
Illustration 8.4 below contains the sixteen commodities that can be traded within the parameters of Level 1<br />
plus an additional set (in bold).<br />
Illustration 8.4. Secure Growth Mode Level 2 Portfolio ($12,500 to $29,500)<br />
Sector Lower Risk Moderate Risk Higher Risk<br />
50%<br />
35%<br />
15%<br />
Grains Corn<br />
Rough Rice<br />
Soybean Meal<br />
Oats<br />
Wheat<br />
Soybean Oil<br />
Soybeans<br />
Financials Euro Dollars Municipal Bond<br />
Two-year Notes Index<br />
Five-year Notes Ten-year Notes<br />
Indices 1-Month Libor CRB Index<br />
Softs Sugar<br />
Cocoa<br />
Cotton Orange Juice<br />
Livestock Lean Hogs<br />
Live Cattle<br />
Feeder Cattle<br />
Metals Gold<br />
Silver<br />
Palladium<br />
Currencies Canadian Dollar US Dollar Index<br />
Energies<br />
Australian Dollar<br />
New Zealand<br />
Dollar<br />
Swiss Franc<br />
For an example of Level 2 diversification, we’ll assume an account size of $20,000.<br />
1) Compute Max Available Trade Equity<br />
Max Available Trade Equity = $20,000*.4 = $8,000<br />
155<br />
Speculative<br />
0%
2) Select contracts whose margin requirement falls within the $8,000 Max Available Trade Equity<br />
a) Allocate about 50% of the $8,000 ($4,000) to Lower-risk markets<br />
In this case, we could go with any combination of these that comes to about $4,000. For example:<br />
One Euro Dollars $700, one LIBOR $405, one Sugar $700, one Cocoa $980, one Canadian Dollar $1,215<br />
Total Lower-risk equity committed = $4,000<br />
Total Lower-risk contracts = 5<br />
b) Allocate 35% of the $8,000 trade equity ($2,800) to contracts in the Moderate-risk markets<br />
One Wheat $506, one Gold $2,025<br />
Total Moderate-risk equity committed = $2,531<br />
Total Moderate-risk contracts = 2<br />
c) Allocate the remaining 15% of available trade equity ($1,200) to Higher-risk contracts<br />
One Orange Juice $910<br />
Total Higher-risk equity committed = $910<br />
Total Higher-risk contracts = 1<br />
Total Contracts = 8 Total equity committed = $7,441 Total reserves = $20,000 - $7,441 = $12,559<br />
Market sectors represented in portfolio: Grains, Financials, Indices, Softs, Metals, Currencies<br />
Determining Trading Mix from the Secure Growth Mode Level 3 Portfolio, $30,000 to $50,000<br />
Illustration 8.5 below contains the twenty-nine commodities that can be traded within the parameters of Level<br />
2 plus an additional set (in bold).<br />
Illustration 8.5. Secure Growth Mode Level 3 Portfolio ($30,000 to $50,000)<br />
Sector Lower Risk Moderate Risk High Risk<br />
50%<br />
35%<br />
15%<br />
Grains Corn<br />
Rough Rice<br />
Soybean Meal<br />
Oats<br />
Wheat<br />
Soybean Oil<br />
Soybeans<br />
Financials Euro Dollars Municipal Bond 30-year Bonds<br />
Two-year Notes Index<br />
Five-year Notes Ten-year Notes<br />
Indices 1-Month Libor CRB Index Nikkei 225<br />
Softs Sugar<br />
Cocoa<br />
Cotton Orange Juice<br />
Livestock Lean Hogs<br />
Live Cattle<br />
Feeder Cattle<br />
Metals Gold<br />
Palladium<br />
Silver<br />
Platinum<br />
Currencies Canadian Dollar US Dollar Index British Pound<br />
Energies<br />
Australian Dollar<br />
New Zealand<br />
Dollar<br />
Swiss Franc Japanese Yen<br />
156<br />
Speculative<br />
0%
For an example of Level 3 diversification, we’ll assume an account size of $40,000.<br />
1) Compute Max Available Trade Equity<br />
Max Available Trade Equity = $40,000*.4 = $16,000<br />
2) Select contracts whose margin requirement falls within the $16,000 Max Available Trade Equity<br />
a) Allocate about 50% of the $16,000 ($8,000) to Lower-risk markets<br />
In this case, we could go with any combination of these that comes to about $8,000. For example:<br />
One contract of each Lower-risk commodity, excepting New Zealand Dollar.<br />
Total Lower-risk equity committed = $7,342<br />
Total Lower-risk contracts = 10<br />
b) Allocate 35% of the $16,000 trade equity ($5,600) to contracts in the Moderate-risk markets<br />
One Wheat, one CRB Index, one Gold<br />
Total Moderate-risk equity committed = $5,355<br />
Total Moderate-risk contracts = 3<br />
c) Allocate 15% of the $16,000 available trade equity ($2,400) to Higher-risk contracts<br />
One Soybean Meal, one Orange Juice, one Feeder Cattle<br />
Total Higher-risk equity committed = $2,969<br />
Total Higher-risk contracts = 3<br />
Total Contracts = 16 Total equity committed = $15,666 Total reserves = $40,000 - $15,666 = $24,334<br />
Market sectors represented in portfolio: Grains, Financials, Indices, Softs, Livestock, Metals, Currencies<br />
157
Determining Trading Mix from the Aggressive Growth Mode Level 4 Portfolio, $51,000 to $100,000<br />
Illustration 8.6 below contains the thirty-four commodities that can be traded within the parameters of Secure<br />
Growth Mode Level 3 plus an additional set (in bold).<br />
Illustration 8.6. Aggressive Growth Mode Level 4 Portfolio ($51,000 to $100,000)<br />
Sector Lower Risk Moderate Risk High Risk<br />
Speculative<br />
40%<br />
35%<br />
15%<br />
10%<br />
Grains Corn<br />
Rough Rice<br />
Soybean Meal<br />
Oats<br />
Wheat<br />
Soybean Oil<br />
Soybeans<br />
Financials Euro Dollars Municipal Bond 30-year Bonds<br />
Two-year Notes Index<br />
Five-year Notes Ten-year Notes<br />
Indices 1-Month Libor CRB Index Nikkei 225 Dow E-mini<br />
Softs Sugar<br />
Cotton Orange Juice Lumber<br />
Cocoa<br />
Coffee<br />
Livestock Lean Hogs<br />
Live Cattle<br />
Feeder Cattle Pork Bellies<br />
Metals Gold<br />
Palladium<br />
Copper<br />
Silver<br />
Platinum<br />
Currencies Canadian Dollar US Dollar Index British Pound<br />
Australian Dollar<br />
New Zealand<br />
Dollar<br />
Swiss Franc Japanese Yen<br />
Energies Crude Light<br />
Heating Oil<br />
For an example of Level 4 diversification, we’ll assume an account size of $80,000.<br />
1) Compute Max Available Trade Equity<br />
Max Available Trade Equity = $80,000*.4 = $32,000<br />
2) Select contracts whose margin requirement falls within the $32,000 Max Available Trade Equity<br />
a) Allocate about 40% of the $32,000 ($12,800) to Lower-risk markets<br />
In this case, we could go with any combination of these that comes to about $12,800. For example:<br />
Two contracts each of Corn, Oats, Euro Dollars, 2-yr Notes, 5-yr Notes, and Sugar, and one contract of<br />
each of the rest.<br />
Total Lower-risk equity committed = $12,556<br />
Total Lower-risk contracts = 17<br />
b) Allocate 35% of the $32,000 trade equity ($11,200) to contracts in the Moderate-risk markets<br />
One each of Soybean Oil, CRB Index, Cotton, Lean Hogs, Live Cattle, Gold, and Silver<br />
Total Moderate-risk equity committed = $11,215<br />
Total Moderate-risk contracts = 7<br />
c) Allocate 15% of the $32,000 available trade equity ($4,800) to Higher-risk contracts<br />
One each of Soybeans, Municipal Bonds, Orange Juice, and Feeder Cattle<br />
Total Higher-risk equity committed = $4,893<br />
158
Total Higher-risk contracts = 4<br />
d) Allocate 10% of the $32,000 available trade equity ($3,200) to Speculative contracts<br />
One Coffee<br />
Total Speculative equity committed = $3,080<br />
Total Speculative contracts = 1<br />
Total Contracts = 29 Total equity committed = $31,654 Total reserves = $80,000 - $31,744 = $48,256<br />
Market sectors represented in portfolio: Grains, Financials, Indices, Softs, Livestock, Metals, Currencies and<br />
Energies.<br />
Determining Trading Mix from the Aggressive Growth Mode Level 5 Portfolio, $101,000 and above<br />
Illustration 8.7 below contains the forty commodities that can be traded within the parameters of Aggressive<br />
Growth Mode Level 4 plus an additional set (in bold).<br />
Illustration 8.7. Aggressive Growth Mode Level 5 Portfolio ($101,000 and above)<br />
Sector Lower Risk Moderate Risk High Risk<br />
Speculative<br />
30%<br />
30%<br />
20%<br />
20%<br />
Grains Corn<br />
Rough Rice<br />
Soybean Meal<br />
Oats<br />
Wheat<br />
Soybean Oil<br />
Soybeans<br />
Financials Euro Dollars Municipal Bond 30-year Bonds<br />
Two-year Notes Index<br />
Five-year Notes Ten-year Notes<br />
Indices 1-Month Libor CRB Index Nikkei 225 Dow E-mini<br />
Nasdaq E-mini<br />
S&P 500 E-mini<br />
Value Line Futures<br />
Softs Sugar<br />
Cotton Orange Juice Lumber<br />
Cocoa<br />
Coffee<br />
Livestock Lean Hogs<br />
Live Cattle<br />
Feeder Cattle Pork Bellies<br />
Metals Gold<br />
Palladium<br />
Copper<br />
Silver<br />
Platinum<br />
Currencies Canadian Dollar US Dollar Index British Pound Euro FX<br />
Australian Dollar<br />
New Zealand<br />
Dollar<br />
Swiss Franc Japanese Yen<br />
Energies Crude Light<br />
Natural Gas<br />
Heating Oil<br />
Unleaded Gas<br />
For an example of Level 5 diversification, we’ll assume an account size of $150,000.<br />
1) Compute Max Available Trade Equity<br />
Max Available Trade Equity = $150,000*.4 = $60,000<br />
159
2) Select contracts whose margin requirement falls within the $60,000 Max Available Trade Equity<br />
a) Allocate about 30% of the $60,000 ($18,000) to Lower-risk markets<br />
In this case, we could go with any combination of these that comes to about $12,800. For example:<br />
Two contracts each of all contracts in the Lower-risk category<br />
Total Lower-risk equity committed = $18,194<br />
Total Lower-risk contracts = 22<br />
b) Allocate 30% of the $60,000 trade equity ($18,000) to contracts in the Moderate-risk markets<br />
One each of all contracts in this category except Wheat, which has two<br />
Total Moderate-risk equity committed = $18,119<br />
Total Moderate-risk contracts = 14<br />
c) Allocate 20% of the $60,000 available trade equity ($12,000) to Higher-risk contracts<br />
One each of Soybeans, Nikkei, Orange Juice, Feeder Cattle, and Crude Light<br />
Total Higher-risk equity committed = $11,540<br />
Total Higher-risk contracts = 5<br />
d) Allocate 20% of the $60,000 available trade equity ($12,000) to Speculative contracts<br />
One each of Dow Jones E-mini, Lumber, Coffee, Pork Bellies, and Copper<br />
Total Speculative equity committed = $11,688<br />
Total Speculative contracts = 5<br />
Total Contracts = 46 Total equity committed = $59,541 Total reserves = $150,000 - $59,541 = $90,459<br />
Market sectors represented in portfolio: Grains, Financials, Indices, Softs, Livestock, Metals, Currencies and<br />
Energies<br />
By building your portfolio in this manner, you limit your exposure by spreading risk not only across the range of<br />
market sectors, but also within each sector. This type of systematic diversification will help you preserve your<br />
capital and earn steady profits.<br />
Let’s now go to Module 9, where we’ll learn about the optional TFE indicators, the Gatekeeper<br />
Histogram chart, the E-wave Oscillator, and the Psychometric Evaluators.<br />
160
Module 9. Optional Indicators<br />
Research has provided insights into relationships among certain concepts found among the sciences and<br />
TFE’s powerful indicators. As a consequence, TFE is now easier to use. Some indicators, such as the<br />
Gatekeeper Stability Lines, the Momentum Oscillator (MO), and the Accelerometer (ACC) playing a more<br />
dominant role, while the Gatekeeper Histogram, the E-Wave, and the Psychometric Evaluators have become<br />
redundant.<br />
This does not mean that they don’t have value. It just means that they are now optional. Below is a brief<br />
description of each optional indicator.<br />
<strong>The</strong> Gatekeeper Histogram<br />
<strong>The</strong> Gatekeeper Histogram was designed to 1) provide a confirmation of the Gate’s status, and 2) to locate<br />
channeling, range-bound markets.<br />
It is actually a histogram chart of two of the three Stability Lines that make up the Gatekeeper, adjusted to give<br />
us an early warning of the gate’s closing. <strong>The</strong> gate closes whenever two or more of the Stability Lines are<br />
intertwined. When the gate is closed, a trade should not be considered. Observe in Illustration 9.1 that the<br />
Gatekeeper histogram broadens as the gate is opening (blue arrows), and narrows as the gate is closing (red<br />
arrows). <strong>The</strong> gate is open for long trades when the value of the Fence is greater than the value of the Tripwire,<br />
and the value of the Tripwire is greater than the value of the Wall. <strong>The</strong> gate is open for short trades when the<br />
Wall is greater than the Tripwire and the Tripwire is greater than the Fence. Histogram bar positive values<br />
indicate upward price movement, while negative values indicate downward movement.<br />
Illustration 9.1. Gatekeeper histogram showing gate opening and closing (JNJ, 2/8/2002 – 5/13/2002)<br />
161
<strong>The</strong> GateKeeper histogram also gives us the advantage of seeing approximately where channels are located.<br />
We can easily identify channels whenever a series of histogram bars remains relatively close to the zero line.<br />
This is illustrated by the dotted lines in Illustration 9.2. <strong>The</strong> longer the histogram remains relatively close to the<br />
zero line, the longer the channel, and the more potential we have of getting in on the beginning of a significant<br />
price move.<br />
Both of the functions described above have been replaced by the interaction of the 3SMA Safety Line with the<br />
other elements of the Gatekeeper: the Wall, the Tripwire, and the Fence. <strong>The</strong> Gatekeeper Histogram can still<br />
be used to enhance your pre-trade analysis.<br />
Illustration 9.2. Gatekeeper histogram showing identifying channels (JNJ, 2/8/2002 – 5/13/2002)<br />
To summarize, in conjunction with the Stability Lines, the GateKeeper histogram:<br />
• provides another confirmation of the gate's status (open/closed).<br />
• gives an early warning that the gate is closing.<br />
• indicates approximately where channels are located.<br />
<strong>The</strong> E-Wave Oscillator<br />
<strong>The</strong> E-Wave oscillator is an indicator of overall, longer-range market rhythm. It measures the ebb and flow of<br />
the market and confirms the Momentum Oscillator’s estimation of where the market begins to pick up or run<br />
out of steam. For example, when the signal line is no longer touching the histogram bars of the E-wave<br />
oscillator, it is a confirming indicator that the market is running out of energy and possibly changing direction.<br />
This is particularly true if the bars become shorter and shorter as they move toward the zero line. On the other<br />
hand, when the signal line is cutting through the bars, it is an indicator of the strength and direction of the<br />
trend, particularly if the histogram bars become progressively longer as they move away from the zero line.<br />
<strong>The</strong> histogram bars themselves provide the confirmation of overall trend direction. If the bars are above the<br />
zero line, the overall trend direction is upward, and if they are below the zero line, the overall trend direction is<br />
162
downward. When the signal line is cutting through the histogram bars, then market momentum is strong. Let’s<br />
look at Illustration 9.3a. the E-Wave Oscillator without the price chart, and examine it for evidence of overall<br />
market direction.<br />
Illustration 9.3a. E-Wave Oscillator (JNJ, 11/20/2001 – 5/28/2002)<br />
<strong>The</strong> dotted vertical arrows indicate separation of the signal bar from the histogram bars, with red representing<br />
downward pressure or direction and green representing upward pressure or direction. <strong>The</strong> solid vertical arrows<br />
indicate where the histogram bars cross the zero line and represent confirmation of major directional change.<br />
<strong>The</strong> solid horizontal arrows show the extreme limits of directional movement. We do not want to be long the<br />
market when the E-Wave histogram bars are below the zero line.<br />
<strong>The</strong> Psychometric Evaluators<br />
When we make a decision to buy, sell, enter, or exit, or stay, that decision is combined with the decisions of all<br />
the other traders in the market. <strong>The</strong> Psychometric Evaluators are a pair of histograms that depict the current<br />
day’s volume (the Volume histogram) and a ratio of the current volume to the day’s trading range (the Volume-<br />
Range Ratio—VRR histogram). <strong>The</strong>se graphs work together to give us a picture of the how the “mass mind”<br />
has affected the day’s trading. Illustration 9.3b is an example of what they look like.<br />
Illustration 9.3b <strong>The</strong> Psychometric Evaluators<br />
Combining Volume and VRR<br />
Like the MO and ACC, the bars in the Volume and VRR graphs are either green or red. A green bar means<br />
that the value of that particular bar is higher than the value of the bar to its immediate left. A red bar means that<br />
the value of that particular bar is lower than the value of the bar to its immediate left. <strong>The</strong>re are four possible<br />
color combinations when the Volume and VRR are integrated. Reading from Volume down to VRR, they are<br />
Green-Green, Red-Red, Red-Green, and Green-Red. <strong>The</strong> white arrows in Illustration 9.3b indicate that the<br />
most recent combination is Green-Green, and the combination to the left of that is Green-Red.<br />
An increase (Green) or decrease (Red) in volume tells us whether more of fewer traders are entering the<br />
market, and an increase (Green) or decrease (Red) in VRR tells us how the market is reacting to the changes.<br />
When we combine the Volume and the VRR, we have a tool that gives us powerful insight into the mass mind.<br />
163
Think of the market as a river that you’re planning on rafting down. It’s a river that is perfectly safe if you<br />
understand the structure of the riverbed and know what to look for along the way; and it’s perfectly treacherous<br />
if you don’t. Imagine the four combinations of green and red bars as signs, posted on the bank, that describe<br />
the bed of that river. You are not able to actually see the riverbed, but all along the shore there are<br />
combinations of green and red signs that tell you what’s happening underneath. Table 9.4 below describes the<br />
signs and their meanings.<br />
Table 9.4. Volume/VRR color combinations and their interpretations<br />
and the current VRR bar is the underlying structure is<br />
If the current Volume bar is<br />
Green (high volume) Green (high facilitation) Deep, broad channel; smooth<br />
bottom; downhill grade; strong<br />
and swift undercurrent;<br />
go with the flow<br />
Red (low volume) Red (low facilitation) Wide, smooth bottom; no<br />
grade; almost no current;<br />
things are slowing down<br />
Red (low volume) Green (high facilitation) Semi-deep, narrow, manmade<br />
channel with gate;<br />
rocky, uneven bottom; swift,<br />
rough current; possible price<br />
manipulation<br />
Green (high volume) Red (low facilitation) Deep and narrow; smooth<br />
bottom; river forks ahead;<br />
watch for change in trend<br />
Let’s take a trip down the river as we examine these four combinations of signs in more detail.<br />
164
Illustration 9.5. <strong>The</strong> Psychometric Evaluators (Green-Green) with price chart (JNJ, 12/4/2001 -<br />
3/08/2002)<br />
Green-Green (Illustration 9.5)<br />
Imagine that we're in a quiet pool just off the main stream. If we look down river, we can see that there is a fork<br />
ahead. In front of us are two signs, and both are green. If we understand the signs, what do we know about the<br />
river? Well, we know that the riverbed is smooth, deep, and running down hill. We also know that there is a<br />
high volume of water and the undercurrent is swift and very strong. Once we enter the main stream, we know<br />
we will have no choice but to go with the current and travel down whichever fork it takes us. If we try to choose<br />
the other fork, the current will be way too strong to paddle against, and we'd probably end up capsizing.<br />
So, what do we know about the market when the Psychometric Evaluators show us two green bars? We know<br />
that a lot more shares are being traded (higher volume). We also know that the trades are favoring the<br />
direction in which the current bar is moving, and we know that price movement is picking up speed (higher<br />
VRR). Usually, but not quite always, the green-green combination is accompanied by a close in the upper third<br />
of the price bar in an upward trend, and in the lower third of the price bar in a downward trend. Thus, if we<br />
enter the market with two greens, our best immediate strategy would be to go with the flow. It would be<br />
disastrous for us to trade against the direction of the current bar.<br />
165
Illustration 9.6. <strong>The</strong> Psychometric Evaluators (Red-Red) with price chart (JNJ, 12/4/2001 - 3/08/2002)<br />
Red-Red (Illustration 9.6)<br />
As we continue down the river, the current begins to force us toward a narrow branch that opens into a wide,<br />
but shallow body of water. Posted near the entry to that branch are two red signs. What do we know about the<br />
river at this point? We know that the riverbed is smooth and there is no grade, so the surface will be calm and<br />
there will be very little current. Things are slowing way down.<br />
In the market, when the Psychometric Evaluators show us two red bars, it means that fewer shares are trading,<br />
and price movement is slowing down. This often happens near the end of an Elliot wave of some lower time<br />
frame. For example, the price has been rising, but as traders loose interest and are no longer willing to enter<br />
the market, there is a general slowing or even slight decline in price. <strong>The</strong> close will often be in the lower half of<br />
the day's price range.<br />
166
Illustration 9.7. <strong>The</strong> Psychometric Evaluators (Red-Green) with price chart (JNJ, 12/4/2001 - 3/08/2002)<br />
Red-Green (Illustration 9.7)<br />
Back to the river. Up ahead we see a man-made channel with a gate. A red sign and a green sign stand<br />
nearby. From the signs, we know that when the volume of water in the river is low, farmers in the area, sensing<br />
a possible change in the weather, open the gate. <strong>The</strong>y store water in anticipation of a drought, or run it off in<br />
anticipation of rain. Because of the red-green combination, we know that this channel is narrow, just deep<br />
enough to be over our heads, and uneven on the bottom.<br />
Although the volume flowing through the channel is not high, the channel itself is capable of moving us along at<br />
break-neck speed. Even though we would like to go in another direction, if the farmers open the gate, we will<br />
be drawn into the channel's swift, rough current. Knowing this, we wear life jackets, helmets, and whatever<br />
other safety equipment we may need.<br />
How does all of this relate to the market? <strong>The</strong> Red-Green combination is probably the most frequently<br />
occurring of all the patterns. When the Psychometric Evaluators show us Red-Green, we know that we have<br />
low volume, but high price facilitation. If this situation is not followed within the next two bars by an increase in<br />
volume, we can be pretty sure we are experiencing a temporary change in direction (Illustration 9.7), the blue<br />
and violet arrows in area 1 on the price chart). If Red-Green is followed within one or two bars by higher<br />
volume, then it is just a pause in the action before the market moves in our direction again. Because of Red-<br />
Green's turbulent nature, the close will be at the lower end of the price bar on one day, and the upper end on<br />
another day, and somewhere in between on yet another day.<br />
Illustration 9.8. <strong>The</strong> Psychometric Evaluators (Green-Red) with price chart (JNJ, 12/4/2001 - 3/08/2002)<br />
167<br />
1
Illustration 11.7<br />
Green-Red (Illustration 9.8)<br />
As we continue down the river, we come into an area that is deep and narrow. On the bank we see a green<br />
sign and a red sign. Our knowledge of the signs tells us that the riverbed is smooth with no grade. <strong>The</strong>re is<br />
high water volume, and the current is strong but slow-moving in comparison to Green-Green or Red-Green<br />
areas. We also know that the river forks ahead, and each fork is gated. A battle over water rights is raging<br />
between two neighboring towns, and each is trying to get as much of the river to flow down its fork as possible.<br />
Depending on who is controlling the water flow, we'll either continue toward our destination, or we'll have to<br />
prepare take a detour.<br />
In the market, a Green-Red combination offers us the greatest potential for getting in on the beginning of a<br />
trend. Almost all major price moves end with a Green-Red as one of the top/bottom three bars (Illustration<br />
9.7, solid arrows). Knowing this can help us identify the beginning of a trend. However, while almost all trends<br />
end with Green-Red, not all Green-Red combinations mark the end of a trend. Green-Reds appear quite often,<br />
and if they don't end a trend, they let us know the current one will go on until the Psychometric Evaluators<br />
show us the next Green-Red combination (Illustration 9.7, dotted arrows).<br />
Green-Reds signify the last great battle between buyers (bulls) and sellers (bears). Buyers want the price to<br />
rise, sellers want the price to fall. More and more shares are being traded, but there is less price movement in<br />
relation to the volume coming in. In the river analogy, the farmers are duking it out at the gates, and whoever<br />
wins, that's the way the water will flow; in the market, that's the way the trend will go.<br />
<strong>The</strong> course concludes with Module 10, a recap of signals and entry and exit points.<br />
168
References<br />
Dalton, J. F., Jones, E. T., and Dalton, R. B. Mind over markets. Chicago, IL: Probus Publishing Co., 1990.<br />
Kindelberger, C. P. Manias, panics and crashes. New York: <strong>Basic</strong> Books, 1978.<br />
Lebon, G. <strong>The</strong> crowd. Deleware: Cherokee Publishing, 1982.<br />
Smith, A. Powers of the mind. New York: Random House, 1975.<br />
Steidlmayer, P. J., and Koy, K. Markets and market logic. Chicago: Porcupine Press, 1986.<br />
Williams, B. Trading chaos: Applying expert techniques to maximize your profits. New York: John Wiley and<br />
Sons, Inc., 1995. (http://www.wiley.com, http://www.profitunity.com).<br />
Zweig, M. Winning on Wall Street. New York: Warner Books, 1990.<br />
169
Module 10. Quick-Reference Tables<br />
Recap of entry signals and rules for long and short trades<br />
LONG ENTRY RULES SHORT ENTRY RULES<br />
Buy Fractals Sell Fractals<br />
1) Buy Fractals are marked with a green "B" above the<br />
high of the fractal bar.<br />
2) Enter market when price rises to an amount equal to or<br />
greater than two ticks above the fractal bar's high.<br />
3) A buy fractal is valid until it is hit.<br />
MOXO Buy MOXO Sell<br />
1) Signal bar is first MO bar that crosses zero line from<br />
negative to positive.<br />
2) 3SMA Safety line must be greater than Fence.<br />
3) Entry point is two ticks above high of corresponding<br />
price bar.<br />
4) A MOXO buy signal is valid until hit.<br />
170<br />
1) Sell Fractals are marked with a red "S" below the low of<br />
the fractal bar.<br />
2) Enter market when price falls to an amount equal to or<br />
less than two ticks below the fractal bar's low.<br />
3) A sell fractal is valid until it is hit.<br />
1) Signal bar is first MO bar that crosses zero line from<br />
positive to negative.<br />
2) 3SMA Safety line must be less than Fence.<br />
3) Entry point is two ticks below low of corresponding<br />
price bar.<br />
4) A MOXO sell signal is valid until hit.<br />
Recap of the stop loss rules for both long and short trades.<br />
STOP LOSS RULES FOR LONG POSITIONS<br />
STOP LOSS RULES FOR SHORT POSITIONS<br />
1. Set initial stop at the LOWER of either<br />
• the lowest low of last three price bars (including the<br />
signal bar), or<br />
• the value of the lowest Stability Line<br />
• If the low of the entry-day bar is lower than the lowest<br />
Stability Line, stay with initial stop until the low of the<br />
current bar is greater than lowest Stability Line, then go<br />
to Rule #3. If the low of the entry-day bar is higher than<br />
the lowest Stability Line, go to Rule #3.<br />
2. Depending on your trading style, risk tolerance, and<br />
money management practices,<br />
• For an aggressive approach, if the Wall (blue line) is<br />
the lowest Stability Line, follow the Wall; otherwise,<br />
follow the lowest Stability Line until it crosses the Wall,<br />
then follow the Wall.<br />
• For a less aggressive approach, if the Tripwire (red<br />
line) is the lowest Stability Line, follow the Tripwire;<br />
otherwise follow the lowest Stability Line until it crosses<br />
the Tripwire, then follow the Tripwire.<br />
• For a conservative approach, if the Fence (green line)<br />
is the lowest Stability Line, follow the Fence; otherwise<br />
follow the lowest Stability Line until it crosses the<br />
Fence, then follow the Fence.<br />
3. If the ACC is greater than zero, follow rule #3 above.<br />
4. If the ACC is above zero and three consecutive red<br />
ACC bars (including the current bar) have occurred,<br />
move up one Stability Line for each set of three red<br />
ACC bars. For example, if you are currently following<br />
the Wall and there are three consecutive red ACC bars<br />
(including the current bar) then move up to the Tripwire.<br />
When the next set of three reds occurs, move up to the<br />
Fence, and so on until stopped out.<br />
5. If the current ACC histogram bar crosses the zero line<br />
from positive to negative, move immediately to the<br />
3SMA Safety Line and follow it.<br />
6. Other than on entry day, if the 3SMA Safety Line<br />
crosses the Fence, and the value of the Fence is<br />
greater than the value of the 3SMA Safety Line, move<br />
to and follow the 3SMA Safety Line as your stop loss.<br />
1. Set initial stop at the HIGHER of either<br />
• the highest high of last three price bars (including the<br />
signal bar), or<br />
• the value of the highest Stability Line.<br />
• If the high of the entry-day bar is higher than the<br />
highest Stability Line, stay with initial stop until the high<br />
of the previous bar is lower than highest Stability Line,<br />
then go to Rule #3. If the high of the entry-day bar is<br />
lower than the highest Stability Line go to Rule #3.<br />
2. Depending on your trading style, risk tolerance, and<br />
money management practices,<br />
• For an aggressive approach, if the Wall (blue line) is<br />
the highest Stability Line, follow the Wall; otherwise,<br />
follow the highest Stability Line until it crosses the Wall,<br />
then follow the Wall.<br />
• For a less aggressive approach, if the Tripwire (red<br />
line) is the highest Stability Line, follow the Tripwire;<br />
otherwise follow the highest Stability Line until it<br />
crosses the Tripwire, then follow the Tripwire.<br />
• For a conservative approach, if the Fence (green line)<br />
is the highest Stability Line, follow the Fence; otherwise<br />
follow the highest Stability Line until it crosses the<br />
Fence, then follow the Fence.<br />
3. If the ACC is less than zero, follow rule #3 above.<br />
4. If the ACC is below zero and three consecutive green<br />
ACC bars (including the current bar) have occurred,<br />
move down one Stability Line for each set of three<br />
green ACC bars. For example, if you are currently<br />
following the Wall and there are three consecutive<br />
green ACC bars (including the current bar) then move<br />
down to the Tripwire. When the next set of three greens<br />
occurs, move down to the Fence, and so on until<br />
stopped out.<br />
5. If the current ACC histogram bar crosses the zero line<br />
from negative to positive, move immediately to the<br />
3SMA Safety Line and follow it.<br />
6. Other than on entry day, if the 3SMA Safety Line<br />
crosses the Fence, and the value of the Fence is less<br />
than the value of the 3SMA Safety Line, move to and<br />
follow the 3SMA Safety Line as your stop loss.
171