Landmark Analysis Software Review - Frontiers in Zoology
Landmark Analysis Software Review - Frontiers in Zoology
Landmark Analysis Software Review - Frontiers in Zoology

Create successful ePaper yourself
Turn your PDF publications into a flip-book with our unique Google optimized e-Paper software.
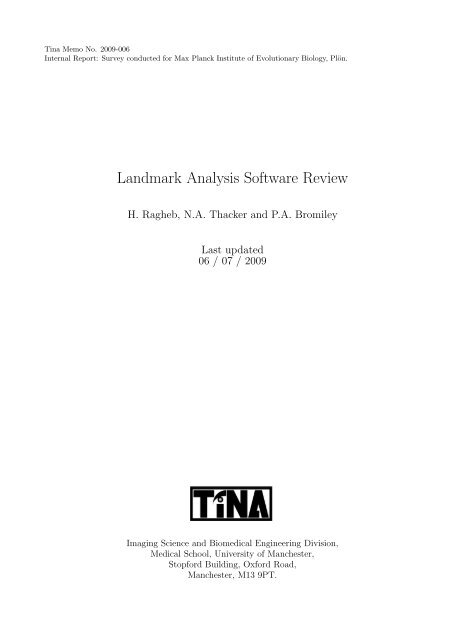
T<strong>in</strong>a Memo No. 2009-006<br />
Internal Report: Survey conducted for Max Planck Institute of Evolutionary Biology, Plön.<br />
<strong>Landmark</strong> <strong>Analysis</strong> <strong>Software</strong> <strong>Review</strong><br />
H. Ragheb, N.A. Thacker and P.A. Bromiley<br />
Last updated<br />
06 / 07 / 2009<br />
Imag<strong>in</strong>g Science and Biomedical Eng<strong>in</strong>eer<strong>in</strong>g Division,<br />
Medical School, University of Manchester,<br />
Stopford Build<strong>in</strong>g, Oxford Road,<br />
Manchester, M13 9PT.
<strong>Landmark</strong> <strong>Analysis</strong> <strong>Software</strong> <strong>Review</strong><br />
H. Ragheb, N.A. Thacker and P.A. Bromiley<br />
Imag<strong>in</strong>g Science and Biomedical Eng<strong>in</strong>eer<strong>in</strong>g Division<br />
Medical School, University of Manchester<br />
Manchester, M13 9PT, UK<br />
neil.thacker@manchester.ac.uk<br />
Abstract<br />
We have studied a number of software tools deal<strong>in</strong>g ma<strong>in</strong>ly with morphometric analysis of images<br />
reccommended by our collaborators 1 . The study not only helps us to be aware of the exist<strong>in</strong>g tools<br />
<strong>in</strong> the field, but also po<strong>in</strong>ts the way towards develop<strong>in</strong>g our own software. The aim is to cover the<br />
project’s requirements based on use <strong>in</strong> scientific analyses.<br />
1 Introduction<br />
There are a variety of image process<strong>in</strong>g software packages which are used <strong>in</strong> the fields of medical and biomedical<br />
imag<strong>in</strong>g. However, the problem with most of them is that they are not based on quantitative analysis. In some<br />
cases, they have graphical tools which are <strong>in</strong>cluded ma<strong>in</strong>ly to make their list of features longer and sell well rather<br />
than tackl<strong>in</strong>g problems of general utility. In this paper we def<strong>in</strong>e criteria of <strong>in</strong>terest <strong>in</strong> order to compare a number<br />
of software packages which are recommended <strong>in</strong> the field. Detailed <strong>in</strong>formation regard<strong>in</strong>g usage are available from<br />
the references provided [5, 2, 4, 7, 1, 9] and from the software manuals. Our ma<strong>in</strong> goal here is to <strong>in</strong>vestigate<br />
whether or not any of these software could be used <strong>in</strong> the context of an automated 3D landmark detection system.<br />
The criteria used to assess this software are as follows.<br />
• 3D visualisation tools<br />
• 3D mark up tools<br />
• Statistical landmark analysis tools<br />
• W<strong>in</strong>dows/L<strong>in</strong>ux based<br />
• Commercial (cost - transparency)<br />
Among these criteria, the top three identify necessary stages <strong>in</strong> landmark identification and analysis, while the<br />
choice of operat<strong>in</strong>g system or the commercial orig<strong>in</strong> of software are of less direct <strong>in</strong>terest. We specify them for a<br />
number of practical reasons, for example W<strong>in</strong>dows based software is difficult to use as part of an otherwise (L<strong>in</strong>ux<br />
based) open source distribution. As full <strong>in</strong>tegration between W<strong>in</strong>dows and L<strong>in</strong>us software is impossible, the only<br />
way to comb<strong>in</strong>e such software is if their <strong>in</strong>put and output formats are compatible. The problem with the commercial<br />
software is that they are not only often expensive (particularly when a variety of tools are bundled together), but<br />
also not computationally transparent (h<strong>in</strong>der<strong>in</strong>g scientific uses). L<strong>in</strong>ux based software can be provided to W<strong>in</strong>dows<br />
users via KNOPPIX, which our group has some expertise with.<br />
2 <strong>Software</strong> Studied<br />
The software under our study are as follows.<br />
• <strong>Landmark</strong><br />
• etdips<br />
• Amira<br />
1 Chris K<strong>in</strong>genberg and the Max Planck Institute of Evolutionary Biology (Plön).
• Analyze<br />
• edgewarp<br />
• EVAN<br />
Below we provide some sample screen-shots together with a short description of each software package. The aim<br />
is to generate a specification for our own analysis software cha<strong>in</strong>, which maximises utility with<strong>in</strong> the context of<br />
exist<strong>in</strong>g packages.<br />
2.1 <strong>Landmark</strong><br />
The goal of <strong>Landmark</strong> is to put landmark po<strong>in</strong>ts on surfaces and to match landmark po<strong>in</strong>ts on different surfaces<br />
to each other [9, 10]. It facilitates to quick and easy placement of landmarks on many surfaces us<strong>in</strong>g an atlas. Its<br />
typical <strong>in</strong>puts are 3D polygonal surfaces (.ply/.stl) with landmark po<strong>in</strong>ts as outputs. The ma<strong>in</strong> idea is to use the<br />
3D morph<strong>in</strong>g tool of the software <strong>in</strong> order to study how different 3D objects (ma<strong>in</strong>ly skulls) vary either through<br />
time or among different regions. See figures 1 -4.<br />
2.2 etdips<br />
Etdips is an exploratory two and three dimensional image process<strong>in</strong>g system [7, 8]. The software was co-developed<br />
by the National Institutes of Health (NIH) and the National University of S<strong>in</strong>gapore (NUS) under CRADA. This<br />
is a multi-dimensional volume visualisation and analysis software package. Specifically, it supports DICOM file<br />
format as <strong>in</strong>put, and, <strong>in</strong> addition to mark up po<strong>in</strong>ts, one may output 3D surface file format (.stl). The 3D surface<br />
is the outcome of the volume render<strong>in</strong>g tool. This 3D surface may be used as <strong>in</strong>put to the <strong>Landmark</strong> software<br />
too. Moreover, its <strong>in</strong>puts and outputs are compatible to those <strong>in</strong> Analyze software. See figures 5-6. One practical<br />
problem identified with this software is that it seems <strong>in</strong>capable of deal<strong>in</strong>g with data-sets with the dimensions<br />
required for the mouse skull project.<br />
2.3 Amira<br />
Amira is a powerful, multifaceted software platform for visualis<strong>in</strong>g, manipulat<strong>in</strong>g, and understand<strong>in</strong>g life science<br />
and biomedical data com<strong>in</strong>g from all types of sources and modalities [1]. A long list of its features are given <strong>in</strong><br />
the figures. Despite its coverage of many graphical tools, Amira does not add much to what the two free software,<br />
<strong>Landmark</strong> and etdips, can do for us. This therefore raises questions relat<strong>in</strong>g to its cost. See figures 7-12. Use of<br />
this package for manual landmark generation has identified several limitations with the <strong>in</strong>terface which make it’s<br />
application time consum<strong>in</strong>g and restrictive. For example, iso-surface construction is often fragmented on micro-CT<br />
data, the surface <strong>in</strong>tersection process for plac<strong>in</strong>g of landmarks is awkward, and there is no mechanism to check or<br />
correct the order<strong>in</strong>g of landmark features.<br />
2.4 Analyze<br />
Analyze provides <strong>in</strong>teractive display, manipulation, and measurement of multi-dimensional biomedical images (CT,<br />
MRI, SPECT, PET, ultrasound and digital microscopy). It benefits from a powerful software architecture that<br />
allows multiple volume images to be simultaneously accessed and processed by multiple programs <strong>in</strong> a multi-w<strong>in</strong>dow<br />
<strong>in</strong>terface [4]. Specifically, it is entirely built upon a toolkit of optimised functions that are organised <strong>in</strong>to a software<br />
development library called AVW. The AVW library is a collection of over 600 functions that are accessible to<br />
software developers to build advanced image-based application solutions. It provides full DICOM support, direct<br />
comparison of two volume images and associate object maps, volume render<strong>in</strong>g, 3D voxel and surface registration,<br />
and measurement modules. Despite provid<strong>in</strong>g all these features, <strong>in</strong> practice, it has failed to meet the researchers<br />
requirements at the university of Manchester. Indeed much research at Manchester over the last decade was aimed<br />
at solv<strong>in</strong>g problems <strong>in</strong>herent to the approaches taken to quantitative analysis <strong>in</strong> this package. See figures 13-21.<br />
2.5 Edgewarp<br />
Edgewarp is a package for visualisation and digitisation of solid images [2, 3]. It implements a variety of spl<strong>in</strong>e<br />
based morphometric techniques, <strong>in</strong>clud<strong>in</strong>g slid<strong>in</strong>g landmarks on curves and surfaces navigation of multiple images<br />
3
at the same time. It provides very fast navigations of volumes and has been used as part of the software be<strong>in</strong>g<br />
developed by EVAN [5]. What is disappo<strong>in</strong>t<strong>in</strong>g is that it provides no multivariate statistical procedures beyond<br />
the simplest form of landmark-driven shape averag<strong>in</strong>g, the Procrustes average. See figures 22-27.<br />
2.6 EVAN<br />
EVAN is an ongo<strong>in</strong>g project which is scheduled to end <strong>in</strong> 2009 [5, 6]. Hence, its f<strong>in</strong>al software tools which are<br />
based on similar methods used <strong>in</strong> Edgewarp are not f<strong>in</strong>alised (or available). The projects’ mission is the <strong>in</strong>tegration<br />
of new morphological analysis methods from bio-mathematics, computer science and bioeng<strong>in</strong>eer<strong>in</strong>g <strong>in</strong> the context<br />
of <strong>in</strong>terdiscipl<strong>in</strong>ary studies of anatomical variability <strong>in</strong> humans, their ancestors, and their close relatives for the<br />
purpose of applications <strong>in</strong> the academic, cl<strong>in</strong>ical, <strong>in</strong>dustrial, and, private and public research sectors. Some new<br />
methods are <strong>in</strong>tegrated <strong>in</strong> a network with a rich <strong>in</strong>frastructure from medical imag<strong>in</strong>g, 3D-digitisation, visualisation,<br />
software programm<strong>in</strong>g and modell<strong>in</strong>g to <strong>in</strong>terl<strong>in</strong>k a new generation of scientists from diverse discipl<strong>in</strong>es with<br />
<strong>in</strong>dustrial partners and cl<strong>in</strong>ics. The ma<strong>in</strong> research goals are: 1. generation of methods, tools and data <strong>in</strong>clud<strong>in</strong>g<br />
a) methodological <strong>in</strong>tegration and extension (toolboxes for Virtual Anthropology, Geometric Morphometrics and<br />
Rapid Prototyp<strong>in</strong>g, extended methods for size-shap<strong>in</strong>g analysis), and b) data archiv<strong>in</strong>g, and, 2. generation of<br />
applications <strong>in</strong> biology, medic<strong>in</strong>e and <strong>in</strong>dustry. See figures 28-30.<br />
3 Summary<br />
In Table 1 we show how each package (listed <strong>in</strong> the left-most column) does (Y) or does not (N) correspond to the<br />
criteria listed on the top row of the table. Apparently, Edgewarp and EVAN seem to be the ones fall<strong>in</strong>g well <strong>in</strong><br />
our criteria and might be expected to be the most promis<strong>in</strong>g. The situation is slightly more complicated than this<br />
as will be expla<strong>in</strong>ed below.<br />
software 3D Graphics 3D mark up statistical analysis L<strong>in</strong>ux-based non-commercial<br />
<strong>Landmark</strong> Y Y Y N Y<br />
etdips Y Y Y N Y<br />
Amira Y Y Y Y N<br />
Analyze Y N Y Y N<br />
Edgewarp Y Y Y Y Y<br />
EVAN Y Y Y Y Y<br />
Table 1: A comparison between the capabilities and features of the software under study; Y (Yes); N (No).<br />
4 Conclusions<br />
From our <strong>in</strong>vestigation we have come to several conclusions. These are listed here briefly.<br />
• DICOM images seem to be the standard image format for this work, Etdips takes DICOM, our software<br />
should also support this.<br />
• The use of W<strong>in</strong>dows as the base system precludes direct use of the Etdips package on this project. Additional<br />
problems have been encountered with current versions regard<strong>in</strong>g data size.<br />
• Exit<strong>in</strong>g software produce 3D landmark po<strong>in</strong>ts together with a 3D representation of the volume as .stl file. This<br />
seems to be standard. One may use these .stl files as <strong>in</strong>put to <strong>Landmark</strong> to apply mark-up/morphometric<br />
tools. We must consider do<strong>in</strong>g the same, should surface extraction become a necessity dur<strong>in</strong>g any stage of<br />
analysis (currently we believe there are good reasons to avoid this).<br />
• Amira might cover many functionalities but it is not only expensive but not directly relevant to landmark<br />
analysis. Previous experience with this package has shown it to be cumbersome for manual mark-up. Standard<br />
features of the data (where bone is th<strong>in</strong>) cause display problems.<br />
• Analyze is not as comprehensive as Amira and does not have mark up tools. Moreover <strong>in</strong> practice it failed<br />
to satisfy researchers at the University of Manchester on technical grounds (such as the treatment of partial<br />
volume data).<br />
4
• If Edgewarp were actually to f<strong>in</strong>d a reliable full non-l<strong>in</strong>ear warp between two 3D volumes it would provide<br />
an alternative solution to the problem of 3D feature location. We see the purpose of the current project as<br />
to f<strong>in</strong>d a more direct solution for the identification of key po<strong>in</strong>ts.<br />
• Edgewarp is an open-source software and is used <strong>in</strong> EVAN. Ideally we need to know the format used to pass<br />
landmarks between these packages, and support it <strong>in</strong> our work. As the software project has not yet delivered<br />
we must rema<strong>in</strong> aware of developments.<br />
As there seem reasons <strong>in</strong> each case why we cannot make use of the exist<strong>in</strong>g packages directly we will <strong>in</strong>stead<br />
aim for data compatibility. We can also learn from the exist<strong>in</strong>g packages with regard to graphical utility while<br />
develop<strong>in</strong>g our own tools for manual and automatic mark-up of landmarks. In this respect, we believe that a<br />
package with similar capabilities to Etdips but for L<strong>in</strong>ux will be required. A display utilis<strong>in</strong>g volume render<strong>in</strong>g<br />
rather than surface render<strong>in</strong>g might be more reliable for f<strong>in</strong>e structures. We can also attempt to avoid the user<br />
<strong>in</strong>terface restrictions found <strong>in</strong> Amira. We have started to <strong>in</strong>vestigate the possibilities.<br />
With regard to analysis, we expect that 3D landmark locations generated by the automatic detection methods will<br />
be output to exist<strong>in</strong>g statistical analysis packages (such as MORPHOJ). However, we note that the Procrustes<br />
method, and Bookste<strong>in</strong>’s equivalent techniques, currently fail to account for anisotropic measurement errors. The<br />
standard justification for this is that these errors are small <strong>in</strong> comparison to biological variability and can therefore<br />
be neglected [11]. While this argument is true for classification, it is not true for the process of parameter<br />
estimation, as can be witnessed with the difficulties encountered with poorly localised landmarks. Here, the<br />
standard method <strong>in</strong> morphometry for tak<strong>in</strong>g account of poorly constra<strong>in</strong>ed features seems to be based on the use<br />
of semi-landmarks, which move around curves (and quantify position <strong>in</strong> only one direction). For this project we<br />
<strong>in</strong>tend to provide automatically measured landmarks with associated measurement co-variances. This provides an<br />
appropriate mathematical framework for handl<strong>in</strong>g arbitrary po<strong>in</strong>ts def<strong>in</strong>ed as landmarks by users. Although we<br />
would regard this approach to be conventional use of Likelihood, this may require the development and evaluation<br />
of some statistical analysis methods new to the area of morphometry (Appendix). We expect to evaluate this<br />
approach dur<strong>in</strong>g this project.<br />
References<br />
[1] Amira, http://www.amiravis.com/<strong>in</strong>dex.html<br />
[2] Edgewarp, http://bra<strong>in</strong>map.stat.wash<strong>in</strong>gton.edu/edgewarp/<br />
[3] F Bookste<strong>in</strong>, P Gunz, H Ingeborg, P Mitteroecker, H Pross<strong>in</strong>ger, K Schaefer, C Unteregger, B Wimmer, and<br />
H Seidler, Us<strong>in</strong>g s<strong>in</strong>gular warps to study morphological <strong>in</strong>tegration, AMERICAN JOURNAL OF PHYSICAL<br />
ANTHROPOLOGY (Suppl. 34): 46-47, 2002.<br />
[4] Analyze, http://www.analyzedirect.com/default.asp<br />
[5] EVAN, http://www.evan.at/<br />
[6] S. Kat<strong>in</strong>a, Shape analysis <strong>in</strong> the light of simplicial depth estimators, In S. Barber, P.D. Baxter and K.V.Mardia<br />
(eds), Systems Biology and Statistical Bio<strong>in</strong>formatics, pp. 51-54, 2007, Leeds, Leeds University Press.<br />
[7] etdips, http://www.cc.nih.gov/cip/software/etdips/<strong>in</strong>dex.html<br />
[8] R. Mullick, S. V. Warusavithana, V. Shal<strong>in</strong>i, and P. Pang, Plug-Ins: A <strong>Software</strong> Model for Biomedical Imag<strong>in</strong>g<br />
and Visualization Research, Biomedical Imag<strong>in</strong>g Symposium: Visualiz<strong>in</strong>g the Future of Biology and Medic<strong>in</strong>e,<br />
National Institutes of Health (NIH), June 1999.<br />
[9] <strong>Landmark</strong>, http://www.idav.ucdavis.edu/research/EvoMorph<br />
[10] David F. Wiley, N<strong>in</strong>a Amenta, Dan A. Alcantara, Deboshmita Ghosh, Yong J Kil, Eric Delson, Will Harcourt-<br />
Smith, F. James Rohlf, Kather<strong>in</strong>e St. John, Bernd Hamann, Evolutionary Morph<strong>in</strong>g, <strong>in</strong>: Proceed<strong>in</strong>gs of IEEE<br />
Visualization, 2005.<br />
[11] Ian L. Dryden and Kanti V. Mardia, Statistical Shape <strong>Analysis</strong>, John Wiley and Sons, 1998.<br />
5
Appendix: Procrustes and Likelihood Shape Descriptions.<br />
The Procrustes method for shape analysis <strong>in</strong>volves f<strong>in</strong>d<strong>in</strong>g the scale sk, rotation Rk and translation tk of a complex<br />
shape vector wk us<strong>in</strong>g a least squares approach which m<strong>in</strong>imises;<br />
Q = <br />
(m0 − mk) T (m0 − mk)<br />
with<br />
and<br />
k<br />
m0 = 1<br />
K<br />
K<br />
k<br />
mk<br />
mk = skRkwk + tk<br />
<strong>in</strong>dividual shapes can then be approximated as a l<strong>in</strong>ear model of eigen-vector ej.<br />
mk ≈ skm0 +<br />
where λjk are l<strong>in</strong>ear constants, and the l<strong>in</strong>ear shape descriptors are normally esitmated for the space tangent to<br />
m0 us<strong>in</strong>g PCA, or someth<strong>in</strong>g equivalent.<br />
The scale factor can be elim<strong>in</strong>ated if the analysis task is required to be sensitive to specific processes (eg: biological<br />
growth). In this case the most significant eigen-vectors might be expected to describe the scal<strong>in</strong>g process.<br />
The simplest justification for this approach is to assume an isotropic distribution for the variation <strong>in</strong> mk. However,<br />
we might well have some features which are poorly localised <strong>in</strong> one dimension. Also, by us<strong>in</strong>g m0 as the target<br />
shape for alignment we cannot expect to obta<strong>in</strong> a good transformation. The resultant errors <strong>in</strong> rotation lock<br />
correlations <strong>in</strong>to the resultant residuals for each mk. Consequently, if the data had been generated by a l<strong>in</strong>ear<br />
model we would not expect to regenerate the parameters of that model from this analysis.<br />
Tak<strong>in</strong>g acount of the data mak<strong>in</strong>g use of the measurement distribution and construct<strong>in</strong>g a self consistent model<br />
description is more complicated and only tractable if we can assume a common covariance structure C for all mk.<br />
This is likely to be a good approximation, as the localisation error for each landmark is expected to be a function<br />
of local structure, which might be expected to be consistent across a group of shape samples.<br />
Then, the eigen-vector analysis can be carried out <strong>in</strong> a ‘whitened’ tangent sub-space of the rotated data<br />
<strong>in</strong> order to satisfy PCA’s requirements of IID.<br />
A Likelihood based approach can be written as follows;<br />
log(P) =<br />
J<br />
j<br />
λjkej<br />
uk = W(mk − skm0)<br />
K<br />
k<br />
(xk − mk) T C −1 (xk − mk)<br />
ie: the target for alignment is the model generated shape xk rather than the mean.<br />
xk = m0 + W −1<br />
where W is a whiten<strong>in</strong>g matrix which follows from the measurement covariance C. The effects of the common<br />
data covariance cancel when tak<strong>in</strong>g the weighted mean so as before<br />
m0 =<br />
K<br />
mkC −1 [ <br />
k<br />
k<br />
J<br />
j<br />
λjkej<br />
C −1 ] −1 = 1<br />
K<br />
Alternatively, by sett<strong>in</strong>g the first eigen-vector to the mean we will get an equivalent mathematical description of<br />
the data (ie: the subspace def<strong>in</strong>ed by the set of eigen-vectors will be equivalent for a good model).<br />
These equations are only true at the solution, so optimisation of the Likelihood needs to be iterative, and designed<br />
to exploit the convergence properties of expectation maximisation ie: optimisation of the Likelihood with a fixed<br />
6<br />
K<br />
k<br />
mk
distribution assumption, and re-estimation this distribution with fixed parameters. This method would proceed<br />
by <strong>in</strong>itialis<strong>in</strong>g the scale, orientation and location of each k, and estimat<strong>in</strong>g the eigenvectors which establish the<br />
current estimate of data density. The process could then be iterated follow<strong>in</strong>g re-estimation of the transformations.<br />
As this analysis can be <strong>in</strong>terpreted as perform<strong>in</strong>g a Procrustes analysis <strong>in</strong> a whitened data space, all previous<br />
theoretical results perta<strong>in</strong><strong>in</strong>g to the use of this method which are limited to an assumption of homogenous covariance<br />
should now apply. Notice also that we are bas<strong>in</strong>g the new Likelihood formulation on the measurement distribution<br />
(which is known), and not upon the distribution <strong>in</strong>duced <strong>in</strong> the sample due to shape variability (which is arbitrary<br />
and the subject of our analysis).<br />
In order to monitor the progress for the entire analysis, we can compute an estimate of the measurement covariance<br />
Ĉ.<br />
Ĉ = 1 <br />
(xk − mk)(xk − mk)<br />
K<br />
T<br />
k<br />
For a good model (eg: a sufficient number of eigen-vectors J) Ĉ ≈ C. For a poor model Ĉ >> C. We<br />
can make this observation more quantitative by assess<strong>in</strong>g the capability of the model to account for the orig<strong>in</strong>al<br />
data distribution us<strong>in</strong>g probability overlaps, specifically analysis of the distribution of residuals us<strong>in</strong>g Bhattacharrya<br />
fitt<strong>in</strong>g. In this way we could expect to determ<strong>in</strong>e the optimal l<strong>in</strong>ear model order as part of the process of parameter<br />
estimation.<br />
Clearly, as the generated model will be driven by measurement considerations and choice of landmarks, the (possibly<br />
degenerate) eigen-vectors extracted dur<strong>in</strong>g this analysis will have no use beyond describ<strong>in</strong>g the subspace of a specific<br />
data sample. Quantitative scientific use of the results, which require a conclusion without reference to shape, are<br />
limited to mak<strong>in</strong>g statements regard<strong>in</strong>g equivalence of distributions (ie: object recognition). This too is one sided,<br />
as absence of measured difference is not evidence of absence of genetic difference.<br />
7
Figure 1: <strong>Landmark</strong>: mark up tool<br />
Figure 2: <strong>Landmark</strong>: semi-automatic mark up tool<br />
Figure 3: <strong>Landmark</strong>: group<strong>in</strong>g landmarks tool<br />
Figure 4: <strong>Landmark</strong>: morph<strong>in</strong>g tool<br />
8
Figure 5: etdips: mark up tool<br />
Figure 6: etdips: volume render<strong>in</strong>g tool<br />
9
Figure 7: Amira: import/export<br />
Figure 8: Amira: analyze<br />
Figure 9: Amira: present<br />
Figure 10: Amira: visualize<br />
Figure 11: Amira: process<br />
Figure 12: Amira: customize<br />
10
Figure 13: Analyze: volume render<strong>in</strong>g<br />
Figure 14: Analyze: render<strong>in</strong>g oblique sections<br />
Figure 15: Analyze: measurements<br />
Figure 16: Analyze: render<strong>in</strong>g cross sections<br />
11
Figure 17: Analyze: oblique sections <strong>in</strong> three orthogonal views<br />
Figure 18: Analyze: oblique sections <strong>in</strong> oblique views<br />
Figure 19: Analyze: bra<strong>in</strong> atlas<br />
Figure 20: Analyze: bra<strong>in</strong> atlas<br />
Figure 21: Analyze: bra<strong>in</strong> atlas<br />
12
Figure 22: Edgewarp: mark up tool<br />
Figure 23: Edgewarp: W<strong>in</strong>dow, File, <strong>Landmark</strong> and Section menus<br />
Figure 24: Edgewarp: cross sections<br />
Figure 25: Edgewarp: landmark match<strong>in</strong>g<br />
Figure 26: Edgewarp: landmarks <strong>in</strong> 3 orthogonal views<br />
Figure 27: Edgewarp: landmarks <strong>in</strong> 3 orthogonal views<br />
13
Figure 28: EVAN: mark up tool<br />
Figure 29: EVAN: volume render<strong>in</strong>g tool<br />
Figure 30: EVAN: morph<strong>in</strong>g tool<br />
14