Bayer Group - Investor-Relations
Bayer Group - Investor-Relations
Bayer Group - Investor-Relations

You also want an ePaper? Increase the reach of your titles
YUMPU automatically turns print PDFs into web optimized ePapers that Google loves.
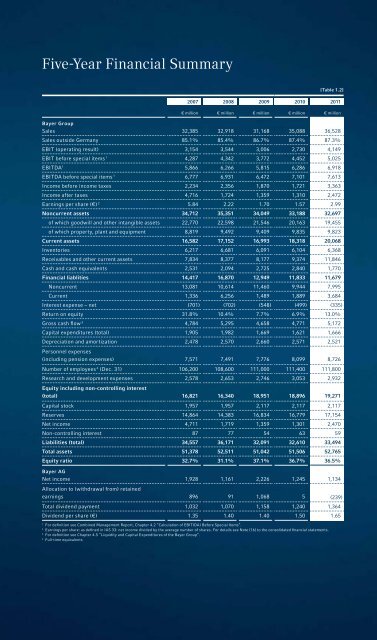
Five-Year Financial Summary<br />
[Table 1.2]<br />
2007 2008 2009 2010 2011<br />
€ million € million € million € million € million<br />
<strong>Bayer</strong> <strong>Group</strong><br />
Sales 32,385 32,918 31,168 35,088 36,528<br />
Sales outside Germany 85.1% 85.4% 86.7% 87.4% 87.3%<br />
EBIT (operating result) 3,154 3,544 3,006 2,730 4,149<br />
EBIT before special items 1 4,287 4,342 3,772 4,452 5,025<br />
EBITDA 1 5,866 6,266 5,815 6,286 6,918<br />
EBITDA before special items 1 6,777 6,931 6,472 7,101 7,613<br />
Income before income taxes 2,234 2,356 1,870 1,721 3,363<br />
Income after taxes 4,716 1,724 1,359 1,310 2,472<br />
Earnings per share (€) 2 5.84 2.22 1.70 1.57 2.99<br />
Noncurrent assets 34,712 35,351 34,049 33,188 32,697<br />
of which goodwill and other intangible assets 22,770 22,598 21,546 20,163 19,455<br />
of which property, plant and equipment 8,819 9,492 9,409 9,835 9,823<br />
Current assets 16,582 17,152 16,993 18,318 20,068<br />
Inventories 6,217 6,681 6,091 6,104 6,368<br />
Receivables and other current assets 7,834 8,377 8,177 9,374 11,846<br />
Cash and cash equivalents 2,531 2,094 2,725 2,840 1,770<br />
Financial liablities 14,417 16,870 12,949 11,833 11,679<br />
Noncurrent 13,081 10,614 11,460 9,944 7,995<br />
Current 1,336 6,256 1,489 1,889 3,684<br />
Interest expense – net (701) (702) (548) (499) (335)<br />
Return on equity 31.8% 10.4% 7.7% 6.9% 13.0%<br />
Gross cash fl ow 3 4,784 5,295 4,658 4,771 5,172<br />
Capital expenditures (total) 1,905 1,982 1,669 1,621 1,666<br />
Depreciation and amortization 2,478 2,570 2,660 2,571 2,521<br />
Personnel expenses<br />
(including pension expenses) 7,571 7,491 7,776 8,099 8,726<br />
Number of employees 4 (Dec. 31) 106,200 108,600 111,000 111,400 111,800<br />
Research and development expenses<br />
Equity including non-controlling interest<br />
2,578 2,653 2,746 3,053 2,932<br />
(total) 16,821 16,340 18,951 18,896 19,271<br />
Capital stock 1,957 1,957 2,117 2,117 2,117<br />
Reserves 14,864 14,383 16,834 16,779 17,154<br />
Net income 4,711 1,719 1,359 1,301 2,470<br />
Non-controlling interest 87 77 54 63 59<br />
Liabilities (total) 34,557 36,171 32,091 32,610 33,494<br />
Total assets 51,378 52,511 51,042 51,506 52,765<br />
Equity ratio 32.7% 31.1% 37.1% 36.7% 36.5%<br />
<strong>Bayer</strong> AG<br />
Net income<br />
Allocation to (withdrawal from) retained<br />
1,928 1,161 2,226 1,245 1,134<br />
earnings 896 91 1,068 5 (239)<br />
Total dividend payment 1,032 1,070 1,158 1,240 1,364<br />
Dividend per share (€) 1.35 1.40 1.40 1.50 1.65<br />
1 For defi nition see Combined Management Report, Chapter 4.2 “Calculation of EBIT(DA) Before Special Items”.<br />
2 Earnings per share: as defi ned in IAS 33: net income divided by the average number of shares. For details see Note [16] to the consolidated fi nancial statements.<br />
3 For defi nition see Chapter 4.5 “Liquidity and Capital Expenditures of the <strong>Bayer</strong> <strong>Group</strong>”.<br />
4 Full-time equivalents