National Survey of Vacancies in the Private (Non ... - Forfás
National Survey of Vacancies in the Private (Non ... - Forfás
National Survey of Vacancies in the Private (Non ... - Forfás

You also want an ePaper? Increase the reach of your titles
YUMPU automatically turns print PDFs into web optimized ePapers that Google loves.
INCIDENCE AND LEVELS OF CURRENT VACANCIES 29<br />
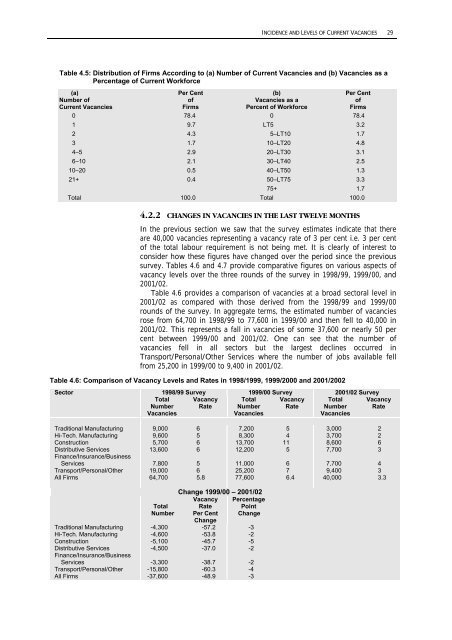
Table 4.5: Distribution <strong>of</strong> Firms Accord<strong>in</strong>g to (a) Number <strong>of</strong> Current <strong>Vacancies</strong> and (b) <strong>Vacancies</strong> as a<br />
Percentage <strong>of</strong> Current Workforce<br />
(a)<br />
Number <strong>of</strong><br />
Current <strong>Vacancies</strong><br />
Per Cent<br />
<strong>of</strong><br />
Firms<br />
(b)<br />
<strong>Vacancies</strong> as a<br />
Percent <strong>of</strong> Workforce<br />
Per Cent<br />
<strong>of</strong><br />
Firms<br />
0 78.4 0 78.4<br />
1 9.7 LT5 3.2<br />
2 4.3 5–LT10 1.7<br />
3 1.7 10–LT20 4.8<br />
4–5 2.9 20–LT30 3.1<br />
6–10 2.1 30–LT40 2.5<br />
10–20 0.5 40–LT50 1.3<br />
21+ 0.4 50–LT75 3.3<br />
75+ 1.7<br />
Total 100.0 Total 100.0<br />
4.2.2 CHANGES IN VACANCIES IN THE LAST TWELVE MONTHS<br />
In <strong>the</strong> previous section we saw that <strong>the</strong> survey estimates <strong>in</strong>dicate that <strong>the</strong>re<br />
are 40,000 vacancies represent<strong>in</strong>g a vacancy rate <strong>of</strong> 3 per cent i.e. 3 per cent<br />
<strong>of</strong> <strong>the</strong> total labour requirement is not be<strong>in</strong>g met. It is clearly <strong>of</strong> <strong>in</strong>terest to<br />
consider how <strong>the</strong>se figures have changed over <strong>the</strong> period s<strong>in</strong>ce <strong>the</strong> previous<br />
survey. Tables 4.6 and 4.7 provide comparative figures on various aspects <strong>of</strong><br />
vacancy levels over <strong>the</strong> three rounds <strong>of</strong> <strong>the</strong> survey <strong>in</strong> 1998/99, 1999/00, and<br />
2001/02.<br />
Table 4.6 provides a comparison <strong>of</strong> vacancies at a broad sectoral level <strong>in</strong><br />
2001/02 as compared with those derived from <strong>the</strong> 1998/99 and 1999/00<br />
rounds <strong>of</strong> <strong>the</strong> survey. In aggregate terms, <strong>the</strong> estimated number <strong>of</strong> vacancies<br />
rose from 64,700 <strong>in</strong> 1998/99 to 77,600 <strong>in</strong> 1999/00 and <strong>the</strong>n fell to 40,000 <strong>in</strong><br />
2001/02. This represents a fall <strong>in</strong> vacancies <strong>of</strong> some 37,600 or nearly 50 per<br />
cent between 1999/00 and 2001/02. One can see that <strong>the</strong> number <strong>of</strong><br />
vacancies fell <strong>in</strong> all sectors but <strong>the</strong> largest decl<strong>in</strong>es occurred <strong>in</strong><br />
Transport/Personal/O<strong>the</strong>r Services where <strong>the</strong> number <strong>of</strong> jobs available fell<br />
from 25,200 <strong>in</strong> 1999/00 to 9,400 <strong>in</strong> 2001/02.<br />
Table 4.6: Comparison <strong>of</strong> Vacancy Levels and Rates <strong>in</strong> 1998/1999, 1999/2000 and 2001/2002<br />
Sector 1998/99 <strong>Survey</strong> 1999/00 <strong>Survey</strong> 2001/02 <strong>Survey</strong><br />
Total<br />
Number<br />
<strong>Vacancies</strong><br />
Vacancy<br />
Rate<br />
Total<br />
Number<br />
<strong>Vacancies</strong><br />
Vacancy<br />
Rate<br />
Total<br />
Number<br />
<strong>Vacancies</strong><br />
Vacancy<br />
Rate<br />
Traditional Manufactur<strong>in</strong>g 9,000 6 7,200 5 3,000 2<br />
Hi-Tech. Manufactur<strong>in</strong>g 9,600 5 8,300 4 3,700 2<br />
Construction 5,700 6 13,700 11 8,600 6<br />
Distributive Services 13,600 6 12,200 5 7,700 3<br />
F<strong>in</strong>ance/Insurance/Bus<strong>in</strong>ess<br />
Services 7,800 5 11,000 6 7,700 4<br />
Transport/Personal/O<strong>the</strong>r 19,000 6 25,200 7 9,400 3<br />
All Firms 64,700 5.8 77,600 6.4 40,000 3.3<br />
Total<br />
Number<br />
Change 1999/00 – 2001/02<br />
Vacancy<br />
Rate<br />
Per Cent<br />
Change<br />
Percentage<br />
Po<strong>in</strong>t<br />
Change<br />
Traditional Manufactur<strong>in</strong>g -4,300 -57.2 -3<br />
Hi-Tech. Manufactur<strong>in</strong>g -4,600 -53.8 -2<br />
Construction -5,100 -45.7 -5<br />
Distributive Services -4,500 -37.0 -2<br />
F<strong>in</strong>ance/Insurance/Bus<strong>in</strong>ess<br />
Services -3,300 -38.7 -2<br />
Transport/Personal/O<strong>the</strong>r -15,800 -60.3 -4<br />
All Firms -37,600 -48.9 -3