National Survey of Vacancies in the Private (Non ... - Forfás
National Survey of Vacancies in the Private (Non ... - Forfás
National Survey of Vacancies in the Private (Non ... - Forfás

You also want an ePaper? Increase the reach of your titles
YUMPU automatically turns print PDFs into web optimized ePapers that Google loves.
INCIDENCE AND LEVELS OF CURRENT VACANCIES 33<br />
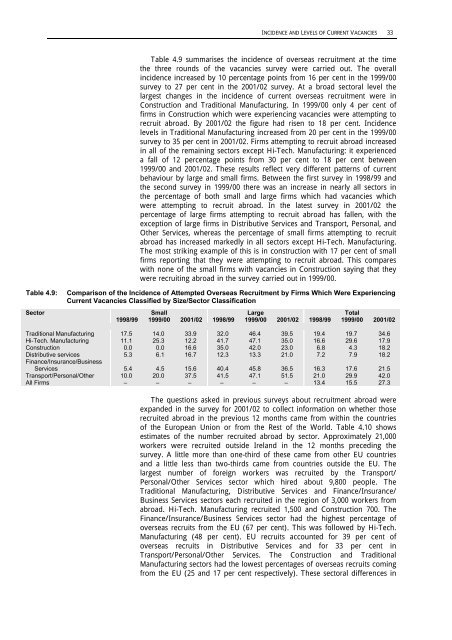
Table 4.9 summarises <strong>the</strong> <strong>in</strong>cidence <strong>of</strong> overseas recruitment at <strong>the</strong> time<br />
<strong>the</strong> three rounds <strong>of</strong> <strong>the</strong> vacancies survey were carried out. The overall<br />
<strong>in</strong>cidence <strong>in</strong>creased by 10 percentage po<strong>in</strong>ts from 16 per cent <strong>in</strong> <strong>the</strong> 1999/00<br />
survey to 27 per cent <strong>in</strong> <strong>the</strong> 2001/02 survey. At a broad sectoral level <strong>the</strong><br />
largest changes <strong>in</strong> <strong>the</strong> <strong>in</strong>cidence <strong>of</strong> current overseas recruitment were <strong>in</strong><br />
Construction and Traditional Manufactur<strong>in</strong>g. In 1999/00 only 4 per cent <strong>of</strong><br />
firms <strong>in</strong> Construction which were experienc<strong>in</strong>g vacancies were attempt<strong>in</strong>g to<br />
recruit abroad. By 2001/02 <strong>the</strong> figure had risen to 18 per cent. Incidence<br />
levels <strong>in</strong> Traditional Manufactur<strong>in</strong>g <strong>in</strong>creased from 20 per cent <strong>in</strong> <strong>the</strong> 1999/00<br />
survey to 35 per cent <strong>in</strong> 2001/02. Firms attempt<strong>in</strong>g to recruit abroad <strong>in</strong>creased<br />
<strong>in</strong> all <strong>of</strong> <strong>the</strong> rema<strong>in</strong><strong>in</strong>g sectors except Hi-Tech. Manufactur<strong>in</strong>g: it experienced<br />
a fall <strong>of</strong> 12 percentage po<strong>in</strong>ts from 30 per cent to 18 per cent between<br />
1999/00 and 2001/02. These results reflect very different patterns <strong>of</strong> current<br />
behaviour by large and small firms. Between <strong>the</strong> first survey <strong>in</strong> 1998/99 and<br />
<strong>the</strong> second survey <strong>in</strong> 1999/00 <strong>the</strong>re was an <strong>in</strong>crease <strong>in</strong> nearly all sectors <strong>in</strong><br />
<strong>the</strong> percentage <strong>of</strong> both small and large firms which had vacancies which<br />
were attempt<strong>in</strong>g to recruit abroad. In <strong>the</strong> latest survey <strong>in</strong> 2001/02 <strong>the</strong><br />
percentage <strong>of</strong> large firms attempt<strong>in</strong>g to recruit abroad has fallen, with <strong>the</strong><br />
exception <strong>of</strong> large firms <strong>in</strong> Distributive Services and Transport, Personal, and<br />
O<strong>the</strong>r Services, whereas <strong>the</strong> percentage <strong>of</strong> small firms attempt<strong>in</strong>g to recruit<br />
abroad has <strong>in</strong>creased markedly <strong>in</strong> all sectors except Hi-Tech. Manufactur<strong>in</strong>g.<br />
The most strik<strong>in</strong>g example <strong>of</strong> this is <strong>in</strong> construction with 17 per cent <strong>of</strong> small<br />
firms report<strong>in</strong>g that <strong>the</strong>y were attempt<strong>in</strong>g to recruit abroad. This compares<br />
with none <strong>of</strong> <strong>the</strong> small firms with vacancies <strong>in</strong> Construction say<strong>in</strong>g that <strong>the</strong>y<br />
were recruit<strong>in</strong>g abroad <strong>in</strong> <strong>the</strong> survey carried out <strong>in</strong> 1999/00.<br />
Table 4.9: Comparison <strong>of</strong> <strong>the</strong> Incidence <strong>of</strong> Attempted Overseas Recruitment by Firms Which Were Experienc<strong>in</strong>g<br />
Current <strong>Vacancies</strong> Classified by Size/Sector Classification<br />
Sector Small Large Total<br />
1998/99 1999/00 2001/02 1998/99 1999/00 2001/02 1998/99 1999/00 2001/02<br />
Traditional Manufactur<strong>in</strong>g 17.5 14.0 33.9 32.0 46.4 39.5 19.4 19.7 34.6<br />
Hi-Tech. Manufactur<strong>in</strong>g 11.1 25.3 12.2 41.7 47.1 35.0 16.6 29.6 17.9<br />
Construction 0.0 0.0 16.6 35.0 42.0 23.0 6.8 4.3 18.2<br />
Distributive services 5.3 6.1 16.7 12.3 13.3 21.0 7.2 7.9 18.2<br />
F<strong>in</strong>ance/Insurance/Bus<strong>in</strong>ess<br />
Services 5.4 4.5 15.6 40.4 45.8 36.5 16.3 17.6 21.5<br />
Transport/Personal/O<strong>the</strong>r 10.0 20.0 37.5 41.5 47.1 51.5 21.0 29.9 42.0<br />
All Firms – – – – – – 13.4 15.5 27.3<br />
The questions asked <strong>in</strong> previous surveys about recruitment abroad were<br />
expanded <strong>in</strong> <strong>the</strong> survey for 2001/02 to collect <strong>in</strong>formation on whe<strong>the</strong>r those<br />
recruited abroad <strong>in</strong> <strong>the</strong> previous 12 months came from with<strong>in</strong> <strong>the</strong> countries<br />
<strong>of</strong> <strong>the</strong> European Union or from <strong>the</strong> Rest <strong>of</strong> <strong>the</strong> World. Table 4.10 shows<br />
estimates <strong>of</strong> <strong>the</strong> number recruited abroad by sector. Approximately 21,000<br />
workers were recruited outside Ireland <strong>in</strong> <strong>the</strong> 12 months preced<strong>in</strong>g <strong>the</strong><br />
survey. A little more than one-third <strong>of</strong> <strong>the</strong>se came from o<strong>the</strong>r EU countries<br />
and a little less than two-thirds came from countries outside <strong>the</strong> EU. The<br />
largest number <strong>of</strong> foreign workers was recruited by <strong>the</strong> Transport/<br />
Personal/O<strong>the</strong>r Services sector which hired about 9,800 people. The<br />
Traditional Manufactur<strong>in</strong>g, Distributive Services and F<strong>in</strong>ance/Insurance/<br />
Bus<strong>in</strong>ess Services sectors each recruited <strong>in</strong> <strong>the</strong> region <strong>of</strong> 3,000 workers from<br />
abroad. Hi-Tech. Manufactur<strong>in</strong>g recruited 1,500 and Construction 700. The<br />
F<strong>in</strong>ance/Insurance/Bus<strong>in</strong>ess Services sector had <strong>the</strong> highest percentage <strong>of</strong><br />
overseas recruits from <strong>the</strong> EU (67 per cent). This was followed by Hi-Tech.<br />
Manufactur<strong>in</strong>g (48 per cent). EU recruits accounted for 39 per cent <strong>of</strong><br />
overseas recruits <strong>in</strong> Distributive Services and for 33 per cent <strong>in</strong><br />
Transport/Personal/O<strong>the</strong>r Services. The Construction and Traditional<br />
Manufactur<strong>in</strong>g sectors had <strong>the</strong> lowest percentages <strong>of</strong> overseas recruits com<strong>in</strong>g<br />
from <strong>the</strong> EU (25 and 17 per cent respectively). These sectoral differences <strong>in</strong>